Abstract
Trenched pipelines may experience significant lateral displacement due to natural geohazards such as strike slip-fault movements, landslides, etc. Using pre-excavated soil to backfill trenches is a cost-effective option to protect pipelines against large deformations. These backfilling materials are heavily remolded and therefore softer than the native ground. Therefore, the shear strength difference between the backfill and native ground may affect the pipeline–backfill–trench interaction and the failure mechanism of the surrounding soil. By assuming a simplified uniform soil domain, the influence of softer pre-excavated backfilling material on the pipeline–backfill–trench interaction is neglected in the analytical methods that are usually used in the structural health monitoring of buried pipelines. In this study, the effects of trenching and backfilling were incorporated into an analytical solution for a fast assessment of the pipeline response at the early stages of engineering design projects and structural health monitoring. In comparison with other methods, this methodology provides a convenient and efficient method for computing pipeline strain and deflection curves in geohazardous regions.
1. Introduction
Permanent ground displacement (PGD) caused by fault movement has long been considered to be one of the most significant threats to pipeline safety, serviceability, and the economic operation of buried pipelines. Therefore, structural damages to buried pipelines caused by fault activities have been a point of attention of pipeline engineers and researchers. The assessment of pipeline integrity, particularly near fault lines, requires calculation of the strains developed in the pipeline under the effect of a fault.
The analytical methods used are particularly time-efficient and helpful for the initial design, optimization studies, and structural health monitoring of pipelines exposed to fault movements. These analytical methods can be also considered as a confidence check for more complicated numerical and experimental results.
Initially, lifeline earthquake studies were developed after the San Fernando earthquake in 1971 to assess the response of pipelines to earthquakes in seismic zones [1]. Newmark and Hall (1975) established a simplified analytical model for pipelines subjected to tensile strain due to right-lateral strike-slip fault actions to study the failure mechanisms of the pipelines [2]. They calculated pipeline elongation using the small deflection theory. In this analytical model, the passive soil pressure was neglected and the elastic–plastic model was used to define the pipeline material. Kennedy (1977) extended the previous study conducted by Newmark and Hall [2], using the large deflection theory and considering the interaction effect between the pipeline and surrounding soil [3]. In this method, the entire pipeline was hypothesized to yield in the transitional region (high curvature region). The authors assumed that the pipeline would perform like a flexible cable without flexural strength in the transition zone. Vougioukas (1979) developed an analytical method that could be applied to both strike-slip and reverse fault movements [4]. In this methodological approach, the buried pipeline was considered to be elastic beams. Furthermore, the effect of axial forces on flexural stiffness has been considered. In an attempt to understand how buried gas and water pipelines were affected during the San Fernando earthquake, McCaffrey and O’Rourke (1983) investigated the performance of these pipelines [5]. Wang and Yeh (1985) improved Kennedy’s model (1977) and proposed a closed-form solution based on the elastic foundation theory to solve the pipe–soil interaction problem [6]. In their study, the effects of large axial strain and the pipe–soil lateral interaction on the bending stiffness of pipelines were considered.
In recent years, Karamitros (2007) developed an analytical method that could be applied to active normal fault-crossing problems [7]. This methodology was refined by introducing several improvements over previous methodologies. A stress–strain analysis of buried steel pipelines was performed using simple material nonlinearities and second-order influences. As a result, the beam-on-elastic-foundation and elastic beam theories were combined to calculate the pipeline’s bending moment and axial force. Vazouras et al. (2010) developed a simplified analytical formulation, in conjunction with the development of rigorous finite element models, for describing buried steel pipeline deformation under strike-slip faults [8]. A finite element model was used to investigate the pipeline–soil interaction, taking into account the inelastic behavior of the soil surrounding the pipeline, as well as the large inelastic strains of the pipeline and the special contact between the pipeline and soil. In their study, the analytical model presented the counteracting influences of bending moment and axial tension force.
More recently, Vazouras et al. (2015) extended their previous study and proposed a simplified analytical closed-form solution to describe pipeline deformation under strike-slip faults [9]. This study was a comprehensive one, consisting of both closed-form solutions and finite element modeling of pipelines affected by strike-slip fault movement. The study was started by developing a closed-form solution for the force–displacement relationship of buried pipelines exposed to tension load at both ends in cases where the pipelines have finite and infinite lengths. A refined finite element model was then developed, using the closed-form solution in the form of nonlinear springs at both ends of the pipeline, for evaluating the response of the pipeline to a strike-slip fault. Sarvanis (2017) developed an analytical method to calculate pipeline strains due to permanent ground displacements [10]. In this method, the maximum pipeline strains are calculated using the closed-form solution proposed by Vazouras et al. (2015) [9], where the assumed shape function for pipeline deflection was adopted for any kind of fault movements when pipelines are exposed to bending and tension. The length of the deformed pipeline is calculated using an equivalent static method.
Semianalytical models were developed in subsequent publications by Takada (2001), Karamitros (2007), and Trifonov and Cherniy (2010) [11,12,13]. Takada (2001) used a beam-shell hybrid model to investigate the failure mechanism of pipelines. The developed semianalytical model was able to consider the large deformation of the pipe cross-section [11]. The maximum compressive and tensile strains were computed by conducting finite element analysis and implementing the simplified equations proposed by Kennedy (1987). Karamitros (2007) modified the previous analytical methods to adapt them to a wider range of applications [12]. To measure the influence of axial strain on the pipeline curvature, they employed the equation given by Kennedy (1977). In this model, the geometrical second-order effect was taken into account considering the influence of axial force on pipeline curvature. Trifonov and Cherniy (2010) developed the analytical technique proposed by Karamitros (2007) to investigate the response of pipelines to normal faults [13]. In their modified method, the bending effect on the axial strain was considered, and there was no symmetry requirement condition to achieve different forms of fault movement mechanisms. Moreover, axial force was directly considered in the equations of motion in the transitional region.
The continuum numerical model is considered to be the most efficient method for modeling the pipe–fault crossing phenomenon and assessing the local buckling of pipelines. Vazouras et al. (2012) assessed the effects of boundary conditions on pipeline responses [14]. In this study, they investigated the behavior of pipelines with limited and unlimited lengths subjected to different tensile loads. The results showed that pipelines exhibit local strain when the fault displacement rate is low. Increasing fault displacement rates result in ovalization phenomena in the local strain spot. Demofonti et al. (2013) experimentally and numerically investigated the mechanical responses of steel pipelines subjected to a horizontal permanent ground motion under fault crossing, in order to gain a better understanding of soil and pipe interaction and calibration of numerical models for predicting strain demand in buried pipelines [15]. Zhang et al. (2015, 2016) investigated the buckling behavior of buried pipelines using the finite element method [16,17]. In their study, they found that fault displacement has a significant impact on the location of the maximum strain in buried pipelines. Additionally, as the thickness of the wall increases, the deformation curve of the buried pipeline becomes smoother.
None of the above described studies considered the effects of the different stiffnesses of backfill and native soil. Pipelines are usually buried in excavated trenches for protection against environmental loads, where pre-excavated soil is used to backfill the trench as a cost-effective method. This pre-excavated backfill material is usually heavily remolded and has a lower stiffness compared with native soil. The difference in stiffness between the backfill and native soil may affect the pipeline response in fault zones. Modeling a 3D trench pipeline using Large Deformation Finite Element (LDFE) analysis presents several challenges, including an extensive computational effort, difficulties in the simulation of ground movement, modeling the contact between the pipe, backfill, and trench wall, etc. These difficulties have caused researchers to assume a Lagrangian soil domain and compromise the accuracy of their analyses. The present work investigates the effect of trenching–backfilling on the structural response of pipelines to faults by incorporating pipeline–backfill–trench interaction effects into an analytical solution.
2. Analytical Model
In this study, the analytical model proposed by Sarvanis (2017) was used to calculate the strains induced in the pipeline due to PGD. The model was extended by incorporating the trenching–backfilling effects. The PGDs were modeled using the differential motions of the two adjacent soil blocks traversed by the pipeline at the fault crossing line. The model works based on the use of an assumed-shape function for the deformed pipeline; it is an improved version of the simple analytical model previously proposed by Vazouras (2015), which is only applicable to symmetric soil resistance [9]. Furthermore, the assumed-shape function used by Vazouras (2015) did not consider the zero-curvature criterion at the two ends of the deformed pipeline segment, and there was no systematic method for calculating the length of the deformed pipeline. It should be noted that this method might not correctly represent post-buckling pipeline configurations.
2.1. Analytical Model for Uniform Seabed
Figure 1 shows a schematic view of the model configuration, where the buried pipeline passes a ground discontinuity plane at an angle of β considering the seabed as uniform. Throughout the following text, the “discontinuity plane” will be referred to as the “fault plane” or “fault”. The primary reason for using this approach is that permanent ground deformation causes both tensile and bending deformation of the pipeline when the crossing angle is greater than ). In comparison with the ground on the left side of the fault, the ground on the right side moves parallel to the fault direction by an amount . The pipeline is subjected to bending and stretching because of the different ground motions and develops an S-shaped configuration, as depicted in Figure 1. The lengths and in this figure correspond to the lengths of the deformed S-shape of the pipeline on either side of the fault, while represents the distance between the inflection point (the point where the curvature changes sign) and the fault plane.
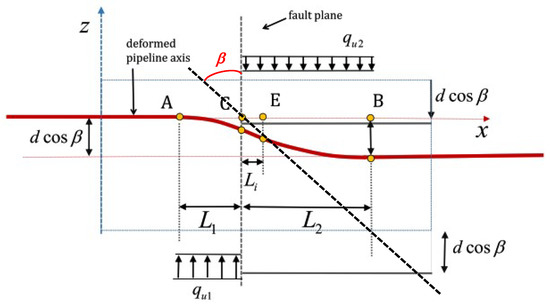
Figure 1.
Schematic shape of pipeline curvature at active fault zone [10].
As the pipeline moves in the fault zone, the pipeline deflection curve () follows the equation below:
In this equation, the normalized ground displacement is . The two ends of the deformed shape of the pipeline are located at and , respectively. The proposed shape function () can be used in both nonsymmetric and symmetric circumstances (geometry and the surrounding soil resistance) with respect to the fault. The displacement and curvature continuity criteria at the inflection point are described. The model can also describe pipeline material behavior in both the elastic and plastic regions. The boundary conditions at both ends of the S-shaped section in Figure 1 are:
The bending curvature can be easily calculated using double differentiation of Equation (1) as follows:
The bending strain () of the deformed pipeline due to the lateral displacement can be obtained using the beam bending theory and ignoring cross-sectional distortion or ovalization as follows:
Considering the maximum bending curvature, the maximum bending strain, , of the deformed pipeline can be calculated using the following equation:
In the proposed method, it is assumed that the total axial membrane strain, , is uniform in the pipeline section. The simplified axial membrane strain can be obtained by
In this equation, can be obtained by
where is Young’s modulus of the pipeline and is the pipeline’s cross-section area. is the axial stiffness of the pipeline at the outside of the S-shaped section on the pipeline. It can be obtained using the analytical methodology developed by Vazouras (2015) [9].
The membrane strain is always tensile for positive values of ; however, the bending strain can be either tensile or compressive, based on the direction of bending. The total pipeline strain is the summary of the membrane strain in Equation (7) and the bending strain in Equation (3).
As a result, the maximum tensile strain, , is computed as follows:
and the maximum compressive strain, , is
To obtain the deflection and strain curves, the existing lengths of the S-shaped section of the pipeline should be calculated (see Figure 1). In this figure, the values of , are the distributed load (the maximum soil resistance per unit length) length, and is the distance between the inflection point and the fault. These lengths can be obtained using the general elastic static model. Considering a nonsymmetric condition with respect to the fault, the length of is obtained as follows:
where is the length ratio that can be found from Figure 2 using the value of the soil resistance ratio ().
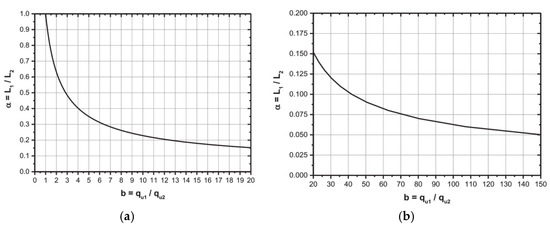
Figure 2.
Length ratio (a) diagram for values between 0 and 20, (b) diagram for values between 20 and 150 [10].
In Equation (11) the value of is obtained by
In this equation, the value can be obtained from Figure 3 based on the length ratio.
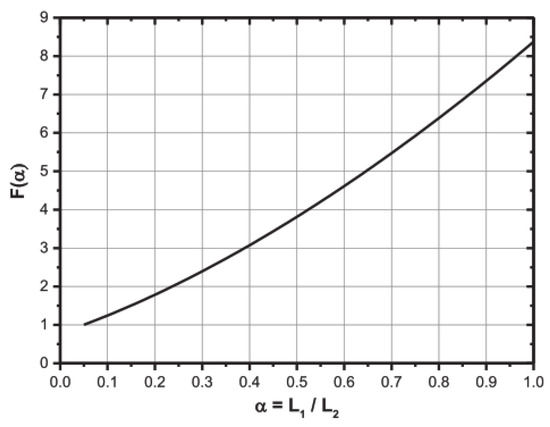
Figure 3.
curve with respect to length ratio [10].
In the proposed method, the length between the fault and inflection point is obtained from Equation (13) using static equilibrium in the moment diagram.
For a symmetric soil resistance condition, and , . Therefore, can be obtained from the following simple equation:
Finally, yield displacement in the symmetric case can be expressed as:
2.2. Incorporation of Trenching–Backfilling Effect into the Analytical Model
The majority of subsea pipelines installed under shallow water are buried in the trench as a means of protection against environmental loads. These buried pipelines may be subjected to large deformations due to permanent ground displacement (PGD). Pre-excavated soil is capable of being highly remolded when it is used as a backfilling material, due to the effects of environmental loads. The use of pre-excavated soil consequently results in a significant difference in the strength of the soil in comparison with the seabed soil. The stiffness difference effect has a significant influence on the force–displacement curves. However, due to the complexities of the pipeline–trench–backfill interaction problem, its influence on the trenched pipeline subjected to fault crossing offsets has not been investigated before. In this section, the analytical method is modified in terms of soil strength variation, to consider the effect of the pipeline–trench–backfill interaction in fault zones.
ASCE (1984) and ALA (2005) have elastoplastic soil springs for dense to loose sand and stiff to soft clay [18,19]. In practice, however, nonstandardized soils, such as intermediate and mixed soils that are not purely sand or clay, can be found. In these cases, the stress–strain properties of the soil must be used to obtain force–displacement values (p-y curves) for soil springs. In order to consider the influence of pipeline–trench–backfill interaction on the pipeline response, the p-y curves are divided into three zones (Zones 1, 2, and 3). Figure 4 schematically shows a pipeline displacement depending on relative backfill/native soil stiffness. As shown in this figure, Zones 1 and 2 are located inside the backfill soil, and Zone 3 is in the native soil. Using the maximum soil resistance at different zones and considering the symmetric conditions at both sides of the fault, the pipeline responses are extracted. The cumulative response of the pipeline at each point from the initial location point represents the axial strain distribution and the deflection curves of the pipeline.
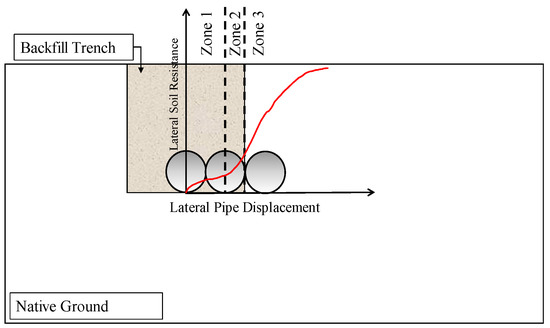
Figure 4.
The lateral response of trenched and backfill pipeline to ground displacement.
To evaluate the trenched–backfilled pipelines’ interaction effect on the axial strain and deflection curves of pipelines, the p-y curves obtained from centrifuge tests [20,21,22,23,24] were incorporated into the developed analytical methodology. The full details of the experimental studies can be found in Kianian [21]. Table 1 summarizes the details of the experiments used in this section.

Table 1.
Summary of experimental studies in clay [24].
It should be noted that the friction angles of slurry and chunk backfilling were assumed to be 0 and 36 degrees, respectively. The undrained shear strength of slurry was assumed to be . The unit weights of slurry and chunk soil were assumed to be and , respectively. The total length () of the pipeline at the large deformation part was obtained using Equation (14). The lengths and are both equal to half of the total length. Therefore, the value of is zero.
3. Results and Discussions
Several comparisons were conducted between the developed analytical methodology for trench backfilling soil and the analytical model for the native seabed. In the first step, the effect of slurry backfilling on deformation and the produced axial strain was investigated. The strike-slip fault is assumed to be crossed with the angle of 0°.
The effect of slurry backfilling soil on wide and narrow trench widths was examined in two different comparisons. The first comparison was made using the p-y curves from T1P2 and T3P1 centrifuge tests. In these cases, the trench wall was vertical, and the native soils were in partially drained conditions. The trench depth ratios for T1P2 and T3P1 were 3.9 and 2.0, respectively, and the trench width for both tests was .
The deflection and axial strain curves of a buried pipeline with wide width are presented in Figure 5. Figure 5a shows that the deflection of the pipeline decreases as the trench depth increases. The comparison shows that a pipeline buried in a deep trench has an almost 10% smaller value of u(x) compared with a pipeline buried in shallow seabed soil. Therefore, when a pipeline is buried in the trench, the distance between the wrinkles increases. The effect of trench depth ratio on the distributed axial strain is presented in Figure 5b. It shows that the axial strain of the pipeline will generally decrease with the presence of trenches and backfill soil, regardless of the depth of the trench.
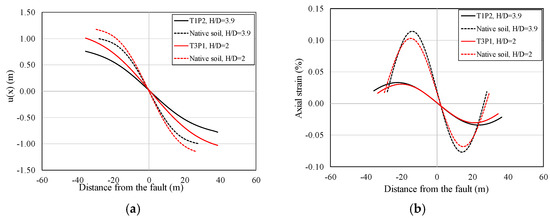
Figure 5.
Comparison between the developed analytical model for the trenched pipeline and the analytical model for uniform seabed soil, T1P2 and T3P1 (β = 0°): (a) deformed pipeline shape, (b) distribution of axial strains along the pipeline.
The comparison of the axial strain curves of trenched pipelines shows that the axial strain of the deep depth trenched pipeline in the slurry is 27% smaller than that of the pipeline trenched in the shallow depth, while this value is 22% for a pipeline buried in the seabed. Additionally, as shown in this figure, the location of the maximum axial strain does not change significantly as the burial depth increases. However, when the pipeline is buried inside a trench, the location changes remarkably compared with the pipeline buried in the native seabed soil.
Figure 6 represents a second comparison of the responses of a pipeline buried in slurry trench soil. In this comparison, the p-y curves of T4P1 and T5P1 were used. It should be noted that in the selected case studies, the trench widths are and , the burial depth ratios are 2.0 and 4.1, respectively, and the trench wall is vertical. The native soil is in drained condition in these case studies. The results show that there is no significant change in the deflection curve of the pipeline buried in the seabed soil when the burial depth increases, because the soil shear strength at the pipeline depth is almost the same in these two case studies. In addition, the deflection curve comparison shows that the horizontal distance between wrinkles of a pipeline buried in a shallow trench (T4P1) is around 18% greater than that of a pipeline buried at a deep depth (T5P1). However, the vertical distance between the wrinkles is around 7% smaller (see Figure 6a). Figure 6b shows the distributed axial strain on the pipeline. This figure illustrates that using a trench with softer backfilling soil decreases the axial strain. It also shows that in the trench with wider width (T4P1), the axial strain curve is smoother than that of the buried pipeline with narrow width (T5P1). The maximum axial strain of the buried pipeline in the T5P1 test is much more than that of T4P1 (around 50%) because it reaches the native soil earlier than T4P1. Additionally, the soil weight on the pipeline for T5P1 is greater than that of T4P1 due to the burial depth ratio. This figure again shows that the maximum axial strain’s location does not change much as the burial depth increases. However, the comparison of solid lines that represent the trenched pipelines’ axial strains shows that the location of the maximum axial strain changes significantly as the trench depth is increased. It should be noted that the trench width of T4P1 is wider than that of T5P1. This observation demonstrates the importance of trench width in reducing the maximum axial strain and consequently increasing the distance between the maximum axial strain positions.
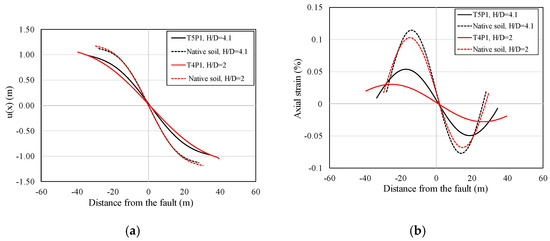
Figure 6.
Comparison between the developed analytical model for the trenched pipeline and the analytical model for uniform seabed soil, T4P1 and T5P1 (β = 0°): (a) deformed pipeline shape, (b) distribution of axial strains along the pipeline.
In the second step, the response of buried pipelines to strike-slip faults, where the backfilling material was chunky clay, was investigated (see Figure 7). The trench wall is not vertical in these two selected centrifuge tests (T4P2 and T5P2). The trench angle is 30° and the trench width is in both tests. The native soil is in a drained condition and the soil properties are given in Table 1.
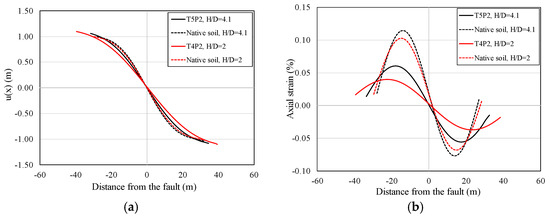
Figure 7.
Comparison between the developed analytical model for the trenched pipeline and the analytical model for uniform seabed soil, T4P2 and T5P2 (β = 0°): (a) deformed pipeline shape, (b) distribution of axial strains along the pipeline.
As shown in Figure 7a, the deflection curve of the pipeline does not change remarkably as the depth doubles, because of the equal soil shear strength in the buried pipeline depth. There is also no significant change in pipeline deflection for the pipeline buried in the trench considering different burial depth ratios. Although the horizontal distance between the wrinkles increases by around 13%, the vertical distance () is almost 4%. Figure 7b illustrates the axial strain distribution in these two case studies.
In this study, the effect of trench width on the pipeline responses was also investigated as the pipeline moved in the soil because of strike-slip fault activities. Two comparisons were made considering two different burial depth ratios (2 and ~4). To investigate the effect of trench width on the bending deformation of buried pipelines, centrifuge test results with similar trench depths (3.9 and 4.1) and backfilling soil (slurry) were selected (T1P2 and T5P1). The widths of the trenches of T1P2 and T5P1 were D and D, respectively. Figure 8a shows that the bending deformation decreases as trench width increases. Additionally, the distance between the wrinkles increases when the trench width rises. The comparison of axial strain distribution of the pipeline for these case studies is shown in Figure 8b. This figure shows that as the trench width increases (doubled), the axial strain decreases (almost 50%). The comparison of the results of this figure shows that the location of the maximum axial strain depends on the trench width.
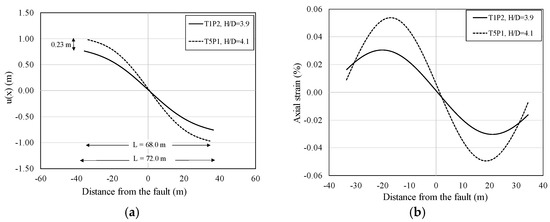
Figure 8.
Comparison between the developed analytical model for the trenched pipeline and the analytical model for uniform seabed soil, T1P2 ( D) and T5P1 ( D) with (β = 0°): (a) deformed pipeline shape, (b) distribution of axial strains along the pipeline.
Figure 9 shows the analytical results for T3P1 and T4P1. In these two case studies, the burial depth ratio is 2. The seabed soil drainage conditions are different in these case studies. The seabed soil in T3P1 is partially drained; however, in T4P1, it is in drained condition. Figure 9a shows that the bending deformation decreases as the trench width increases. Figure 9b shows the comparison of axial strain distribution in the large deformation part of the T3P1 and T4P1 cases. This figure confirms the previous conclusion about the effect of trench width on the axial strain, although the seabed soil drainage conditions are different.
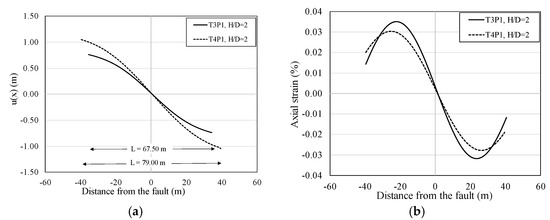
Figure 9.
Comparison between the developed analytical model for the trenched pipeline and the analytical model for uniform seabed soil, T3P1 ( D) and T4P1 ( D) with (β = 0°): (a) deformed pipeline shape, (b) distribution of axial strains along the pipeline.
4. Conclusions
In this study, the structural response of the buried pipeline to the strike-slip fault was studied by incorporating the effects of backfilling soil properties and trench configuration into an analytical model. The deformed shapes and axial strain distribution curves were used to investigate the pipeline–backfill–trench interaction. The results showed that the impact of the pipe–soil interaction on pipe response can be significant during fault crossing. A parametric study was conducted to evaluate the pipe–backfill–trench interaction considering the effects of different burial depths and widths on the axial-lateral pipeline–soil interaction. The following conclusions were observed:
- In general, the properties of backfilling soil have a significant effect on the axial strain of the pipeline. Softer backfills induce around 50% less axial strains.
- The position of maximum axial strain does not considerably change as the trench depth increases. However, trench width is an important factor that affects the location of the maximum axial strain.
- The deformed shape of the pipeline is significantly affected by trench geometry. As can be seen in the results, the distance between two major wrinkles on a buried pipeline in a trench increases as the trench width increases or the trench depth decreases.
Generally, better mechanical behavior of trenched pipelines in softer material is evident. Locally increasing trench width is suggested in order to protect buried steel pipelines against local buckling in seismically active areas because of economic issues. It is recommended that the current study should be extended to include advanced large deformation numerical simulations to further assess the reliability of the observations.
Author Contributions
Conceptualization, H.S.; methodology, H.S. and X.D.; software, H.S.; validation, M.A.; formal analysis, M.A.; investigation, M.A.; resources, H.S.; data curation, M.A.; writing—original draft preparation, M.A.; writing—review and editing, X.D. and H.S.; visualization, M.A.; supervision, H.S. and X.D.; project administration, H.S.; funding acquisition, H.S. All authors have read and agreed to the published version of the manuscript.
Funding
This research was funded by Wood PLC through Wood Group Chair program at Memorial University, Natural Science and Engineering Research Council of Canada (NSERC) though CRD program, and Newfoundland’s Research and Development Corporation (RDC) (now IET) through Collaborative Research and Developments Grants (CRD).
Data Availability Statement
Some of the data may be available upon reasonable request.
Acknowledgments
The authors gratefully acknowledge the financial support of the “Wood” through establishing Research Chair program in Arctic and Harsh Environment Engineering at the Memorial University of Newfoundland, the “Natural Science and Engineering Research Council of Canada (NSERC)” and the “Newfoundland Research and Development Corporation (RDC) (now Innovate NL) through “Collaborative Research and Developments Grants (CRD)”. Special thanks are extended to Memorial University for providing excellent resources for conducting this research program.
Conflicts of Interest
The authors declare no conflict of interest.
References
- Palmer, D.F.; Henyey, T.L. San Fernando earthquake of 9 February 1971: Pattern of faulting. Science 1971, 14, 712–715. [Google Scholar] [CrossRef] [PubMed]
- Newmark, N.M.; Hall, W.J. Pipeline design to resist large fault displacement. In Proceedings of the U.S. National Conference on Earthquake Engineering 1975, Ann Arbor, MI, USA, 18–20 June 1975; Earthquake Engineering Research Institute: Oakland, CA, USA, 1975; pp. 416–425. [Google Scholar]
- Kennedy, R.; Chow, A.; Williamson, R. Fault Movement Effects on Buried Oil Pipeline. Transp. Eng. J. ASCE 1977, 103, 617–633. [Google Scholar] [CrossRef]
- Vougioukas, E.A.; Theodossis, C.; Carydis, P.G. Seismic analysis of buried pipelines subjected to vertical fault movement. ASCE J. Tech. Counc. 1979, 105, 432–441. [Google Scholar]
- MaCaffrey, M.A.; O’Rourke, T.D. Buried pipeline response to reverse faulting during the 1971 San Fernando Earthquake. In Earthquake Behavior and Safety of Oil and Gas Storage Facilities, Buried Pipelines and Equipment; PVP-77; ASME: New York, NY, USA, 1983; pp. 151–159. [Google Scholar]
- Wang, L.R.L.; Yeh, Y.H. A refined seismic analysis and design of buried pipeline for fault movement. Earthq. Eng. Struct. Dyn. 1985, 13, 75–96. [Google Scholar] [CrossRef]
- Karamitros, D.K.; Bouckovalas, G.D.; Kouretzis, G.P. Stress analysis of buried steel pipelines at crossing fault zones. ASCE J. Geotech. Geoenviron. Eng. 2007, 134, 1501–1515. [Google Scholar]
- Vazouras, P.; Karamanos, S.A.; Dakoulas, P. Finite element analysis of buried steel pipelines under strike-slip fault displacements. Soil Dyn. Earthq. Eng. 2010, 30, 1361–1376. [Google Scholar] [CrossRef]
- Vazouras, P.; Dakoulas, P.; Karamanos, S.A. Pipe–soil interaction and pipeline performance under strike–slip fault movements. Soil Dyn. Earthq. Eng. 2015, 72, 48–65. [Google Scholar] [CrossRef]
- Sarvanis, G.C.; Karamanos, S.A. Analytical model for the strain analysis of continuous buried pipelines in geohazard areas. Eng. Struct. 2017, 152, 57–69. [Google Scholar] [CrossRef]
- Takada, S.; Hassani, N.; Fukuda, K. A new proposal for simplified design of buried steel pipes crossing active faults. Earthq. Eng. Struct. Dyn. 2001, 30, 1243–1257. [Google Scholar] [CrossRef]
- Karamitros, D.K.; Bouckovalas, G.D.; Kouretzis, G.P. Stress analysis of buried steel pipelines at strike-slip fault crossings. Soil Dyn. Earthq. Eng. 2007, 27, 200–211. [Google Scholar] [CrossRef]
- Trifonov, O.V.; Cherniy, V.P. A semi-analytical approach to a nonlinear stress–strain analysis of buried steel pipelines crossing active faults. Soil Dyn. Earthq. Eng. 2010, 30, 1298–1308. [Google Scholar] [CrossRef]
- Vazouras, P.; Karamanos, S.A.; Kakoulas, P. Mechanical behavior of buried steel pipes crossing active strike-slip faults. Soil Dyn. Earthq. Eng. 2012, 41, 164–180. [Google Scholar] [CrossRef]
- Demofonti, G.; Ferino, J.; Karamanos, S.A.; Vazouras, P.; Dakoulas, P. An integrated experimental-Numerical approach to predict strain demand for buried steel pipelines in geo-hazard areas. In Proceedings of the Rio Pipeline Conference, Rio de Janeiro, Brazil, 24–26 September 2013. [Google Scholar]
- Zhang, J.; Liang, Z.; Han, C.J.; Zhang, H. Numerical simulation of buckling behavior of the buried steel pipeline under reverse fault displacement. Mech. Sci. 2015, 6, 203–210. [Google Scholar] [CrossRef]
- Zhang, J.; Liang, Z.; Zhang, H. Response analysis of buried pipeline subjected to reverse fault displacement in rock stratum. Trans. Famena 2016, 40, 91–100. [Google Scholar] [CrossRef]
- ASCE. Guidelines for the Seismic Design of Oil and Gas Pipeline Systems; ASCE: New York, NY, USA, 1984. [Google Scholar]
- American Lifelines Alliance. Guidelines for the Design of Buried Steel Pipes; Federal Emergency Management Agency: Washington, DC, USA, 2005. [Google Scholar]
- Kianian, M.; Allahbakhshi, M.; Shiri, H. Centrifuge Testing of Lateral Pipeline-Soil Interaction Buried in Very Loose Sand. In Proceedings of the GeoEdmonton Conference 2018, Edmonton, AB, Canada, 23–26 September 2018. [Google Scholar]
- Kianian, M.; Esmaeilzadeh, M.; Shiri, H. Lateral response of trenched pipelines to large deformations in clay. In Proceedings of the Offshore Technology Conference, Houston, TX, USA, 30 April–3 May 2018. [Google Scholar]
- Kianian, M.; Shiri, H. The influence of pipeline–trench bed interaction intensity on lateral soil resistance and failure mechanisms. Int. J. Geotech. Eng. 2019, 14, 1–14. [Google Scholar]
- Kianian, M.; Shiri, H. The effect of backfilling stiffness on lateral response of the shallowly trenched-backfilled pipelines in clay. Mar. Georesour. Geotechnol. 2020, 39, 1–13. [Google Scholar] [CrossRef]
- Kianian, M.; Shiri, H. Experimental study of trench effect on lateral failure mechanisms around the pipeline buried in clay. J. Pipeline Sci. Eng. 2021, 1, 198–211. [Google Scholar] [CrossRef]


Disclaimer/Publisher’s Note: The statements, opinions and data contained in all publications are solely those of the individual author(s) and contributor(s) and not of MDPI and/or the editor(s). MDPI and/or the editor(s) disclaim responsibility for any injury to people or property resulting from any ideas, methods, instructions or products referred to in the content. |
© 2023 by the authors. Licensee MDPI, Basel, Switzerland. This article is an open access article distributed under the terms and conditions of the Creative Commons Attribution (CC BY) license (https://creativecommons.org/licenses/by/4.0/).