Abstract
The Early Cretaceous Yellow Cat Member of the terrestrial Cedar Mountain Formation in Utah, USA. has been interpreted as a “time-rich” unit because of its dinosaur fossils, prominent paleosols, and the results of preliminary chemostratigraphic and geochronologic studies. Herein, we refine prior interpretations with: (1) a new composite C-isotope chemostratigraphic profile from the well-known Utahraptor Ridge dinosaur site, which exhibits δ13C features tentatively interpreted as the Valanginian double-peak carbon isotope excursion (the so-called “Weissert Event”) and some unnamed Berriasian features; and (2) a new cryptotephra zircon eruption age of 135.10 ± 0.30/0.31/0.34 Ma (2σ) derived from the CA-ID-TIMS U-Pb analyses of zircons from a paleosol cryptotephra. Our interpretations of δ13C features on our chemostratigraphic profile, in the context of our new radiometric age, are compatible with at least one prior age model for the “Weissert Event” and the most recent revision of the Cretaceous time scale. Our results also support the interpretation that the Yellow Cat Member records a significant part of Early Cretaceous time.
1. Introduction
The Yellow Cat Member of the terrestrial Cedar Mountain Formation is known worldwide for its diverse fossil vertebrates, and particularly its dinosaur fossils [1,2]. It is dominated by alluvial mudrocks with prominent, stacked paleosols [2,3,4]. Palustrine to lacustrine sediments, including nodular to bedded carbonates (“calcretes”) are locally prominent, and fluvial sandstones are comparatively minor components [1,3,4]. Previous research carried out by some of us over more than a decade [3,4,5,6,7] has established the value of comprehensive stable-isotope geochemistry in the Cedar Mountain Formation, especially when coupled with radiometric dating, yet our geochronologic framework the formation is still incomplete. It is a persistent challenge to establish reliable geochronology in widely distributed continental stratigraphic sections in the absence of widespread marker beds and marine biota and under the severe constraints of exceedingly few or no observable tephras. Our results, however, demonstrate the value of the concept of cryptotephras [8] in challenging terrestrial sedimentary successions.
The Yellow Cat Member is particularly intriguing—and even problematic—because: (1) its depositional extent was limited to a part of southeastern Utah by ancient salt tectonics, (2) its dinosaur faunas suggest that the unit records a large part of Early Cretaceous time, (3) its well-developed Vertisol-like paleosols are likely to record long intervals of geologic time within a few meters or less of sediments [1,2,3,4], and, therefore, (4) it is thought to be a “time-rich” unit [4]. We present a new composite δ13C chemostratigraphic profile at Utahraptor Ridge, Utah (Figure 1), where the Stikes Quarry has been excavated over a period of years for spectacular dinosaur fossils, including the remains of the eponymous dromaeosaurid Utahraptor [1,2]. We also provide U-Pb zircon ages from the same stratigraphic section. Earlier work identified multiple Aptian−Albian carbon-isotope excursions (CIEs) in chemostratigraphic profiles of the Cedar Mountain Formation [5,6] and demonstrated that some strata in the Yellow Cat Member are older than Aptian [3]. The present paper presents new results that verify the Berriasian–Valanginian ages of part of the Yellow Cat Member and extend the organic carbon-isotope record of the member farther back in geologic time than ever before. Some of the CIEs that we identify herein may correlate globally.
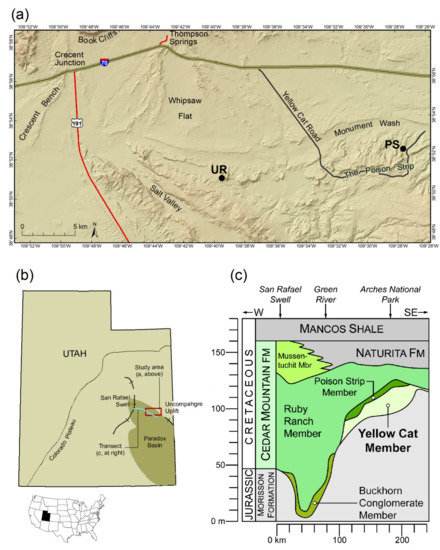
Figure 1.
Geographic and stratigraphic setting of study site. (a) Location of Utahraptor Ridge site (UR) in Grand County, Utah, USA. The Yellow Cat Member of the Cedar Mountain Formation was previously described by Joeckel et al. [3,4] at Poison Strip (PS). (b) Location of study area identified in (a) within Utah and relative to major structural and physiographic features. (c) Simplified cross-section of Cedar Mountain Formation in southeastern Utah.
2. Materials and Methods
We sampled strata of the Yellow Cat Member at Utahraptor Ridge (Figure 2 and Figure 3), a section that has been described in great detail by Kirkland et al. [2] their figure 19), and to which we refer readers for more detail. The Yellow Cat Member at Utahraptor Ridge consists of four distinct stratigraphic intervals. A lower interval (approximately 0–3.5 m in stratigraphic height in Figure 2) consists of light gray to white, very fine to very coarse, and pebbly sandstones. The coarse-grained, basal unit of this interval lies atop the Brushy Basin Member of the Morrison Formation (Jurassic). The thick overlying interval (approximately 3.5–26.5 m in Figure 2) is dominated by light greenish-gray to red paleosol-bearing mudstones. It also contains a few, thin intervals of sandstone and nodular carbonates (“calcretes”). A prominent “calcrete” (approximately 26.5–32 m in Figure 2) consists chiefly of large to very large nodules of fine-grained carbonate with minor interstitial mudstone. This interval is prominent and the top of it (#2 in Figure 2 and Figure 3) is useful in local correlations. Another mudstone-dominated interval with intercalated sandstones (32 m and above in Figure 2) overlies the thick “calcrete.” The position of Stikes Quarry, an important vertebrate fossil site, is at approximately 37 m in our measured section (Figure 2: #3). There are slight discrepancies between the stratigraphic heights of units in Kirkland et al. [2] (their figure 19) and our stratigraphic section. Nevertheless, the top of the thick “calcrete” interval is readily identifiable in both their measured section and ours (Figure 2 and Figure 3).
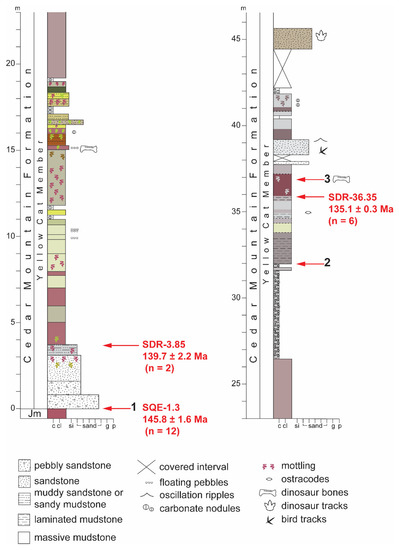
Figure 2.
Stratigraphic section at Utahraptor Ridge. Important contacts in bold black numerals 1–3 are: (1) top of the Brushy Basin Member of the Jurassic Morrison Formation (Jm); (2) top of a thick and prominent “calcrete” or horizon of large to very large carbonate nodules, described by Kirkland et al. [2] (their figure 19); and (3) approximate position of Stikes Quarry, also described by Kirkland et al. [2] (their figure 19). Kirkland et al. [2] (their figure 19) placed the top of the “calcrete” at 30 m above the upper contact of the Morrison Formation, whereas it is placed at approximately 32 m in ours. This slight difference probably results from local relief on stratigraphic contacts. Likewise, the position of Stikes Quarry is higher above the Morrison Formation in our section relative to that of Kirkland et al. [2] (their figure 19). Three concordia ages (red letters and numbers) derived from LA-ICP-MS zircon analyses are shown in red at their stratigraphic positions: SQE-1.3 (145.8 ± 1.6 Ma), SDR-3.85 (139.7 ± 2.2 Ma), and SDR-36.35 (136.1 ± 1.2 Ma) were reported by Joeckel et al. [3]. A newly revised high-precision CA-ID-TIMS age for SDR-36.35 is shown here. This estimated eruption age of 135.1 ± 0.3 Ma is reported for the first time in this paper. Abbreviations for grain-size scale are carbonate (c), clay (cl), silt (si), granules (g), and pebbles (p); sand ticks in part of scale labeled “sand” correspond to very fine, fine, medium, coarse, and very coarse sand, from left to right. Colors in the stratigraphic column approximate rock colors in the field.
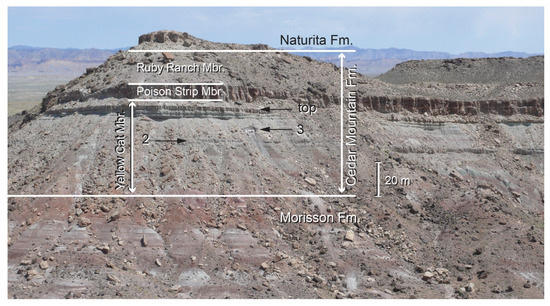
Our new work at Utahraptor Ridge is contextualized by prior work in the immediate area. Joeckel et al. [4] examined exceptionally good exposures of the Yellow Cat Member less than 10 km to the east at the Poison Strip site (Figure 1, “PS”). These authors demonstrated that vertical paleosol features such as filled cracks, very common small slickensides, and prominent synformal sets of very large slickensides are pervasive in massive, blocky-weathering mudstones that dominate the Yellow Cat Member at Poison Strip and other nearby outcrops. They also documented multiple instances of multigenerational paleosol crack fills that piped ancient surface sediments from on top of paleosol surfaces downward nearly to the bases of ancient soil profiles (Figure 4). Moreover, the ubiquitous large slickensides in paleosol profiles at Poison Strip evince the obliquely upward movement of clastic sediment (soil material) and carbonates by shear by ancient pedoturbation [4]. The Poison Strip exposures are nearly pristine vertical faces under an overhanging sandstone unit, but the equivalent part of the Yellow Cat Member at Utahraptor Ridge lacks such a protective overhang, is much less well-exposed, and is partially covered by talus blocks and colluvium (Figure 3). These conditions preclude making parallel, detailed observations across hundreds of meters of pristine paleosol outcrop (as at Poison Strip). Nevertheless, examinations of vertically extensive shallow trenches at Utahraptor Ridge indicate that the Yellow Cat Member there is dominated by massive mudstones with some of the same paleosol features that can be seen at Poison Strip, namely blocky weathering, carbonate nodules, small slickensides, and color zonation reminiscent of soil horizons. Given the proximity of Utahraptor Ridge to Poison Strip and the general similarity of these paleosol features in mudstones at the two sites, we surmise that Cretaceous soil-forming processes and their climatic and hydrologic controls were very similar in both places. If ancient soils in both places experienced some degree of pedoturbation, then sediment grains, masses of soil material, soil organic carbon, and other material of different ages, compositions, and origins, would have been mixed vertically and laterally. Therefore, the successions in the Yellow Cat Member at Utahraptor Ridge and Poison Strip are unlikely to be perfectly superposed vertical successions, at least within paleosol profiles, which are approximately 0.5 to 4 m in thickness. This point is germane to interpretations of organic δ13C chemostratigraphic results and volcanogenic zircon dates made in the Discussion section of this paper.
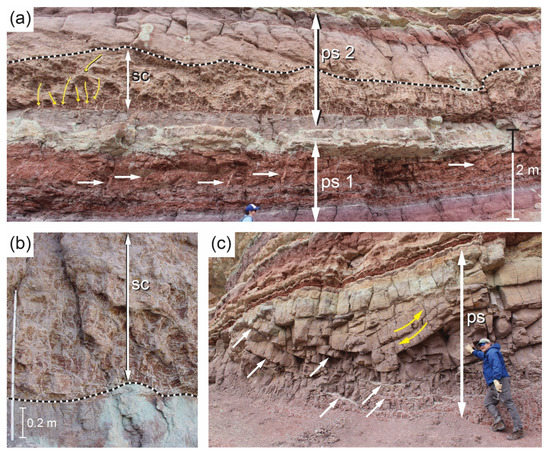
Figure 4.
Photos illustrating paleo-Vertisol features in the Yellow Cat Member at Poison Strip, Utah (Figure 1; PS), where local conditions have maintained exceptional paleosol exposures of far greater quality than those at Utahraptor Ridge (Figure 3). (a) Two stacked paleosols (ps1, ps2); ps1 contains several carbonate-filled cracks (horizontal white arrows), and ps2 exhibits a zone of prominent, filled soil cracks (sc). Pathways of the downward translocation of sandier soil material from above into clayey soil material below are shown for selected cracks as yellow arrows at the left. (b) Closeup of soil cracks (sc) in ps2. (c) Another paleosol (ps) with prominent slickensides, identified by diagonal white arrows; general sense of shear along slickensides is shown by yellow arrows. Shear within this Early Cretaceous soil profile moved materials obliquely up and down. Features shown in these photographs suggest that perfect stratigraphic superposition (e.g., of paleosol organic matter and volcanogenic zircons) is very unlikely to exist within these paleosol profiles due to ancient pedoturbation. We propose that conditions were similar at Utahraptor Ridge during the Early Cretaceous (see text for further discussion).
Palynological results from prior research, especially when interpreted in the context of preliminary ostracode and charophyte biostratigraphy [3], very strongly suggest that the Yellow Cat Member predates the late Barremian. Thus, Joeckel et al. [3] assigned the Yellow Cat Member to the middle Berriasian to early Hauterivian stages (i.e., a range encompassing the Valanginian Stage) based on the presence of Foraminisporis wonthaggiensis and Trilobosporites sp. cf. T. canadensis, and the absence of F. asymmetricus, Appendicisporites spp. and angiosperms.
2.1. Carbon-Isotope Analyses
We produced two new organic δ13C profiles for a stratigraphic section of the Yellow Cat Member at Utahraptor Ridge. These two profiles are combined in a composite chemostratigraphic profile, with a sample gap between the approximate stratigraphic heights of 19 to 33 m (Figure 5). This sample-gap interval spanned a section with extremely hazardous slopes that precluded collection. Chemostratigraphic samples from the Utahraptor Ridge section were collected by personnel from the University of Arkansas. These samples were sent to the University of Kansas Keck Paleoenvironmental and Environmental Stable Isotope Lab (KPESIL), where they were powdered with a mortar and pestle to generate approximately 1 g of powder. Samples were then decarbonated with 0.5 M hydrochloric acid for at least 24 h or until samples no longer reacted with fresh acid. Samples were then rinsed with deionized water by centrifugation and decanting of rinsed water until no longer acidic. Rinsed samples were dried at 50 °C and re-homogenized with a synthetic ruby mortar and pestle and stored in borosilicate vials. Raw δ13C values were obtained via high-temperature combustion with a Costech ECS 4010 Elemental analyzer connected to a continuous-flow ThermoFinnigan MAT 253 isotope ratio mass spectrometer at KPESIL. Samples were corrected to the VPDB scale using linear regression of in-house and international standards (USGS 24, IAEA 600, DORM, and IAEA C6). Calibration lines typically yield R2 values of 0.9994 or better. Multiple analyses of DORM were also used to determine the precision of 0.2‰. Organic δ13C data from Utahraptor Ridge are presented in Table 1. As is common practice in chemostratigraphic studies of sedimentary strata [3,9,10,11]), we employ a moving average of δ13C values in the chemostratigraphic profile derived from our data (Figure 5).
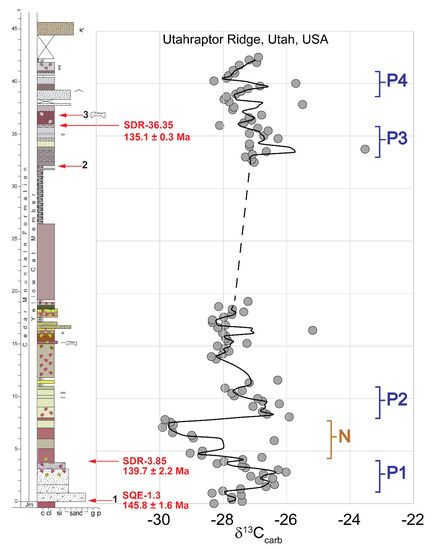
Figure 5.
The δ13C chemostratigraphic profile (trend line is a smoothed 3-point moving average) from Yellow Cat Member, overlying Jurassic Morrison Formation (Jm) at Utahraptor Ridge. The stratigraphic position of a new high-precision eruption age of cryptotephra from sample SDR-36.35, as well as those of other published LA-ICP-MS concordia ages are shown in red; sample gap indicated by dashed line. “P” denotes positive δ13C features on the 3-point moving average curve described in text and “N” denotes a prominent negative feature. See Figure 1 and text for details. Raw data are presented in Table 1.

Table 1.
Organic d13C and total organic carbon (TOC%) values from sedimentary rock samples at Utahraptor Ridge. Stratigraphic height refers to position in Figure 5.
2.2. U-Pb Zircon Analyses
Zircons from sample SDR 36.35, derived from a paleosol with the potential to preserve volcanogenic zircons, were separated by standard heavy mineral separation techniques at the Isotope Geochemistry Laboratories at the University of Kansas. LA-ICPMS U-Pb data were reported from this sample in Joeckel et al. [3], with a reported concordia age of 136.1 ± 1.2 Ma (2σ), MSWD = 1.03. To refine this date, additional zircons were mounted and analyzed by LA-ICPMS, and then the youngest population was plucked from the grain mount for analysis by CA-ID-TIMS.
Zircons selected for Chemical Abrasion-Isotope Dilution-Thermal Ionization Mass Spectrometry (CA-ID-TIMS) were ultrasonicated and cleaned in 6 M HCl on the hotplate before being ‘annealed’ at 900 °C for 60 h, then ‘leached’ for 12 h in 29 M HF at 210 °C [12] in Teflon microcapsules inside Parr dissolution vessels. Zircon grains were then removed from the microcapsules, ultrasonicated, rinsed in 7M HNO3, 6 M HCl, and MQ water, and loaded back in microcapsules with ~50 μL of 29 M HF and ~10 μL of EARTHTIME ET535 205Pb–233U–235U tracer solution [13,14] for dissolution at 210 °C for 48 h. Dissolved samples were then dried down in the microcapsules and redissolved in ~50 μL of 6 M HCl at 180 °C for 12 h inside the Parr dissolution vessels. The resulting solutions were again dried down, redissolved in ~50 μL of 3 M HCl, and then U and Pb were separated from other elements using 50 μL anion exchange columns with AG1X8 resin using a procedure modified after Krogh [15]. The combined U and Pb separates were dried down with ~1 uL of 0.001 M H3PO4.
The U plus Pb samples were later mixed with ~2 μL of silica gel activator [16] and loaded onto degassed zone-refined Re filaments for analysis on the Isotopx Phoenix TIMS at the University of Kansas. A peak-hopping method was used to measure Pb isotopes on the Daly ion counting system behind a WARP filter, and Pb isotopic fractionation was corrected using a factor of 0.16 ± 0.04 (2σ) %/amu (based on long-term measurements of the NBS 981 Pb reference material). U was measured as UO2 using a static Faraday method, with a correction for the 233U18O16O isotopologue’s interference on 235U16O16O assuming an 18O/16O of 0.00205 inside of the Tripoli software; isotopic fractionation correction for U was determined using the tracer’s 233U/235U and an assumed zircon 238U/235U of 137.818 ± 0.045 (2σ) [17]. U-Pb data reduction was performed in the ET Redux software [18,19], assuming all Pb comes from laboratory blank and correcting for initial 230Th/238U disequilibrium using a conservative estimated Th/Umagma of 3.5 ± 2.0 (2σ). U-Pb ID-TIMS data are presented in Table 2.
Table 2.
U-Pb Chemical Abrasion-Isotope Dilution-Thermal Ionization Mass Spectrometry (CA-ID-TIMS) for zircons from sample SDR 36.35 at Utahraptor Ridge.
3. Results
3.1. Carbon-Isotope Analyses
Organic carbon δ13C values from the composite chemostratigraphic profile at Utahraptor Ridge range from a minimum of about −30‰ VPDB up to about −23.5‰ VPDB. Our chemostratigraphic profile (Figure 5) shows data points for individual carbon isotope analyses along with a smoothed 3-point moving average trend line that we use to determine the approximate magnitude of δ13C shifts. The dashed line in Figure 5 represents the sample gap and it merely connects δ13C values from immediately below and above the gap. The long-term trend through the whole carbon isotope profile shows slightly increasing δ13C values upward through the section (Figure 5).
Carbon isotope δ13C values of about −28‰ VPDB appear to characterize baseline values at the bottom (0 to 1.5 m), middle (approximately 13 to 19 m), and near the top of the profile (approximately 33, 36, 38, and 40 m). Critically, these baseline intervals bracket other intervals with well-defined chemostratigraphic structures (Figure 5). Apparent positive carbon-isotope features exist at approximate stratigraphic heights of: (1) 1 to 4 m, with a shift with a magnitude of about 2 per mil (Figure 5: P1); (2) 9 to 12 m, with a shift with a magnitude of about 1.5 per mil (Figure 5: P2); (3) 34 to 36 m, with a shift with a magnitude of about 1 per mil (Figure 5: P3); and 39 to 41 m, with a shift with a magnitude of 1 per mil (Figure 5, P4). One apparent negative carbon-isotope feature is present at a stratigraphic height of 4 to 8 m and it has a shift with a magnitude of about 2 per mil (Figure 5: N). We also note that the P3 and P4 intervals include chemostratigraphic samples with yet even higher “outlier” δ13C values. Carbon isotope values of −23.53‰ and −25.71 were produced from samples at stratigraphic heights of 33.75 m and 40 m respectively. Those sample positions coincide with the peak δ13C values of P3 and P4, and might actually be more indicative of the full magnitude of these CIEs at Utahraptor Ridge.
3.2. U-Pb Zircon Analyses
Six zircons analyzed by CA-ID-TIMS yield concordant 230Th-corrected U-Pb dates between 136.4 Ma and 135 Ma. The youngest four form a tight cluster around 135.3 Ma, in good agreement with the LA-ICPMS U-Pb concordia date of 136.1 ± 1.2 Ma (2σ) reported in Joeckel et al. [3]. We interpret the scatter in zircon ages well outside their uncertainties as evidence of prolonged zircon crystallization or incorporation of zircons in this sample from slightly older magmatic systems. The youngest age represented what we interpret as our best estimate of the zircons’ eruption age and the maximum depositional age of the sample. To estimate the minimum of the zircons’ age spread, we use the Bayesian algorithm presented by Keller et al. [20]. This approach avoids artificially reducing the age uncertainty when evaluating a weighted mean of the youngest zircons up to an arbitrary and ambiguous cutoff age. As illustrated in Figure 6, the uncertainty is ± 0.30/0.31/0.34 Ma (2σ). The uncertainty is given in the form X/Y/Z, where X includes analytical sources of uncertainty, Y additionally includes uncertainty in calibration of the ET535 isotopic tracer, and Z includes analytical, tracer, and decay constant uncertainty contributions.
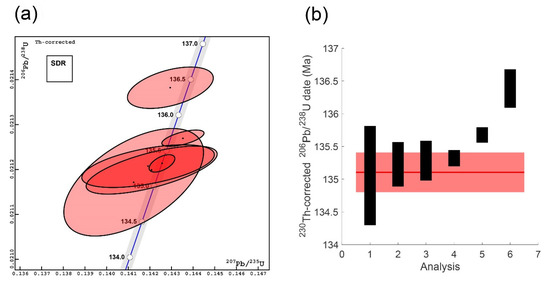
Figure 6.
U-Pb CA-ID-TIMS data for sample SDR 36.35. (a) Plot showing 2σ uncertainty ellipses for the six zircon analyses in Table 2. The blue line is concordia, the gray shaded region is the 2σ uncertainty defined by the 238U and 235U decay constant uncertainties, and all data have been corrected for initial 230Th disequilibrium. (b) Age-rank plot of analyzed zircon dates. Black boxes illustrate ±2σ analytical uncertainties, and the red-shaded region is the calculated best estimate of the eruption and maximum depositional age using the algorithm of Keller et al. [20]. See Table 2 for data.
We consider our volcanogenic zircon samples to represent cryptotephras. Our usage of the term cryptotephra [8], in this case refers, to the technical approach of laboratory separation of microscopic fragments from volcanic tephra deposits that are contained within sedimentary units (in the present case, paleosol-bearing mudstones) that show no visible evidence of volcanic ash deposition in the field. The processing sequence for Quaternary cryptotephras [8] differs from ours in that microscopic volcanic glass shards are concentrated from mudstone paleosol samples in the laboratory for the purpose of chemical fingerprinting of known well-dated Quaternary tephra deposits. In the case of our Early Cretaceous cryptotephras, microscopic zircon crystals are concentrated in the laboratory for the purpose of LA-ICP-MS U-Pb screening of large zircon populations to identify the Maximum Depositional Age (MDA) age cluster. Given that LA-ICP-MS ages have a 2% range of uncertainty, higher-precision CA-ID-TIMS U-Pb analyses of zircon crystals from the MDA age cluster are required to refine age models with appropriate sub-million-year uncertainties.
4. Discussion
C-isotope chemostratigraphy from Utahraptor Ridge is tentatively correlated with other pre-Hauterivian chemostratigraphic records around the world in Figure 7. Given the eruption age of 135.1 ± 0.3 Ma of a cryptotephra from 36.35 m above the contact between the underlying Morrison Formation and the Cedar Mountain Formation contact, we interpret the C-isotope record from 32.5 to 42.5 m as Valanginian s and the C-isotope record from 0 to 19.25 m as Berriasian. We specify CIEs in the chemostratigraphic profile at Utahraptor Ridge as comparatively short-term departures from, and subsequent returns to, the long-term baseline δ13C values. Thus, a positive CIE exhibits an underlying rising limb of increasing δ13C values culminating in a maximum δ13C value, with an overlying falling limb of decreasing values returning to the long-term baseline δ13C values. Conversely, a negative CIE has an underlying falling limb culminating in a minimum δ13C value, overlain by a rising limb and an eventual return to the long-term baseline δ13C values.

Figure 7.
Comparison of new composite chemostratigraphic profile from Utahraptor Ridge with profiles from nearby Poison Strip, Utah (see Figure 1), as well as Oman, France, Crimea, and England [21,28,30,31] The correlation of the Valanginian carbon isotope excursion by Robinson and Hesselbo [30] has been here further subdivided into the upper and lower δ13C peaks.
In support of our analysis of Berriasian chemostratigraphy, we note the seminal identification of two minor positive CIEs that were reported from pelagic marine carbonates from the Berriasian stratotype by Emmanuel and Renard [21] from the Vocontian basin of southeast France (Figure 7). The magnitude of the positive carbon-isotope shifts described by these authors is +0.32 and +0.37 per mil, respectively. A more recent analysis of marine Berriasian chemostratigraphy at the La Chambotte section on the Jura Platform by Morales et al. [22] showed a similar structure, but with much larger carbon-isotope shifts of about 2 per mil. Given our age constraints derived from volcanogenic zircons, we correlate the Berriasian positive carbon isotope chemostratigraphic features described by Emmanuel and Renard [21] to the +2.3 per mil positive δ13C shift at approximately 3 m in stratigraphic height at Utahraptor Ridge (within P1 in Figure 5) and to the +4.0 per mil positive δ13C shift at 8.25 m (within P2 in Figure 5). The magnitudes of the positive carbon isotope shifts in our continental organic δ13C record from Utahraptor Ridge are much greater than the CIEs to which we correlate them in the marine carbonate record. Notwithstanding, it is common for terrestrial δ13C chemostratigraphic records to exhibit magnitudes that exceed those of correlative marine records by factors of two or more (Table 3) [4,5,6,11,23,24,25,26,27,28,29,30,31,32,33,34,35,36,37,38,39,40,41]. The causes of such frequently observed differences between correlative terrestrial and marine δ13C records have not been fully explored. Notwithstanding, cogent observations can be brought to bear on the matter, such as the realization that terrestrial records directly capture temporal shifts in the δ13C composition of atmospheric CO2, while correlated marine records are likely to be buffered by a marine dissolved inorganic carbon reservoir that exceeds that of the atmosphere by 50 to 60 times [20]. Therefore, potential leads and lags—the mixing times of the atmospheric and marine carbon reservoirs, which differ by orders of magnitude—are important considerations in the recording of C-cycle perturbations in the sedimentary record. Emmanuel and Renard [21] interpreted the Berriasian δ13C chemostratigraphy in their section as related to sequence stratigraphic and sea-level changes.
Table 3.
Comparison of magnitudes of published marine and terrestrial records of well-known Cretaceous and Paleogene carbon-isotope excursions (CIEs), exemplifying comparative differences in the magnitudes. See text for further explanation.
If correctly correlated, ours is one of only a few terrestrial organic δ13C records of Berriasian age and it indicates potentially significant C-cycle perturbations of unknown origin. We note that positive feature P1 at Utahraptor Ridge (Figure 5) qualifies as a CIE because it has both rising and falling limbs, whereas positive feature P2 (Figure 5) is a very abrupt positive shift relative to underlying δ13C values and has no rising limb per se. A future effort in finer-scale sampling frequency could determine whether there are intermediate values in the profile at Utahraptor Ridge. Morales et al. [22] (their figure 5) effectively report the same phenomenon at the approximate 25 m level in the Berriasian La Chambotte section on the Jura Platform in eastern France, a chemostratigraphic profile, which also shows an abrupt increase in δ13C values between two adjacent samples. Furthermore, there is an uncanny resemblance between the Berriasian δ13C profiles at La Chambotte of Morales et al. [22] and the part of our composite δ13C profile that we propose to be Berriasian strata at Utahraptor Ridge.
Positive CIEs with possible magnitudes of as much as +3.6 per mil at 33.75 m in stratigraphic height and of possibly as much as +2.3 per mil slightly below 40 m in our chemostratigraphic profile at Utahraptor Ridge ((Figure 5: P3, P4). Furthermore, the overall configuration of our chemostratigraphic profile between approximately 33.75 and 40 m (Figure 5) is strongly reminiscent of the “double-peak” positive C-isotope excursion in the Valangian observed in many marine carbonate records and called the “Weissert Event” or “Weissert Episode” by some authors [31,32,33,34,35,36,37,38,39,40,41,42,43,44,45,46] (Figure 7). In the chemostratigraphic profile presented in Figure 5, we interpret feature P3 as the lower of the two peaks and P4 as the upper one. The Valangian positive CIE records the first of several major perturbations of the global carbon cycle during the Cretaceous Period [31,32,33,34]. Although it has been identified chiefly in marine carbonate strata, the “Weissert Event” was first identified in continental strata nearly two decades ago [30]. Recently, Joeckel et al. [3] proposed evidence for this event in a chemostratigraphic profile of the Yellow Cat Member at Poison Strip (Figure 1 and Figure 4), but our recent results presented herein add further weight to this idea The magnitude of the positive CIEs at the “Weissert Event,” where it is firmly identified in terrestrial records, are ~+3 per mil from the pre-excursion background for the first peak and ~+1.5 per mil for the second peak isotope excursion in these carbonate records. This C-isotope trend is also seen in continental records of coal and charcoal [31], but at a much higher magnitude (+5.9 per mil and +2.41 per mil); it is noteworthy that the data from Utahraptor Ridge are consistent with this trend. Furthermore, the SDR-36.35 mudstone paleosol sample at Utahraptor Ridge is one of two (the other being sample PSMA-11.71) that produced large n clusters of Valanginian zircon grains from the LA-ICP-MS U-Pb data reported by Joeckel et al. [3]. The Maximum Depositional Age (MDA; 136.1 ± 1.24 Ma) reported from this cluster of zircons in SDR-36.35 is a close approximation to some published ages for the Valanginian positive CIE or “Weissert Event” [47] and marked this sample as a likely paleosol cryptotephra. Our high-precision eruption age of 135.1 ± 0.3 Ma for sample SDR-36.35 is a close match to the recently estimated age of the Weissert Event at 135 to 134 Ma [47]. Testing our hypothesis that the “Weissert Event” can be identified in the Yellow Cat Member will require more work. If our hypothesis is correct, however, we are the first identification and in situ age assessment of the WE in terrestrial sediments in North America.
We have already compared, by way of sedimentologic context, the Yellow Cat Member at Utahraptor Ridge with the same unit at the nearby Poison Strip, Utah. This comparison strongly suggests that ancient pedoturbation occurred at both sites and materials atop and within paleosol profiles—including those we sampled for organic δ13C analyses and volcanogenic zircons—were mixed vertically and laterally to some degree. It is very unlikely, then, that there is a perfect vertical superposition of sediments (i.e., paleosol materials) of slightly different ages through multiple paleosol profiles approximately 0.5 to 4 m in thickness. Accordingly, neither individual organic δ13C values nor volcanogenic zircons derived from analyses of either stratigraphic section may be in the exact stratigraphic positions in which they were originally accumulated. In this scenario, the detailed structure of a resulting chemostratigraphic profile would be modified relative to an equivalent hypothetical sedimentary succession with perfect vertical superposition. Isotopic signatures of carbon-cycle change would thus be “smeared” across paleosol-bearing intervals because soil organic matter of slightly different ages in our samples may not have been directly superimposed at decimeter-to-meter scales. To some extent, our use of a three-point moving average trend line mitigates the potential impacts of vertical translocation due to ancient pedoturbation. Such effects would affect only the details of the curve at scales of a few meters or less, and not the overall trend of δ13C values. We observe that a similar approach in pelagic marine carbonates mitigates the effects of the “bioturbation window” through centimeter-to-decimeter stratigraphic intervals.
In view of such potential complications, we are inclined to draw particular attention to our reported organic δ13C values greater than −26‰ in our sections (Figure 5). Those values are within intervals that express positive δ13C excursions in successive samples at the decimeter scale in the line representing our three-point moving average (Figure 5). Thus, even though they do not lie on that curve, they may still represent δ13C peak values within CIEs. The fact remains that at both Poison Strip locality [3,4] and Utahraptor Ridge, there are significant, positive δ13C excursions that are expressed at the meter-to-decimeter scale. Moreover, a recent, but as-yet unpublished, chemostratigraphic study of the Yellow Cat Member in eastern Utah independently reports other probable records of the Valanginian double-peak δ13C excursion or “Weissert Event” [48].
Comparisons of our interpretive record of the Valanginian CIE at Utahraptor Ridge with other published δ13C profiles widely accepted to record the event indicates that there are local or regional differences in its expression. We observe: (1) that 13 correlated δ13C profiles from the Pacific to Europe compiled by Duchamp-Alphonse et al. [46, their figure 6] show such differences, (2) many records of the Valanginian CIE display two discrete lower and upper δ13C peaks (the record at Poison Strip begins at the position of this lower peak, and (3) the δ13C values in the lower peak are nearly always higher than in the upper peak.
5. Conclusions
This paper continues a longstanding line of inquiry into the stable-isotope chemostratigraphy and geochronology of the Cedar Mountain Formation e.g., [3,5,6,7]. The lower part of a distinctive double-peak positive carbon-isotope excursion in a composite δ13C chemostratigraphic profile of the Yellow Cat Member from Utahraptor Ridge, Utah is directly associated with a cryptotephra zircon eruption age of 135.10 ± 0.30/0.31/0.34 Ma (2σ) derived from the U-Pb CA-ID-TIMS analyses of paleosol zircons. These geochronological and chemostratigraphic results are consistent with the absolute age model of Channell et al. [38] for the Valanginian positive carbon-isotope excursion or so-called “Weissert Event” in a succession of marine carbonates in Europe. Moreover, our results and our interpretation of a Valanginian double-peak C-isotope excursion are compatible with the most recent placements of not only the “Weissert Event” (135–134 Ma), but also the Berriasian–Valanginian boundary (137 Ma) and the Valanginian–Hauterivian boundary (132 Ma) [47].
Our work also identifies important avenues for future research. High-precision U-Pb geochronologic analyses can be used to test the hypothesis that the “Weissert Event” is recorded in the study area. Furthermore, the probable Berriasian δ13C features we have identified in our composite δ13C chemostratigraphic profile from Utahraptor Ridge almost certainly have broader significance, and they too should be scrutinized in future research.
Author Contributions
R.M.J., C.A.S., N.M.M., A.M. and G.A.L.: compilation and writing. R.M.J., C.A.S., A.M., G.A.L., M.B.S., J.I.K. and G.A.H.: field work. C.A.S., M.B.S., N.M.M., A.M., M.B.S., J.A. and S.K.: analyses. All authors have read and agreed to the published version of the manuscript.
Funding
This research received no external funding.
Data Availability Statement
The data presented in this study are available in this article.
Acknowledgments
We thank Bruce Barnett for supervising the C-isotope analyses at Keck Paleoenvironmental and Environmental Stable Isotope Laboratory at the University of Kansas and Allie Ryan for sample processing. We also thank three anonymous reviewers whose suggestions greatly improved this paper. Editorial office assistants for their patient editorial efforts and encouragement. Julius Csotonyi graciously provided an excellent illustration for our graphical abstract.
Conflicts of Interest
The authors declare no conflict of interest.
References
- Kirkland, J.I.; Simpson, E.L.; DeBlieux, D.D.; Madsen, S.K.; Bogner, E.; Tibert, N.E. Depositional constraints on the Lower Cretaceous Stikes Quarry dinosaur site: Upper Yellow Cat Member, Cedar Mountain Formation, Utah. Palaios 2016, 31, 421–439. [Google Scholar] [CrossRef]
- Kirkland, J.; Suarez, M.; Suarez, C.; Hunt-Foster, R. The Lower Cretaceous in east-central Utah—The Cedar Mountain Formation and its bounding strata. Geol. Intermount. West 2016, 3, 101–228. [Google Scholar] [CrossRef]
- Joeckel, R.M.; Ludvigson, G.A.; Möller, A.; Hotton, C.L.; Suarez, M.B.; Suarez, C.A.; Sames, B.; Kirkland, J.I.; Hendrix, B. Chronostratigraphy and terrestrial palaeoclimatology of Berriasian–Hauterivian strata of the Cedar Mountain Formation, Utah, USA. In Cretaceous Climate Events and Short-Term Sea-Level Changes; Geological Society, Special Publications 498; Wagreich, M., Hart, M.B., Sames, B., Yilmaz, I.O., Eds.; Geological Society of London: London, UK, 2020; pp. 75–100. [Google Scholar]
- Joeckel, R.M.; Ludvigson, G.A.; Kirkland, J.I. Lower Cretaceous paleo-Vertisols and sedimentary interrelationships in stacked alluvial sequences, Utah, USA. Sediment. Geol. 2017, 361, 1–24. [Google Scholar] [CrossRef]
- Ludvigson, G.A.; Joeckel, R.M.; Gonzalez, L.A.; Gulbranson, E.L.; Rasbury, E.T.; Hunt, G.J.; Kirkland, J.I.; Madsen, S. Correlation of Aptian-Albian carbon isotope excursions in continental strata of the Cretaceous foreland basin of eastern Utah. J. Sediment. Res. 2010, 80, 955–974. [Google Scholar] [CrossRef]
- Ludvigson, G.A.; Joeckel, R.M.; Murphy, L.R.; Stockli, D.F.; González, L.A.; Suarez, C.A.; Kirkland, J.I.; Al-Suwaidi, A. The emerging terrestrial record of Aptian-Albian global change. Cretac. Res. 2015, 56, 1–24. [Google Scholar] [CrossRef]
- Suarez, M.B.; Knight, J.A.; Godet, A.; Ludvigson, G.A.; Snell, K.E.; Murphy, L.; Kirkland, J.I. Multiproxy strategy for determining palaeoclimate parameters in the Ruby Ranch Member of the Cedar Mountain Formation. In Stable Isotope Studies of the Water Cyce and Terrestrial Environments; Geological Society, Special Publications 507; Bojar, A.-V., Pelc, A., Lécuyer, C., Eds.; Geological Society of London: London, UK, 2020; pp. 313–334. [Google Scholar]
- Davies, S.M. Cryptotephras: The revolution in correlation and precision dating. J. Quat. Sci. 2015, 30, 114–130. [Google Scholar] [CrossRef]
- Herrle, J.O.; Kössler, P.; Bollman, J. Palaeoceanographic differences of early Late Aptian black shale events in the Vocontian Basin (SE France). Palaeogeogr. Palaeoclimatol. Palaeoecol. 2010, 297, 367–376. [Google Scholar] [CrossRef]
- Bornemann, A.; Mutterlose, J. Calcareous nannofossil and d13C records from the Early Cretaceous of the western Atlantic Ocean: Evidence for enhanced fertilization across the Berriasian–Valanginian transition. Palaios 2008, 23, 821–832. [Google Scholar] [CrossRef]
- Ross, J.B.; Ludvigson, G.A.; Möller, A.; Gonzalez, L.; Walker, J.D. Stable isotope paleohydrology and chemostratigraphy of the Albian Wayan Formation from the wedge-top depozone, North American Western Interior Basin. Sci. China Earth Sci. 2017, 60, 44–57. [Google Scholar] [CrossRef]
- Mattinson, J.M. Zircon U-Pb chemical abrasion (“CA-TIMS”) method: Combined annealing and multi-step partial dissolution analysis for improved precision and accuracy of ages. Chem. Geol. 2005, 220, 47–66. [Google Scholar] [CrossRef]
- Condon, D.J.; Schoene, B.; McLean, N.M.; Bowring, S.A.; Parrish, R.R. Metrology and traceability of U-Pb isotope dilution geochronology (EARTHTIME tracer calibration Part I). Geochim. Cosmochim. Acta 2015, 164, 464–480. [Google Scholar] [CrossRef]
- McLean, N.M.; Condon, D.J.; Schoene, B.; Bowring, S.A. Evaluating uncertainties in the calibration of isotopic reference materials and multi-element isotopic tracers (EARTHTIME Tracer Calibration Part II). Geochim. Cosmochim. Acta 2015, 164, 481–501. [Google Scholar] [CrossRef]
- Krogh, T.E. A low-contamination method for hydrothermal decomposition of zircon and extraction of U and Pb for isotopic age determinations. Geochim. Cosmochim. Acta 1973, 37, 485–494. [Google Scholar] [CrossRef]
- Gerstenberger, H.; Haase, G. A highly effective emitter substance for mass spectrometric Pb isotope ratio determinations. Chem. Geol. 1997, 136, 309–312. [Google Scholar] [CrossRef]
- Hiess, J.; Condon, D.J.; McLean, N.; Noble, S.R. 238U/235U systematics in terrestrial uranium-bearing minerals. Science 2012, 335, 1610–1614. [Google Scholar] [CrossRef] [PubMed]
- McLean, N.M.; Bowring, J.F.; Bowring, S.A. An algorithm for U-Pb isotope dilution data reduction and uncertainty propagation. Geochem. Geophys. Geosyst. 2011, 12, Q0AA18. [Google Scholar] [CrossRef]
- Bowring, J.F.; McLean, N.M.; Bowring, S.A. Engineering cyber infrastructure for U-Pb geochronology: Tripoli and U-Pb Redux. Geochem. Geophys. Geosyst. 2011, 12, Q0AA19. [Google Scholar] [CrossRef]
- Keller, C.B.; Schoene, B.; Samperton, K.M. A stochastic sampling approach to zircon eruption age interpretation. Geochem. Perspec. Lett. 2018, 8, 31–35. [Google Scholar] [CrossRef]
- Emmanuel, L.; Renard, M. Carbonate geochemistry (Mn, δ13C, δ18O) of the Late Tithonian—Berriasian pelagic limestones of the Vocontian trough (SE France). Bull. Cent. Recher. Expl. Prod. Elf-Acquitaine 1993, 17, 205–221. [Google Scholar]
- Morales, C.; Gardin, S.; Cshnyder, J.; Spangenberg, J.; Arnaud-Vanneau, A.; Arnaud, H.; Adatte, T.; Föllmi, K.B. Berriaian and early early Valanginian environmental change along a transect from the Jura Platform to the Vocotian Basion. Sedimentology 2007, 60, 36–63. [Google Scholar] [CrossRef]
- Bains, S.; Norris, R.D.; Corfield, R.; Bowen, G.J.; Gingerich, P.D.; Koch, P.L. Marine-terrestrial linkages at the Paleocene-Eocene boundary. In Causes and Consequences of Globally Warm Climates of the Early Paleogene; Geological Society of America Special Paper, 369; Wing, S., Gingerich, P.D., Schmitz, B., Thomas, E., Eds.; Geological Society of America: Boulder, CO, USA, 2003; pp. 1–9. [Google Scholar]
- Gröcke, D.R.; Ludvigson, G.A.; Witzke, B.L.; Robinson, S.A.; Joeckel, R.M.; Ufnar, D.F.; Ravn, R.L. Recognizing the Albian-Cenomanian (OAE1d) sequence boundary using plant carbon isotopes: Dakota Formation, Western Interior Basin, USA. Geology 2006, 34, 193–196. [Google Scholar] [CrossRef]
- Gröcke, D.R.; Joeckel., R.M. A Stratigraphic test of the terrestrial carbon-isotope record of the latest Albian OAE from the Dakota Formation, Nebraska. In Field Trip 2: Fluvial-Estuarine Deposition in the Mid-Cretaceous Dakota Formation, Kansas and Nebraska; Kansas Geological Survey, Open-File Report no. 2008-2; University of Kansas: Lawrence, KS, USA, 2002; pp. 24–30. [Google Scholar]
- Richey, J.D.; Upchurch, G.R.; Montañez, I.P.; Lomax, B.H.; Suarez, M.B.; Crout, N.M.J.; Joeckel, R.M.; Ludvigson, G.A.; Smith, J.J. Changes in CO2 during the Ocean Anoxic Event 1d indicate similarities to other carbon cycle perturbations. Earth Planet. Sci. Lett. 2018, 491, 172–182. [Google Scholar] [CrossRef]
- Andrzejewski, K.A.; Layzell, A.L.; Ludvigson, G.A.; Joeckel, R.M.; Möller, A.; Mandel, R.D. Unique insights to the Cretaceous OAE1d, Mid-Cenomanian Event, and OAE2 from long-line drillcores along the eastern cratonic margin of the Western Interior Basin. In Proceedings of the 2022 Perkens-Rosen Conference, Gulf Coast Section SEPM (Society for Sedimentary Geology), Houston, TX, USA, 5–7 December 2022; 14p. [Google Scholar]
- Celestino, R.; Wohlwend, S.; Rehakova, D.; Weissert, H. Carbon isotope stratigraphy, biostratigraphy and sedimentology of the Upper Jurassic—Lower Cretaceous Rayda Formation, Central Oman Mountains. Newsl. Stratigr. 2017, 50, 91–109. [Google Scholar] [CrossRef]
- Cavalheiro, L.; Wagner, T.; Steinig, S.; Bottini, C.; Dummann, W.; Esegbue, O.; Gambacorta, G.; Giraldo-Gómez, V.; Farnsworth, A.; Flögel, S.; et al. Impact of global cooling on Early Cretaceous high pCO2 world during the Weissert Event. Nat. Commun. 2021, 12, 5411. [Google Scholar] [CrossRef]
- Robinson, S.A.; Hesselbo, S.P. Fossil-wood carbon-isotope stratigraphy of the non-marine Wealden Group (Lower Cretaceous, southern England). J. Geol. Soc. 2004, 161, 133–145. [Google Scholar] [CrossRef]
- Gröcke, D.R.; Price, G.D.; Robinson, S.A.; Baraboshkin, E.Y.; Mutterlose, J.; Ruffell, A.H. The Upper Valanginian (Early Cretaceous) positive carbon-isotope event recorded in terrestrial plants. Earth Planet. Sci. Lett. 2005, 240, 495–509. [Google Scholar] [CrossRef]
- Saltzman, M.R.; Thomas, E. Carbon isotope stratigraphy. In The Geologic Time Scale 2012; Gradstein, F.M., Ogg, J.G., Schmitz, M., Ogg, G., Eds.; Elsevier: Amsterdam, The Netherlands, 2012; pp. 207–232. [Google Scholar]
- Schlanger, S.; Jenkyns, H. Cretaceous anoxic events: Causes and consequences. Geol. Mijnb. 1976, 55, 179–184. [Google Scholar]
- Weissert, H. C-isotope stratigraphy, a monitor of paleoenvironmental change: A case study from the early Cretaceous. Surv. Geophys. 1989, 10, 1–61. [Google Scholar] [CrossRef]
- Jenkyns, H.C. Geochemistry of oceanic anoxic events. Geochem. Geophys. Geosyst. 2010, 11, Q03004. [Google Scholar] [CrossRef]
- Föllmi, K.B. Early Cretaceous life, climate and anoxia. Cretac. Res. 2012, 35, 230–257. [Google Scholar] [CrossRef]
- Lini, A.; Weissert, H.; Erba, E. The Valanginian carbon isotope event: A first episode of greenhouse climate conditions during the Cretaceous. Terra Nova 1992, 4, 374–384. [Google Scholar] [CrossRef]
- Channell, J.E.T.; Erba, E.; Lini, A. Magnetostratigraphic calibration of the Late Valanaginian carbon isotope event in pelagic limestones from northern Italy and Switzerland. Earth Planet. Sci. Lett. 1993, 118, 145–166. [Google Scholar] [CrossRef]
- Weissert, H.; Lini, A.; Föllmi, K.B.; Kuhn, O. Correlation of Early Cretaceous carbon isotope stratigraphy and platform drowning events: A possible link? Palaeogeogr. Palaeoclimatol. Palaeoecol. 1998, 137, 189–203. [Google Scholar] [CrossRef]
- Föllmi, K.B.; Weissert, H.; Bisping, M.; Funk, H.P. Phosphogenesis, carbon-isotope stratigraphy, and carbonate-platform evolution along the Lower Cretaceous northern Tethyan margin. Geol. Soc. Am. Bull. 1994, 106, 729–746. [Google Scholar] [CrossRef]
- Erba, E.; Bartolini, A.; Larson, R.L. Valanginian Weissert oceanic anoxic event. Geology 2004, 32, 149–152. [Google Scholar] [CrossRef]
- Charbonnier, G.; Boulila, S.; Gardin, S.; Duchamp-Alphonse, S.; Adatte, T.; Spangenberg, J.E.; Föllmi, K.B.; Colin, C.; Galbrun, B. Astronomical Calibration of the Valanginian ‘‘Weissert’’ Episode: The Orpierre Marl–Limestone Succession (Vocontian Basin, Southeastern France). In STRATI 2013; Rocha, R., Pais, J., Kullberg, J.C., Finney, S., Eds.; Springer Geology: Cham, Switzerland, 2014; pp. 175–179. [Google Scholar]
- Martinez, M.; DeConinch, J.-F.; Pellenard, P.; Riquier, L.; Company, M.; Reboulet, S.; Moiroud, M. Astrochronology of the Valanginian–Hauterivian stages (Early Cretaceous): Chronological relationships between the Paraná–Etendeka large igneous province and the Weissert and the Faraoni events. Glob. Planet. Change 2015, 121, 158–173. [Google Scholar] [CrossRef]
- Nunn, E.V.; Price, G.D.; Gröcke, D.R.; Baraboshkin, E.Y.; Leng, M.J.; Hart, M.B. The Valanginian positive carbon isotope event in Arctic Russia: Evidence from terrestrial and marine isotope records and implications for global carbon cycling. Cretac. Res. 2010, 31, 577–592. [Google Scholar] [CrossRef]
- Meissner, P.; Mutterlose, J.; Bodin, S. Latitudinal temperature trends in the northern hemisphere during the Early Cretaceous (Valanginian–Hauterivian). Palaeogeogr. Palaeoclimatol. Palaeoecol. 2015, 424, 17–39. [Google Scholar] [CrossRef]
- Duchamp-Alphonse, S.; Gardin, S.; Fiet, N.; Bartolini, A.; Blamart, D.; Pagel, M. Fertilization of the northwestern Tethys (Vocotian basin, SE France) during the Valanginian carbon isotope perturbation: Evidence from calcareous nannofossils and trace element data. Palaeogeogr. Palaeoclimatol. Palaeoecol. 2007, 243, 132–151. [Google Scholar] [CrossRef]
- Gale, A.S.; Mutterlose, J.; Batenburg, S.; Gradstein, F.M.; Agterberg, F.P.; Ogg, J.G. Chapter 27—The Cretaceous Period. In Geologic Time Scale 2020; Gradstein, F.M., Ogg, J.G., Schmitz, M.D., Ogg, G.M., Eds.; Elsevier: Amsterdam, The Netherlands, 2020; pp. 1023–1086. [Google Scholar]
- Forster, C. Evaluation of Carbon Isotopic Chemostratigraphy of the Cedar Mountain Formation of Utah. Master’s Thesis, University of Arkansas, Fayetteville, AR, USA, 2022. [Google Scholar]


Disclaimer/Publisher’s Note: The statements, opinions and data contained in all publications are solely those of the individual author(s) and contributor(s) and not of MDPI and/or the editor(s). MDPI and/or the editor(s) disclaim responsibility for any injury to people or property resulting from any ideas, methods, instructions or products referred to in the content. |
© 2023 by the authors. Licensee MDPI, Basel, Switzerland. This article is an open access article distributed under the terms and conditions of the Creative Commons Attribution (CC BY) license (https://creativecommons.org/licenses/by/4.0/).