Abstract
Intraplate volcanic islands are often considered as stable relief with constant vertical motion and used for relative sea-level reconstruction. This study shows that large abrupt mass unloading causes non-negligible isostatic adjustment. The vertical motion that occurs after abrupt mass unloading is quantified using a modeling approach. We show that a giant landslide causes a coastline uplift of 80–110 m for an elastic thickness of 15 km < Te < 20 km in Tahiti. Theoretical cases also reveal that a coastal motion of 1 m occurs for an abrupt mass unloading involving a displaced volume of 0.2 km3 and influences relative sea-level reconstruction. In Tahiti, a change in the subsidence rate of 0.1 mm/yr (from 0.25 to 0.15 mm/year) occurred during the last 6 kyr and could be explained by an abrupt mass unloading involving a minimum volume of 0.2 km3, 6 ± 1 kyr ago.
Keywords:
landslide; erosion; isostasy; subsidence rate; coastline; Tahiti; elastic thickness; relative sea level 1. Introduction
Considerable research efforts have been dedicated to understanding the potentially destructive power of landslides, one of the principal processes responsible for relief destruction. Numerous landslides occur in a volcanic context [1,2,3]. The origin of landslides that occur on volcanic slopes could be related to volcanic processes [2,4,5]. Nevertheless, other causes that can play a role in landslides on volcanic islands include sea-level variations [6]. Although the causes of landslides have been extensively investigated [7,8,9,10,11,12,13], their consequences for vertical movement are less studied.
The volume of rocks involved in a landslide event can vary by many orders of magnitude [14,15], some of which involve volumes equivalent to hundreds of cubic kilometers [1,3,16]. Smith and Wessel (2000) [17] suggested that landslides could cause isostatic rebound on the volcanic island of Hawaii. This phenomenon may have generated shoreline motion in Hawaii [18] and in the Canary Islands [19] associated with other processes. Several large landslides have occurred in the Society archipelago [2], and at least two large landslides involving volumes of 300 and 450 km3 have occurred on Tahiti [2,20,21]. Isostatic rebound after a landslide could be superimposed with other processes, such as rifting, thermal cooling, active volcanism (magma reservoir inflation/deflation), lithospheric flexure produced by the construction of a younger volcano, isostatic rebound after erosion, seismic displacement after a large earthquake, sedimentation, and sea-level change [22].
Nevertheless, intraplate volcanic islands are considered stable platforms subject to constant vertical movement caused by volcanic edifice loading during several kyrs to million yrs [23] and used to estimate sea-level variations during the last 13 kyrs using coral reefs [24,25,26,27]. Absolute sea-level variation during the last million years is due to climatic variations caused by orbital forcing [28,29,30] and more recently by anthropogenic contributions [31]. Discrepancies between local sea-level curves could be due to methodological problems, such as the underestimation of uncertainty, glacio-hydro-isostatic adjustments [32,33], variation in uplift or subsidence rates [34] or complex interaction between tectonic, eustatic variations, and climate in an isolated basin [35,36]. Coral reefs located near the sea surface are used to estimate the position of the sea level during the last kyrs through the age dating and the accurate measurements of altitude or bathymetry of the reefs. After the reconstruction of relative sea-level variations that depends on the local context, absolute sea-level variation curves are obtained by subtracting local vertical movements from the relative sea level.
However, subsidence rates considered for the volcanic island of Tahiti, where a sea-level curve has been reconstructed, are not constant and are estimated at 0.39 mm/yr during the last 500 kyr [37], at 0.2–0.25 mm/yr from 13.8 to 7 kyr (e.g., [25]), at 0.15 mm/yr since 5 kyr [24,27], and at 0.5 mm/yr at the present time using GPS measurements [38], but no explanation is proposed for these differences. This study addresses the quantification of vertical motion caused by isostatic adjustment following a major mass unloading in Tahiti and proposes to interpret variation in vertical movement rates to identify significant previously unrecognized abrupt mass unloading (landslides or erosion).
2. Geological and Geomorphological Setting
The island of Tahiti-Nui is a volcano formed between 1.4 Ma and 230 kyr in the Society archipelago [39,40]. The Society Island chain extends over 750 km from the present hotspot location under Mehetia, more than 100 km southeast of Tahiti, to the northwest [41,42]. The crust beneath the center of the volcanic edifice of Tahiti is approximately 15–20 km thick [43] and decreases radially to a minimum thickness of 7 km away from the center [43]. Lithospheric loading by the volcanic edifice weight is responsible for the subsidence of the island [44,45] and is estimated by reef age (radiocarbon and U-Th) and erosional features to have ranged from 0.15 to 0.39 mm/yr during the last 500 kyr [37,46].
In the case of the northern Tahiti landslide that occurred 872 kyr ago (Figure 1), the length of the landslide deposits ranges from 50 to 80 km, and the maximum width of the landslide deposit is approximately 80–90 km, with a thickness of less than 500 m [21,47]. The landslide scar has a smaller width and length (20–25 km) than the landslide deposit that is located 30 km away and the initial volume before any slide occurs has greater thickness (~2 km, Figure 1B) than the landslide deposit. The significant spreading of the sliding material was caused by the dynamic of the Tahiti landslide that occurred catastrophically, reaching high speeds >125 m/s [48]. Due to high runout and spreading, the landslide deposits are relatively thin and highly porous, whereas the pre-landslide material is composed of thick and dense volcanic material [21].
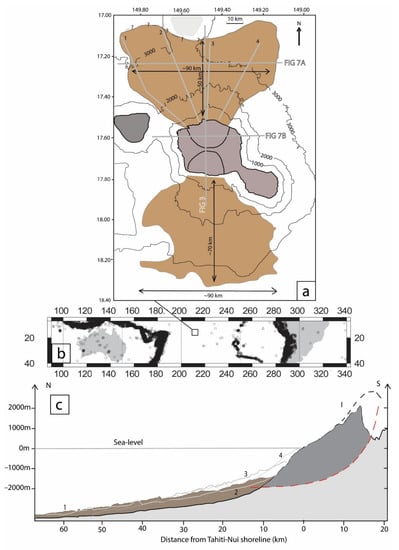
Figure 1.
Map and section of Tahiti Island, French Polynesia. (a) The northern and southern landslide deposits on Tahiti Island are represented in brown. (b) Location of Tahiti in the Pacific Ocean (box) and seismicity M > 4. (c) The section of the northern landslide deposits is represented in brown for profile 1, and the infilling of the scar by volcanic material is in dark grey. The rotational landslide is in red. The locations of profiles 1–4 are shown in (a). Detailed data are provided in [2,21].
After the landslide, a subsequent volcanic eruption occurred and modified the morphology of the original scar [40]. A new shield grew into the northern depression and overtopped the original volcanic structure around 500 kyr ago [21]. When the infilling of the scar was completed, the previous unloading by the landslide material removed from the scar ended around 500 kyr ago. The present mean slope of the volcanic edifice ranges from 6 to 12°, as before the giant collapse [21,49].
3. Materials and Methods
A numerical modeling approach is used to simulate the vertical movement of the lithosphere caused by an abrupt mass unloading (landslide or erosion). This study focuses on the quantification of the effect of the isostatic adjustment due to the abrupt mass unloading. Potential long-term uplift or subsidence caused by other processes could be superimposed with the isostatic adjustment due to the abrupt mass unloading but are not simulated. Concerning the vertical movement in an intraplate position, the initial conditions before any sliding could be considered to be steady state. The abrupt mass unloading transformed the lithosphere from isostatic equilibrium to a configuration that is not in isostatic equilibrium. Consequently, in elastic modeling isostatic restoring stresses immediately acted to regain equilibrium [50]. Isostatic adjustment was calculated using a classical 2D elastic model of the lithosphere [51,52,53]. The lithosphere is considered at isostatic equilibrium before loading or unloading caused by the abrupt mass unloading because no new loading by a volcanic edifice or eruption occurred in Tahiti during the last 200 kyrs. No horizontal forces are considered, and there is no vertical movement at the boundary of the model. The model is sufficiently large to let the area of interest be independent of the boundary condition. In the classical model of a thin infinite elastic plate, 3D flexural isostasy w(x,y) is calculated using the equation [54]:
where zref–z is the missing material thickness after the landslide, ρa and ρv are the densities of asthenosphere and volcanic rock, respectively, g the acceleration of gravity, and D is the rigidity that is calculated considering that:
where E is Young’s modulus, Te is the effective elastic thickness, and ν is Poisson’s ratio. Poisson’s ratio is considered constant at 0.25.
∇2(D∙∇2w(x,y)) + (ρa – ρv) g∙w(x,y) = ρv g[zref(x,y) − z(x,y)]
D = ETe3/[12(1 − ν2)]
In this study, only the 2D flexural isostasy was calculated along the abrupt mass unloading path or perpendicularly to it using the equation:
D (d4w(x)/dx4) + (ρa − ρ) g w(x) = ρv g[zref(x) − z(x)]
Considering that the Tahiti Island is located along a 750 km linear volcanic chain where landslides and erosion occurred, this study permits to analyze the effect of a mass unloading along a volcanic chain on isostatic adjustment. The symmetry axis represented by the linear volcanic chain allowed us to approximate the geological structure by a 2D approach using the section perpendicular to this axis. Nevertheless, even if the present study could be considered as a 2.5 D approach, it is less accurate than a 3D approach when precise volcanic topography, mass unloading, and elastic thickness are known on all the area. These data are not available with a good spatial resolution along the Society archipelago and obtaining them is the aim of this study. The 2D flexural isostasy equation is solved using a finite differences method, with a 10 m step. In the modeling, the volcanic material and the crust have a density of 2800 kg/m3, whereas the density of the mantle is 3300 kg/m3 in agreement with estimates by [55]. The density of water is 1000 kg/m3. The rigidity D of the lithosphere generally ranges from 1021 to 1023 Nm. On the volcanic islands of Tahiti, the elastic thickness estimated using the shape of the crust–mantle elastic boundary ranges from Te = 15 km [43] to Te = 20 km [56], which corresponds to a lithospheric rigidity ranging from D = 1022 – 1023 Nm, respectively. For Tahiti, elastic thickness (Te) values of 15, 20.9, 22.5, and 25 km were estimated by [45], [57], [58] and [44], respectively. In this study, elastic thicknesses of 10, 15, and 20 km were simulated.
In the real world, the vertical movements associated with isostatic rebound take several thousand years to completely relax due to the viscous properties of the lithosphere. A duration of 5–15 kyr can be expected, as suggested by the duration of the isostatic rebound observed in Scandinavia and North America after ice sheet melt (10–15 kyr [59]) and isostatic adjustments associated with deglaciation (5–7 kyr [60]). Here, a duration of 10 kyr to restore equilibrium through vertical motion is considered. Consequently, vertical motion rates are estimated considering a linear vertical displacement during 10 kyr after the loading or unloading, as an average.
The first set of simulations considered unloading by the removed material and loading by landslide deposits of the Tahiti giant landslide that occurred 872 kyr ago. In a 2D model implemented to calculate vertical motion resulting from isostatic adjustment, the geometry considered is a cross-sectional surface rather than a 3D volume (Figure 2). The unloaded triangular landslide surface is calculated using the equation S = BxH/2, where B is the base of the triangular surface, and H is the height (Figure 2a).
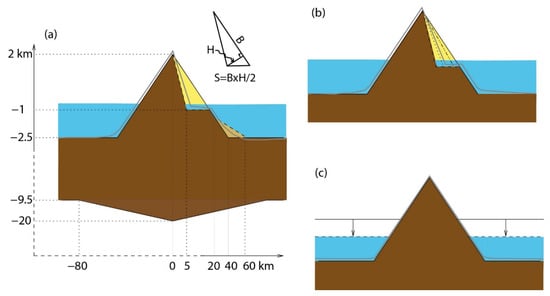
Figure 2.
Geometry of the volcanic island and of the unloading material in yellow considered for modeling the isostatic adjustment. (a) The destabilized and deposited surfaces are illustrated in yellow and light brown, respectively. The crust is up to 20 km thick. The grey line represents the topography after isostatic adjustment. Not to scale. (b) Various landslide geometries were simulated and are represented by dotted/dashed lines. The grey line represents the topography of the volcano after the abrupt mass unloading taking into account the isostatic adjustment. (c) Influence of the sea level lowering on isostatic rebound. Not to scale. In (a), the horizontal scale is not homogeneous to allow the base of the crust and the volcano to be on the same figure and consequently the landslide deposits (brown triangle) seem smaller than the landslide scar (yellow triangle).
A North–South section was constructed considering the geometry of the volcanic edifice and the depth of the crust at Tahiti. To obtain realistic results, the geometry of a landslide that occurred approximately 872 kyr ago in the north of Tahiti Island was used. A volcano with a height of 4.5 km, width of 80 km, and mean slope of 6° was considered before the landslide (increased by erosional and post-landslide processes). Part of the volcano is located below sea level, with only the highest 2 km of the topography of the volcanic edifice above sea level (Figure 2a). The crust is approximately 20 km thick beneath the center of the volcanic edifice and 7 km thick (from a depth of −2.5 km to a depth of −9.5 km; Figure 2a) at 80 km from the center of the volcanic edifice. The material removed during the landslide has a triangular geometry (Figure 2a). The surface of the destabilized material could cover up to 50 × 106 m2 and this amount was removed from the volcanic edifice to quantify the influence of the unloading on deformation (Figure 2a,b). The removed material is composed of volcanic rock [21] and is described in the model using volcanic rock property for the density.
In all the simulations, the shoreline position corresponds to the position of the altitude z = 0 m along the simplified topography of the volcano. The uplift presented is the one at the position of the shoreline before the landslide. The destabilized material was modeled between 0 and 20 km laterally from the summit (Figure 2a). The loading of the volcanic material accumulated at the base of the volcanic edifice due to the landslide deposits spans from x = 20−60 km and has a triangular geometry (Figure 2a). The cross sections of the destabilized and deposited material are triangular and approximatively correspond to the landslide that occurred 872 kyr ago in Tahiti. The thickness of the unloaded material is higher than the thickness of the material deposited by the landslide. The spreading of the landslide deposits generated a relatively thin deposit across a wide area (Figure 1).
In a second set of simulations, isostatic response was implemented to calculate the effect of unloading with different mass and geometry for the abrupt mass unloading while neglecting deposit loading. Various triangular geometries for the abrupt mass unloading section from those comparable to large landslides or erosion (>20 × 106 m2) to those of more usual ones (0.2 × 10⁶ m2) were tested (Figure 2b, Table 1). For a landslide ranging from 2.5 × 10⁶ to 5 × 10⁶ m2, the post-landslide slope was ~9° in the landslide scar area. The deposit’s geometry is difficult to evaluate because variable spreading and runout could take place. The precise spreading depends on the geological context (water or not, lithology, caused by an explosive volcanic eruption or not, etc.), but also on the dynamics of the abrupt mass unloading itself (erosion vs. landslide, slow vs. catastrophic). A realistic “mean” geometry is difficult to quantify. Nevertheless, landslide mobility is generally high, and spreading is significant for large landslides [15,16], reducing the effective weight of the deposit column in comparison to the thick initial material displaced from the destabilized area. Erosion processes cause a mobility higher than landslides and thinner deposits for a specific event. In Tahiti, the material could travel long distances [48] and this is why the loading is neglected. When the mobility and the spreading of the material became infinite, the loading by deposited material became negligible. When the loading of the deposits is not considered, the uplift is overestimated by a small amount in the event of significant mobility and spreading of abrupt mass unloading (erosion or landslide).

Table 1.
Parameters for abrupt mass unloading and flexure simulations.
4. Results
In the modeling, the amplitude of the isostatic adjustment principally depends on the mass displaced (i.e., the section of surface removed or superimposed) and on the flexural rigidity D (i.e., the elastic thickness Te) of the lithosphere. Lower rigidity allows more uplift (Figure 3 and Figure 4). The first set of simulations allowed us to evaluate the interaction between the area where unloading and uplift occurred with the area where loading by the deposited material and subsidence occurred. Modeling results suggest that isostatic deformation affected larger areas than the areas where loading and unloading occurred, due to the mechanical flexure of the lithosphere. It can be observed that the modeled uplift caused by unloading is higher than the modeled subsidence caused by loading (Figure 3a,b). The extent of the area affected by uplift is larger than the area affected by unloading, because the spreading of the deposited material reduces the column weight and also because flexural rigidity distributes the deformations laterally away from the unloaded/loaded column. A length of at least 70 km was affected by uplift due to the flexural rigidity of the lithosphere. Modeled uplift occurred on the volcano flanks above and below sea level (Figure 3). At an altitude of 0 m—the supposed initial coastline level—there are uplifts of 80 m (D = 1023 Nm, i.e., Te = 20 km), 110 m (D = 1022 Nm, i.e., Te = 15 km), and 190 m (D = 1021 Nm, i.e., Te = 10 km) (Figure 4a). The maximum uplift ranges from 85 to 200 m and its position depends on the elastic thickness (Figure 3b).
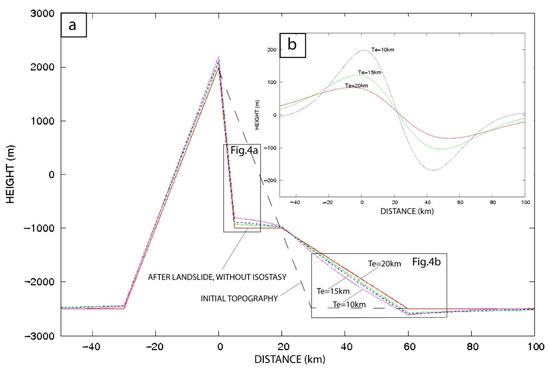
Figure 3.
Vertical movements and unloading effects. (a) Isostatic adjustment after the large Tahiti landslide for three different elastic thicknesses. (b) Absolute vertical movement due to isostatic uplift and subsidence on Tahiti after the large landslide. Three different elastic thickness (Te) values were used (10, 15, and 20 km) to simulate the vertical movement caused by isostatic response after the large landslide.
Figure 4.
Insert of Figure 3. Positions of the surface of the volcano after isostatic adjustment with different Te. Details of vertical movements for Te = 10 km, Te = 15 km, and Te = 20 km. (a) Isostatic adjustment of the coastline after the large landslide that occurred on Tahiti approximately 872 kyr ago. The relict shorelines after isostatic adjustment are represented by blue horizontal arrows for each elastic thickness Te. The new shorelines, after that isostatic response takes place, are represented by blue vertical arrows. (b) The detailed distal part of the volcano where the landslide deposits are located and subsidence occurred. The red line represents the topography of the volcanic island without isostatic deformation. The slope around the coast in the area where the landslide occurred is ~12°.
Due to loading by landslide deposits, a maximum subsidence of 70 m (Te = 20 km), 100 m (Te = 15 km), and 160 m (Te = 10 km) occurred at the foot of the volcano (Figure 3b). The extent of the subsidence depends on the flexural rigidity.
Large landslides (>20 × 106 m2) generate significant deformations (in the case of Figure 3 and Figure 4, the displaced cross-sectional surface was of 22.5 × 10⁶ m2), and moderately sized landslides (2.5 × 10⁶ m2 < S < 5 × 10⁶ m2) also cause non-negligible uplift (Figure 5a,b), which depends on the cross-sectional surface affected by the landslide and the rigidity of the crust. Coastal uplift ranges from 0 m to approximately 160 m for an abrupt mass unloading surface of 0–50 × 106 m2. The calculation was undertaken for various volumes that are summarized in Table 2. More precisely, for a large abrupt mass unloading with a cross-sectional surface removed of 50 × 106 m2 (i.e., a displaced volume of 1000 km3 assuming a width of 20 km), there is 160 m of uplift for elastic thickness Te = 15 km and 135 m of uplift for Te = 20 km (Table 2). For a cross-sectional surface removed of 10 × 106 m2 (i.e., ~50 km3 displaced volume considering a mean width of 5 km), the abrupt mass unloading causes a coastal uplift of 50 m. An abrupt mass unloading with a cross-sectional surface removed of 0.2 × 10⁶ m2 (i.e., ~0.2 km3 displaced volume considering a mean width of 1 km) produces an uplift of 1 m. This last result is comparable with a sea-level lowering of ~4 m that also causes an isostatic adjustment of 1 m (Figure 6).
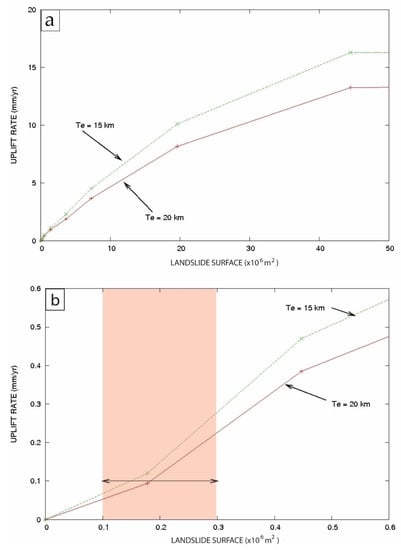
Figure 5.
Vertical motion rate after an abrupt mass unloading due to isostatic adjustment. (a) Influence of the cross-sectional surface of the abrupt mass unloading on the uplift rate considering that the isostatic rebound takes place in 10 kyr. (b) Detail of the uplift rate for abrupt mass unloading cross-sectional surfaces < 0.6 × 10⁶ m2. An uplift rate of 0.1 mm/yr, equivalent to the variation in the subsidence rate in Tahiti, is highlighted by a double arrow. The abrupt mass unloading able to cause an uplift of 0.1 mm/yr ranges from 0.1 × 10⁶ to 0.3 × 10⁶ m2.
Table 2.
Summary of main modeling results.
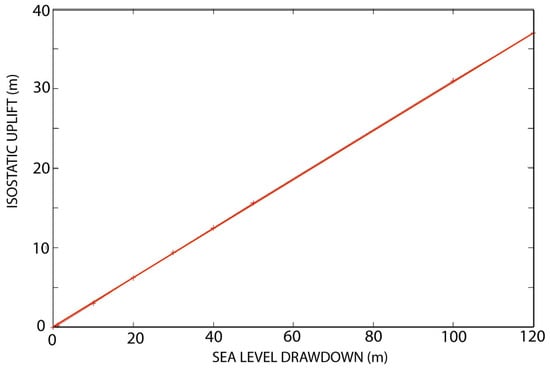
Figure 6.
Coastal uplift due to isostatic rebound triggered by sea-level unloading. Te = 15 km.
A relatively “small” abrupt mass unloading (S = 0.2 × 10⁶ m2 equivalent to 0.2 km3 displaced volume) that cause a 1 m uplift in approximately 10 kyr generates a mean uplift rate VU of 0.1 mm/yr (Figure 5b). This is 100 times smaller than the uplift rate caused by a giant landslide as the one that occurred 872 kyr ago in Tahiti. In this case, the expected uplift is ~100 m and the resulting mean uplift rate is VU = 10 mm/yr (Figure 5a).
The isostatic adjustment was also calculated perpendicularly to the one presented in Figure 3, Figure 4 and Figure 5 and is presented in Figure 7. More precisely, in Figure 7b, the isostatic rebound is modeled in the area of the landslide scar (see Figure 1a for location) and uplift is estimated. In Figure 7a, the isostatic adjustment is modeled where the landslide deposit can be observed (see Figure 1a for location) and significant subsidence is estimated.
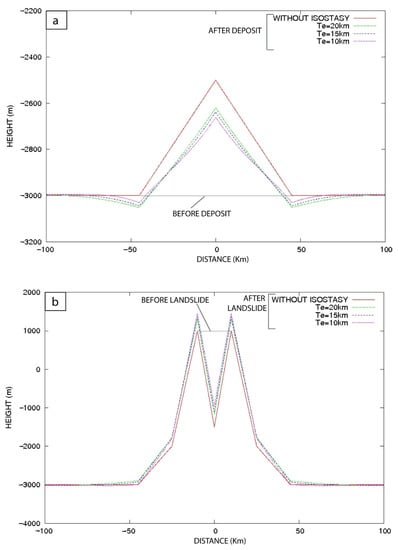
Figure 7.
Modeling of the isostatic adjustment on the Tahiti volcano after a giant landslide (a) in the deposit area, (b) in the landslide scar area. These models are perpendicular to the previous ones presented in Figure 3, Figure 4 and Figure 5. The position of these sections is shown in Figure 1a.
5. Discussion
5.1. Effect of a Giant Landslide on Vertical Motion
The geomorphologic changes associated with isostatic rebound should have been significant in Tahiti after the 872 kyr giant landslide. Modeling results suggest that the shoreline uplifted between 80 and 110m for a Te = 20 km and for a Te = 15 km, respectively. This is comparable with results obtained in Hawaii for a 1200–5000 km3 volume slide considering Te = 25 km [17]. Uncertainty is caused by (i) the 2D numerical approach, (ii) accuracy of the data concerning topography, mass unloading geometry, deposit loading, and elastic thickness. The 3D approach permits to obtain more accurate results, but the lack of accurate data concerning elastic thickness, topography, and mass unloading along the entire Society volcanic chain reduces the benefits of the 3D approach. When unloaded volumes are sub-conical and not elongated along the volcanic chain, a 2D approach could underestimate the isostatic adjustment by a factor 4. The 2D approach is more appropriate to simulate homogeneous mass unloading along the volcanic chain than heterogeneous mass unloading. When heterogeneous mass unloadings are sufficiently close each other, such underestimation is partly reduced. When the elastic thickness estimation is bracketed, the smaller elastic thickness could be chosen to reduce the 2D modeling underestimation of isostatic adjustment in the case of heterogeneous mass unloading. It could also means that the unloading masses are smaller than the one considered here with the 2D approach.
When the coast is uplifted, regressive erosion occurred [61], the relicts of marine terraces are visible [62], or/and cliffs can form on steep coasts [63]. High littoral cliffs circling two-thirds of Tahiti with an elevation ranging from 60 m at the East, approximately 100 m in the North, and approximately 200 m in the West and South could be observed but are considered to have been built during the last 120 kyrs [49] and cannot be related to this giant landslide. Nevertheless, the loading by the formation of a second shield [21] has caused a subsidence that annihilates the previous uplift and the morphological evidence should be offshore. The interpretation of vertical dynamic of volcanic chain must include the potential effect of abrupt mass unloading in perturbing the general trend (i.e., constant subsidence).
5.2. Effect of a Moderate Abrupt Mass Unloading on Vertical Motion
At least 39 landslides have been described in the Society Islands and the Austral volcanic archipelago with various volumes involved [2]. The significant number of landslides recorded in the Society Islands suggests that volcano flank destabilization is a common phenomenon in this area. Small landslides recently occurred in Tahiti where high precipitation rates and weathered rock can be observed [64,65]. Statistically, it has been shown that the number of landslides increases as their volumes decrease [14]. Landslides involving a volume of ~0.2 km3 are relatively common events and should have caused a vertical motion rate variation of ~0.1 mm/year. Abrupt mass unloading could also have been caused by erosion that is significant in Tahiti [49].
An indirect observation of an abrupt mass unloading is possible using vertical motion rates obtained with coral reef age and elevation or depth for sea-level curve reconstruction ([34], Figure 8). At Tahiti, there are some changes between the subsidence rate estimates during the last 5 kyr from the estimates for 13.8–7 kyr. A subsidence rate of 0.15 mm/year was suggested during the last 5 kyr [27,46], whereas another study consider a constant value of 0.2–0.25 mm/year from 13.8 to 7 kyr to calibrate the local sea-level curve reconstructed using coral reef [25]. These different subsidence rates (see [25,27,46]) are necessary to compare Tahitian sea-level curves with other local sea-level curves and permit the coherency of the sea-level reconstruction all over the Earth [25,33]. The comparison of subsidence rate from Pirazzoli et al. (1985) [46], Hallmann et al. (2018) [27] on one hand and Bard et al. (1996) [25] on the other hand suggests that a slowdown of 0.1 mm/year occurred since 6 ± 1 kyr (Figure 9).
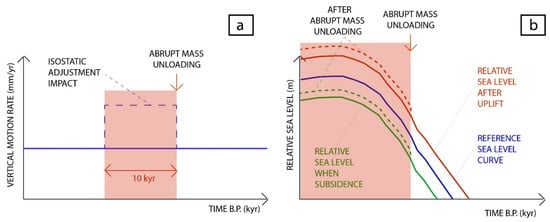
Figure 8.
Schematic effect of an abrupt mass unloading, (a) on vertical motion rate, and (b) on relative sea level in the case of subsidence (green dotted line) or uplift (red dotted line).
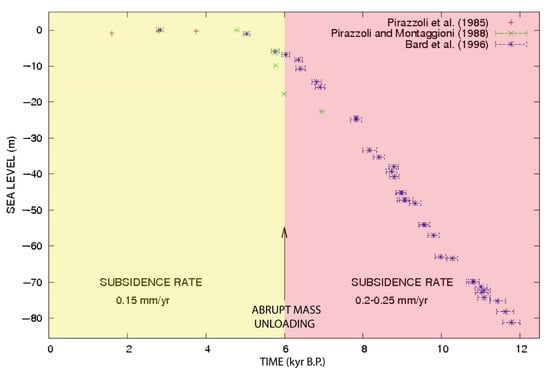
Figure 9.
Sea level and subsidence rates in Tahiti. Sea-level variations and subsidence rates were estimated by [24,27,45] on one hand and [25] on the other hand. For Bard et al., (1996) [25] only samples dated by 14 C are represented for clarity.
When a transient (~10 kyr) uplift rate VU (with VU > 0 by convention) caused by an abrupt mass unloading is contemporaneous with a significant long-term subsidence context (subsidence rate VS < 0 by convention), the observed vertical motion rate became VO = VS + VU and VO < 0 when the subsidence rate is higher than the transient uplift rate caused by the isostatic adjustment (Figure 8). An abrupt mass unloading with a removed cross-sectional surface of 0.2 × 10⁶ m2 (i.e., >0.2 km3 for a width of 1 km) caused an uplift rate VU = 0.1 mm/yr (Figure 5b) that could explain a subsidence rate slowdown of 0.1 mm/yr that occurred since 6 ± 1 kyr at Tahiti. It suggests the occurrence of an abrupt mass unloading 6 ± 1 kyr ago with a volume of 0.2 km3 at Tahiti. This is a minimum value for the abrupt mass unloading size, because the deposits were considered to spread infinitely, that is a more reasonable assumption for erosion and high mobility landslides than for landslides with a reduced mobility. Furthermore, this study assumes linear rates for isostatic adjustment that represent an average, whereas viscoelastic deformations could cause a more progressive decay over time (non-linear evolution) that was not simulated here.
The cliffs observed at Tahiti were explained by a relative sea-level fall of +5 m that took place 7 kyrs ago [49], but any uplift in Tahiti was recorded by the coral reef from 13.8 to 1.6 kyr. Cliff retreat could be interpreted by processes involving erosion, sea-level variation, and vertical movements. Low atmospheric pressure associated with hurricanes causes storm surges and waves of several meters above sea level during a few hours causing significant erosion of sand beaches [66]-Rey et al., 2019, but not of resistant cohesive rock. This process should occur many times to have an impact on resistant cohesive rocks of Tahiti.
5.3. Sea-Level Variation and Water Loading Hypothesis
Other processes could influence vertical movement rates such as (i) lithospheric flexure caused by the loading of a distant new volcano or the load of a new eruption, (ii) isostatic rebound after a sea-level lowering or (iii) a massive erosion, tectonic uplift, or subsidence. These potential effects are discussed hereafter.
A sea-level lowering of less than 1 m was recorded during the last kyr at Tahiti [24,27]. Hallmann et al., (2018) [27] suggested a sea level high stand of +0.9 m from 3.9–3.6 kyr before present in French Polynesia to interpret the marine relict located above present sea level. A sea-level lowering of 1 m generates isostatic uplift of approximately 0.25 m (Figure 6)—equivalent to an uplift rate of 0.025 mm/yr assuming that the equilibrium is reached in ~10 kyr. As a consequence, the unloading due to recent sea-level lowering caused a transient uplift rate of VU = 0.025 mm/yr and cannot explain the decreasing subsidence rates in Tahiti from 0.25 mm/yr between 13.8–7 kyr [25] and 0.15 mm/yr [24,27] during the last ~6 kyr.
5.4. Erosion and Isostatic Response
Other phenomena could also produce isostatic rebound and could be superimposed on subsidence rates caused by volcano loading. Several studies suggested that erosion could generate isostatic uplift [19,51,67], for example, in the volcanic Canary Islands [19]. In Tahiti, regressive erosion is non-negligible [49]. It is well known that regressive erosion is favored by sea-level lowering, uplift, or climatic change [51,61,68]. Erosion in Tahiti has taken place for a long time, just after the formation of the new shield into the giant landslide scar around 500 kyr ago [21]. If no major sea-level fall or climatic change has taken place in Tahiti since 6 kyr, no major erosion change could have taken place to explain the variation in the subsidence rate. Rainfall variations during the last thousand years in Tahiti are not estimated to our knowledge.
5.5. Volcano Loading and Vertical Motion
Lithospheric loading by a new volcanic edifice could have modified the flexure and changed the subsidence rate [69]. Around 100 km to the south-east of Tahiti, Mehetia Island is dated 70–75 kyr at the base of its stratigraphic piles [70], but younger events up to 3 kyr are recorded [39,70]. At 50 km to the east of Tahiti, Teahitia seamount age is estimated to be between 380 and 50 kyr old [39]. However, Teahitia seamount is still active [71]. It cannot be excluded that the growth of Mehetia and Teahitia volcanos could have influenced the flexure of the lithosphere beneath Tahiti during the Holocene. An elastic thickness of 10–20 km, compatible with a crust thickness of 12–20 km beneath volcanos in the Society archipelago [43,56,72], could generate flexure at a distance of >100 km. Nevertheless, the amount of volcanic material potentially accumulated during the last thousand years on Mehetia Island and Teahitia seamounts is still unknown, and its influence might be negligible comparatively to other processes nearer to Tahiti.
Other processes such as a permanent deformation associated with strong earthquakes are not appropriate to explain the change in the subsidence rate of Tahiti. Tahiti is located in an intraplate area where seismicity with a magnitude M > 4 is not usual. Volcano-seismic activity is located more than 40 km away from Tahiti at Teahitia [71] and more than 100 km away from Tahiti at Mehetia [73].
5.6. Triggering Mechanism of Paleo-Landslides
Paleo-landslides in Tahiti could occur after (i) a volcanic activity, (ii) a significant sea-level rise, or (iii) a climatic change. The consequences of a water-level increase on the triggering of landslides have been evidenced in the case of the Vajont landslide (1963, Italy) [11,13,74], suggested in the case of volcanic islands [6,12] or on continental margins [9]. Contemporaneously with Quaternary sea-level rise, climatic conditions have changed. Increase in precipitation causes pore pressure increases and triggers landslides [4,75]. Highly weathered rocks in wet climatic conditions cause the weakening of geomechanical parameters (cohesion, angle of friction) and favor volcano flank destabilization [76]. Alternatively, volcanic activity such as pressure reservoir variation could have caused deformation and slip on a preexisting fault [77] favoring slope destabilization.
6. Conclusions
Coastal uplift generated by isostatic vertical displacements after an abrupt mass unloading was quantified. Landslides or erosion generate non-negligible isostatic adjustment on intraplate volcanic islands. Coastal uplift ranges from 1 to 50 m for abrupt mass unloading surfaces ranging from 0.2 × 10⁶ to 10 × 106 m2. A large abrupt mass unloading of approximately 22.5 × 10⁶ m2 (i.e., 450 km3 displaced volume), such as the one that occurred on Tahiti Island approximately 872 kyr ago, generates a coastline uplift of 80–110 m depending on the flexural rigidity of the lithosphere. A potential abrupt mass unloading with a cross-sectional displaced surface of 0.2 × 10⁶ m2 (i.e., 0.2 km3 displaced volume considering an abrupt mass unloading width of 1 km) could explain a variation in subsidence rate of 0.1 mm/yr observed since 6 ± 1 kyr ago at Tahiti. This quantitative approach has permitted to identify a probable abrupt mass unloading (significant landslide or erosion) that was previously unrecognized. This method could permit detection of past-unknown abrupt mass unloading and to interpret unexplained variations in vertical motion rates and could be improved by implementing a 3D approach.
Funding
J.G. received funding from the French National Agency for Research (ANR Relev).
Data Availability Statement
Not applicable.
Acknowledgments
The two anonymous reviewers are acknowledged for their constructive comments.
Conflicts of Interest
The authors declare no conflict of interest.
References
- Blahüt, J.; Balek, J.; Klimeš, J.; Rowberry, M.; Kusák, M.; Kalina, J. A comprehensive global database of giant landslides on volcanic islands. Landslides 2019, 16, 2045–2052. [Google Scholar] [CrossRef]
- Clouard, V.; Bonneville, A. Submarine Landslides in French Polynesia. In Oceanic Hotspots; Hekinian, R., Cheminée, J.L., Stoffers, P., Eds.; Springer: Berlin, Germany, 2004; pp. 209–238. [Google Scholar] [CrossRef]
- Moore, J.G.; Bryan, W.B.; Beeson, M.H.; Normark, W.R. Giant blocks in the South Kona landslide, Hawaii. Geology 1995, 23, 125–128. [Google Scholar] [CrossRef]
- Cervelli, P.; Segall, P.; Johnson, K.; Lisowski, M.; Miklius, A. Sudden aseismic fault slip on the south flank of Kilauea volcano. Nature 2002, 415, 1014–1018. [Google Scholar] [CrossRef] [PubMed]
- Le Corvec, N.; Walter, T.R. Volcano spreading and fault interaction influenced by rift zone intrusions: Insights from analogue experiments analyzed with digital image correlation technique. J. Volcanol. Geotherm. Res. 2009, 183, 170–182. [Google Scholar] [CrossRef]
- Quidelleur, X.; Hildenbrand, A.; Samper, A. Causal link between Quaternary paleoclimatic changes and volcanic islands evolution. Geophys. Res. Lett. 2008, 35, L02303. [Google Scholar] [CrossRef]
- Carracedo, J.C.; Day, S.J.; Guillou, H.; Pérez Torrado, F.J. Large Quaternary landslides in the evolution of La Palma and El Hierro, Canary Islands. J. Volcanol. Geotherm. Res. 1999, 94, 169–190. [Google Scholar] [CrossRef]
- Crozier, M.J. Deciphering the effect of climate change on landsliding activity: A review. Geomorphology 2010, 124, 260–267. [Google Scholar] [CrossRef]
- Gargani, J.; Bache, F.; Jouannic, G.; Gorini, C. Slope destabilization during the Messinian Salinity Crisis. Geomorphology 2014, 213, 128–138. [Google Scholar] [CrossRef]
- Hampel, A.; Hetzel, R. Slip reversals on active normal faults related to the inflation and deflation of magma chambers: Numerical modelling with application to the Yellowstone-Teton region. Geophys. Res. Lett. 2008, 35, L07301. [Google Scholar] [CrossRef]
- Kilburn, C.R.J.; Petley, D.N. Forecasting giant, catastrophic slope collapse: Lessons from Vajont, Northern Italy. Geomorphology 2003, 54, 21–32. [Google Scholar] [CrossRef]
- McMurtry, G.M.; Watts, P.; Fryer, G.J.; Smith, J.R.; Imamura, F. Giant landslides, mega-tsunamis, and paleo-sea level in the Hawaiian Islands. Mar. Geol. 2004, 203, 219–233. [Google Scholar] [CrossRef]
- Veveakis, E.; Vardoulakis, I.; Di Toro, G. Thermoporomechanics of creeping landslides: The 1963 Vaiont slide, northern Italy. J. Geophys. Res. 2007, 112, F03026. [Google Scholar] [CrossRef]
- Brunetti, M.T.; Guzzetti, F.; Rossi, M. Probability distributions of landslide volumes. Nonlinear Process. Geophys. 2009, 16, 179–188. [Google Scholar] [CrossRef]
- Staron, L.; Lajeunesse, E. Understanding how volume affects the mobility of dry debris flows. Geophys. Res. Lett. 2009, 36, L12402. [Google Scholar] [CrossRef]
- De Blasio, F.V. Frontal Aureole Deposit on Acheron Fossae ridge as evidence for landslide-generated tsunami on Mars. Planet. Space Sci. 2020, 187, 104911. [Google Scholar] [CrossRef]
- Smith, J.R.; Wessel, P. Isostatic consequences of giant landslides on the Hawaiian ridge. Pure Appl. Geophys. 2000, 157, 1097–1114. [Google Scholar] [CrossRef]
- Keating, B.H.; Helsley, C.H. The ancient shorelines of Lanai, Hawaii, revisited. Sediment. Geol. 2002, 150, 3–15. [Google Scholar] [CrossRef]
- Menendez, I.; Silva, P.G.; Martin-Betancor, M.; Pérez-Torrado, F.J.; Guillou, H.; Scaillet, S. Fluvial dissection, isostatic uplift, and geomorphological evolution of volcanic islands (Gran Canaria, Canary Islands, Spain). Geomorphology 2008, 102, 189–203. [Google Scholar] [CrossRef]
- Clouard, V.; Bonneville, A.; Gillot, P.-Y. A large landslide on the southern flank of Tahiti Island, French Polynesia. Geophys. Res. Lett. 2001, 28, 2253–2256. [Google Scholar] [CrossRef]
- Hildenbrand, A.; Gillot, P.-Y.; Bonneville, A. Offshore evidence for a huge landslide of the northern flank of Tahiti-Nui (French Polynesia). Geochem. Geophys. Geosyst. 2006, 7, Q03006. [Google Scholar] [CrossRef]
- Ramalho, R.S.; Quartau, R.; Trenhaile, A.S.; Mitchell, N.C.; Woodroffe, C.D.; Avila, S.P. Coastal evolution on volcanic oceanic islands: A complex interplay between volcanism, erosion, sedimentation sea-level and biogenic production. Earth-Sci. Rev. 2013, 127, 140–170. [Google Scholar] [CrossRef]
- Lambeck, K. Volcanic Loading and Isostasy. In Encyclopedia of Modern Coral Reefs; Encyclopedia of Earth Sciences, Series; Hopley, D., Ed.; Springer: Dordrecht, The Neitherland, 2011. [Google Scholar] [CrossRef]
- Pirazzoli, P.A.; Montaggioni, L.F. The 7000 yr sea-level curve in French Polynesia: Geodynamic implications for mid-plate volcanic islands. In Proceedings of the 6th International Coral Reef Symposium, Townsville, Australia, 8–12 August 1988; Volume 3, pp. 467–472. [Google Scholar]
- Bard, E.; Hamelin, B.; Arnold, M.; Montaggioni, L.; Cabiosh, G.; Faure, G.; Rougerie, F. Deglacial sea-level record from Tahiti corals and the timing of global meltwater discharge. Nature 1996, 382, 241–244. [Google Scholar] [CrossRef]
- Bard, E.; Hamelin, B.; Delanghe-Sabatier, D. Deglacial Meltwater Pulse 1B and Younger Dryas Sea Levels Revisited with Boreholes at Tahiti. Science 2010, 327, 1235–1237. [Google Scholar] [CrossRef]
- Hallmann, N.; Camoin, G.; Eisenhauer, A.; Botella, G.A.; Milne, C.; Vella, E.; Samankassou, V.; Pothin, P.; Dussouillez, J.; Fleury, J.; et al. Ice volume and climate changes from a 6000 year sea-level record in French Polynesia. Nat. Commun. 2018, 9, 285. [Google Scholar] [CrossRef]
- Miller, K.G.; Kominz, M.A.; Browning, J.V.; Wright, J.D.; Mountain, G.S.; Katz, M.E.; Cramer, B.S.; Cristie-Blick, N.; Pekar, S. The Phanerozoic record of global sea-level change. Science 2005, 310, 1293–1298. [Google Scholar] [CrossRef]
- Milne, G.A.; Gehrels, W.R.; Hughes, C.W.; Tamisiea, M.E. Identifying the causes of sea-level change. Nat. Geosci. 2009, 2, 471–478. [Google Scholar] [CrossRef]
- Laskar, J.; Robutel, P.; Joutel, F.; Gastineau, M.; Correia, A.C.M.; Levrard, B. A long-term numerical solution for the insolation quantities of the Earth. Astron. Astrophys. 2004, 428, 261–285. [Google Scholar] [CrossRef]
- Sahagian, D.L.; Schwartz, F.W.; Jacobs, D.K. Direct anthropogenic contributions to sea level rise in the twentieth century. Nature 1994, 367, 54–57. [Google Scholar] [CrossRef]
- Bard, E.; Hamelin, B.; Deschamps, P.; Camoin, G. Comment on « Younger Dryas Sea level and meltwater pulse 1B recorded in Barbados reefal crest coral Acropora palmata » by N.A. Abdul et al. Paleoceanography 2016, 31, 1603–1608. [Google Scholar] [CrossRef]
- Abdul, N.A.; Mortlock, R.A.; Wright, J.D.; Fairbank, R.G. Younger Dryas sea level and meltwater pulse 1B recorded in Barbasdos reef crest coral Acropora palmate. Paleoceanogr. Paleoclimatol. 2016, 31, 330–344. [Google Scholar] [CrossRef]
- Gargani, J. Relative sea level and abrupt mass unloading in Barbados during the Holocene. Geomorphology 2022, 413, 108353. [Google Scholar] [CrossRef]
- Gargani, J.; Rigollet, C. Mediterranean Sea level variations during the Messinian Salinity Crisis. Geophys. Res. Lett. 2007, 34, L10405. [Google Scholar] [CrossRef]
- Gargani, J.; Moretti, I.; Letouzey, J. Evaporite accumulation during the Messinian Salinity Crisis: The Suez Rift Case. Geophys. Res. Lett. 2008, 35, L02401. [Google Scholar] [CrossRef]
- Thomas, A.L.; Fujita, K.; Iryu, Y.; Bard, E.; Cabioch, G.; Camoin, G.; Cole, J.E.; Deschamps, P.; Durand, N.; Hamelin, B.; et al. Assessing subsidence rates and paleo water-depths for Tahiti reefs using U-Th chronology of altered corals. Mar. Geol. 2012, 295–298, 86–94. [Google Scholar] [CrossRef]
- Fadil, A.; Sichoix, L.; Barriot, J.-P.; Ortega, P.; Willis, P. Evidence for a slow subsidence of the Tahiti Island from GPS, DORIS, and combined satellite altimetry and tide gauge sea level records, C.R. Geoscience 2011, 1856, 323–378. [Google Scholar] [CrossRef]
- Clouard, V.; Bonneville, A. Ages of seamounts, islands, and plateaus on the Pacific plate. In Plates, Plumes and Paradigms; Geological Society of America Special Papers; Geological Society of America: Boulder, CO, USA, 2005; p. 338. [Google Scholar] [CrossRef]
- Le Roy, I. Evolution des volcans en systeme de point chaud: Ile de Tahiti, Archipel de la Societe (Polynesie Francaise). Ph.D. Thesis, University Paris 11, Orsay, France, 1994; 276p. [Google Scholar]
- Duncan, R.A.; McDougall, I. Linear volcanism in French Polynesia. J. Volcanol. Geotherm. Res. 1976, 1, 197–227. [Google Scholar] [CrossRef]
- Munschy, M.; Antoine, C.; Guille, G.; Guillou, H. La croûte océanique et les points chauds de la Polynésie Française (Océan Pacifique central). Géol. Fr. 1998, 3, 5–13. [Google Scholar]
- Patriat, M.; Klingelhoefer, F.; Aslanian, D.; Contrucci, I.; Gutscher, M.-A.; Talandier, J.; Avedik, F.; Francheteau, J.; Weigel, W. Deep crustal structure of the Tuamotu plateau and Tahiti (French Polynesia) based on seismic refraction data. Geophys. Res. Lett. 2002, 29, 1. [Google Scholar] [CrossRef]
- Grevemeyer, I.; Weigel, W.; Schüssler, S.; Avedik, F. Crustal and upper mantle seismic structure and lithospheric flexure along the society Island hotspot chain. Geophys. J. Int. 2001, 147, 123–140. [Google Scholar] [CrossRef][Green Version]
- Lambeck, K. Flexure of the ocean lithosphere from island uplift, bathymetry and geoid observations: The Society Islands. Geophys. J. R. Astr. Soc. 1981, 67, 91–114. [Google Scholar] [CrossRef]
- Pirazzoli, P.A.; Montaggioni, L.F.; Delibrias, G.; Faure, G.; Salvat, B. Late Holocene sea-level changes in the Society Islands and in the northwest Tuamotu Atolls. In Proceedings of the Fifth International Coral Reef Congress, Tahiti, France, 27 May–1 June 1985; Gabrie, C., Toffart, J.L., Salvat, B., Eds.; Volume 3, pp. 131–136. [Google Scholar]
- Hildenbrand, A.; Gillot, P.-Y.; Marlin, C. Geomorphological study of long-term erosion on a tropical volcanic ocean island: Tahiti-Nui (French Polynesia). Geomorphology 2008, 93, 460–481. [Google Scholar] [CrossRef]
- Gargani, J. Modelling the mobility and dynamics of a large Tahitian landslide using runout distance. Geomorphol. Geomorphol. 2020, 370, 107354. [Google Scholar] [CrossRef]
- Ye, F.Y.; Barriot, J.P.; Carretier, S. Initiation and recession of the fluvial knickpoints of the Island of Tahiti (French Polynesia). Geomorphology 2013, 186, 162–173. [Google Scholar] [CrossRef]
- Watts, A.B. Isostasy and Flexure of the Lithosphere; Cambridge University Press: New York, NY, USA, 2001. [Google Scholar]
- Gargani, J. Modelling of the erosion in the Rhone valley during the Messinian crisis (France). Quat. Int. 2004, 121, 13–22. [Google Scholar] [CrossRef]
- Gargani, J.; Rigollet, C.; Scarselli, S. Istostatic response and geomorphological evolution of the Nile valley during the Messinian salinity crisis. Bull. Soc. Geol. Fr. 2010, 181, 19–26. [Google Scholar] [CrossRef]
- Weissel, J.K.; Karner, G.D. Flexural uplift of rift flanks due to mechanical unloading of the lithosphere during extension. J. Geophys. Res. 1989, 94, 13919–13950. [Google Scholar] [CrossRef]
- Turcotte, D.L.; Schubert, G. Geodynamics, 2nd ed.; Cambridge University Press: New York, NY, USA, 2001; p. 456. [Google Scholar]
- Clouard, V.; Bonneville, A.; Barsczus, H.G. Size and depth of ancient magma chambers under atolls and islands of French Polynesia using detailed gravity data. J. Geophys. Res. 2000, 105, 8173–8192. [Google Scholar] [CrossRef]
- Calmant, S.; Cazenave, A. Anomalous elastic thickness of the oceanic lithosphere in the south-central Pacific. Nature 1987, 328, 236–238. [Google Scholar] [CrossRef]
- Cazenave, A.; Lago, B.; Dominh, K.; Lambeck, K. On the response of the ocean lithosphere to seamount loads from Geos 3satellite radar altimeter observations. Geophys. J. R. Astr. Soc. 1980, 63, 233–252. [Google Scholar] [CrossRef]
- Goodwillie, A.M.; Watts, A.B. An altimetric and bathymetric study of elastic thickness in the central Pacific Ocean. Earth Planet. Sci. Lett. 1993, 118, 311–326. [Google Scholar] [CrossRef]
- Van der Wal, W.; Wu, P.; Wang, H.; Sideris, M.G. Sea levels and uplift rate from composite rheology in glacial isostatic adjustment modelling. J. Geodyn. 2010, 50, 38–48. [Google Scholar] [CrossRef]
- Mitrovica, J.X.; Forte, A.M.; Simons, M. A reappraisal of postglacial decay times from Richmond Gulf and James Bay, Canada. Geophys. J. Int. 2000, 142, 783–800. [Google Scholar] [CrossRef]
- Loget, N.; Van Den Driessche, J. Wave train model for knickpoint migration. Geomorphology 2009, 106, 376–382. [Google Scholar] [CrossRef]
- Binnie, A.; Tibor, J.D.; Binnie, S.A.; Victor, P.; Gonzalez, G.; Boltena, A. Accelerated late quaternary uplift revealed by 10Be exposure dating of marine terraces, Mejillones Peninsula, northern Chile. Quat. Geochronol. 2016, 36, 12–27. [Google Scholar] [CrossRef]
- Martinod, J.; Regard, V.; Riquelme, R.; Aguilar, G.; Guillaume, B.; Carretier, S.; Cortes, J.; Leanni, L.; Hérail, G. Pleistocene uplift, climate and morphological segmentation ofthe northern Chile coasts (24S–32S): Insights from cosmogenic10Be dating of paleoshorelines. Geomorphology 2016, 274, 78–91. [Google Scholar] [CrossRef]
- Guillande, R.; Gelugne, P.; Bardintzeff, J.-M.; Brousse, R.; Chorowicz, J.; Deffontaines, B.; Parrot, J.-F. Cartographie automatique de zones à aléas de mouvements de terrain sur l’île de Tahiti à partir de données digitale. Bull. Soc. Geol. Fr. 1993, 164, 577–583. [Google Scholar]
- Parkes, A.; Teller, J.T.; Flenlev, J.R. Environmental history of the lake Vaihiria drainage basin, Tahiti French Polynesia. J. Biogeogr. 1992, 19, 431–447. [Google Scholar] [CrossRef]
- Rey, T.; Leone, F.; Candela, T.; Belmadani, A.; Palany, P.; Krien, Y.; Cécé, R.; Gherardi, M.; Péroche, M.; Zahibo, N. Coastal processes and influence on damage to urban structures during hurricane Irma (St-Martin and St-Barthélemy, French West Indies). J. Mar. Sci. Eng. 2019, 7, 215. [Google Scholar] [CrossRef]
- Gargani, J. Eustatisme, érosion et isostasie flexurale: Modélisation numérique appliquée au Rhône messinien. C.R. Geosci. 2004, 336, 901–907. [Google Scholar] [CrossRef]
- Gargani, J.; Stab, O.; Cojan, I.; Brulhet, J. Modelling the long-term fluvial erosion of the river Somme during the last million years. Terra Nova 2006, 18, 118–129. [Google Scholar] [CrossRef]
- Lemoine, A.; Briole, P.; Bertil, D.; Roullé, A.; Foumelis, M.; Thinon, I.; Raucoules, D.; de Michele, M.; Valty, P.; Hoste Colomer, R. The 2018–2019 seismo-volcanic crisis east ofMayotte, Comoros islands: Seismicity and ground deformation markers of an exceptional submarine eruption. Geophys. J. Int. 2020, 223, 22–44. [Google Scholar] [CrossRef]
- Binard, N.; Maury, R.C.; Guille, G.; Talandier, J.; Gillot, P.Y.; Cotton, J. Mehetia Island, South Pacific; geology and petrology of the emerged part of the Society hot spot. J. Volcanol. Geotherm. Res. 1993, 55, 239–260. [Google Scholar] [CrossRef]
- German, C.R.; Resing, J.A.; Xu, G.; Yeo, I.A.; Walker, S.L.; Devey, C.W.; Moffett, J.W.; Cutter, G.A.; Hyvernaud, O.; Reymond, D. Hydrothermal Activity and Seismicity at Teahitia Seamount: Reactivation of the Society Islands Hotspot? Front. Mar. Sci. 2020, 7, 73. [Google Scholar] [CrossRef]
- Sichoix, L. Le Volcanisme de Polynésie Française: Caractérisation Des Points Chauds et du Superbombement à Partir D’une Nouvelle Synthèse Bathymétrique. Ph.D. Thesis, University of French Polynesia, Papeete, Tahiti, 1997; p. 297. [Google Scholar]
- Talandier, J.; Okal, E.A. The volcanoseismic swarms of 1981–1983 in the Tahiti Mehetia area, French Polynesia. J. Geophys. Res. 1984, 89, 11216–11234. [Google Scholar] [CrossRef]
- Muller-Salzburg, L. The Vajont catastrophe—A personnal review. Eng. Geol. 1987, 24, 423–444. [Google Scholar] [CrossRef]
- Gargani, J.; Abdessadok, S.; Tudryn, A.; Chapon Sao, C.; Dambricourt, A.; Gaillard, C.; Moigne, A.-M.; Singh, M.; Bhardwaj, V.; Karir, B. Geology and Geomorphology of Masol paleonto-archeological site, Late Pliocene, Chandigarh, Siwalik Frontal Range, NW India. C. R. Palevol 2016, 15, 379–391. [Google Scholar] [CrossRef]
- Rodriguez-Losada, J.A.; Hernandez-Gutérrez, L.E.; Olalla, C.; Perucho, A.; Serrano, A.; Eff-Darwich, A. Geomechanical parameters of intact rocks and rock masses from the Canary Islands: Implications on their flank stability. J. Volcanol. Geotherm. Res. 2009, 182, 67–75. [Google Scholar] [CrossRef]
- Gargani, J.; Geoffroy, L.; Gac, S.; Cravoisier, S. Fault slip and Coulomb stress variations around a pressured magma reservoir: Consequences on seismicity and magma intrusion. Terra Nova 2006, 18, 403–411. [Google Scholar] [CrossRef]
Publisher’s Note: MDPI stays neutral with regard to jurisdictional claims in published maps and institutional affiliations. |
© 2022 by the author. Licensee MDPI, Basel, Switzerland. This article is an open access article distributed under the terms and conditions of the Creative Commons Attribution (CC BY) license (https://creativecommons.org/licenses/by/4.0/).