Abstract
The United Downs Deep Geothermal Project (UDDGP) is designed to utilize a presumably permeable steep dipping fault damage zone (constituting the hydrothermal reservoir in a very low permeability granitic host rock) for fluid circulation and heat extraction between an injection well at 2.2 km depth (UD−2) and a production well at 5 km depth (UD−1). Soft hydraulic stimulation was performed to increase the permeability of the reservoir. Numerical simulations are performed to analyze the hydraulic stimulation results and evaluate the increase in permeability of the reservoir. Experimental and field data are used to characterize the initial reservoir static model. The reservoir is highly fractured, and two distinct fracture networks constitute the equivalent porous matrix and fault zone, respectively. Based on experimental and field data, stochastic discrete fracture networks (DFN) are developed to mimic the reservoir permeability behavior. Due to the large number of fractures involved in the stochastic model, equivalent permeability fields are calculated to create a model which is computationally feasible. Hydraulic test and stimulation data from UD−1 are used to modify the equivalent permeability field based on the observed difference between the real fractured reservoir and the stochastic DFN model. Additional hydraulic test and stimulation data from UD−2 are used to validate this modified permeability. Results reveal that the equivalent permeability field model derived from observations made in UD−1 is a good representation of the actual overall reservoir permeability, and it is useful for future studies. The numerical simulation results show the amount of permeability changes due to the soft hydraulic stimulation operation. Based on the validated permeability field, different flow rate scenarios of the petrothermal doublet and their respective pressure evolution are examined. Higher flow rates have a strong impact on the pressure evolution. Simulations are performed in the acidized enhanced permeability region to make a connection between the ongoing laboratory works on the acid injection and field response to the possible acidizing stimulation.
1. Introduction
Petrothermal systems are reservoirs with preferably high heat flow, geothermal gradient, and temperature, but lack sufficient natural fluid flow (in most cases) and permeability to accommodate flow rates required for economic geothermal systems. In such geothermal play types, enhanced geothermal systems (EGS) can be implemented by creating new fractures or stimulating naturally existing ones to achieve the permeabilities needed for economical fluid flow. This is essential to create a connected network of pathways between the injection well and production well [1]. Achieving economic flow rates at wellhead is the goal of any stimulation operation [2]. There are different techniques of stimulating fractures: (i) hydraulic stimulation, where water is injected at high pressure to enhance the permeability; (ii) chemical stimulation, where acids are injected to dissolve fracture mineralization and thus increase the permeability; and (iii) thermal stimulation, where cold water injection creates thermal stress in the reservoir rock which helps in increasing the permeability of the fracture network [3]. The latter is usually best applicable in very high-temperature reservoirs. In this paper, the impact of hydraulic stimulation on the permeability enhancement of naturally occurring fractures in the fault zone through Thermo-Hydraulic (TH) modeling of the United Down Deep Geothermal Project (UDDGP) at Cornwall, UK, is discussed.
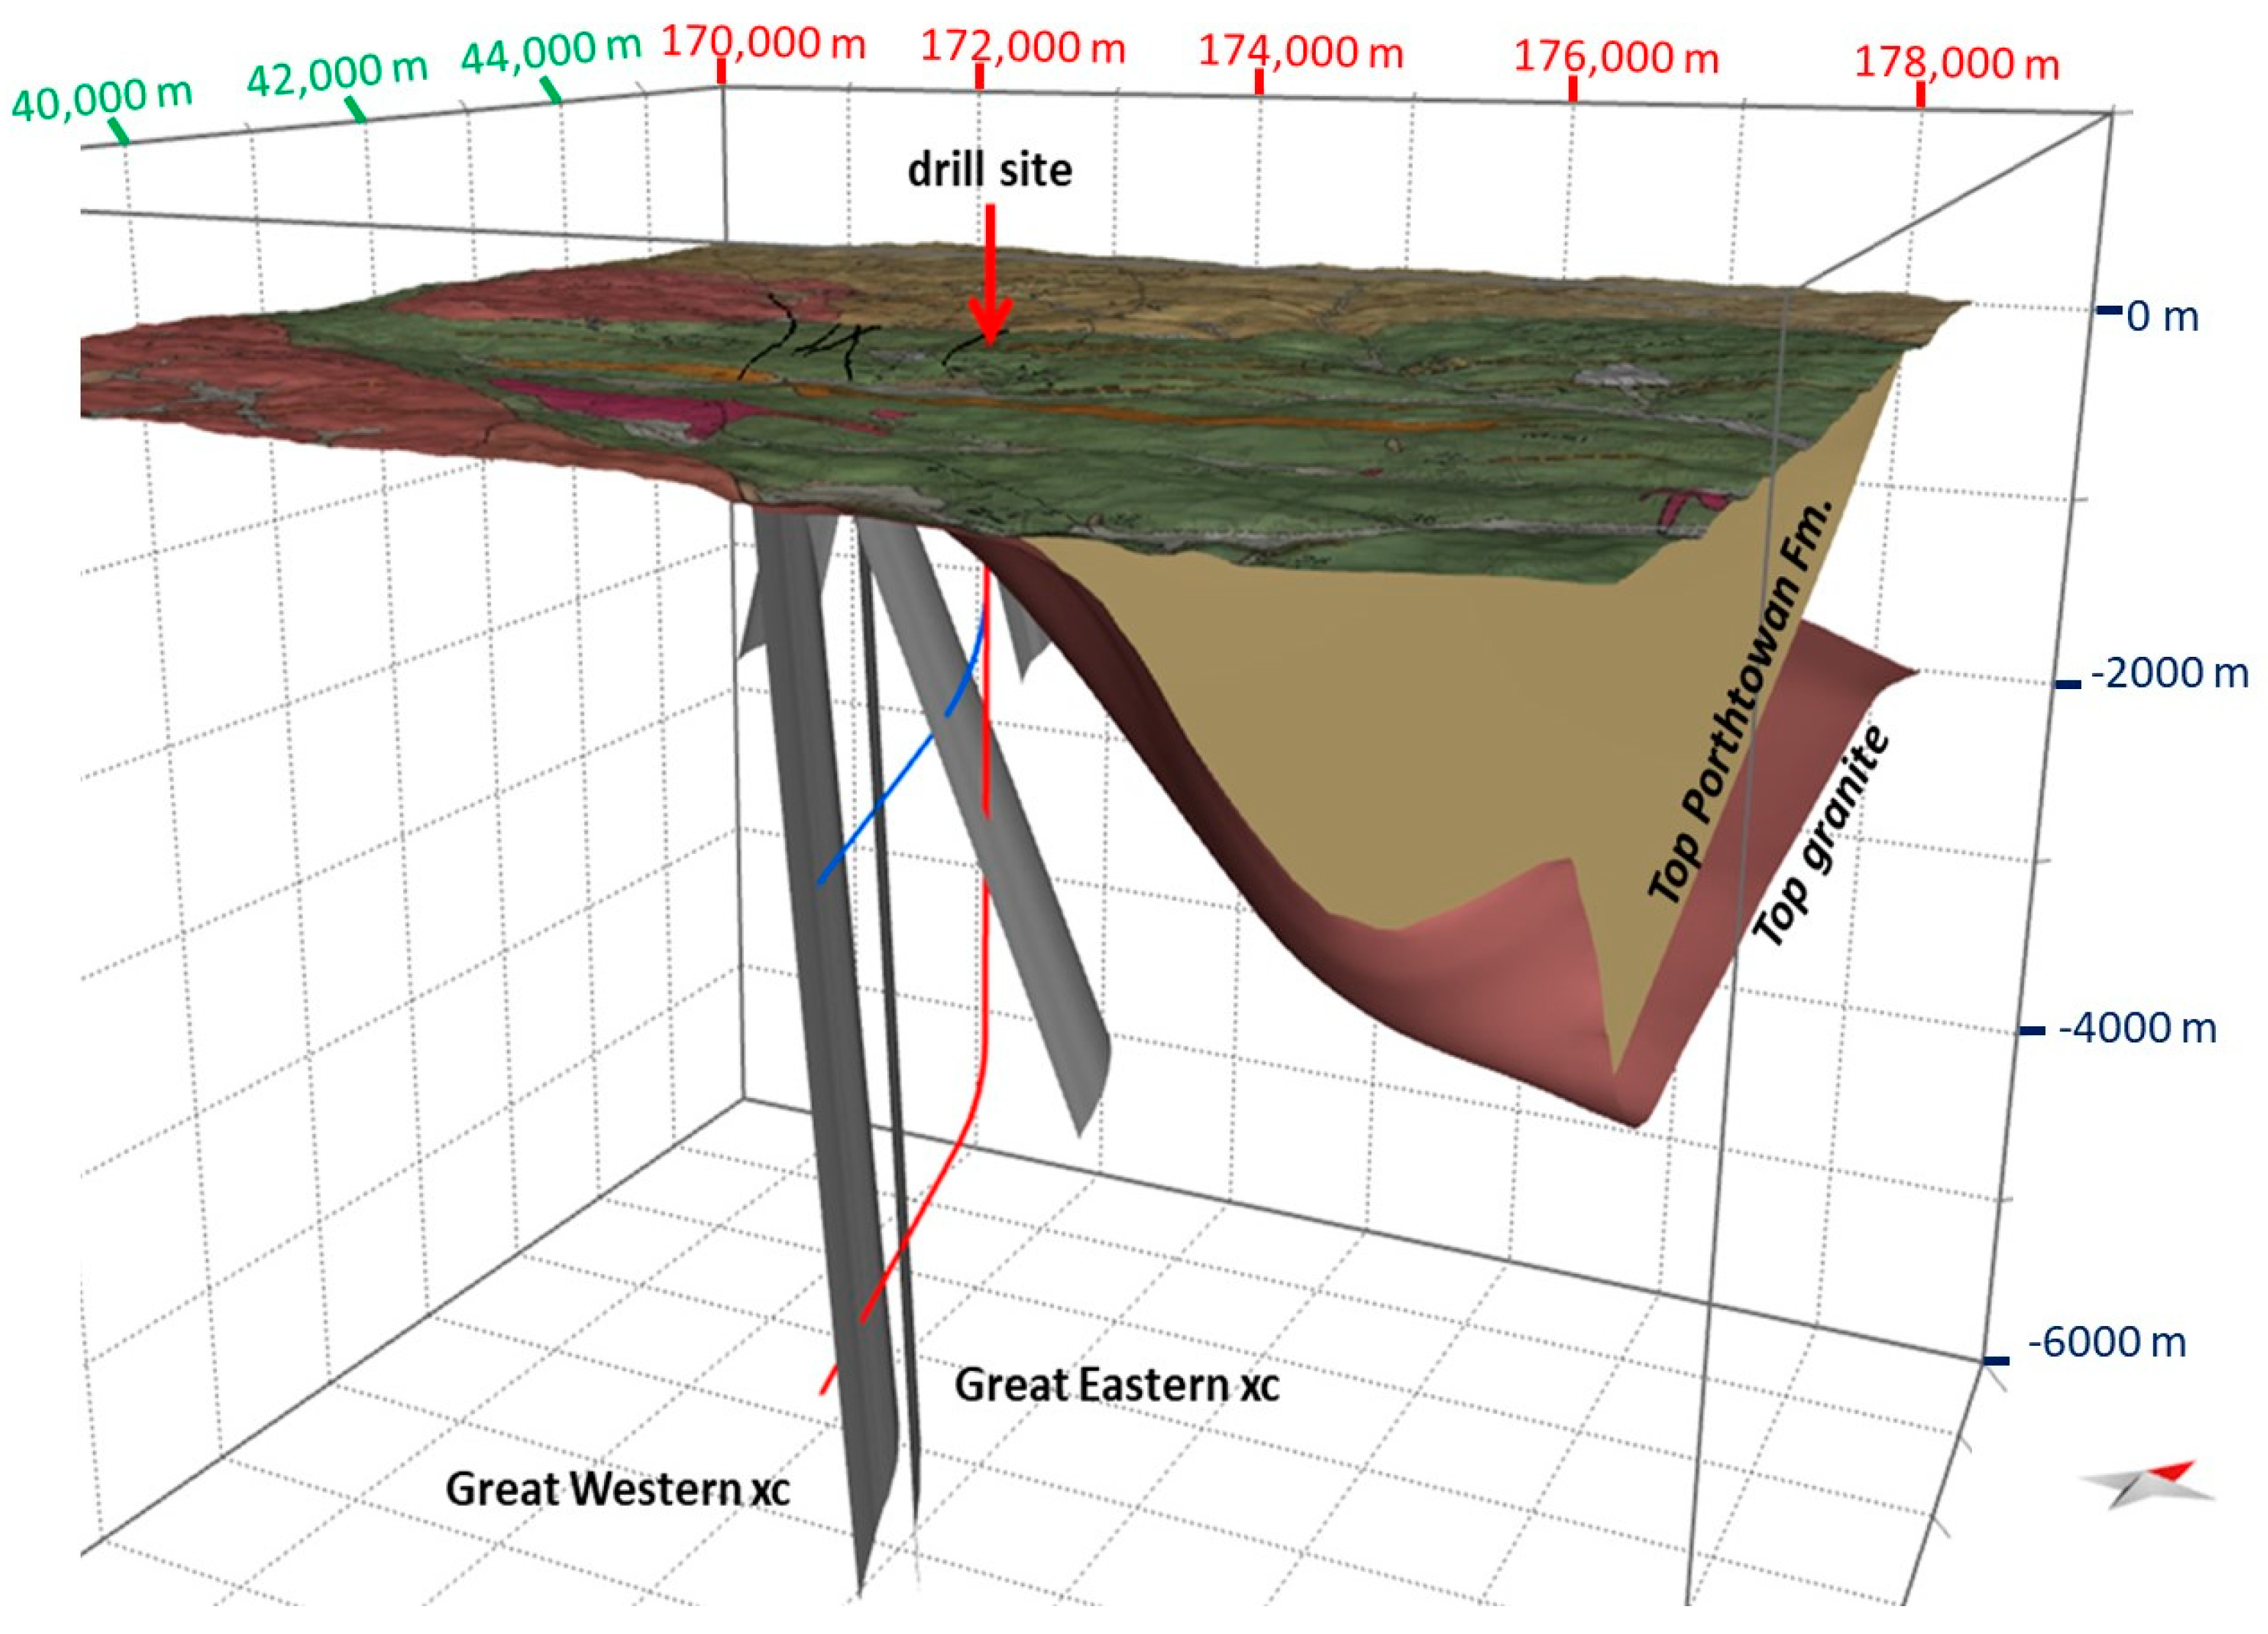
UDDGP is geographically located near Redruth in Cornwall, southwest England. This project is the first in the UK where both injection and production wells are drilled into the highly fractured and steeply dipping Porthtowan Fault Zone (PTF), cross-cutting the Carnmenellis Granite of the Cornubian Batholith. For selecting the geological targets of UDDGP, previous experiences from Rosemanowes HDR wells are considered where the hydraulically active fractures are mainly oriented parallel or at an oblique angle to the maximum horizontal stress direction (SHmax) oriented in the NW-SE direction. To use these favorable flow paths, the geological target selection is focused on faults oriented more or less parallel to SHmax. Furthermore, hot springs in mines confirm this fracture permeability in the NW-SE direction [4]. Evidence from mining activities in the area of interest covered only the top 400 m, but it provides insights regarding fault dip, direction, damage zone thickness, displacement, and hydraulic activity. Combining these data with surface geological maps, the fault model is generated [5]. For the well trajectories, two criteria are considered: first, longer-length and larger displacement faults, because they are most likely to penetrate to the deeper zones, and second, the selected area should be underlain by granite with high heat production. Given the lack of available significant geophysical data to detect the fault structures at depth, the combination of the surface geology, mining data, few seismic profiles, and analog structures are used to make a drilling prognosis [6,7,8,9,10]. The injection well UD−2 was drilled to a depth of 2393 m MD (2214 m TVD), and the production well UD−1 was drilled to 5275 m MD (5058 m TVD) with a horizontal spacing of 8 m between the two wellheads and a vertical spacing of around 2000 m between the ends of the wells (to prevent thermal short-circuiting). The production well UD−1 is the deepest onshore well drilled in the UK. Both wells were directionally drilled towards the WSW of the well heads to intersect the NW-SE striking PTF (Figure 1). The bottom hole temperature at a depth of 5 km was found to be °C. The open fractures in the PTF are considered to be the main pathways for fluid flow. However, only a small group of fractures were proven to be hydraulically active by indicators, e.g., mud losses during drilling, geothermal gradient anomalies, induced seismic events, and borehole image analysis [11].
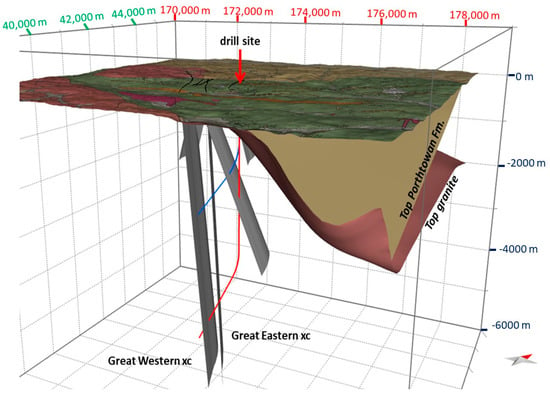
Figure 1.
Structural model of UDDGP with injection (UD−2, blue) and production (UD−1, red) wells and their intersection with the Porthtowan Fault Zone (PTF) constituting the two branches of Great Western cross-courses (xc) and Great Eastern cross-courses (xc).
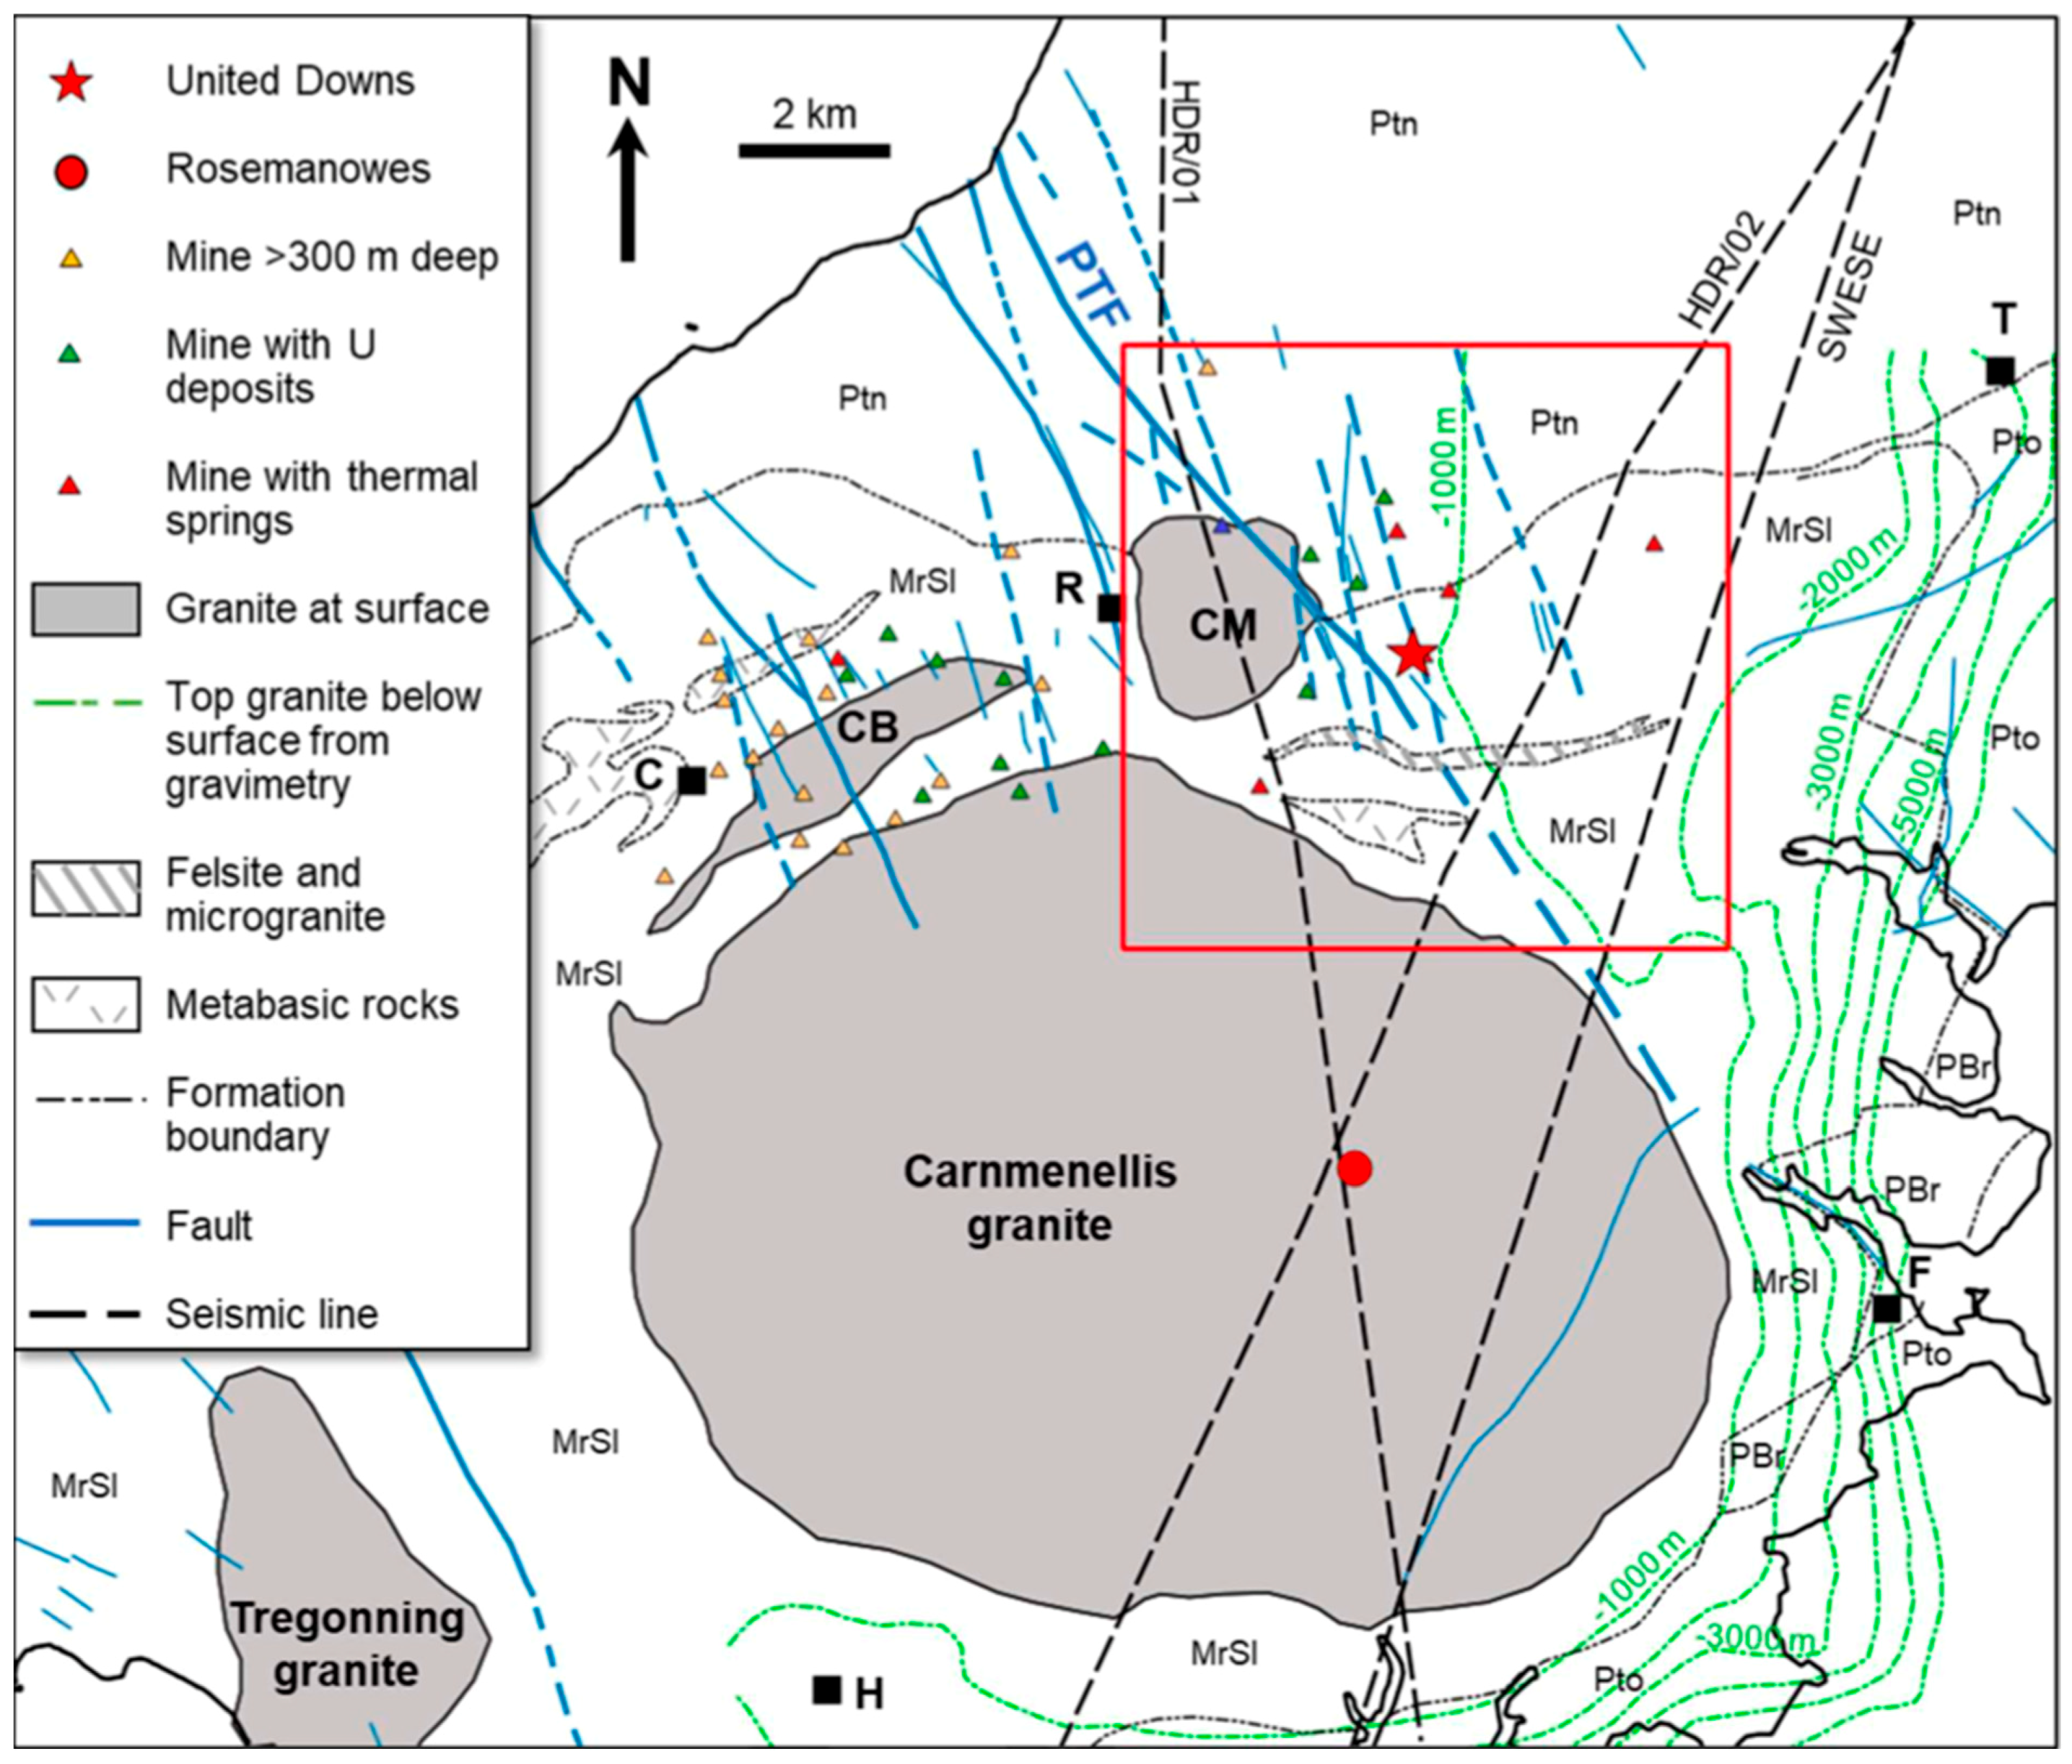
The geology of Cornwall is characterized by the Cornubian batholith, which can be distinguished into several plutons. The Carnmenellis granite is one such pluton that formed around 293 Ma ago [12]. The region also comprises metamorphosed Devonian sediments, which are locally known as “killas”. Granites in this region have high contents of uranium (U), thorium (Th), and potassium (K), which result in high heat flow values and the high geothermal gradient. There are a few thermal springs in the vicinity of the site. The granitic outcrops, mines with U deposits, and thermal springs, along with faults, are shown in Figure 2. The Carnmenellis granite was estimated to be about 10 km deep, and the temperature at that depth was °C [11,13].
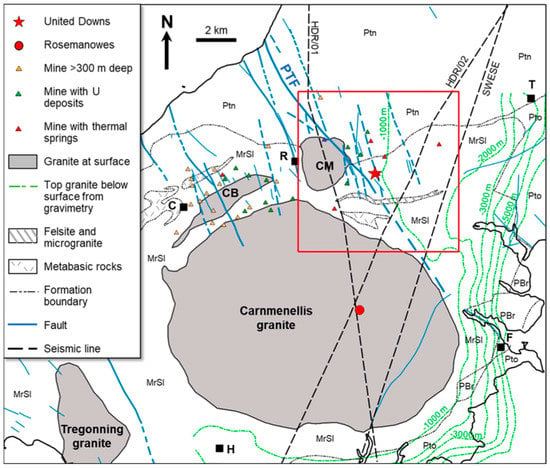
Figure 2.
Geological map of the region. Isolines of top granite are not displayed on the western and northern sides of the Carnmenellis granite. The red square indicates the UDDGP model outline. Ptn: Porthtowan Formation, MrSl: Mylor Slate Formation, PBr: Porthleven Breccia Member, Pto: Portscatho Formation, all Devonian in age. Towns: T: Truro, F: Falmouth, R: Redruth, C: Camborne, H: Helston [11].
The PTF is a set of strike-slip structures with the strike in the NW-SE direction and a width of around 300 m which can be traced as various fault segments on the surface (Figure 1). The PTF accommodates periods of extensional (Devonian, Permo-Trias) and compressional (Variscan, Alpine) tectonics of both dextral and sinistral movements. More information on regional geology and tectonics is given in Reinecker et al. [11].
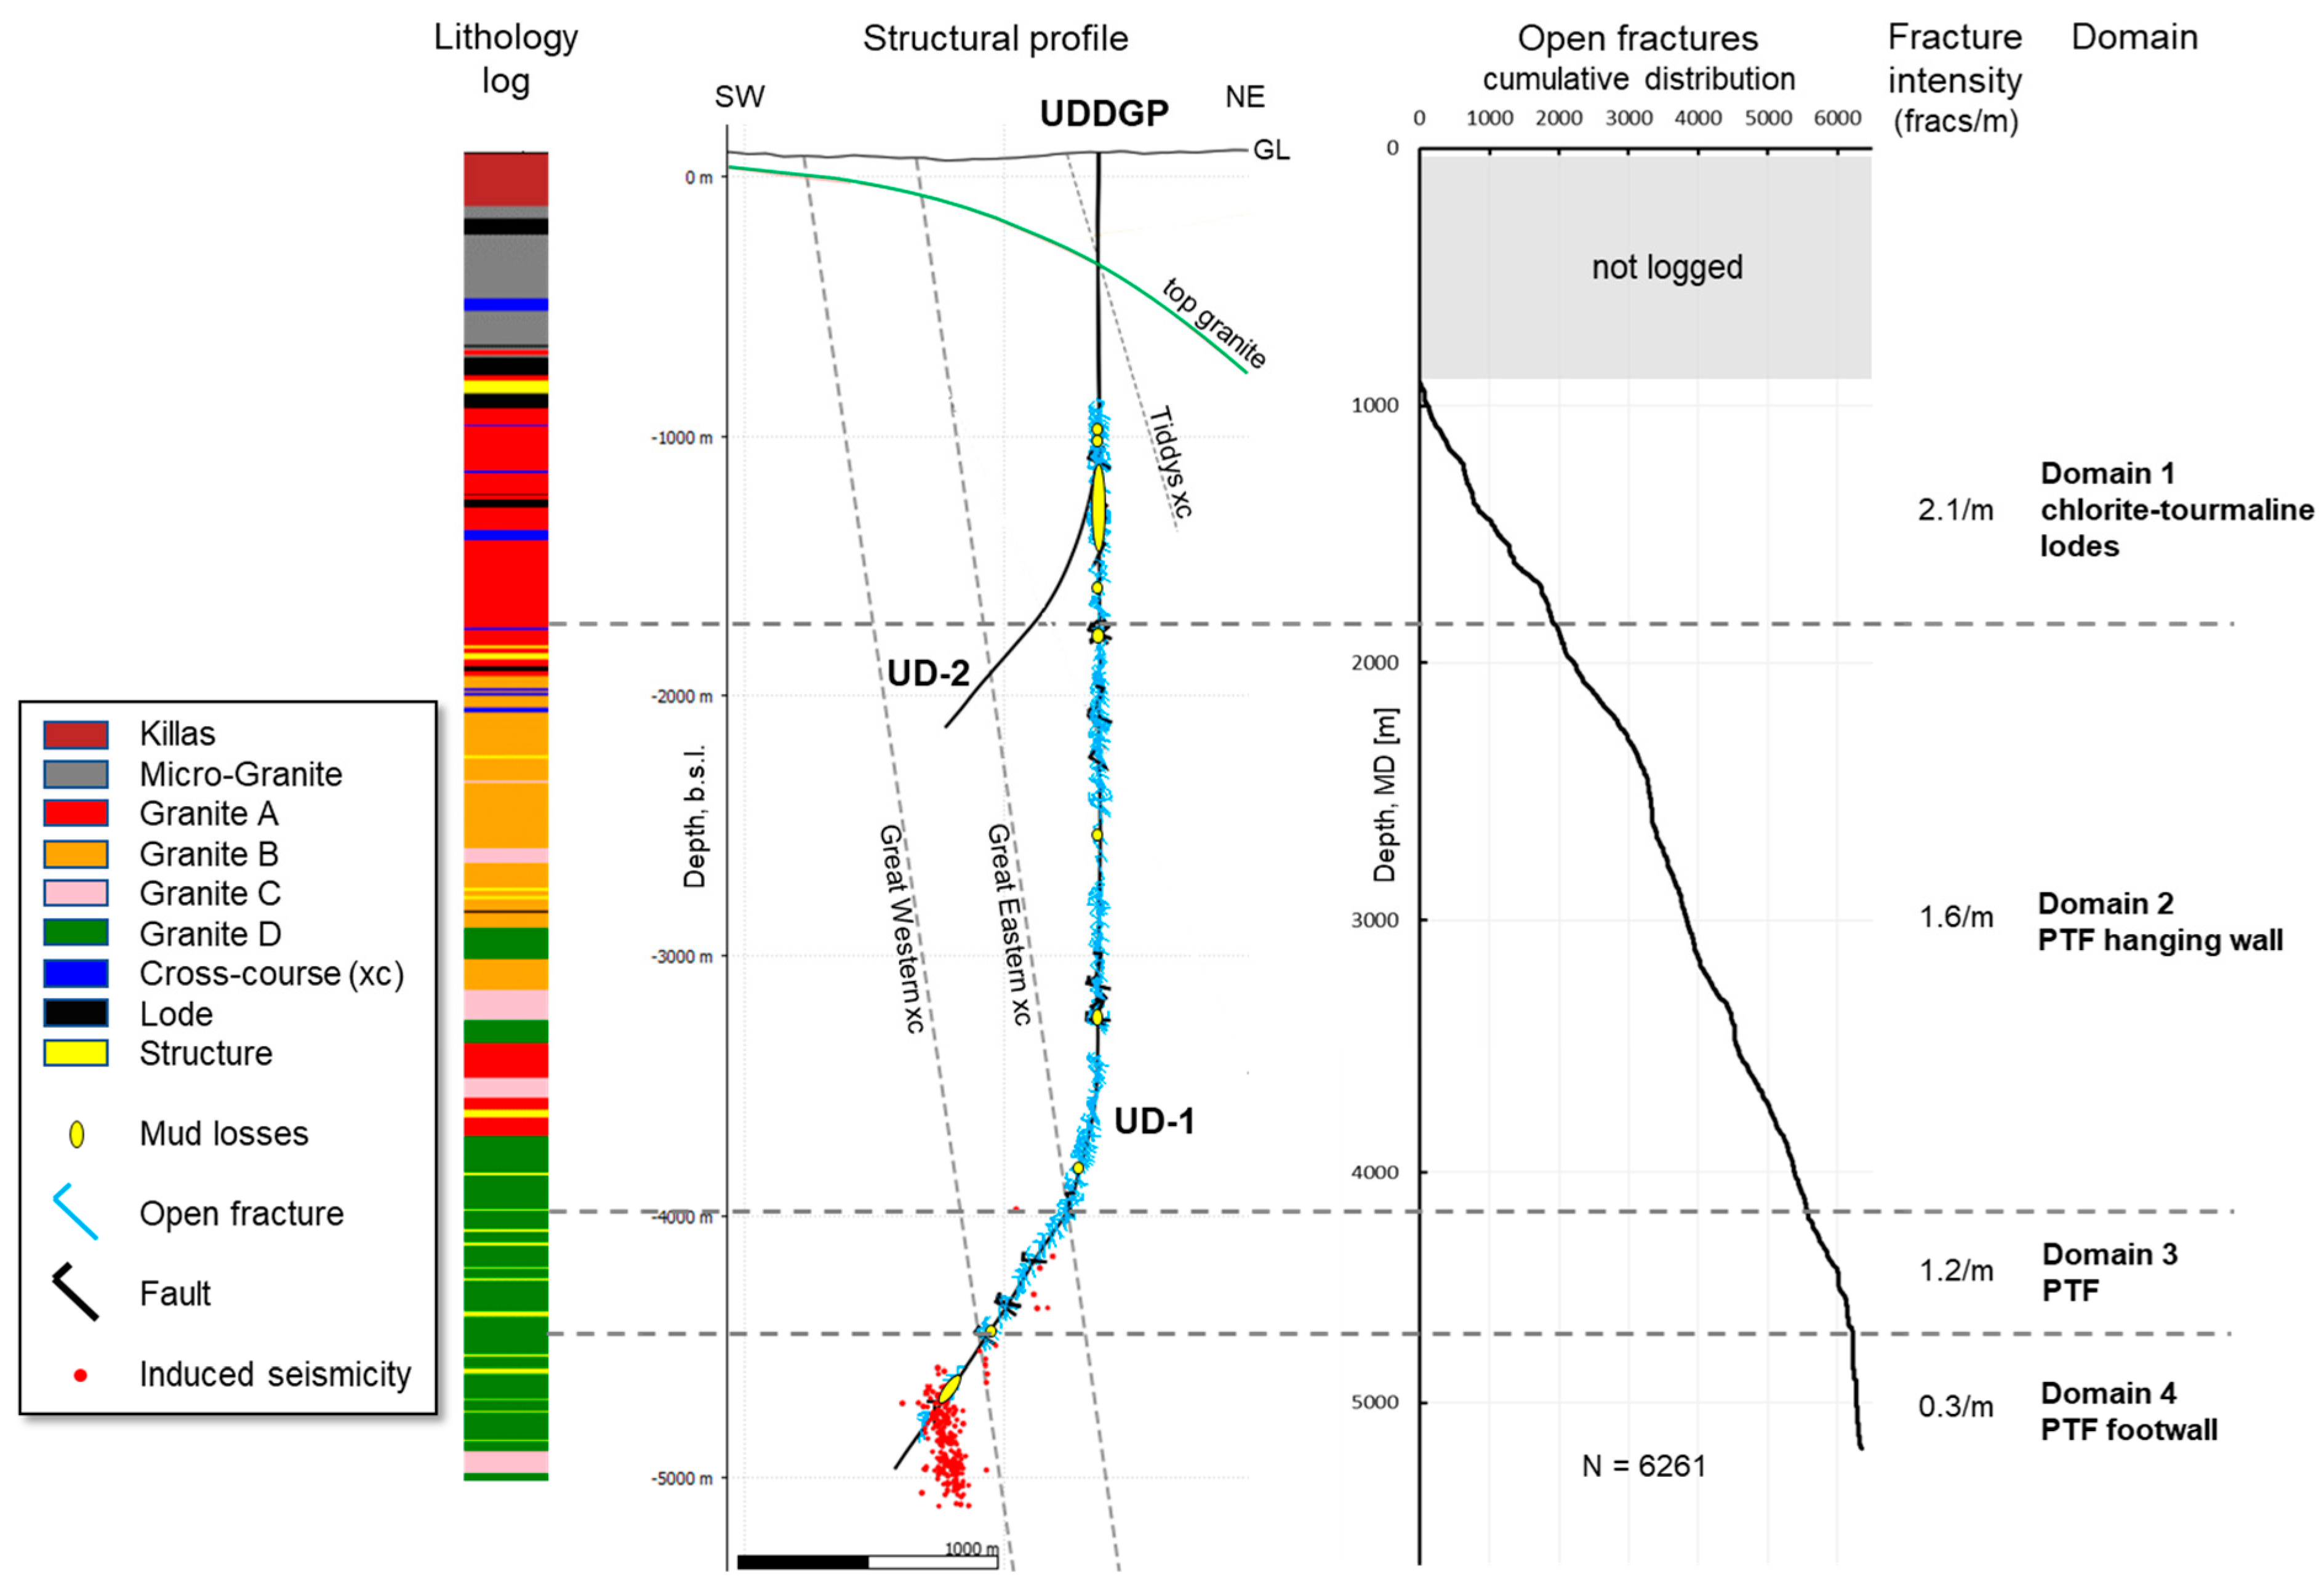
Ultrasonic imaging of the wellbore has given a very reliable understanding of the natural fracture distribution in UD−1 from 906 m to 5206 m MD (see Figure 3). The fractures can be divided into two sets: fractures trending in the NW-NNW direction and the ENE striking fractures. For more geological details, readers are suggested to read Reinecker et al. [11]. Both these sets consist of mineralized and open fractures (a few of them are hydraulically active). The probable number of fractures in the former set is higher than that of the latter set (based on possible geometrical sampling bias from the log data). The intensity of both the fracture sets generally decreases with depth, a behavior which has also been demonstrated for comparably deep wells in the Upper Rhine Graben by Afshari et al. (2022) [14]. Fractures favorably oriented with the in-situ stress field are critically stressed, and their permeability can be enhanced by slip initiated through fluid-driven stimulation. The fracture sets were further divided on the basis of orientation, intensity, and depth into four domains [11]. Additionally, two large-scale fractures were detected based on a combination of fluid losses during drilling, geothermal anomalies in the temperature logs, by the borehole image logs, and induced seismic events during drilling and subsequent hydraulic testing. Both fractures are oriented more or less in parallel to another, but slightly oblique to the PTF, and are critically stressed in the in-situ stress field [11].
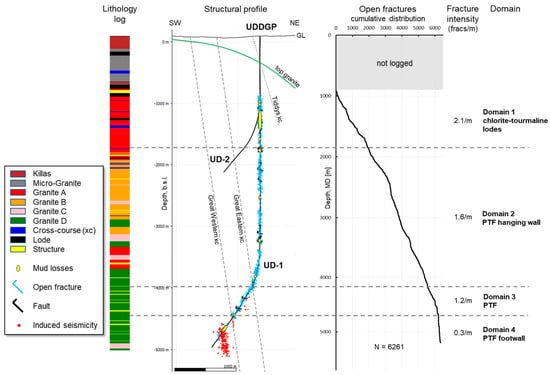
Figure 3.
Fracture distribution interpreted from ultrasonic logs in UD−1. Note that the depth scale of the structural profile is the true vertical depth below sea level. Cumulative fracture distribution and lithology log originally in measured depth below ground level are shifted and stretched to fit the true vertical depth scale [11]. Two large-scale fractures were detected by induced seismic events during drilling and subsequent injection testing.
In this study, the thermo-hydraulic process is numerically simulated based on the reported fracture and hydraulic testing/stimulation data. The fractured reservoir for this study is represented by a stochastic DFN-based equivalent continuum model with both homogeneous and anisotropic units representing the host rock and the fault zone, respectively. This study was conducted within the framework of the EU-funded Horizon 2020 project MEET (Multidisciplinary and multi-contact demonstration of EGS exploration and Exploitation Techniques and potentials), which is described in general by Trullenque et al. [15]. The fluid flow and heat transfer during the hydraulic testing and stimulation operations were numerically simulated to estimate the permeability field. Furthermore, the pressure dependency on different injection flow rates is presented and analyzed. Finally, a preliminary model based on the conceptual impact of chemical stimulation on the reservoir permeability is developed, and consequently, its impact on reservoir pressure development is estimated. Due to confidentiality clauses from the industrial partner, all data are reported based on a function of .
2. Methodology
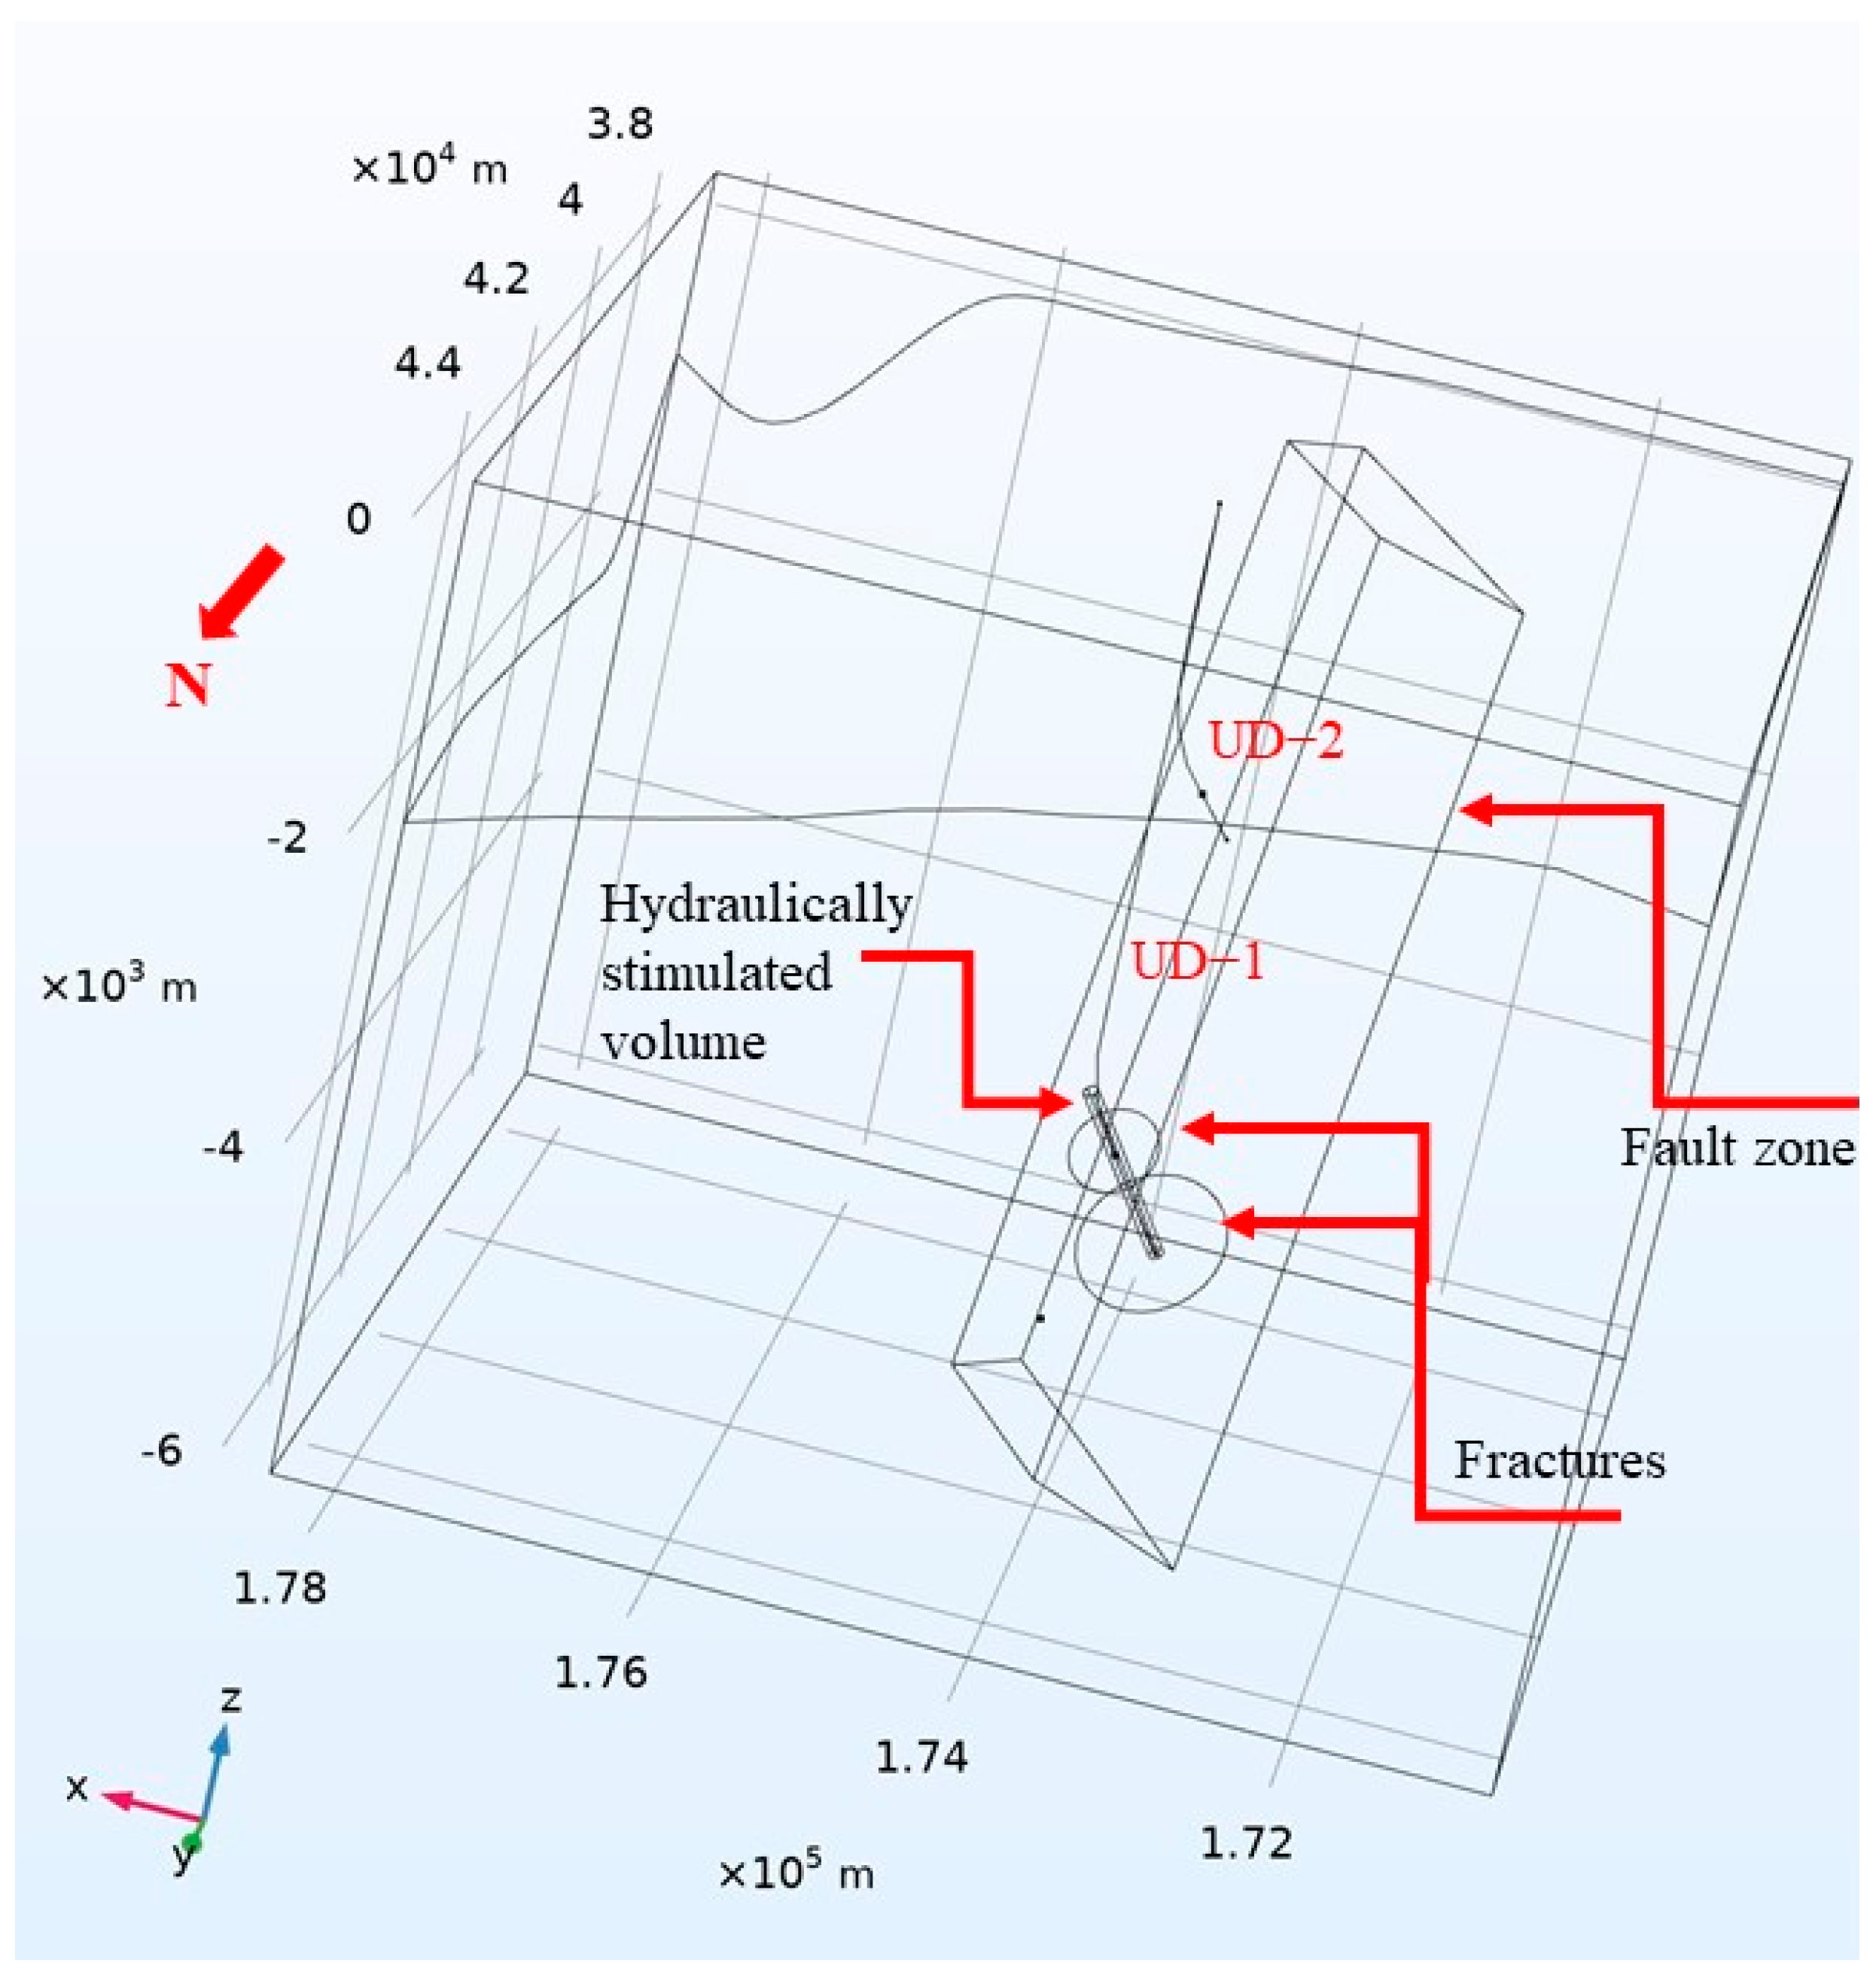
Well data, seismological data, surface mapping, data from nearby mines, outcrop analysis, and data from the Rosemanowes project, along with gravity analysis, are all used to define the target faults, well trajectories, and fractures. For setting up a static structural reservoir model, the Move 2018 software [16] developed by Midland Valley Explorations Ltd. was used [11]. Fracture network data obtained from fieldwork, borehole logging, and literature are summarized in Table 1 and Table 2 for the unfaulted host rock zone and the fault zone, respectively. Discrete fracture networks (DFNs) are generated for the host rock zone and the fault zone using the FracMan 7 [17] software. Due to unavailability of mean fracture half-length and mean hydraulic fracture aperture data for the fracture set 2, corresponding data from fracture set 1 is assumed in Table 1 and Table 2. Furthermore, this geometrical model (see Figure 4) is imported into COMSOL Multiphysics [18] for the hydraulic stimulation simulation.
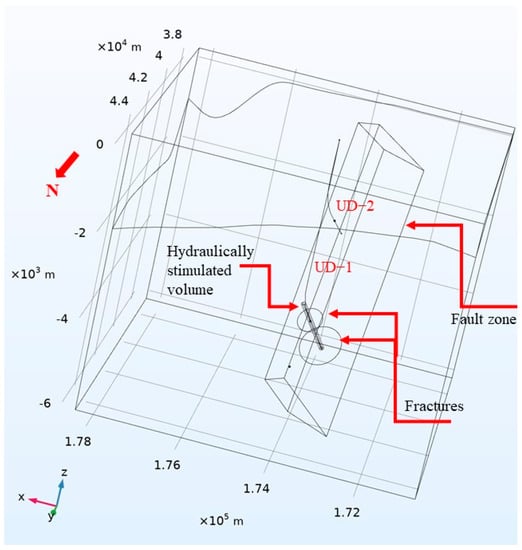
Figure 4.
Schematic geometry used to simulate a cubic space of the UDDGP geothermal system. The hydraulically stimulated region is depicted by a cylinder around UD−1. Two critically stressed large-scale fractures, subparallel to the PTF, are implemented based on the seismic events as documented by, e.g., [11] and indicated with a disc shape.
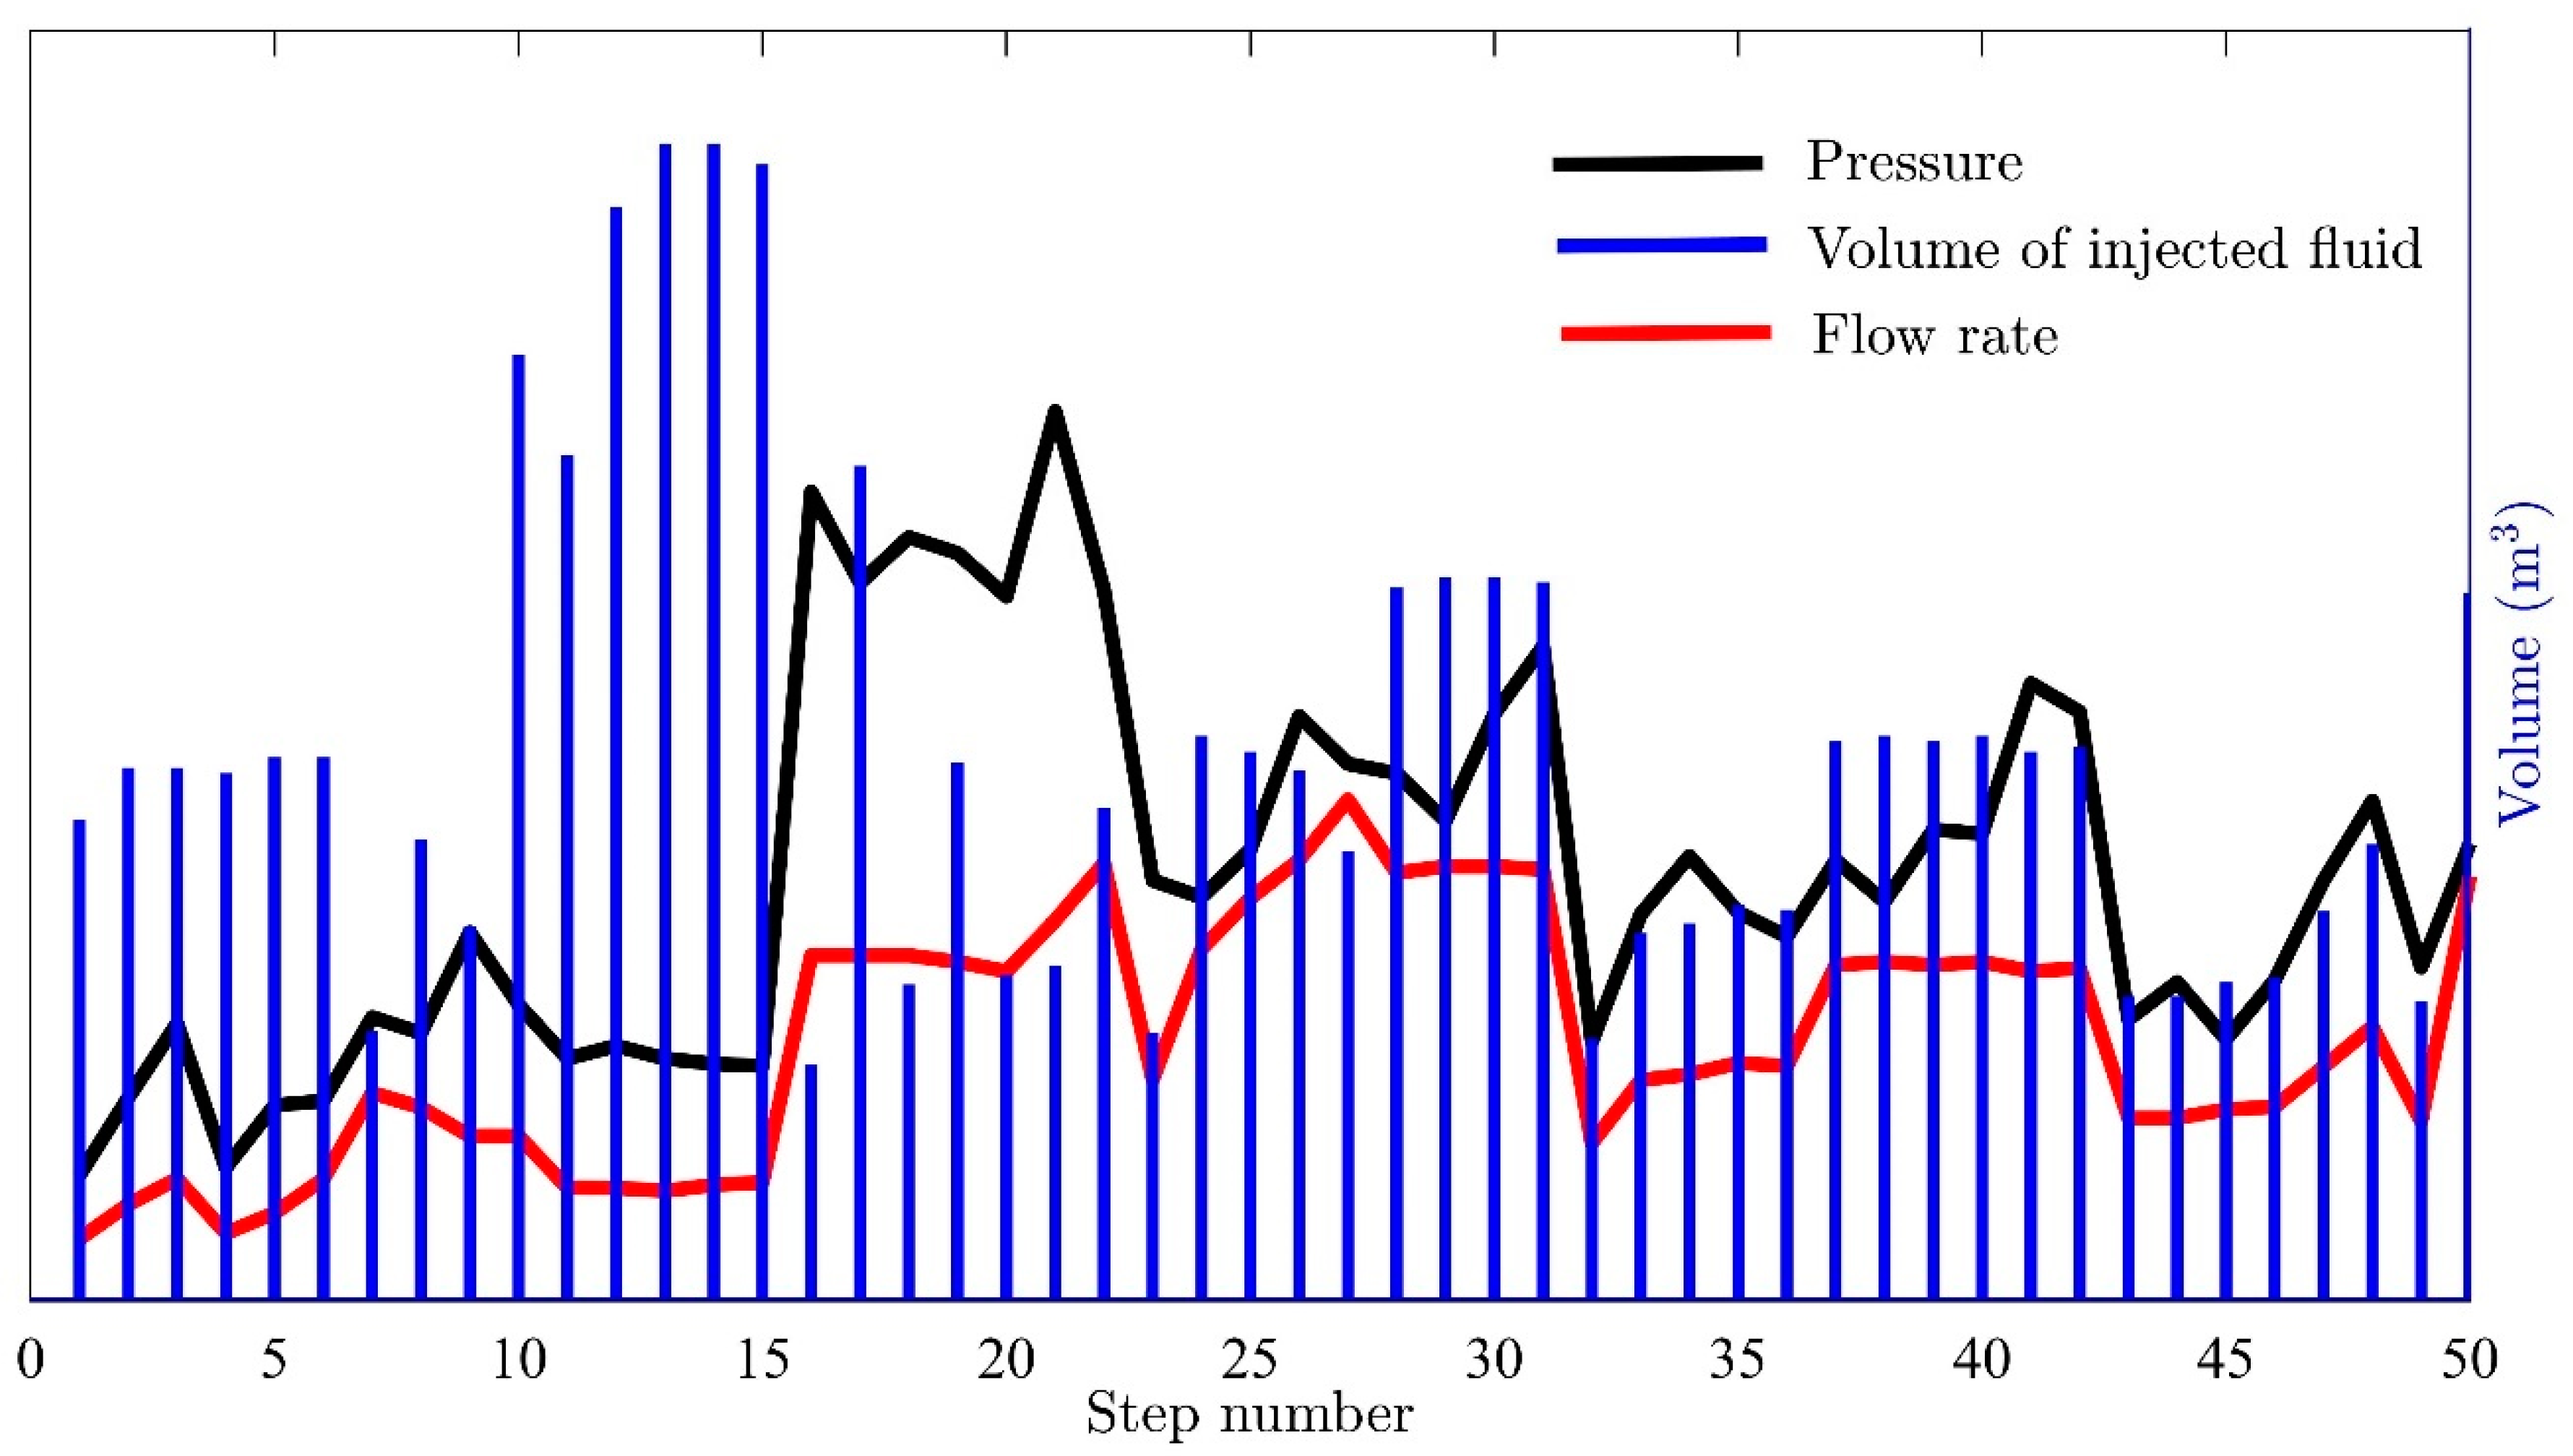
To enhance the hydraulic connection of the open hole sections of both wells to the fault-bounded reservoir, hydraulic stimulation operations have been performed on UD−1 and UD−2. The injectivity of UD−2 is within the targets set for the power plant operation. To increase the hydraulic connectivity of UD−1 to the reservoir and the near wellbore reservoir hydraulic conductivity, three stages of hydraulic stimulation were performed [11]: (a) Phase 1—step rate injection testing during August 2020, (b) Phase 2—extended injection testing between September and October 2020 and (c) Phase 3—low pressure extended injection testing between October 2020 and February 2021. All phases can be characterized as soft hydraulic stimulation operations due to the low injection volumes and flow rates but sufficient pressures to induce micro-seismic events. Figure 5 shows the operational details of phase 3 hydraulic stimulation for UD−1. This data is used to validate and adjust the anisotropic permeability field of the stochastic DFN models based on the fracture network characteristics for the UDDGP geothermal field. In this data, some changes need to be highlighted: (i) in the first part, from steps 0 to 15, the injection volumes were increased while flow rates and pressures were kept at a low level, followed by (ii) a set of injections with significantly higher injection pressures and considerably higher flow rates from step 16 until step 21 accompanied by increasing induced micro-seismicity (not shown due to confidentiality) leading into (iii) a third part where flow rates increase further with significantly lower injection pressures. These changes indicate that the hydraulic injections are increasing the reservoir injectivity and prove that they can be defined as soft hydraulic stimulation.
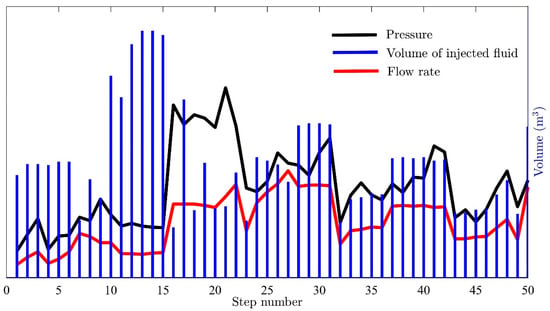
Figure 5.
Daily flow rate, injection pressure, and injected volume of the hydraulic testing/stimulation operation on UD−1 from September 2020 until January 2021. Here flow rate, pressure, and injection volume are hidden for commercial issues. The black and blue colors indicate the pressure and volume of the injected fluid.
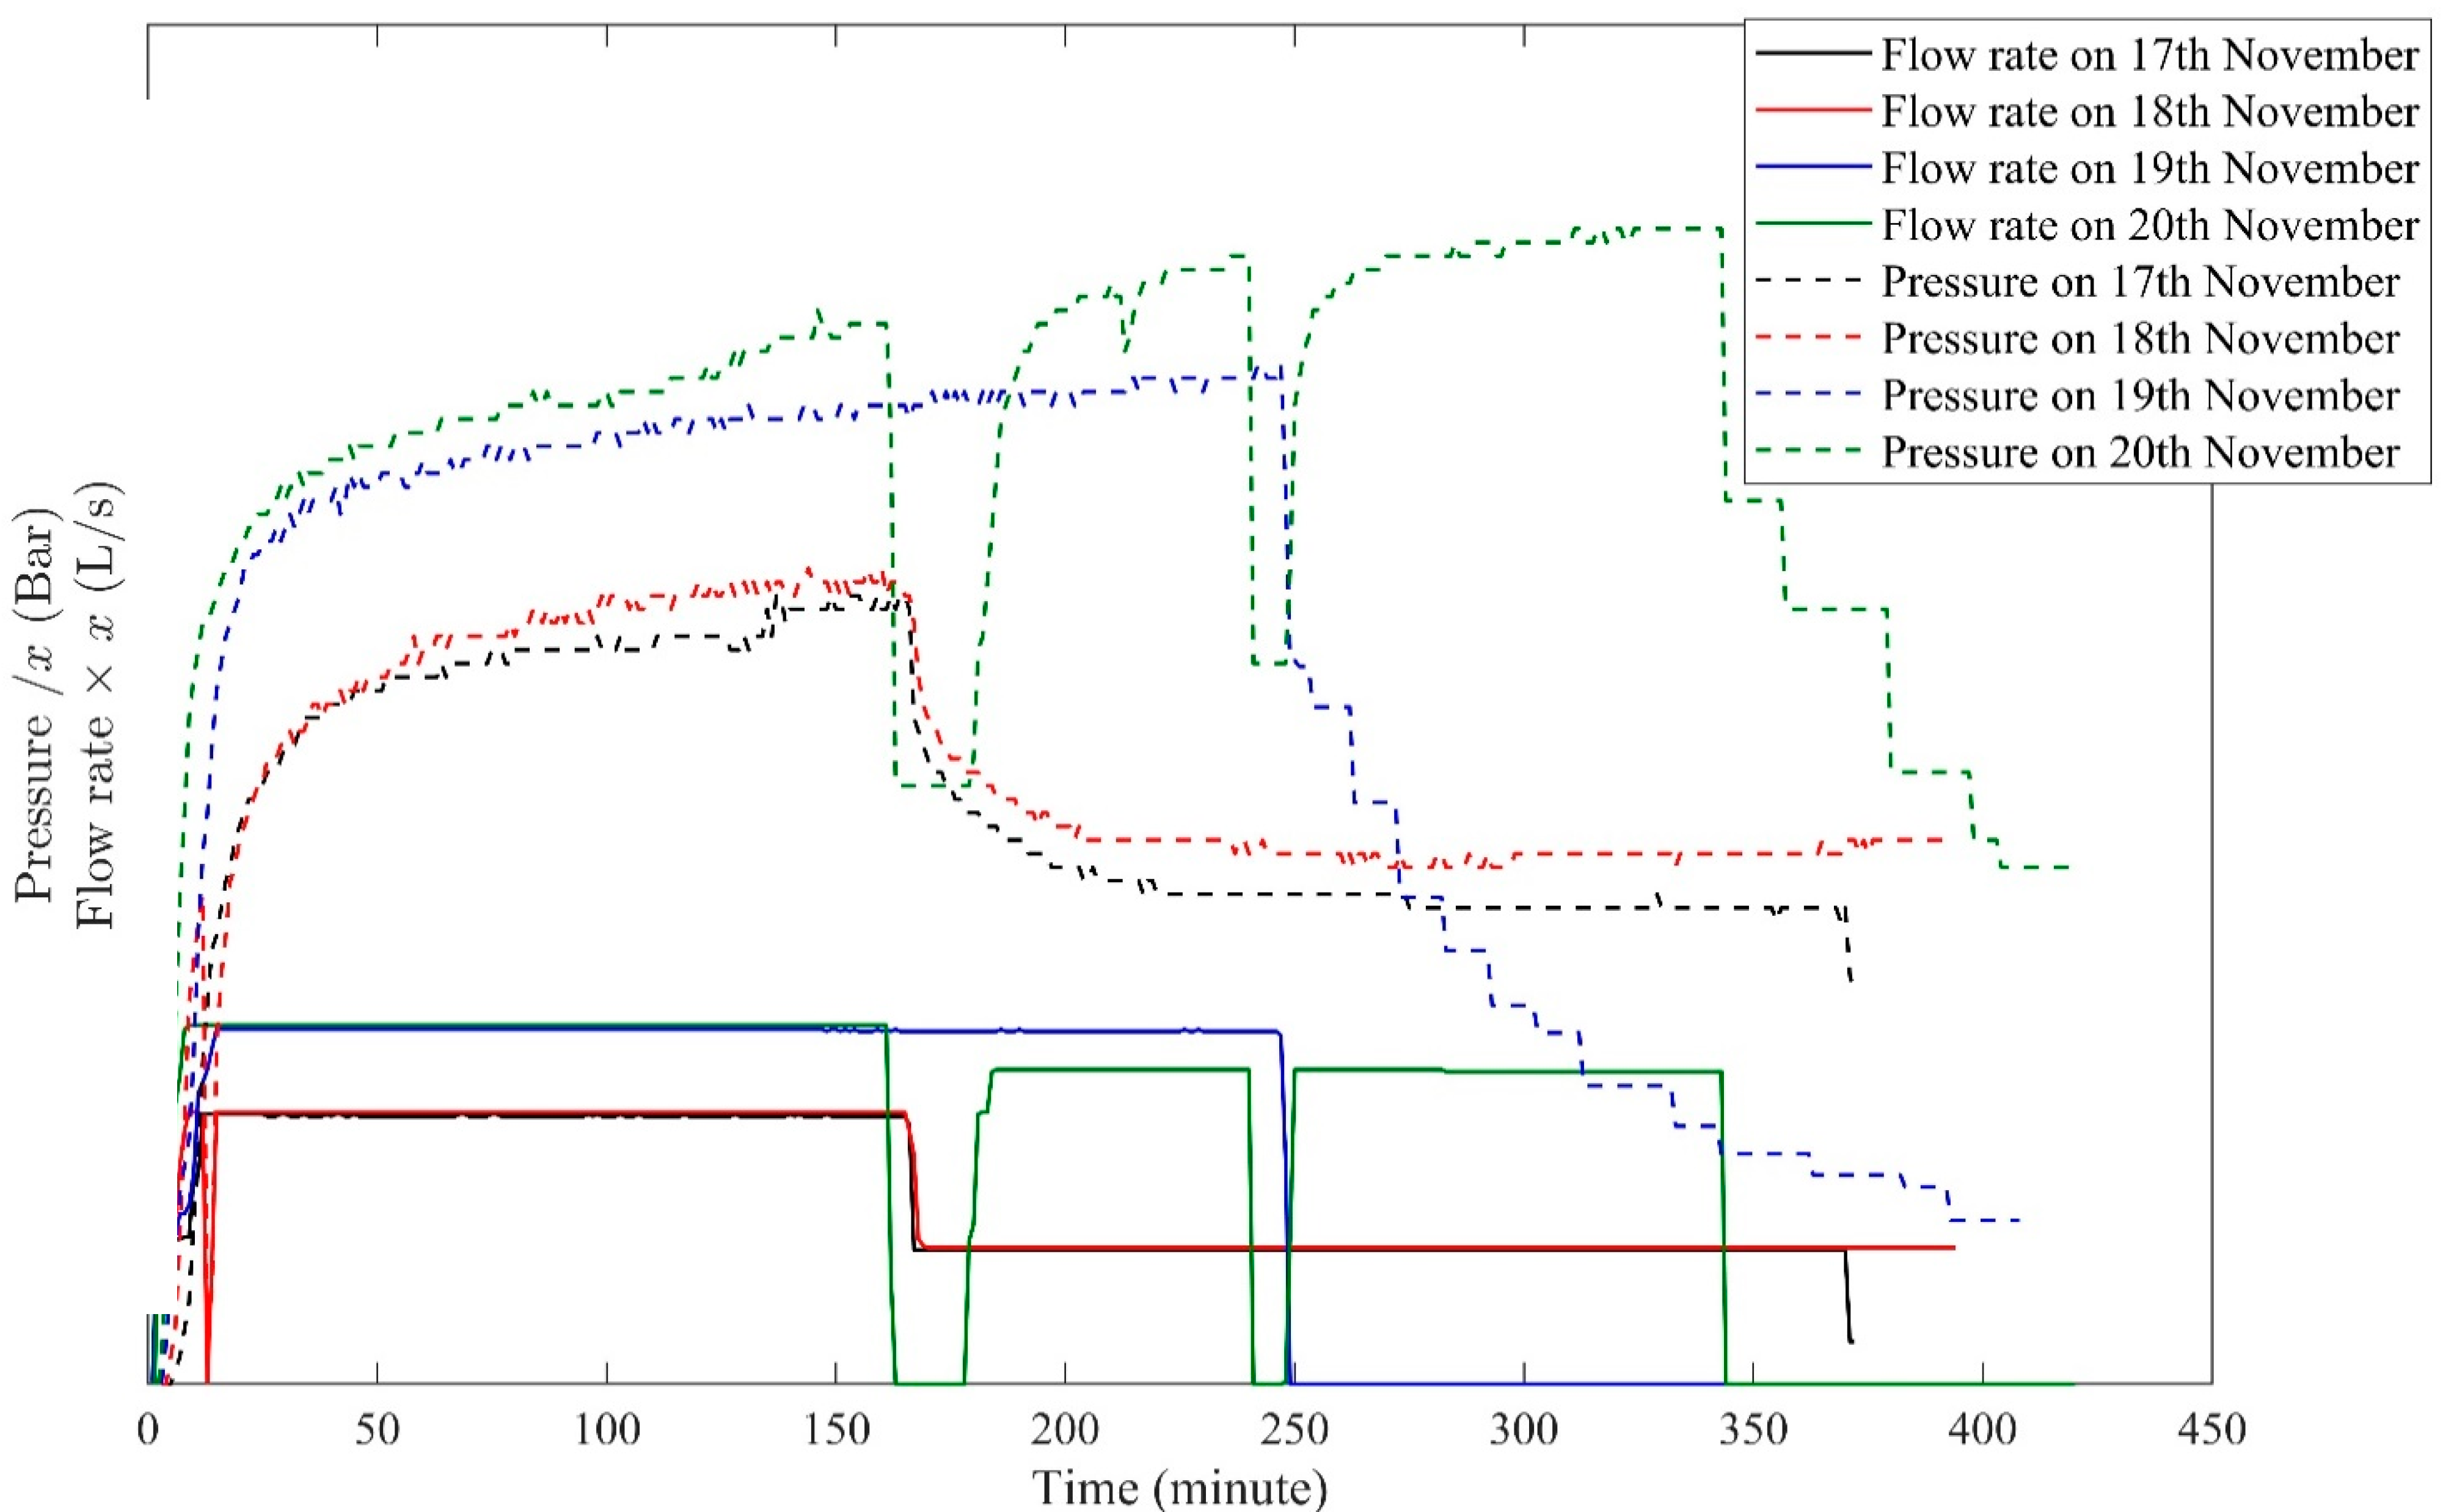
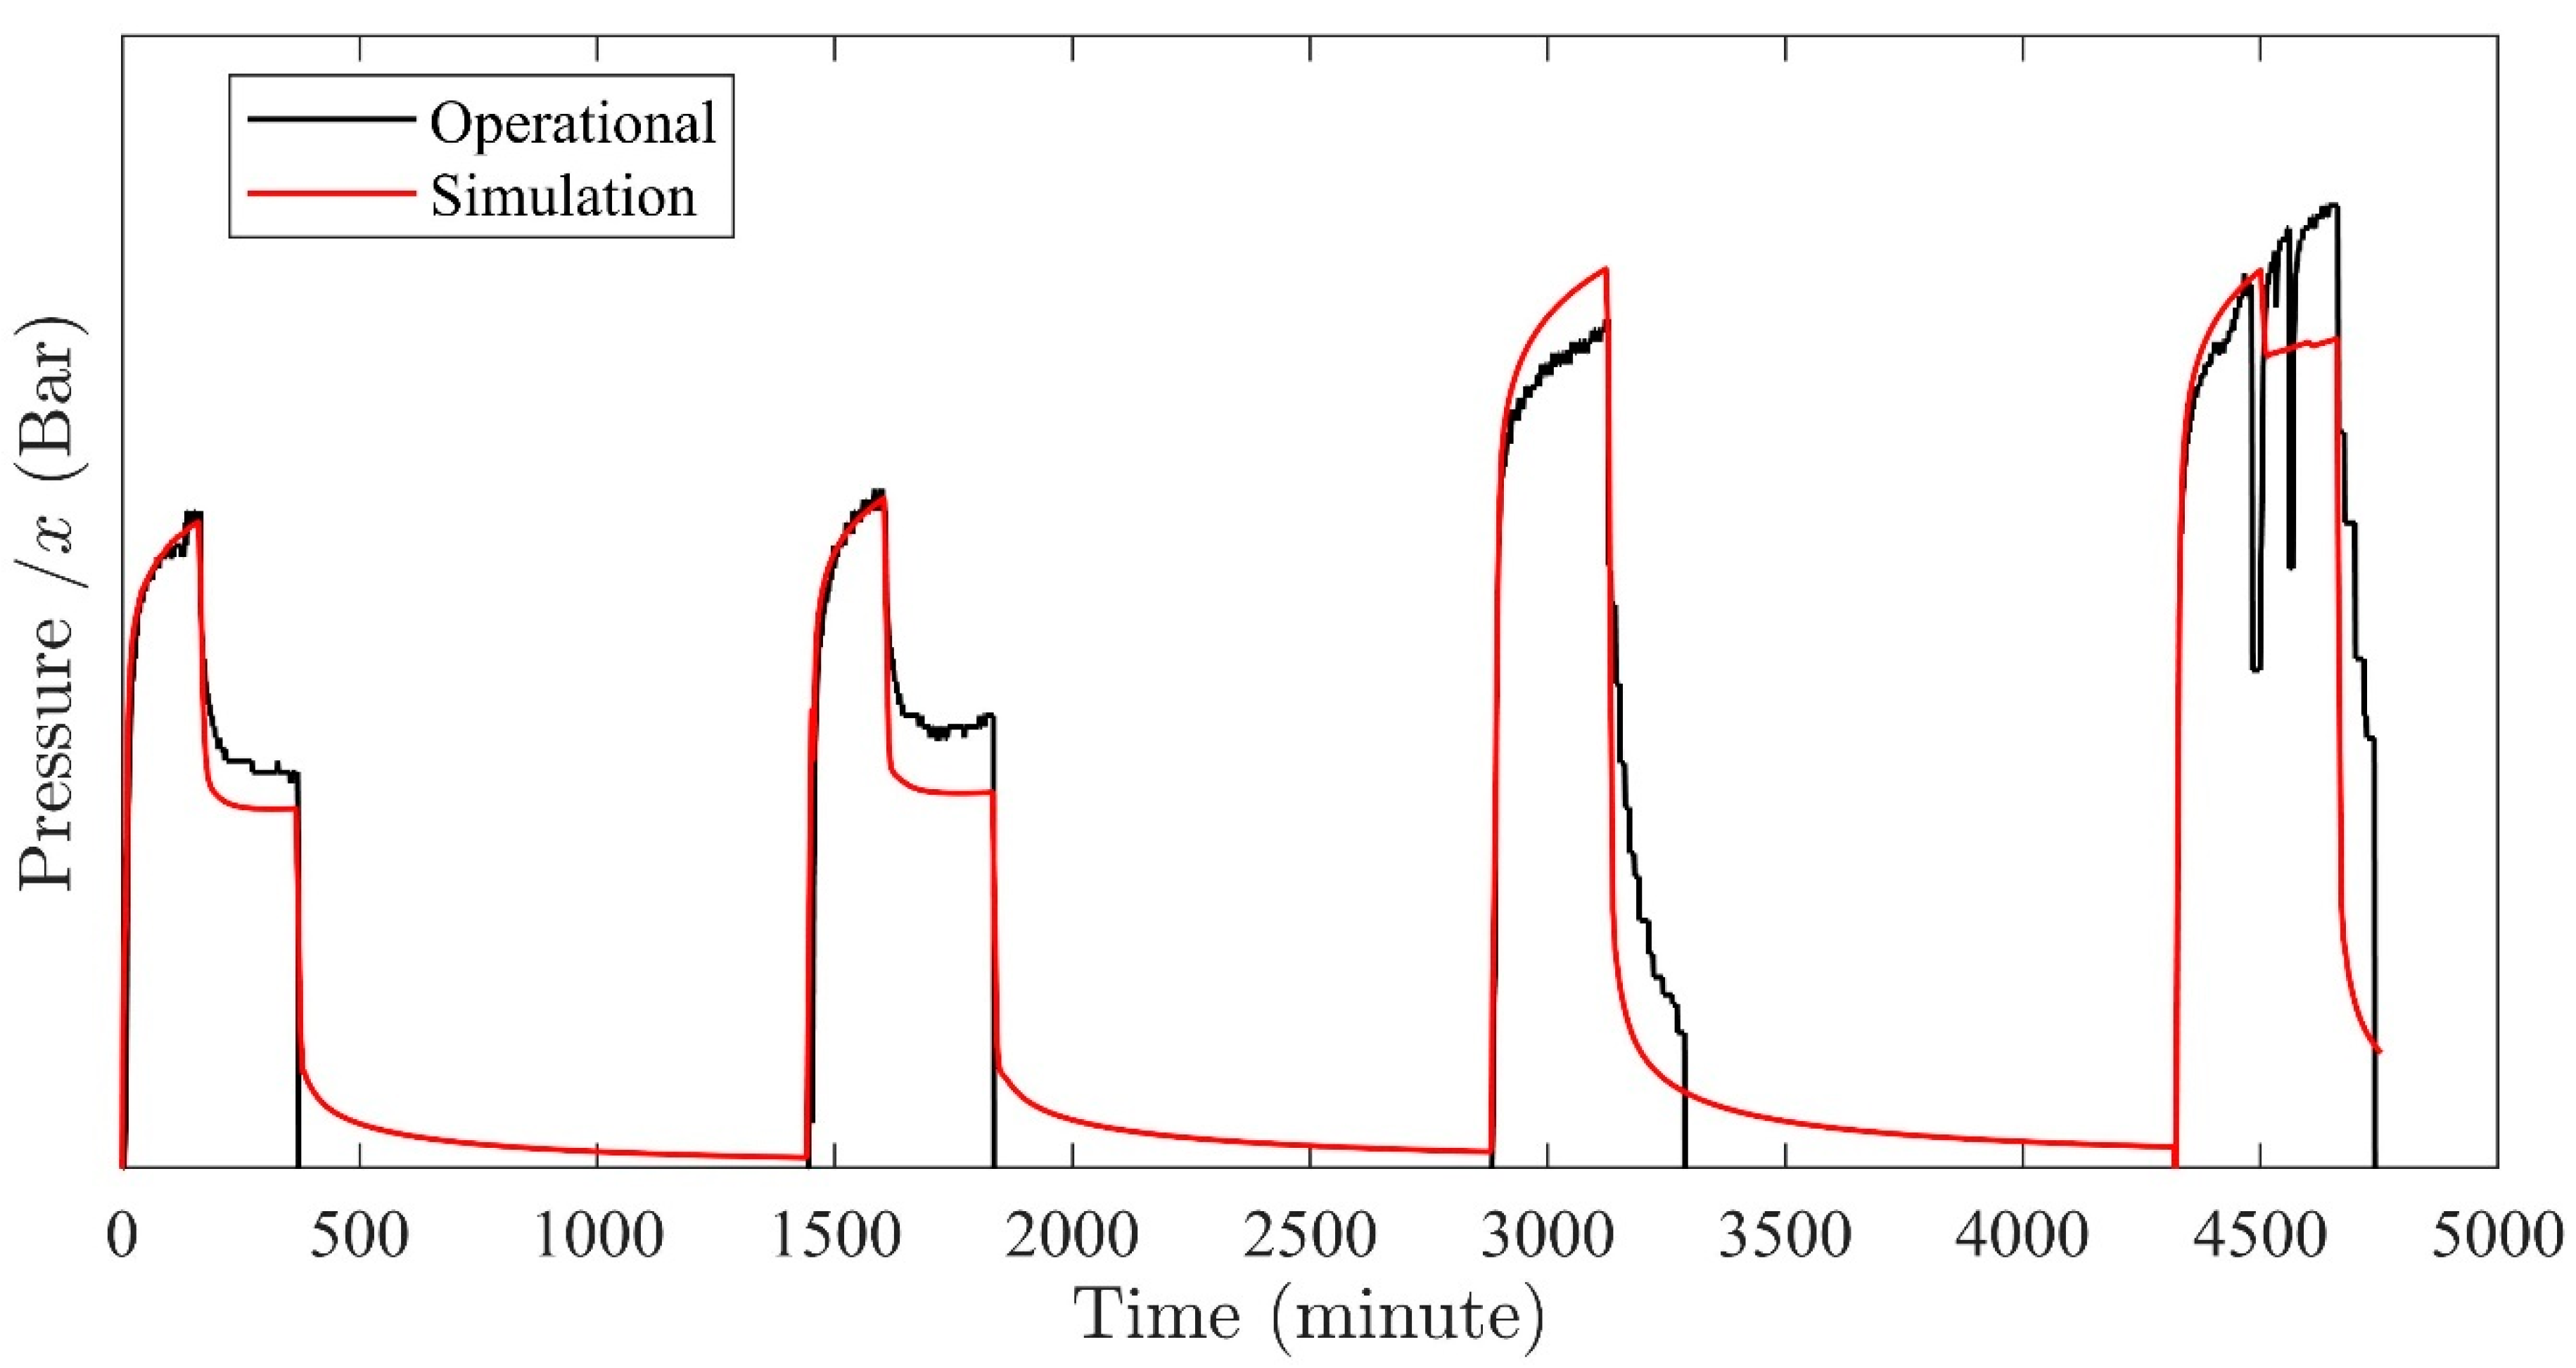
Furthermore, the hydraulic testing/stimulation operational data for UD−2, conducted from the 17th until the 20th of November 2020, is used to validate the calculated permeability field (Figure 6). Based on this validated permeability field, different operational scenarios of flow conditions were simulated to evaluate reservoir performance.
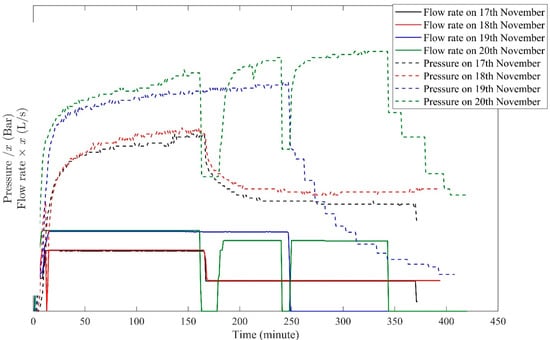
Figure 6.
Pressure and flow rates of the four days of hydraulic testing/stimulation operation performed in UD−2 from 17th to 20th November 2020. Due to confidentiality, exact flow rate and pressure values are hidden and are shown only in terms of multiplication of x.

Table 1.
DFN characteristics of host rock zone.
Table 1.
DFN characteristics of host rock zone.
| DFN Parameter | Fracture Set 1 | Fracture Set 2 | Comment | Reference |
|---|---|---|---|---|
| Mean fracture orientation, strike [deg] | 130–310 | 50–230 | Mean orientations from Rosemanowes wells RH12 and RH15; set 1 from approx. 80% of the total fracture surface area | [19] |
| Mean fracture orientation, dip [deg] | 80–90 | 70–90 | [20] | |
| Mean fracture half-length [m] | 5.5 | Log-normal distribution with μ = 1.7 and σ = 0.45 [ln(m)] | [20] | |
| Mean hydraulic fracture aperture [μm] | 59 | Between 31 and 65 μm | [19] | |
| Fracture density [m−1] | 5 | 0.8 | Density is decreasing with depth | [21] |
| Producing fracture spacing [m] | 10 | Spacing between producing fractures is in the order of 10 m | [21] | |
| Fracture area density [m−1] | 0.9 | 0.2 | Only 10–15% of the fractures carry appreciable flow |

Table 2.
DFN characteristics within the fault zone.
Table 2.
DFN characteristics within the fault zone.
| DFN Parameter | Fracture Set 1 | Fracture Set 2 | Comment | Reference |
|---|---|---|---|---|
| Mean fracture orientation, strike [deg] | 157–337 | 50–230 | From UD−1 borehole logging, Sub-parallel to the main fault | |
| Mean fracture orientation, dip [deg] | 80–90 | 70–90 | As above. | [22] |
| Mean fracture half-length [m] | 10 | 10 (assumed) | Meters to tens of meters; may be scaled to the length of the fault and offset | [22] |
| Mean hydraulic fracture aperture [μm] | 95 | 95 (assumed) | assumed | [23] |
| Fracture density [m−1] | 6 | 0.8 | assumed | [23] |
| Fracture area density [m−1] | 0.2 (assumed) | 0.2 |
Using the following equation [18], heat and mass transfer in a porous media is coupled to simulate the fluid flow during the hydraulic stimulation operation:
In this equation, , , , , , , , and are pressure, temperature, porous media porosity, permeability, storage coefficient of rock, storage coefficient of fluid, Biot’s coefficient of porous media, the thermal expansion coefficient of fluid, and thermal expansion coefficient of the porous medium, respectively. The fluid dynamic viscosity and density are denoted by and respectively.
Heat exchange between the rock matrix and water is modeled based on the local thermal non-equilibrium approach, and the governing equation for the rock can be written as:
Here, , , , , and are rock temperature, fluid temperature, rock density, rock-specific heat capacity, rock thermal conductivity, and the rock-fluid heat transfer coefficient, respectively. If and are the heat capacity and thermal conductivity of fluid, then the governing equation of heat transfer for the fluid is:
These equations are fully coupled and solved in COMSOL Multiphysics [18], where the necessary thermophysical properties of water (dynamic viscosity (), specific heat capacity (), density (), and thermal diffusivity ()) are given below:
A finite element discretization approach is adopted for this simulation. The complete mesh consists of 135,748 domain elements, 14,320 boundary elements, and 670 edge elements. Backward Differential Formula (BDF) with variable time step is used. The hydrothermal model used here is validated against Bai [24] in previous works by the authors [25,26].
Table 3 shows the rock properties and operational conditions for the numerical simulations of this study. These parameters are obtained from the experimental tests and field works.

Table 3.
Rock and fluid properties for the United Downs geothermal system, as defined for the numerical simulations.
3. Results and Discussions
The present section is organized in the following approach: initially, the equivalent permeability field is calculated from the discrete fracture network, followed by updating the permeability field with the operational data from UD−1. The reason behind this step is to compensate for the permeability loss due to closed fractures or uneven morphology of the fracture surfaces, or resulting error from the stochastic approach (from FracMan). Next, the obtained permeability field is validated with the operation data from UD−2, assuming a constant fracture density in the fault zone. Finally, simulations for the cold-water injection for a longer time period are shown to capture the pressure evolution and temperature reduction for different flow rates.
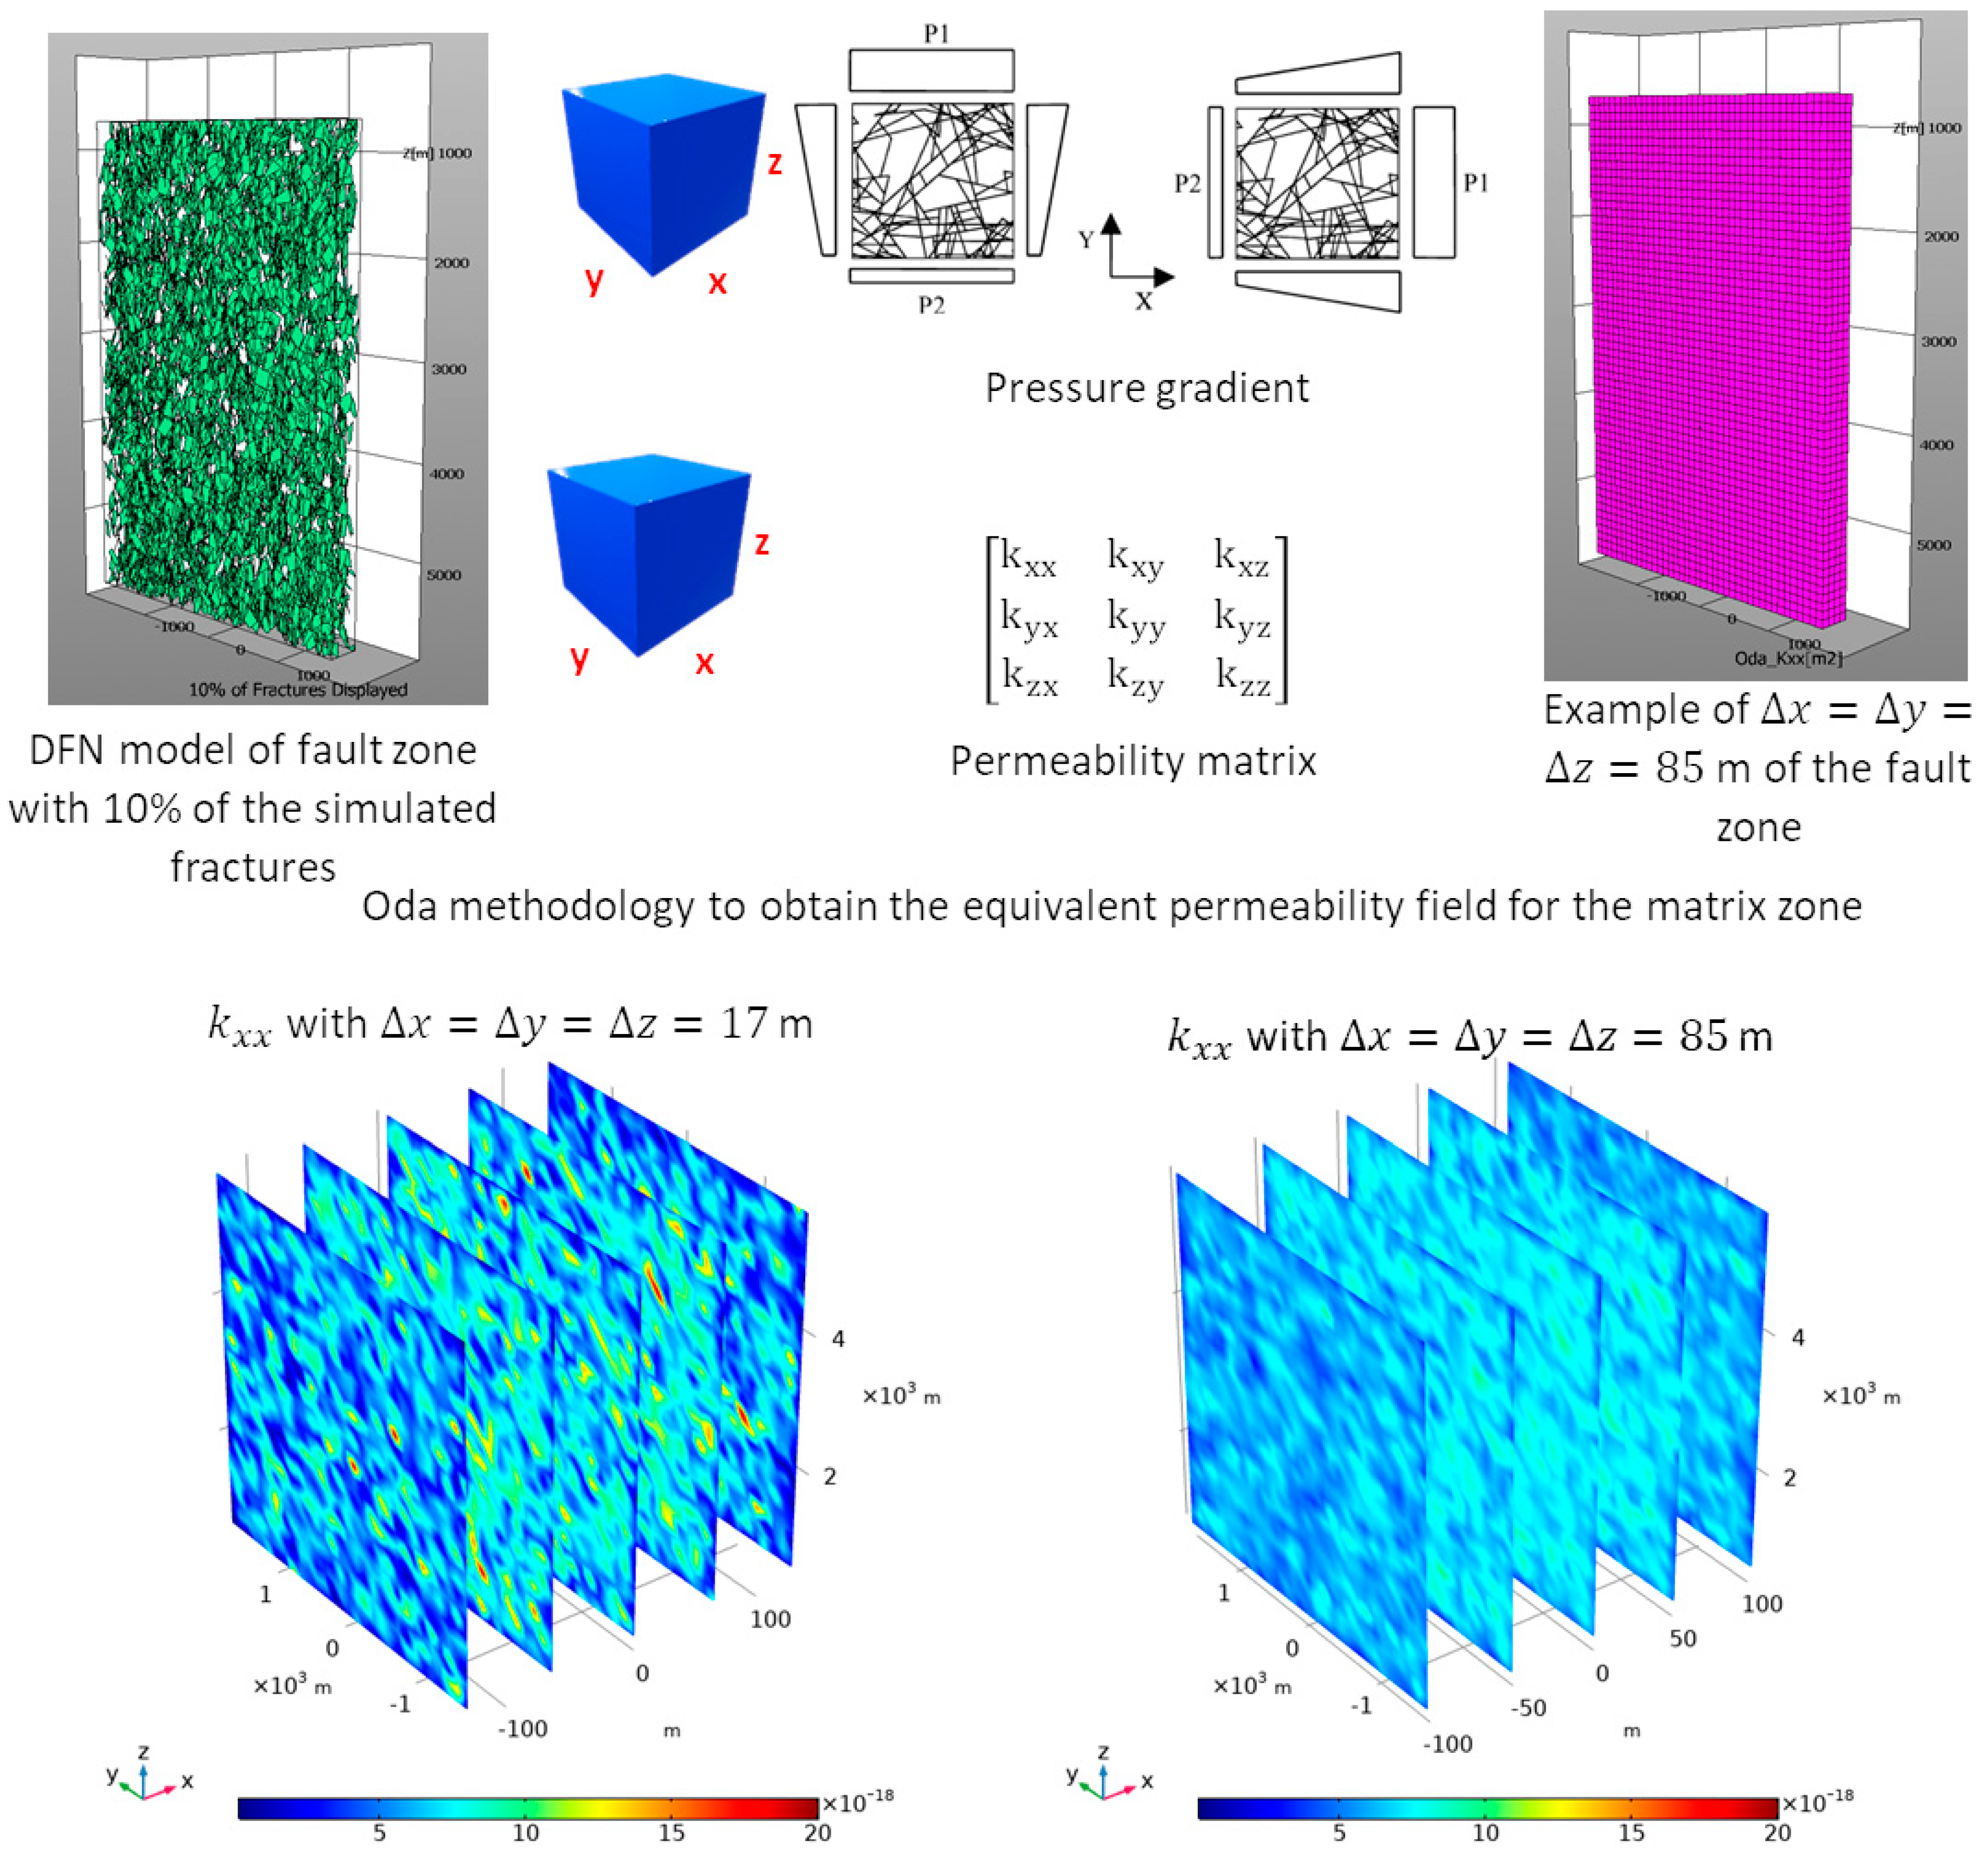
Within the fault zone, 10 million fractures were produced with FracMan based on the fracture network characteristics presented in Table 1 and Table 2. This output is difficult to present in a DFN framework included in numerical simulation software. Hence the upscaling of the permeability of the single fractures of the corresponding networks into an equivalent permeability field becomes a necessity. To calculate the equivalent permeability field, the Oda approach [27], as implemented in FracMan, was used. Oda [27] employed the geometry of fractures to calculate effective permeability for a given grid with a given pressure gradient. Inside the FracMan, Poiseuille law is used to calculate the fracture permeability from the fracture aperture. The roughness of the fracture is considered one. Using the orientation of individual fractures present in a grid cell and assigning each fracture as a unit normal vector n, a tensor depicting the mass moment of inertia of fractures normally distributed over a unit sphere was obtained through integration of the fractures over all of the unit normal [17]. Figure 7 shows the equivalent permeability field estimation using the Oda method, and it is obvious that the heterogeneity of the final permeability field is a function of the grid size. A smaller grid size results in a more accurate representation of the heterogeneous permeability distribution of the fractured rock mass than a large grid size, where single permeable fractures are less well represented. However, reducing the grid size increases the computational cost. While the permeability range of the permeability field created with the fine grid size is larger than for the coarse grid size, the mean permeability value is approximately the same. Therefore, the coarse grid size, which still provides a sufficiently accurate representation of the fractured reservoir, is used in this study to minimize the computational cost. The permeability field resulting from the Oda methodology for the fault zone is a heterogeneous field that is implemented through the TH calculations in the COMSOL. Consider that meshing for the equivalent permeability from FracMan (structured rectangular mesh) is different than the simulation meshes in the COMSOL (unstructured tetrahedral meshes). Therefore, permeability values mapped from the structural rectangular to the unstructured tetrahedral inside the COMSOL. The average value of the permeability field in anisotropic matrix is reported as below with the highest value in the z direction and the second highest value in the y-direction, both subparallel to the fault zone strike, which shows the effect of the fracture set orientation (see Table 2):
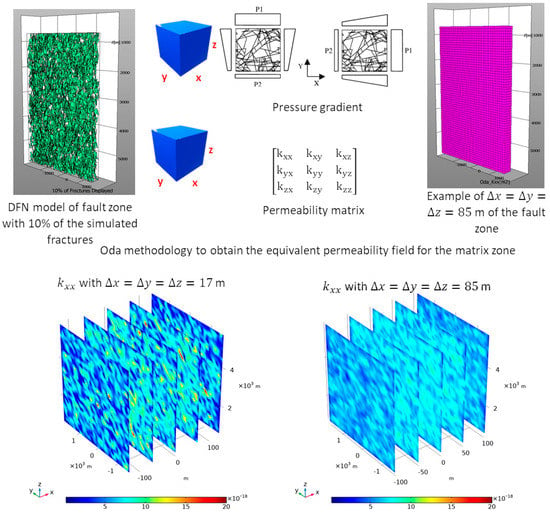
Figure 7.
Oda methodology [27] to calculate the equivalent permeability field and its sensitivity to the two different mesh sizes (17 and 85 m, respectively). Upper left: first, a stochastic DFN of the fault zone and host rock is created based on the fracture network characteristics; Upper middle: then, using the Oda approach, a permeability field is calculated for each cell of a given grid (upper right) separately. The bottom panels show the heterogeneous permeability field for the matrix zone for two different mesh sizes for the equivalent permeability estimation (lower right and lower left). The unit of permeability is m2.
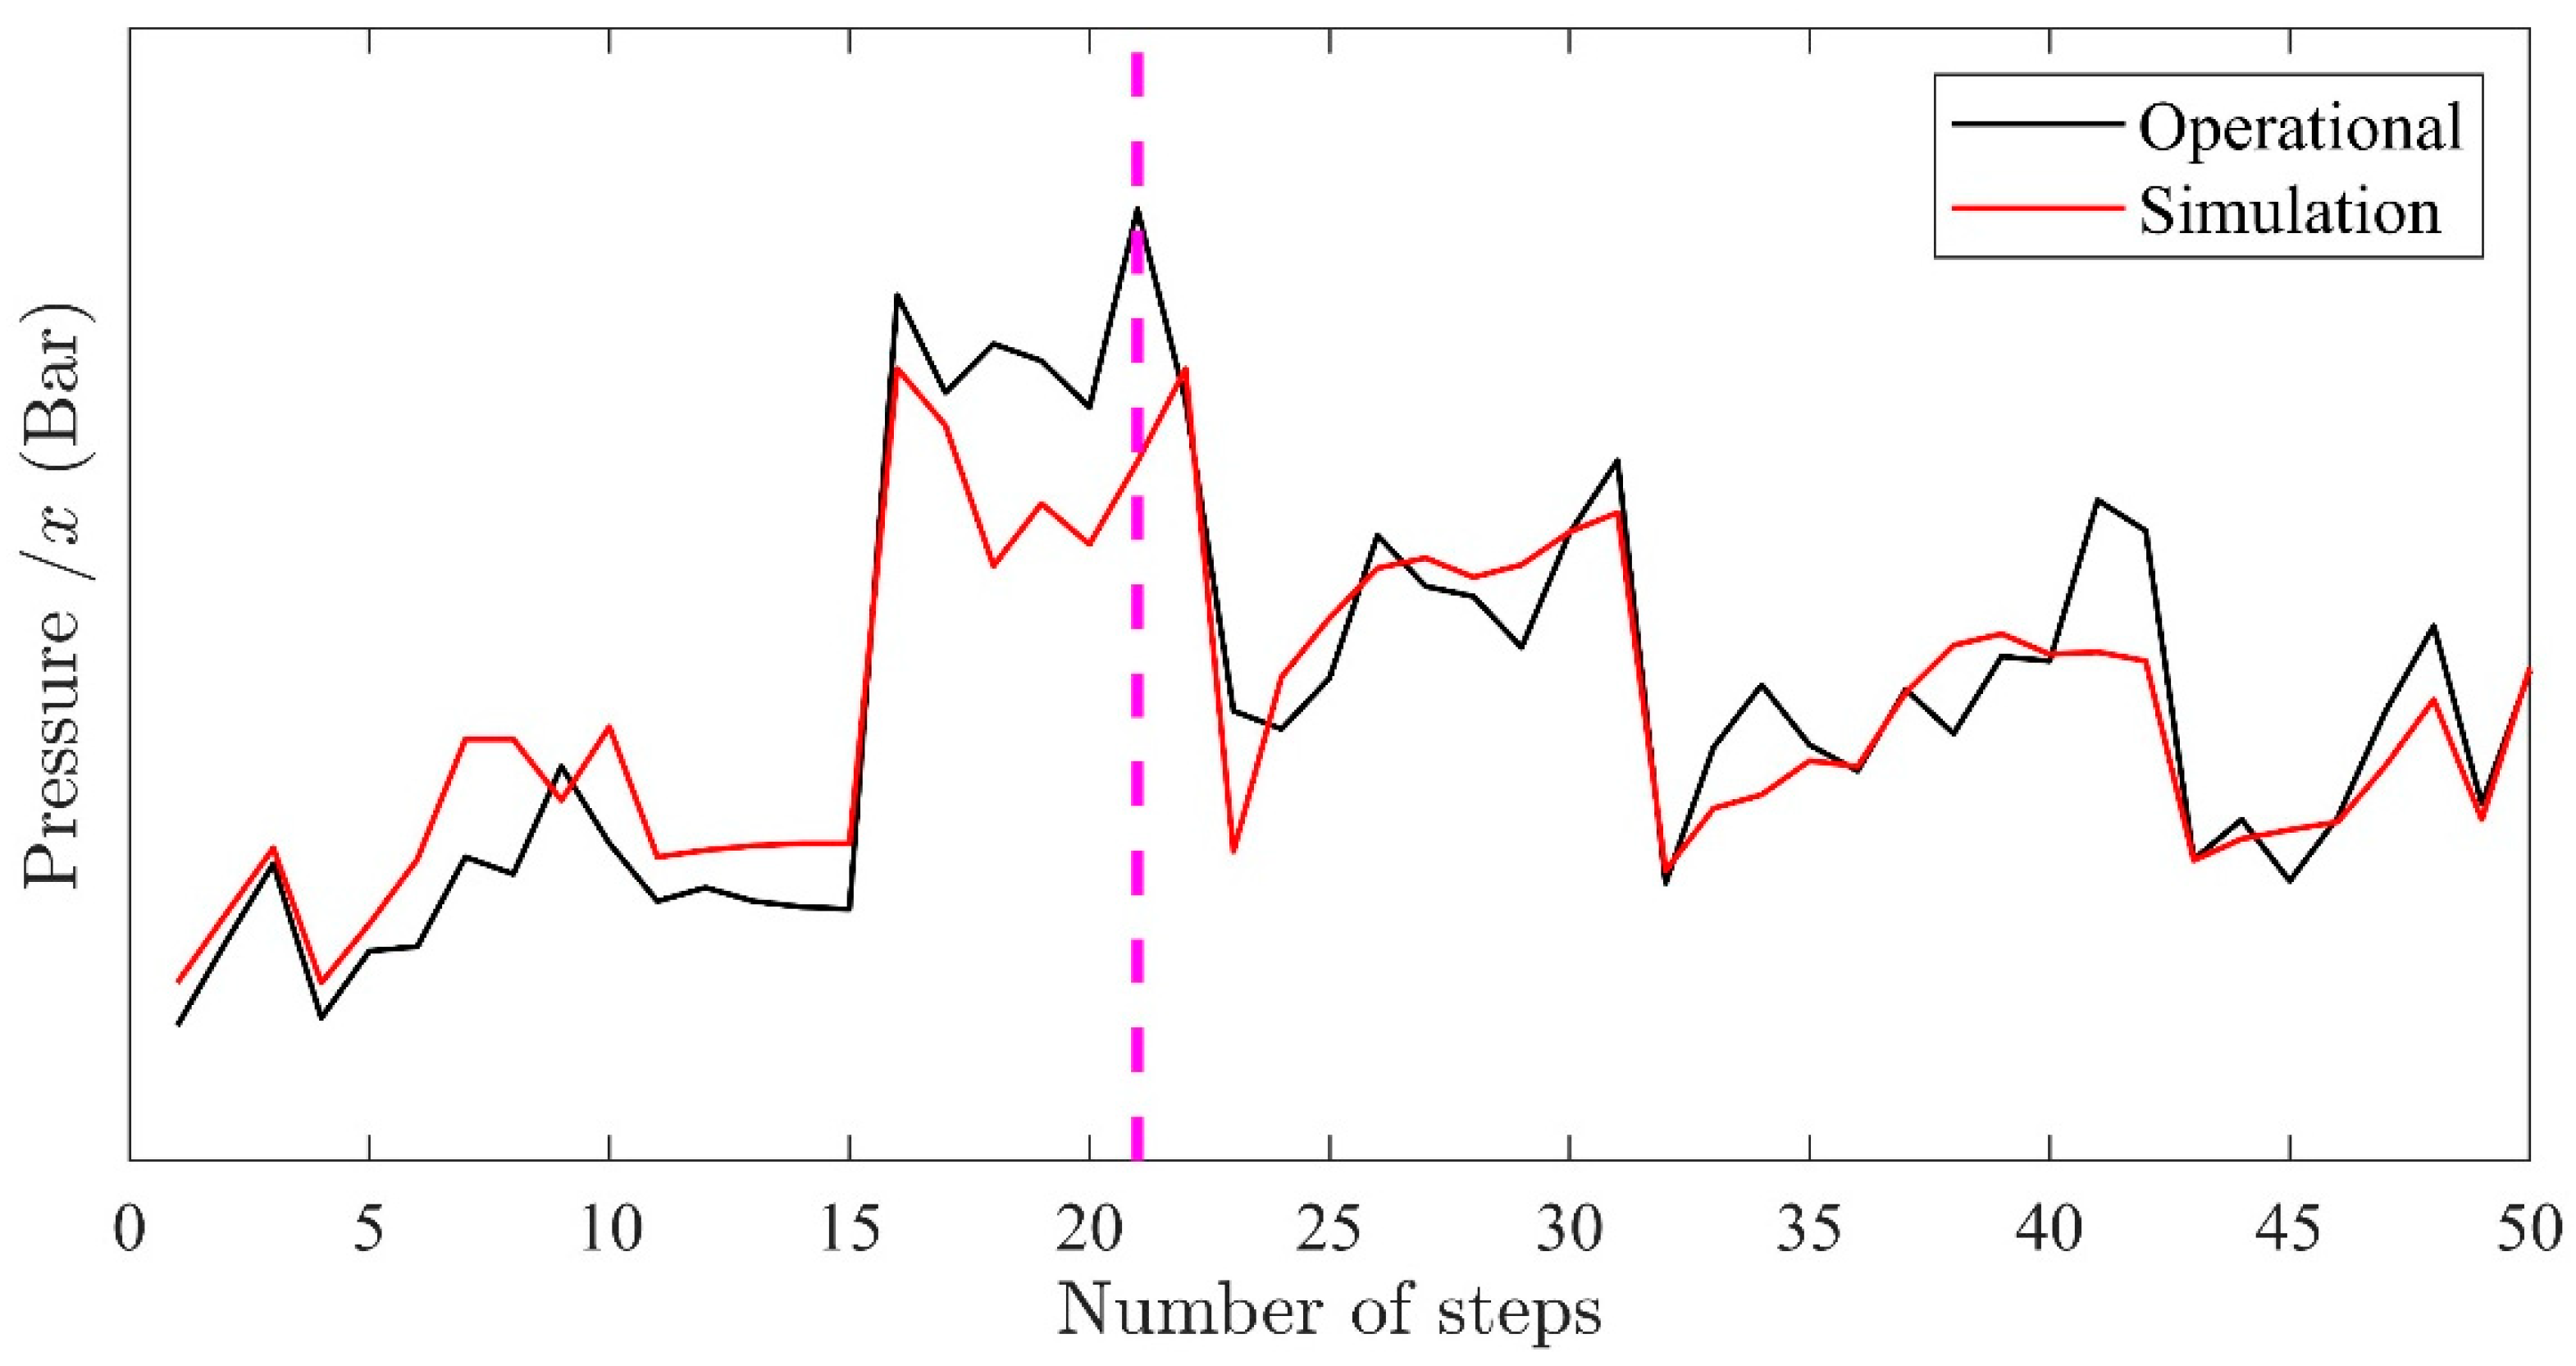
The reported data from the field work, logging and literature (see Table 2) shows that fractures are mainly vertically oriented, which aligns with higher permeability in the z-direction. Strike values with the fracture orientation in the x-y space indicate that their tendency towards the y-axis is greater, resulting in a higher permeability in the y-direction. While the fracture density slightly decreases with depth, a single averaged fracture density is used to simplify reservoir permeability for the entire fault zone. A similar approach is used to obtain the host rock permeability, and the resulting value is two orders of magnitude smaller than those of the fault zone. This limits the host rock’s contribution to the convective heat and mass flux while its effects are still considered in the numerical simulation. The possible discrepancy between actual field and simulated permeability fields is solved with a correction factor to the permeability fields of the Oda methodology based on the hydraulic testing data. Technically, the permeability obtained from the hydraulic test data could have been directly matched with the numerical model to obtain a realistic value, but in this case, the resultant reservoir permeability from the Oda method is heterogeneous. The DFN generation and Oda upscaling were chosen specifically to better reflect the anisotropic permeability field for the faulted reservoir. From Figure 8, it is clear that the pressure increases at a higher rate by increasing the peak flow rate until step 21. The obtained permeability field till step 21 is:
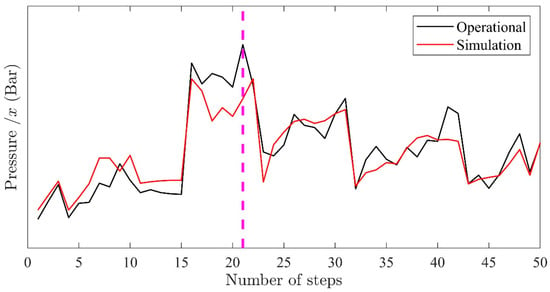
Figure 8.
Matching operational and simulation pressure data to obtain the permeability field before and after the hydraulic stimulation process. The pink dotted line marks the occurrence of a micro-seismic event, which significantly changed reservoir injectivity.
The above permeability field is thus 38 times smaller compared to the permeability obtained by the Oda approach. Possible differences between the actual fractures and the stochastic fractures can be attributed to differences in the fracture aperture caused by chemical reactions, physical precipitations, rough fracture surfaces, and stress reorientation or the general share of open vs. closed fractures.
After reaching the maximum injection pressure at step 21, Figure 5 indicates that the flow rates beyond step 21 do not increase the pressure in a similar magnitude with respect to steps prior to 21. This suggests that some pre-existing fractures are propagated to reduce the incremental pressure rate with increasing the peak flow rate. The initiation of new fractures can be ruled out due to the injection pressure being too small to exceed the tensile strength of the granite and due to the high fracture density of the formation. Therefore, step 22 is seen as proof of a significant hydraulic stimulation of the reservoir. Data matching is performed as shown in Figure 8 for two periods (before and after step 21), and the permeability tensor obtained by averaging the permeability field is 1.7 times higher than the initial rock permeability:
The obtained permeability field through the UD−1 well data is validated with the hydraulic testing and stimulation data of well UD−2. Figure 9 demonstrates a good match between the operational data and numerical simulation of UD−2 for the first three stages of injection. However, there is a discrepancy between the measured and modeled data, as shown in Figure 6 for 20 November. Based on this figure, the flow rate decreases to zero in the middle of the test and increases afterward. The operational data shows that the injection pressure increases following the initial trend without experiencing an impact due to the intermittent flow rate breaks. The numerical simulation for UD−2, on the contrary, shows that if the flow rate decreases only for a short time interval, pressure decreases for the rest of the entire injection step and does not reach the previous pressure level. The observed low pressure after a short gap in the injection is not due to the permeability change. Rather the pressure diffuses inside the system leading to pressure drop. It, therefore, seems likely that the flow rate stops and pressure drops are rather a measurement error while reporting the pressure and flow rate data or that the wellbore effect [26] between the wellhead and the reservoir section mitigates the flow rate and pressure drops.
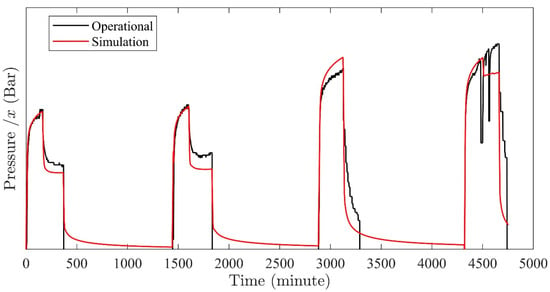
Figure 9.
Matching of the operational and simulation pressure data of the UD−2 hydraulic injection/Stimulation tests to validate the simulated permeability field obtained from the UD−1 operational data.
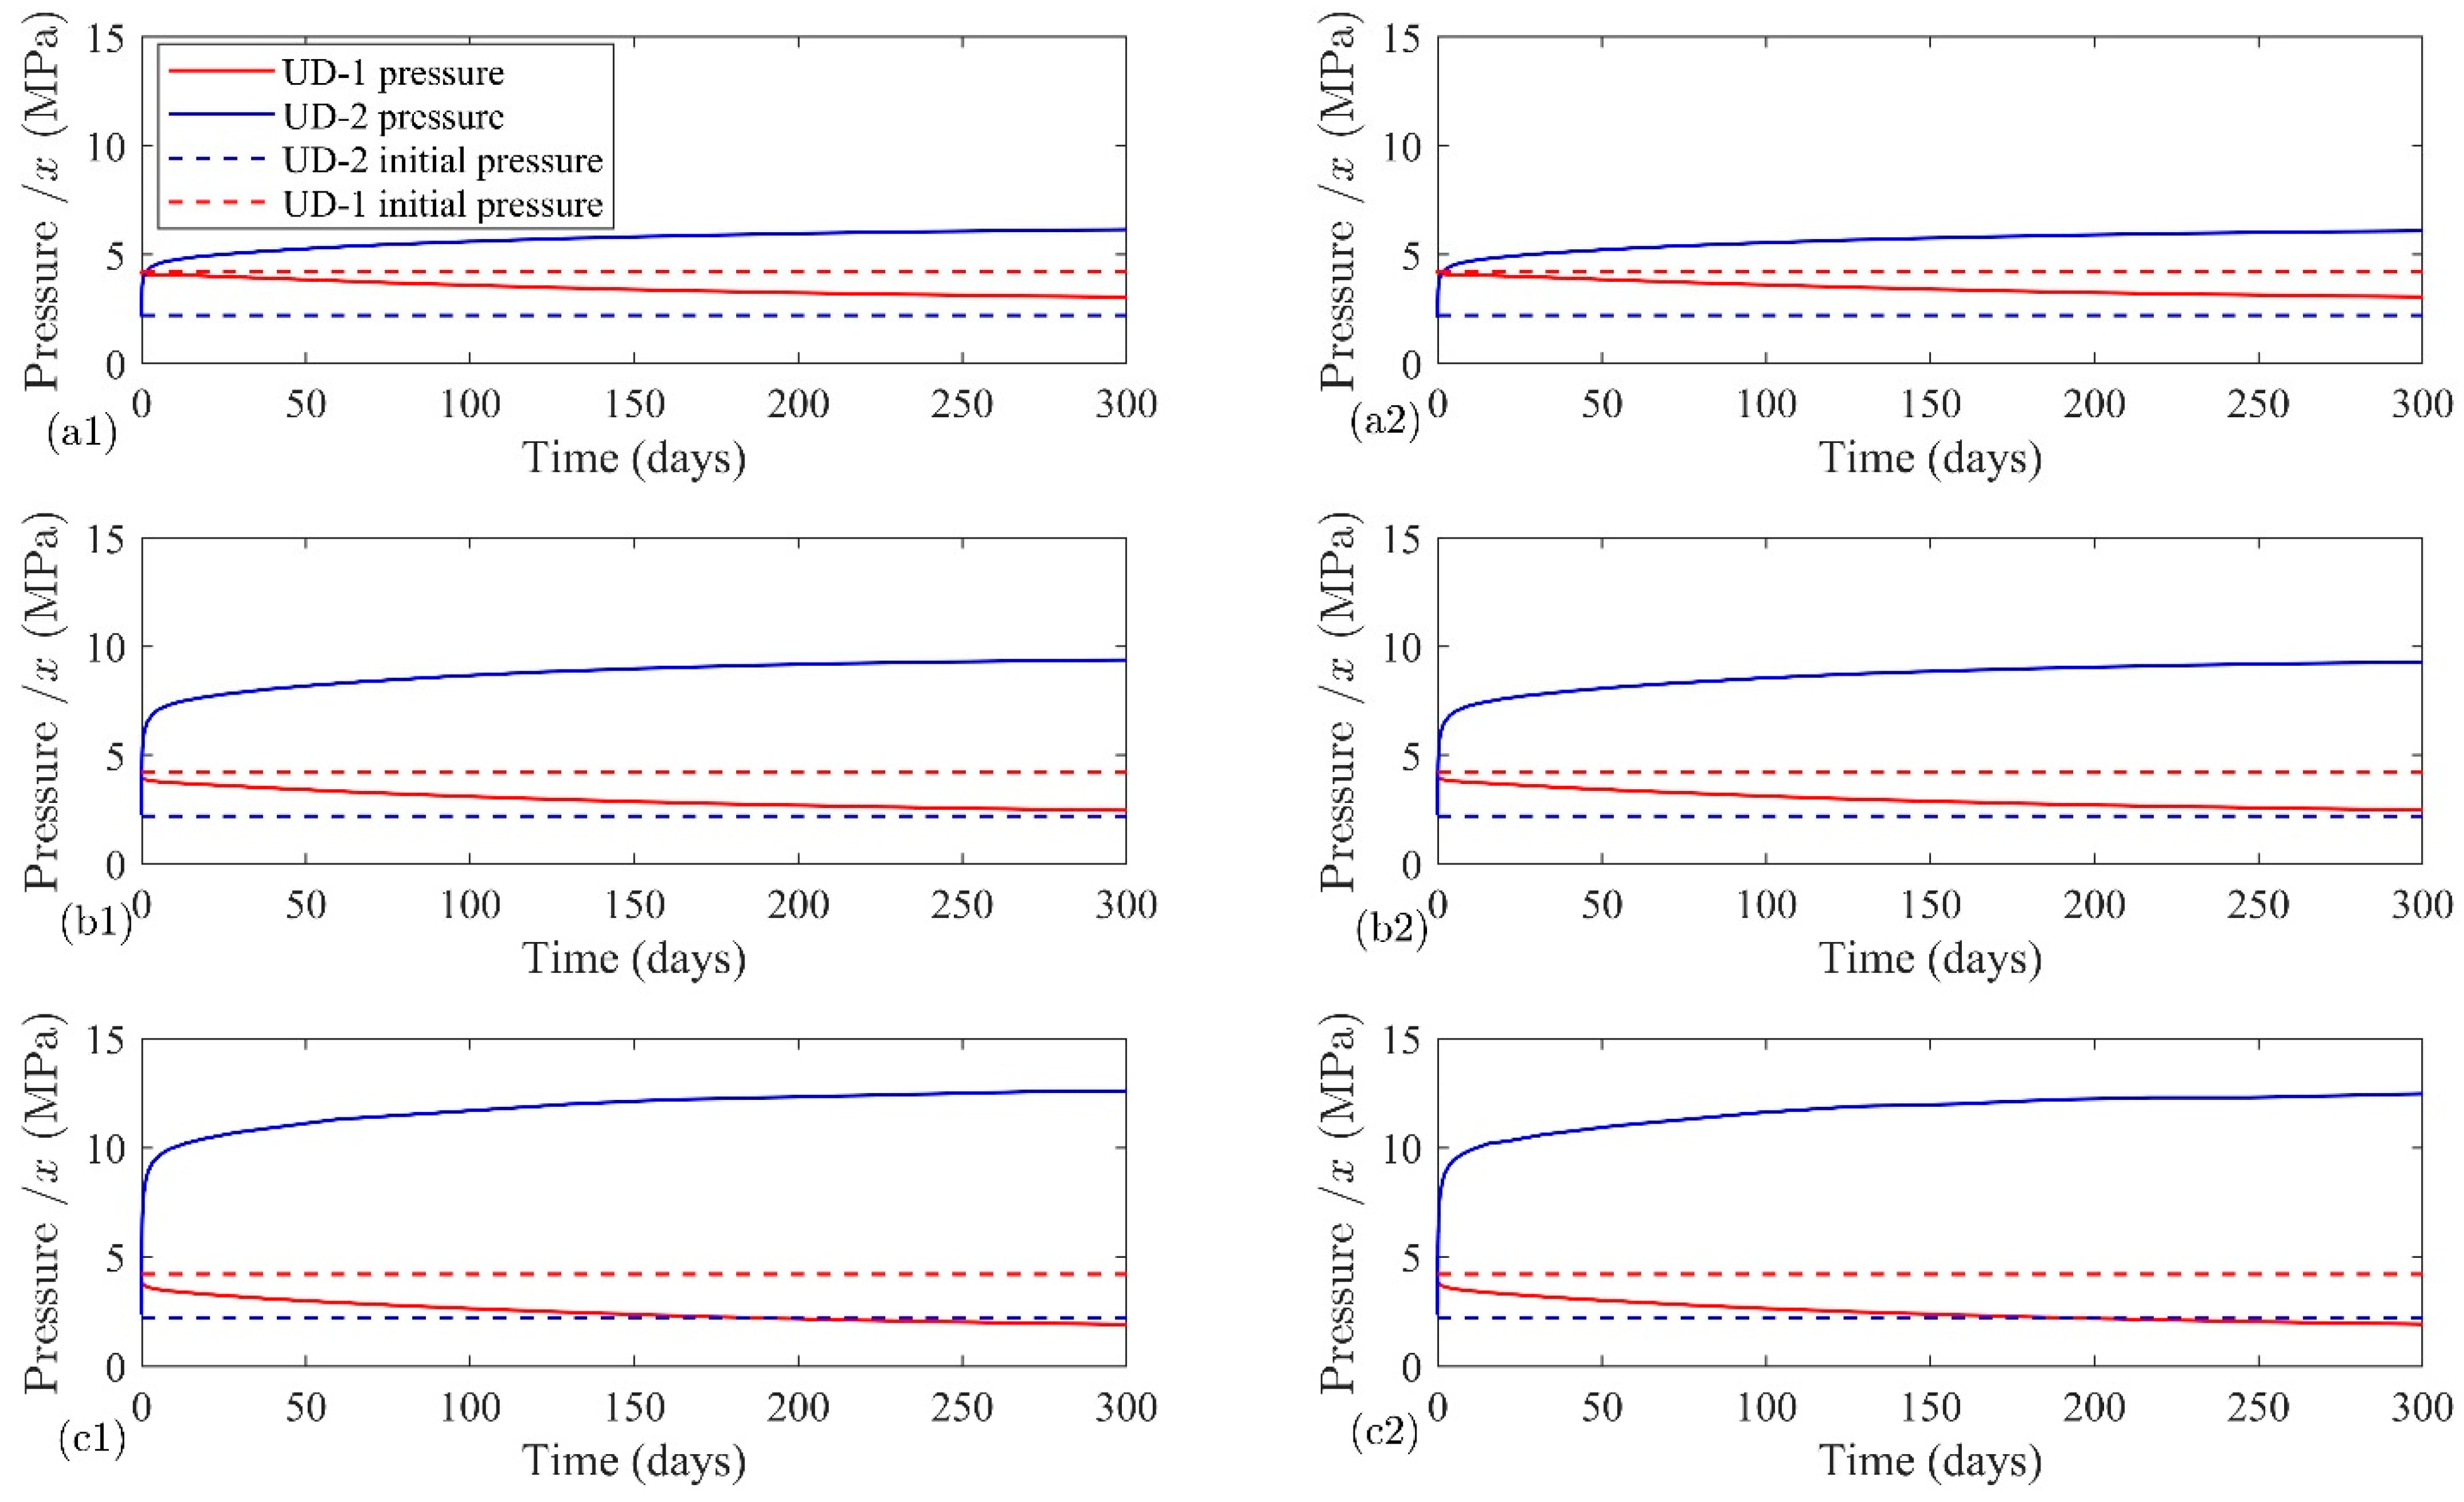
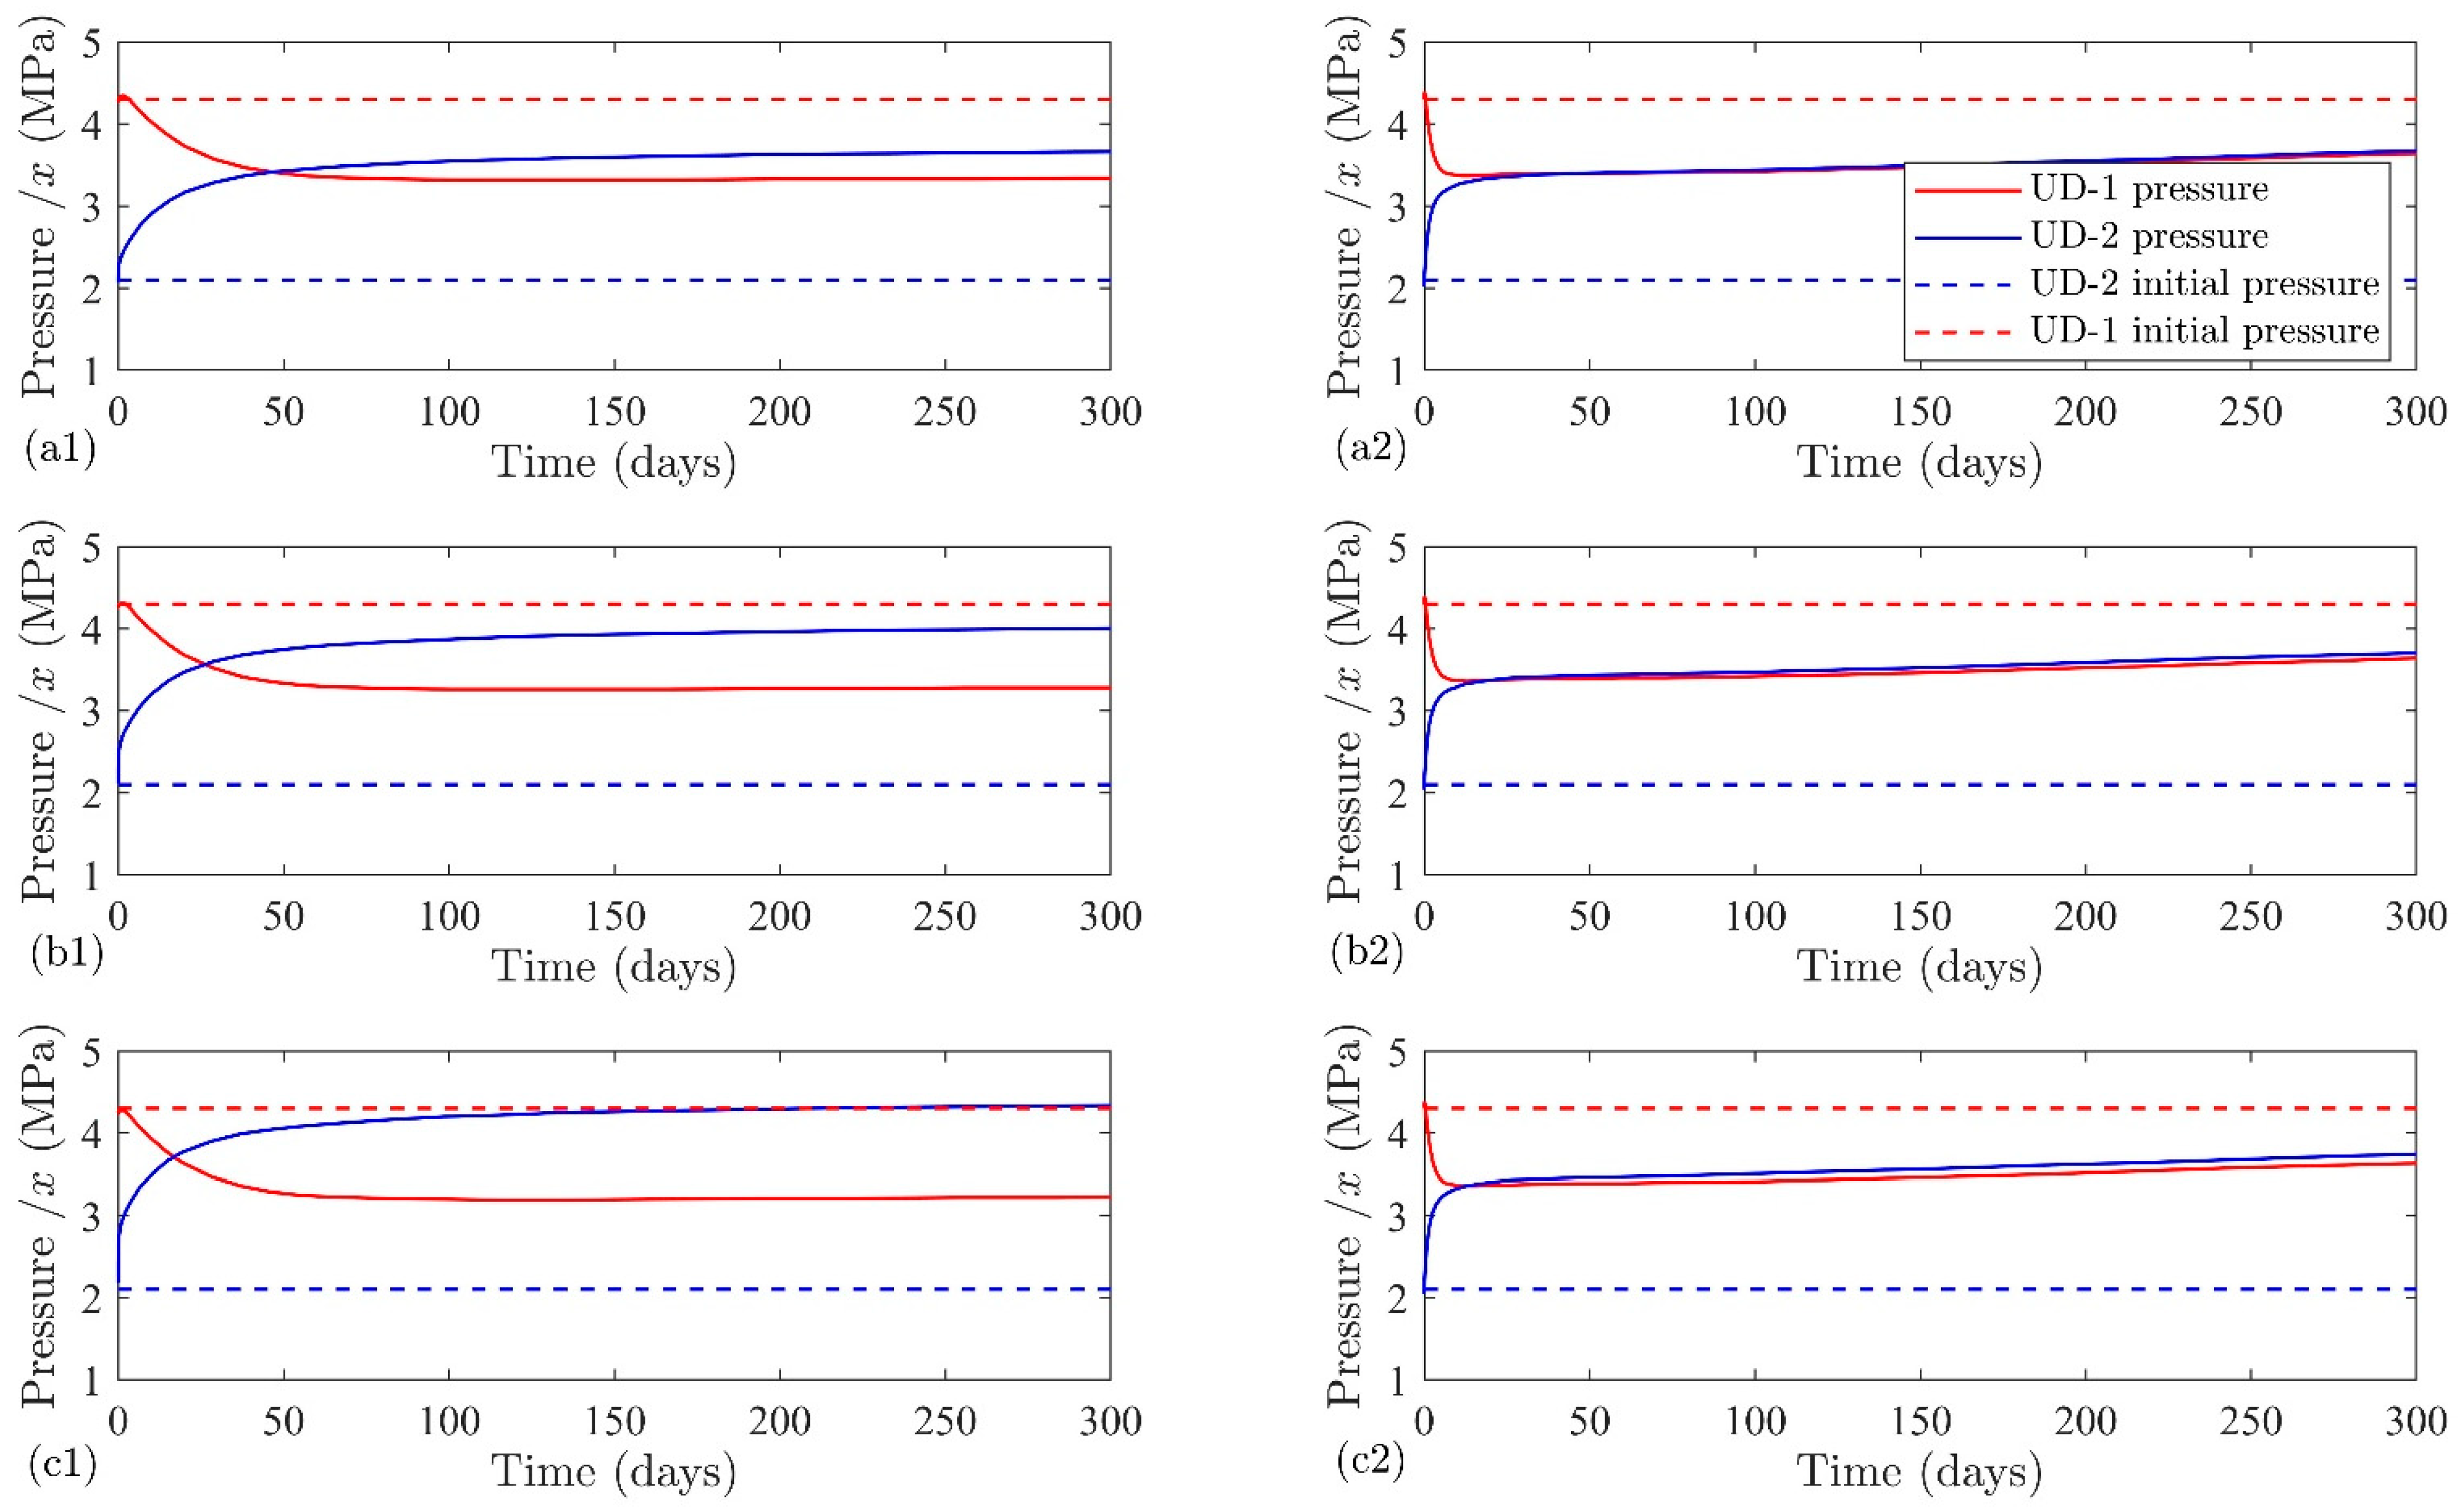
It should be noted that these short-term hydraulic stimulation results are restricted to the near wellbore area, and do not influence the far-field of the reservoir. Therefore, uncertainty remains regarding the volume of the reservoir, which is affected by this operation. To examine the near wellbore effect, a cylindrical zone around UD−1 is considered in which the permeability is changed by hydraulic stimulation. Two radii of 25 and 50 m are considered for this zone, and the behavior of the system is modeled at three fluid rates of , and L/s. Figure 10 shows the resulting pressure data on the bottom of the UD−1 and UD−2 based on different flow rates and hydraulically affected area radius. There is no data to show which radius around the wellbore is affected by the hydraulic stimulation. By comparing 25 and 50 m, it is shown that the region size is not important for the studied time periods, but the amount of permeability changes is important. Another model without considering this cylindrical region is run, and the results are different than the operational observations (see Figure 8). This permeability variation importance around the production wellbore is not exactly for this studied short time period, but for the long-term operation, authors showed in another study that permeability around the production wellbore is an important factor [26].
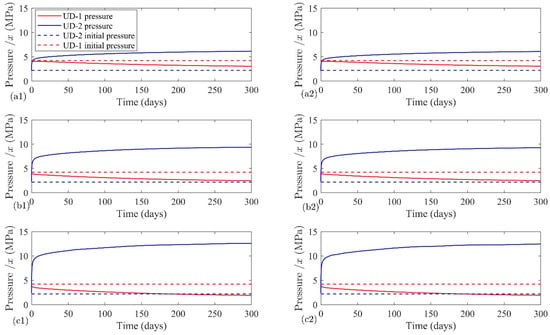
Figure 10.
Simulated pressures at the injection and production wells for injection flow rate of (a1,a2) L/s, (b1,b2) 2 L/s and (c1,c2) 3 L/s. The left panels are plotted for a hydraulically stimulated region that spans over 25 m, whereas it is 50 m for the right panel.
Initially, the simulated pressures of the UD−1 are higher than UD−2 due to the hydrostatic pressure. By injecting fluid at UD−2 and producing from UD−1, they experience pressure buildup and drawdown, respectively. Obviously, by increasing the flow rate, the pressure separation between the two wells increases at later times. Pressure changes are greater at early times, and as time goes on, pressure show semi-steady behavior, and the operator can decide regarding the optimal flow rate. For example, for the cases with 25 m of hydraulically stimulated area, the pressure after ten days reaches , and MPa with flow rates of , 2 and 3 L/s, respectively, whereas after 150 days it becomes , and MPa respectively. However, there is not much change between 150 and 300 days, where in the latter case, the final pressure values are , and MPa for the flow rates of x, 2x, and 3x L/s, respectively. Correspondingly for UD−1, a decreasing trend is observed at a gentle gradient. For the flow rates of , 2 and 3 L/s, observed pressure values after ten days are , and MPa, respectively, which becomes , and MPa, respectively, after 150 days which finally reaches to , and MPa, respectively, after 300 days. This analysis shows that pressure differences between the two wells are , and MPa after 300 days for three flow rates, , 2 and 3 L/s, respectively. It is interesting to note that from an economical point of view, the higher flow rate is attractive, but it may eventuate the seismic events. During the examined period, the radius of the hydraulically stimulated area near the UD−1 has a negligible effect on the pressure profiles in comparison to the flow rate. The pressure differences between the wellbore for a 50 m radius of hydraulically stimulated zone reach , and MPa after 300 days for , 2 and 3 L/s injection rates, respectively. Therefore, in the remaining parts, a small radius of 25 m is examined. Similar behavior is recognized by Mahmoodpour et al. [26] that the permeability field in the vicinity of the production well is an important factor.
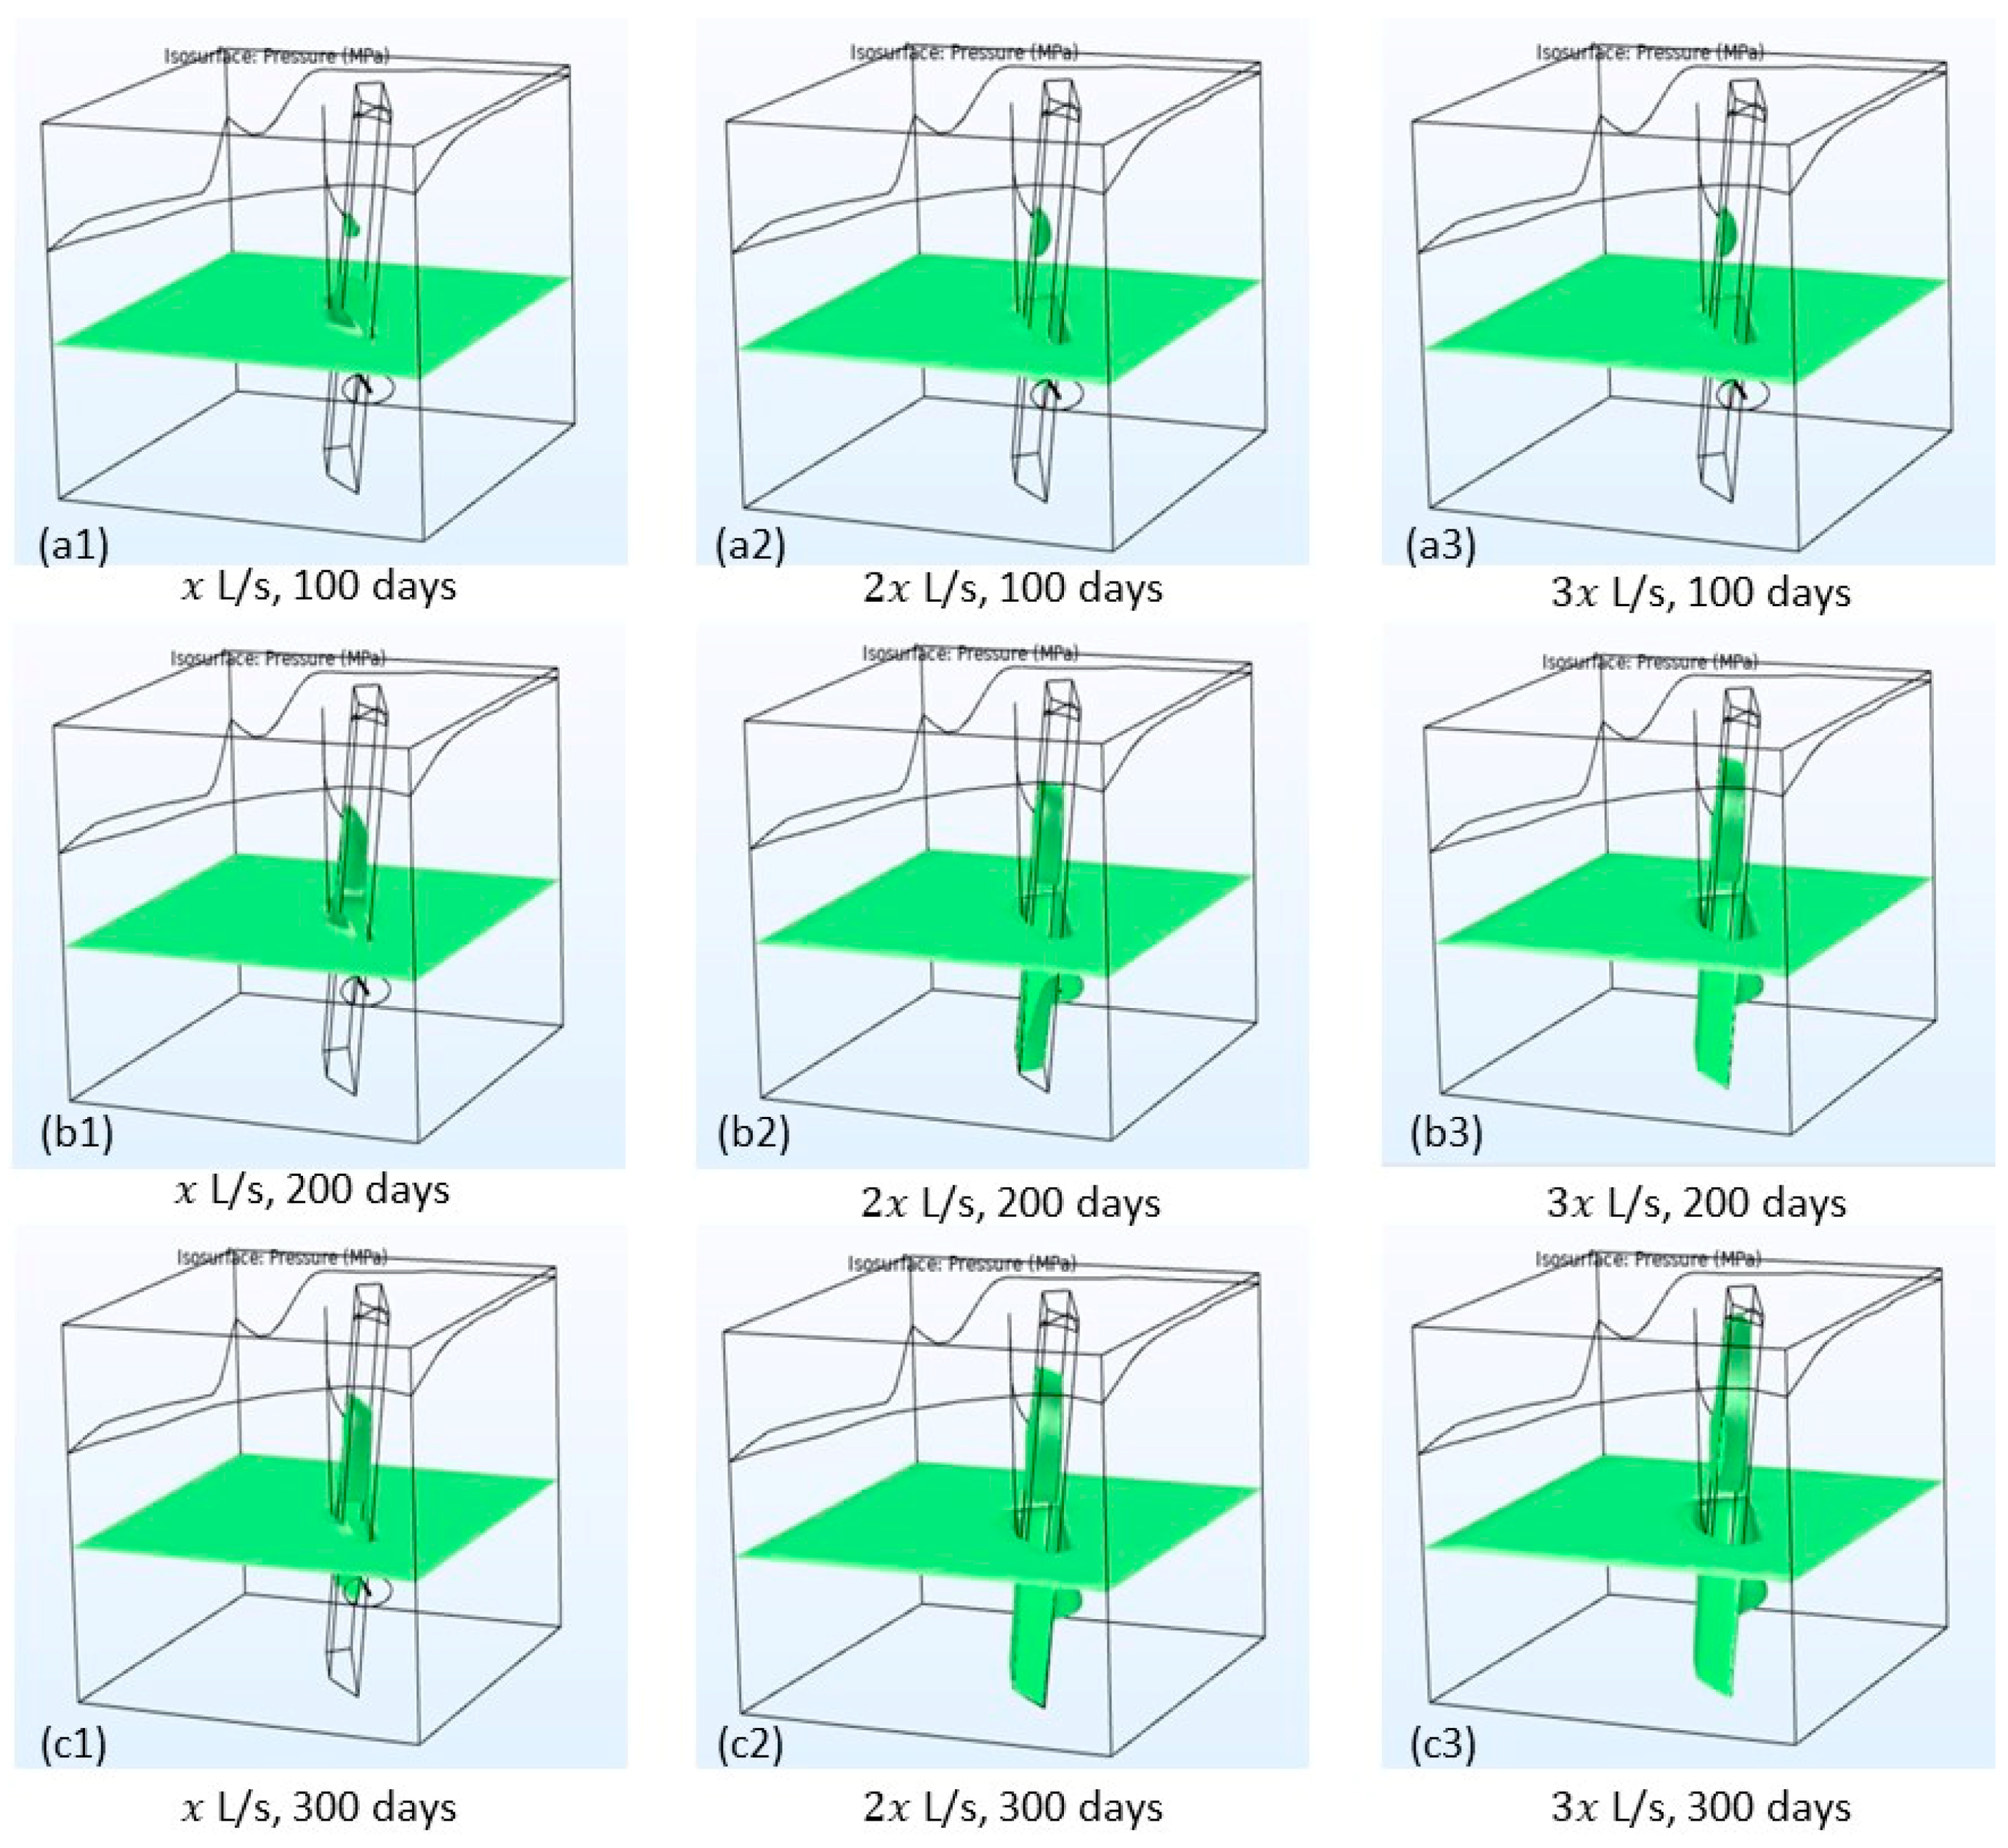
Figure 11 shows the pressure plume development at iso-surface of MPa after 100, 200, and 300 days of the injection. At the early time, the pressure around the UD−2 is lower than MPa, and around the UD−1, pressure is higher than MPa. Therefore, small pressure iso-surfaces around the wells being observed. As time goes on, the pressure near UD−2 increases and near the UD−1 decrease, and the trend of these changes in Figure 11 is clearly obvious. Obviously, with increasing the injection and production flow rates, the plume size increases. Furthermore, due to the higher permeability of the fault zone, pressure changes mainly happen inside the fault zone and two large-scale fractures, which are detected through seismic events. These sharp pressure changes (and consequently the stress changes not discussed in this paper) inside the fault zone requires special attention to examine the possibility of the seismic events.
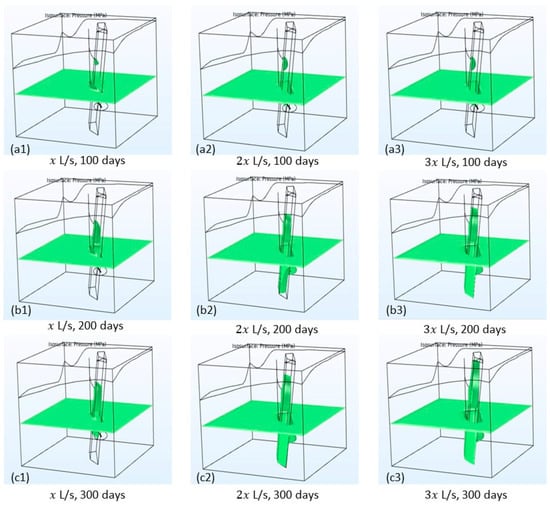
Figure 11.
Pressure plume development for three different injection rates at three different times. The iso-surfaces are plotted for MPa.
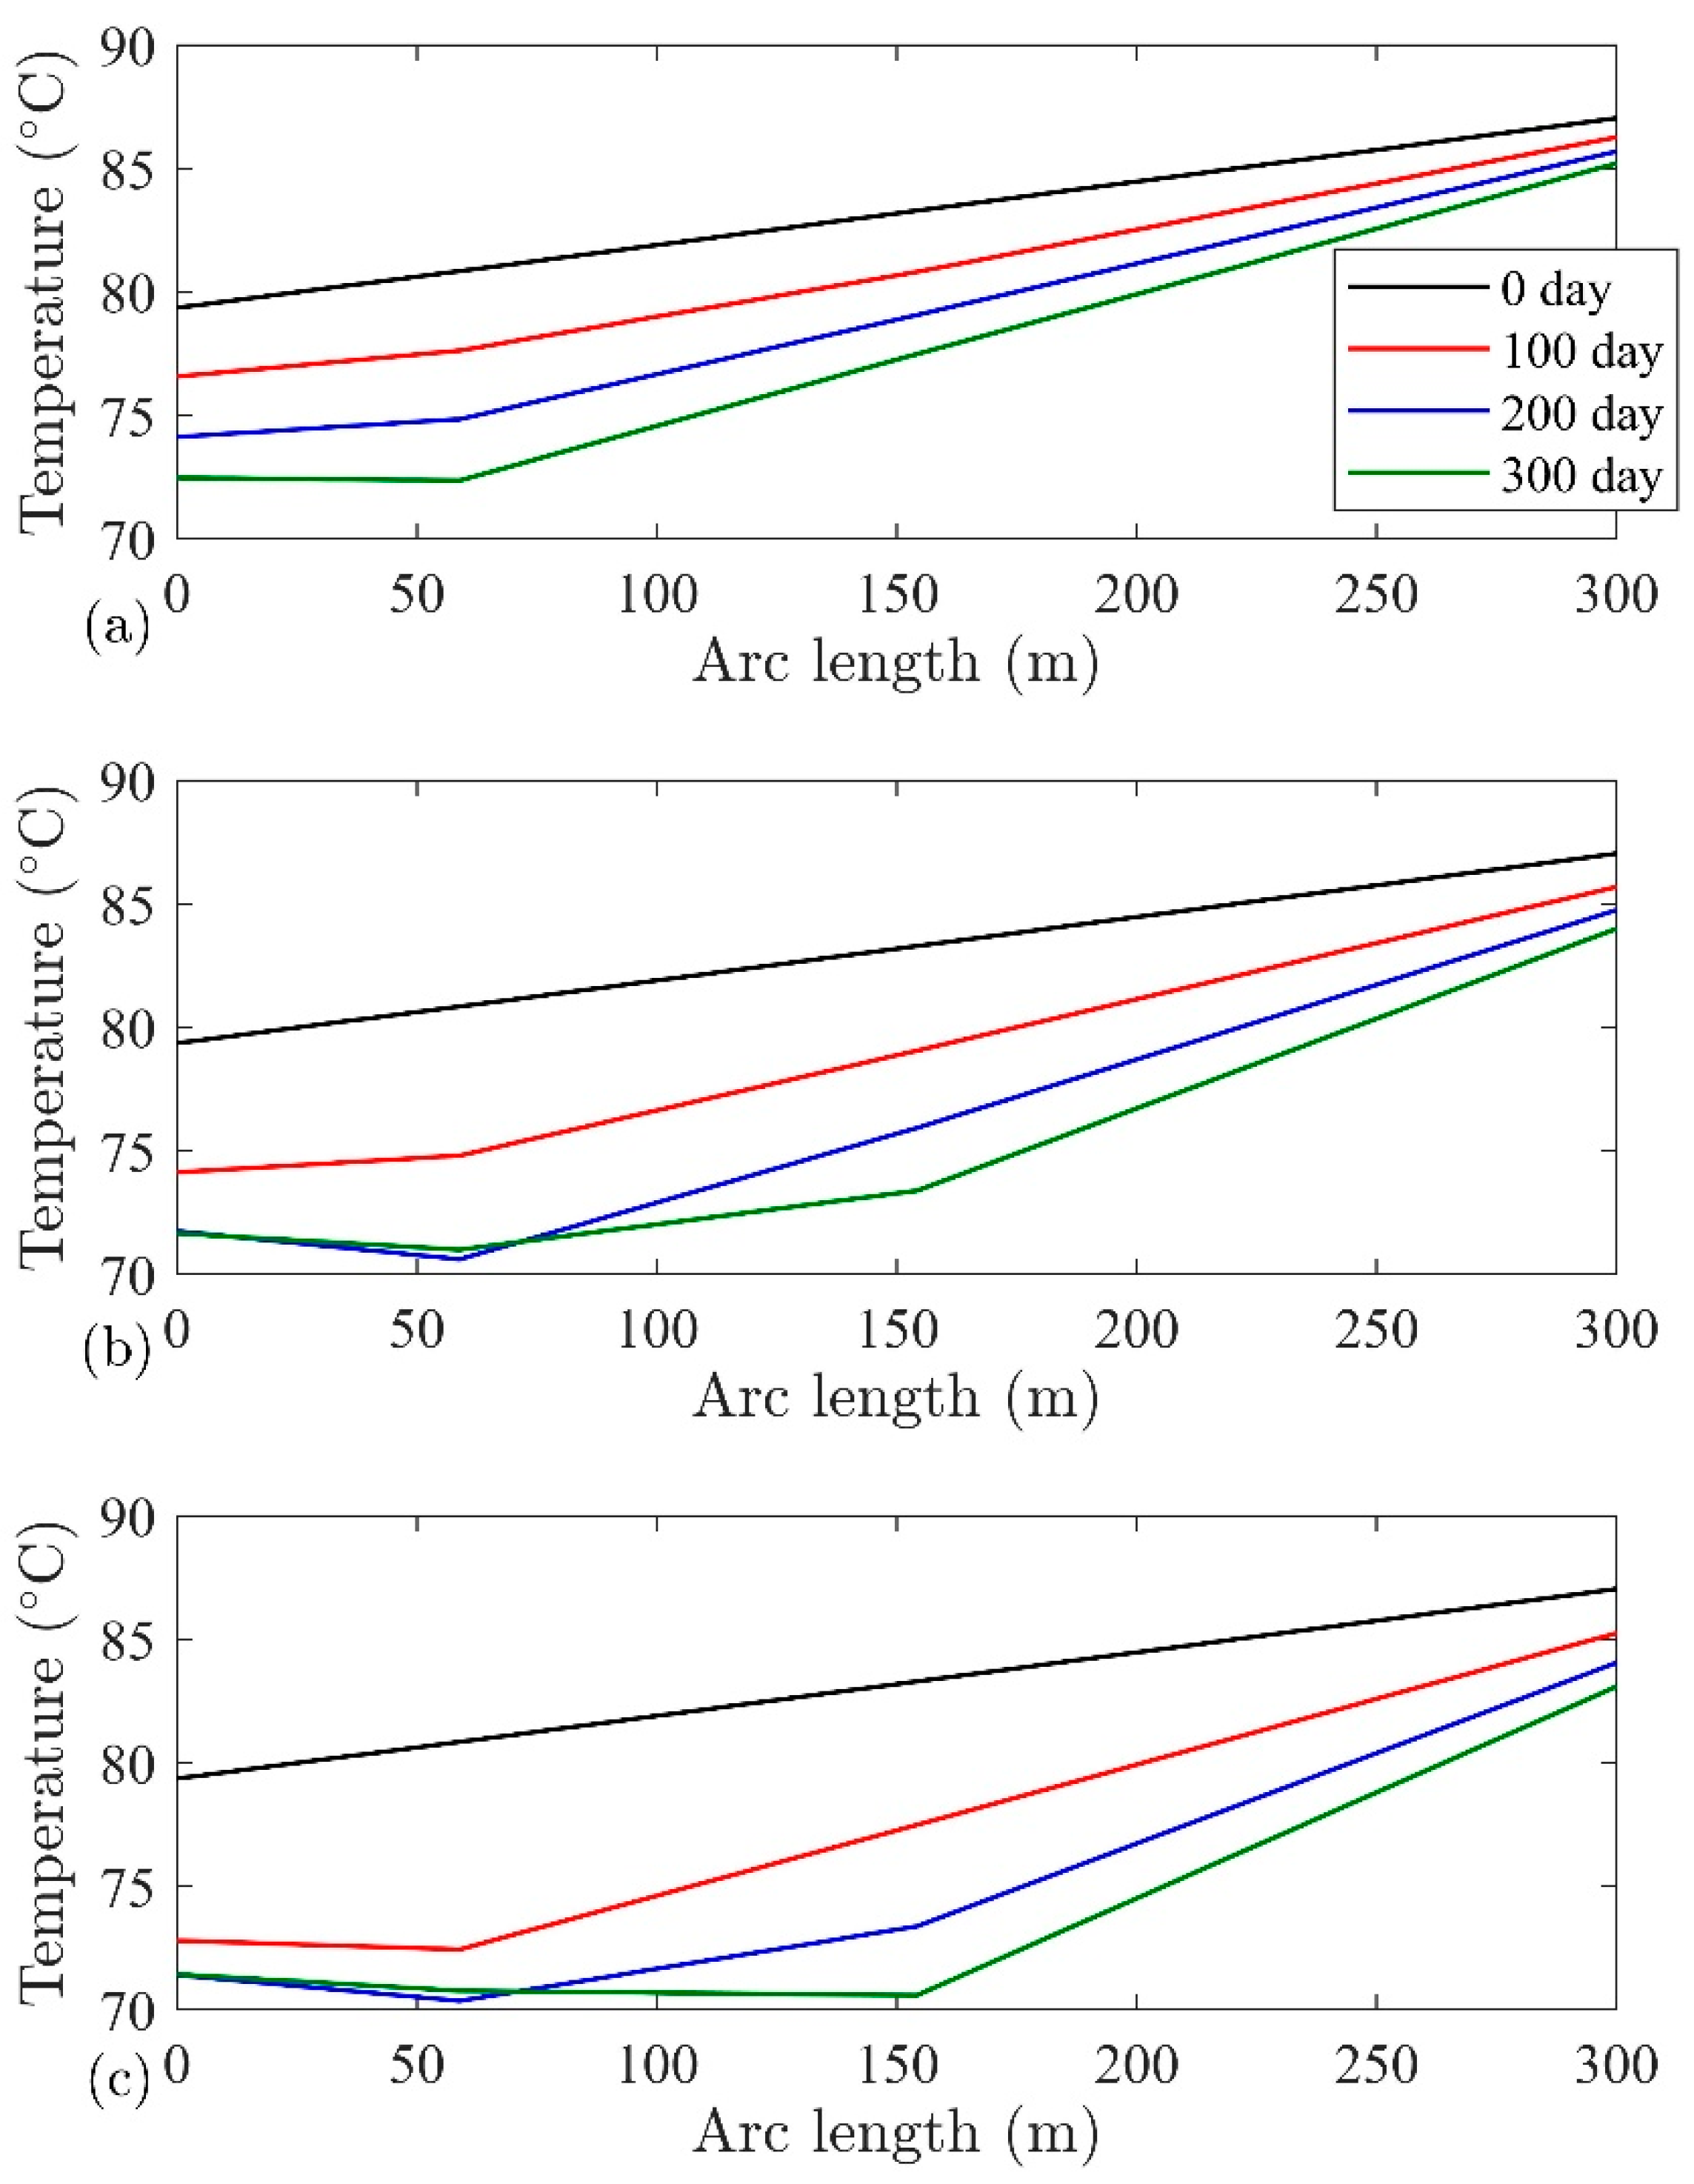
During the 300 days, the temperature changes are limited near the injection well. Therefore, to examine the effects of different flow rates on the temperature, temperature changes alongside the open hole section of the injection well and inside the fault zone are being considered, which is very close to the wellbore in Figure 12 for different flow rates. On the horizontal axis, 0 m shows the top point of the open hole section of the injection well, and 300 m shows the bottom point of this section. Initially (0 days in the graphs), the temperature distribution follows up the temperature gradient of the system. As time goes on, the cold front propagates to the deeper zones of the reservoir. An increase in the flow rate increase the speed of the temperature front propagation in the farther regions, and it shows that the heat transfer process is mainly controlled by the convective mechanism. The possibility of higher fluid injection should be examined through the techno-economic aspects. The increasing flow rate will increase the heat extraction rate at early times. On the other hand, it increases the possibility of seismic events and early breakthrough time [25].
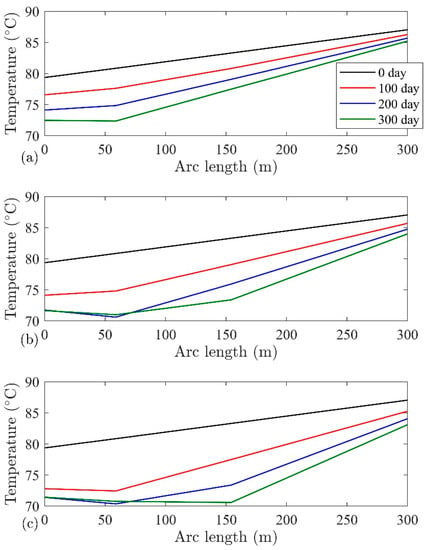
Figure 12.
Simulated temperature alongside the open hole section of the injection well UD−2 for the injection flow rates (a) L/s, (b) 2 L/s, and (c) 3 L/s. The arc length is measured from the top of the open hole section of the well that falls inside the Porthtowan Fault zone.
The acid injection may increase the permeability to a higher extent than the hydraulic stimulation. Preliminary studies in the core scale samples from the rocks of this reservoir show a good outcome of the acid injection and the possibility of permeability increase between 4 and 50 times in core-flooding tests, but the autoclave experiments show this increment between 0.1 (this shows that permeability decreases up to the 10 % of the initial value and it explains the possible precipitation which is visible in the microscopic scale) and 40 times [28]. Therefore, we assumed imaginary cases of permeability alteration by ten times, and 100 times in comparison to the initial state due to the possible acid injection process at the reservoir scale using a cylindrically affected region surrounding the wellbore with a radius of 25 m. Figure 13 (left column) shows the results for ten times of the permeability enhancement where the pressure of UD−2 after ten days reaches , and MPa with flow rates of , 2 and 3 L/s, respectively, whereas after 150 days it becomes , and MPa, respectively. While, there is not much change between 150 and 300 days, where in the latter case, the final pressure values are , and MPa for the flow rates of , 2 and 3 L/s, respectively. Correspondingly for UD−1, these values are , and MPa for the flow rates of , 2 and 3 L/s. After 150 days, pressure values are , and MPa, respectively, which becomes , and MPa, respectively, after 300 days. Therefore, the pressure difference between the two wells is , and MPa after 300 days for three flow rates, , 2 and 3 L/s. From this pressure behavior, it is clear that the acidizing process for ten times permeability increment has a great potential to increase the flow rate with a huge decrease in the pressure gradient between the two wells, compared to only hydraulic stimulation. Experimental studies show that this permeability enhancement is attainable at the core level [26]. For the case of 100 times in the permeability enhancement, all flow rates show the same pressure behavior indicating the presence of a highly conductive region between the injection and production wells, which has a significant impact on the pressure gradient. At later times for both permeability enhancement scenarios, the pressure of UD−1 increases, demonstrating the production of injected fluid rather than the production of fluid initially residing in the fault zone.
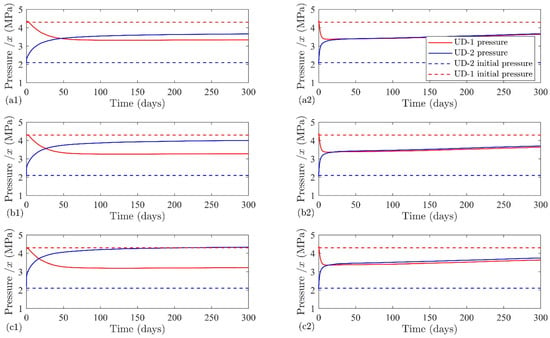
Figure 13.
Simulated pressures at the injection and production wells for the injection flow rate of (a1,a2) L/s, (b1,b2) 2 L/s, and (c1,c2) 3 L/s after the permeability enhancement through the considered chemical stimulation. The left column shows a permeability enhancement by a factor of 10, and the right column shows a permeability enhancement by a factor of 100 with respect to the initial values.
4. Conclusions
In this study, hydraulic injection testing/stimulation operations for both the wells of UDDGP are numerically simulated. Results are used to characterize the permeability field of the system and examine pressure development based on different injection flow rates. Results show that pressure changes are occurring primarily in the early time, with later time showing a semi-steady pressure increase. With the current permeability field after the hydraulic stimulation operation, huge pressure differences develop by increasing the flow rates. The possible effect of chemical stimulation operation on the permeability is considered through the data obtained from the lab-scale models, and reservoir response after the permeability modification is numerically simulated. Results for the permeability enhancement of the 10-time compared to the initial value due to the chemical stimulation (it is attainable as shown by experiments) enable us to triple the flow rate with one-third of the initial pressure difference without chemical stimulation. The reported values and the reservoir characterization performed during this study will build a basis for future numerical simulations for the United Down geothermal site.
Author Contributions
Conceptualization, S.M., M.S. and K.B.; methodology, S.M. and M.S.; software, S.M. and M.S.; validation, S.M. and M.S. writing—original draft preparation, S.M., M.S., C.O., S.K.T.; writing—review and editing, J.R., K.B.; visualization, S.M., M.S., C.O.; supervision, K.B. and I.S.; project administration, K.B., I.S.; funding acquisition, K.B., I.S. All authors have read and agreed to the published version of the manuscript.
Funding
The work is conducted as part of the MEET project that has received funding from the European Union’s Horizon 2020 research and innovation program under grant agreement No 792037.
Data Availability Statement
Due to the confidential nature of the field data, the exact units of the data are hidden.
Acknowledgments
Group of Geothermal Science and Technology, Institute of Applied Geosciences, Technische Universität Darmstadt has provided institutional support to the authors. The authors would like to acknowledge Geothermal Engineering Limited (Ryan Law and Hazel Farndale) for providing the well-testing data for the hydraulic stimulation operations conducted from September 2020 until February 2021. Additionally, we would like to thank two anonymous reviewers for their helpful and constructive remarks, which greatly helped to improve the manuscript. Additionally, we would like to acknowledge Golder Associate Inc for providing academic licenses of FracMan v7.
Conflicts of Interest
The authors declare no conflict of interest.
References
- Tester, J.W.; Brown, D.W.; Potter, R.M. Hot Dry Rock Geothermal Energy—A New Energy Agenda for the 21st Century; Report LA-11514-MS; Los Alamos National Laboratory: Santa Fe, NM, USA, 1989.
- Willis-Richards, J. Assessment of HDR reservoir stimulation and performance using simple stochastic models. Geothermics 1995, 24, 385–402. [Google Scholar] [CrossRef]
- Zhao, Y.S.; Feng, Z.J.; Zhao, Y.; Wan, Z.J. Experimental investigation on thermal cracking, permeability under HTHP and application for geothermal mining of HDR. Energy 2017, 132, 305–314. [Google Scholar] [CrossRef]
- Pine, R.J.; Batchelor, A.S. Downward migration of shearing in jointed rock during hydraulic injections. Int. J. Rock Mech. Min. Sci. Geomech. Abstr. 1984, 21, 249–263. [Google Scholar] [CrossRef]
- LeBoutillier, N.G. The Tectonics of Variscan Magmatism and Mineralisation in Southwest England. Ph.D. Thesis, University of Exeter, Exeter, UK, 2002; p. 712. [Google Scholar]
- Kim, Y.S.; Andrews, J.R.; Sanderson, D.J. Extension fractures, secondary faults, and segment linkage in strike-slip fault systems at Rame Head, Southern Cornwall. Geosci. SW Engl. Proc. Ussher Soc.. 2001, 10, 123–133. [Google Scholar]
- Holloway, S.; Chadwick, R.A. The Sticklepath-Lustleigh fault zone: Tertiary sinistral reactivation of a Variscan dextral strike-slip fault. J. Geol. Soc. 1986, 143, 447–452. [Google Scholar] [CrossRef]
- Faulkner, D.R.; Mitchell, T.M.; Rutter, E.H.; Cembrano, J. (Eds.) On the structure and mechanical properties of large strike-slip faults, in Wibberley. In The Internal Structure of Fault Zones: Implications for Mechanical and Fluid Flow Properties; Geological Society London Special Publication: London, UK, 2008; Volume 299, pp. 139–150. [Google Scholar]
- Martel, S.J. Formation of compound strike-slip fault zones, Mount Abbot quadrangle, California. J. Struct. Geol. 1990, 12, 869–882. [Google Scholar] [CrossRef]
- Massart, B.; Paillet, M.; Henrion, V.; Sausse, J.; Dezayes, C.; Genter, A.; Bisset, A. Fracture characterization and stochastic modeling of the granitic basement in the HDR Soultz project, France. In Proceedings of the World Geothermal Congress, Bali, Indonesia, 25–29 April 2010. [Google Scholar]
- Reinecker, J.; Gutmanis, J.; Foxford, A.; Cotton, L.; Dalby, C.; Law, R. Geothermal Exploration and reservoir modelling of the United Downs deep geothermal project, Cornwall (UK). Geothermics 2021, 97, 102226. [Google Scholar] [CrossRef]
- Chen, Y.; Clark, A.; Farrar, E.; Wasteneys, H.; Hodgson, M.; Bromley, A. Diachronous and independent histories of plutonism and mineralization in the Cornubian Batholith, southwest England. J. Geol. Soc. 1993, 150, 1183–1191. [Google Scholar] [CrossRef]
- Charoy, B. The Genesis of the Cornubian Batholith (South-West England): The example of the Carnmenellis Pluton. J. Petrol. 1986, 27, 571–604. [Google Scholar] [CrossRef]
- Afhsari Moein, M.J.; Evans, K.F.; Valley, B.; Bär, K.; Genter, A. Fractal characteristics of fractures in crystalline basement rocks: Insights from depth-dependent correlation analysis to 5 km depth. Int. J. Rock Mech. Min. Sci. 2022, 155, 105138. [Google Scholar] [CrossRef]
- Trullenque, G.; Genter, A.; Leiss, B.; Wagner, B.; Bouchet, R.; Léoutre, E.; Malnar, B.; Bär, K.; Rajšl, I. Upscaling of EGS in Different Geological Conditions: A European Perspective. In Proceedings of the 43rd Workshop on Geothermal Reservoir Engineering Stanford University, Stanford, CA, USA, 12–14 February 2018. SGP-TR-213. [Google Scholar]
- MOVE Structural Geology Software MOVE Core (Computer Software). 2020. Available online: https://www.petex.com/products/move-suite/ (accessed on 5 April 2021).
- Golder Associate Inc. FracMan7 User Documentation; Golder Associate Inc.: Seattle, WA, USA, 2011. [Google Scholar]
- COMSOL. Multiphysics® v. 5.5; COMSOL AB: Stockholm, Sweden. Available online: www.comsol.com (accessed on 20 December 2020).
- Lanyon, G.W.; Kingdon, R.D.; Herbert, A.W. The application of a three-dimensional fracture network model to a hot-dry-rock reservoir. In The 33rd US Symposium on Rock Mechanics (USRMS); OnePetro: Santa Fe, NM, USA, 1992. [Google Scholar]
- Lanyon, G.W.; Batchelor, A.S.; Ledingham, P. Results from a discrete fracture network model of a Hot Dry Rock system. In Proceedings of the 18th Workshop on Geothermal Reservoir Engineering, Stanford University, Stanford, CA, USA, 26–28 January 1993. SGP-TR-145. [Google Scholar]
- Parker, R. The Rosemanowes HDR Project 1983–1991. Geothermics 1999, 28, 603–615. [Google Scholar] [CrossRef]
- Cotton, L.; Gutmanis, J.; Shail, R.; Dalby, C.; Batchelor, T.; Foxford, A.; Rollinson, G. Geological Overview of the United Downs Deep Geothermal Power Project, Cornwall, UK. In Proceedings of the World Geothermal Congress 2020+1, Reykjavik, Iceland, 24–27 October 2021. [Google Scholar]
- GeoScience Ltd. Identification of Potential Deep Geothermal Sites in the Vicinity of the Carnmenellis Granite, West Cornwall, Unpublished Report to Geothermal Engineering Limited; GeoScience Ltd.: Falmouth, UK, 2009. [Google Scholar]
- Bai, B. One-dimensional thermal consolidation characteristics of geotechnical media under non-isothermal condition. Eng. Mech. 2005, 22, 186–191. [Google Scholar]
- Mahmoodpour, S.; Singh, M.; Turan, A.; Bär, K.; Sass, I. Simulations and global sensitivity analysis of the thermo-hydraulic-mechanical processes in a fractured geothermal reservoir. Energy 2022, 247, 123511. [Google Scholar] [CrossRef]
- Mahmoodpour, S.; Singh, M.; Bär, K.; Sass, I. Impact of Well Placement in the Fractured Geothermal Reservoirs Based on Available Discrete Fractured System. Geosciences 2022, 12, 19. [Google Scholar] [CrossRef]
- Oda, M. Permeability tensor for discontinuous rock masses. Geotechnique 1985, 35, 483–495. [Google Scholar] [CrossRef]
- Schulz, K.E. Analysis of Permeability Enhancement by Chemical Treatment in Fractured Granite for the United Downs Deep Geothermal Power Project (Cornubian Batholith). Master’s Thesis, Technical University Darmstadt, Darmstadt, Germany, 2020; p. 121. [Google Scholar]
Publisher’s Note: MDPI stays neutral with regard to jurisdictional claims in published maps and institutional affiliations. |
© 2022 by the authors. Licensee MDPI, Basel, Switzerland. This article is an open access article distributed under the terms and conditions of the Creative Commons Attribution (CC BY) license (https://creativecommons.org/licenses/by/4.0/).

