Abstract
At the very end of the year 2020, on 29 December, a hazardous earthquake of Mw = 6.2 hit the area of Petrinja and its surroundings, in the NW of Croatia. The earthquake was felt across the area of 400 km, leaving an inconceivable damage in the vicinity of the epicenter, devastated towns and ruined lives. In order to map the spreading of earthquake waves and to determine the coseismic ground displacement after the mainshock, we have analyzed open satellite radar images of Sentinel-1 and the GNSS data from the nearest CORS station related to the epicenter, along with the seismic faults. In this paper, we addressed and mapped the displacement linear surface ruptures detected by the SAR interferometry. The results show the vertical ground displacement to the extent of −12 cm in the southern area and up to 22 cm in the north-western part of a wide area struck by the earthquake impact, related to the epicenter. Subsidence and uplift in a range of ±5 cm over a wider affected area indicate a spatial extent and hazardous impact made by the earthquake. The ground displacement of 30 cm to the West and 40 cm to the East has been identified considering the intersection of Pokupsko and Petrinja strike-slip fault system in the seismic zone of Pannonian basin. Accordingly, we obtained matching results of 5 cm south-easting shift and −3 cm subsidence on Sisak GNSS CROPOS station, addressing the tectonic blocks movement along the activated complex fault system. The results compared with the geology data confirm the existence of two main faults; the Pokupsko and the Petrinja strike-slip faults and interpret the occurrence of secondary post-seismic events over the observed area.
1. Introduction
In addition to damages caused by hazardous earthquake, another significant repercussion of earthquake is land displacement. Most visible deformations are found over the faults forming surface ruptures. Nevertheless, the displacements invisible to the naked eye but still occurring are the ground displacements that can be determined by surveying techniques. Since the displacements can result in shifts on the scale from millimeter to meter, they are relevant to be observed and estimated.
Optimal estimation of surrounding area displacement can be made by precise leveling, static GPS measurements and other precise geodetic field works. However, the mentioned techniques are time-consuming and always challenging in terms of funding. In the meantime, until the field works are carried out, satellite images are of a great relevance providing almost immediate first response to such occurrence.
In the last decade, Satellite Aperture Radar (SAR) has become a well established measurement technique, suitable for different applications due to its possibility to observe and record the Earth surface regardless of the weather or clouds. The satellites equipped with SAR record images of the Earth’s surface by emitting radar signal along the radar’s beam line of sight (LOS) [1]. SAR satellites are continuously circling around the globe, in the ascending and descending orbits, providing multiple spatio-temporal images that provide thousands of images over the same area in different time periods. Repetition of images over an identical area results in detection of land changes. A significant property of the SAR technology is the phase value. Throughout the phase information mapped on the interferograms, deformations due to large earthquakes can be detected and main faults revealed. Some of the studies mentioned in [2] use SAR interferometry (InSAR) to detect the displacement related to land subsidence [3], earthquakes ([4,5,6]), highway deformation [7] and similar land displacements ([8], anthropogenic deformation phenomenon [9,10]), or urban change ([11,12]). It has also been proved by a recent study [13] that InSAR measurements produce noise, but the noise can be reduced without the loss of significant data information by applying the processing techniques. Many recent studies have focused to the usage of SAR technology in the estimation of ground deformation after large earthquakes: Reference [14] estimated the land displacement but without detecting the active major faults; Reference [15] highlighted the need to consider the coherence change analysis and identify the limitations of the SAR applications; others ([16,17,18,19,20]) estimated earthquake’s impact assessment based on the data derived from SAR. Furthermore, the SAR technique is now used for the study of earthquakes and has been applied around the World ([21,22,23,24,25]) and in Europe ([26,27,28]).
Considering the mentioned recent studies and parameters to be considered in appliance of SAR images for earthquake’s impact assessment, the area of interest in this study is free of heavy vegetation, and the coherence maps were used to minimize the atmosphere effect. In this paper, we present the usage of multiple SAR satellite images acquired in the period before and after the earthquake, in order to map the ground deformation and displacement caused by the earthquake of magnitude Mw = 6.2. The output of SAR interferometry is LOS displacement that can be converted to vertical and west-east displacement, estimating the ground displacement. Therefore, we have analyzed SAR and GNSS data and compared them to geological data, confirming the existence of two main faults over the affected area and deriving the estimation of surface deformation of the surrounding area.
2. Geodynamic Framework
The Republic of Croatia is a member country of the European Union situated in the southern part of Europe, on the eastern coast of the Adriatic Sea. As for its location, the country lies in a very seismically active area due to continuous movement of the Adriatic litospheric microplate to the North [29]. Although Croatia comprises five different tectonic settings: the Pannonian Basin, the Eastern Alps, the Dinarides, the transition zone between the Dinarides and the Adriatic plate, and the Adriatic micro plate itself [30], it has been divided in 17 seismic zones for a detailed assessment of the seismic hazard [31], shown in Figure 1. Additionally, the faults across Croatia, derived from the European Database of Seismogenic Faults (EDSF), model FSBG V6.1 [32], are presented in the Figure 1. Seismicity source in Croatia is mainly twofold: On its coastal side, the country lies on the border of Micro Adriatic tectonic plate [33] and the mountainous chain of the Dinarides which collide [34,35] while on the inland country side, the active faults cross over the middle part of the country and belong to the Pannonian Basin fault zone.
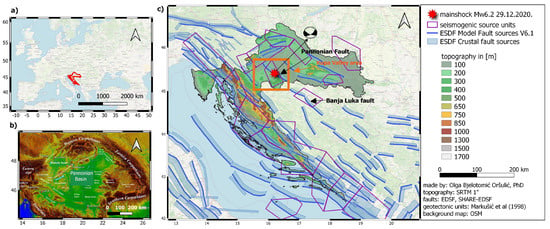
Figure 1.
Figure shows the location of the Republic of Croatia (a), Pannonian Basin structure (b), and geotectonic units and seismic faults and zones over Croatia (c). Pannonian Basin in (b), is derived from [36], while the faults are derived from EDSF project, model V6.1 [32], and seismic zones from [31]. Topography is generated from the 1 arc second SRTM [37], with Open Street Maps in the background.
Micro Adriatic tectonic plate and its movement have not been completely discovered yet. Although it was first mentioned by McKenzie in 1972 [38], the first far-reaching geodetic researches of its movement were made in the 90s. Ward [39] made the first space geodetic measurements of the Adriatic micro plate using VLBI data. Other studies (Calais et al. [40], Battaglia et al. [29], Grenerczy et al. [41], Serpelloni et al. [42] D’Agostino et al. [43], Devoti et al. [44], Marjanovic et al. [45]) analyzed the movement based on GPS measurements but with different approaches: Their divergence was about the size of the plate and the position of the pole of rotation for velocity vector. The latest studies predict convergence of the Adriatic micro plate in the Dinarids at a rate of velocity vectors of <5 mm/yr [46]. Regarding the position and the size of the Adriatic micro plate, Ollier [47] recently tried to determine it, but he found it too complex to be determined. Instead, he has defined it as a consistent block, surrounded by the Apennine–Adriatic–Dinarids block, not supporting the idea of the plate floating northwards or the idea of its collision in the zone between the Africa and Europe. Hence, the Adriatic micro plate exists, it has its own movement, the studies determine its velocity vectors, but its final size is still not known. Recent studies ([33,48,49]) agree upon the thesis that the micro Adriatic plate is responsible for a present tectonic evolution of mountainous area of the Dinarides along the Croatian coast.
In the middle continental part of the country, a fault running through the country is a southern marginal fault of the Pannonian Basin [50] which continues to run southward to Banja Luka fault in Bosnia and Herzegovina. The Pannonian Basin is often neglected since the most seismic events do occur at the coastal part of Croatia, and there is no record of strong earthquake on that area until XIX century. First recorded earthquake greater than VII MCS happened in 1861 [51]. However, the Pannonian fault area has become well known in the seismic community due to Mohorovičić research made exactly in that area after the Kupa valley earthquake in 1909. At that time, Mohorovičić proved the existence of a boundary-level Moho discontinuity, between the Earth’s crust and its mantle [52]. It was also the time when Mohorovičić proposed a procedure for unique location of earthquake focus and the analytical expression for the increase of elastic wave velocity with depth, so called Mohorovičić’s law [53]. Kupa valley earthquake was the strongest earthquake on the Pannonian basin area that occurred before the Petrinja 2020 event. Its epicenter was located 9 km North of Pokupsko with magnitude of Mw5.8, and the hypocentral depth of 14 km [54]. The estimated intensity was VIII◦ MCS. After that earthquake, over the last 100 years, the magnitude of earthquakes in this area has not been greater than 5.4 on the Richter scale (VI MCS) [31], until December 2020.
The Pannonian fault is characterized by rare occurrence of significant shocks [55]. Markušić et al. [31] attribute it to an intraplate seismicity, while Aljinović et al. [35] and Herak et al. [56] defined tectonic movements in the area of Pannonian Basin as predominantly vertical on steeply dipping faults. The common properties of previous earthquakes on this area are that the epicentral area elongates NW-SE. Herak et al. (2009) in [57] assumed, by observing historical earthquakes of 1861 and 1909, that future earthquake could generate fault corresponding either to NW-SE striking dextral or NE-SW striking sinistral fault set, and when reactivated, the fault zone would invert accommodating dextral and reverse motions due to recently NE–SW directed compression in this region.
Seismicity of Croatia
Regarding the geodynamic framework, the coastal part of Croatia is the most seismically active one. In historical records, the Dubrovnik area was the most seismically active area, with even 8 seismic events greater than IX MCS [53], out of which the strongest earthquake occurred in 1667, with intensity X MCS. Nevertheless, there have been other significant earthquakes along the Adriatic coast in the 15th, 16th, and 18th centuries. During the last decades, also significant seismicity in the Central Adriatic has been noticed due to the increase in quality and number of regional seismological stations [53]. Considering the most populated area, namely the capital city Zagreb and its metropolitan area, large number of strong earthquakes occurred there in the 17th century [53], of which the largest one had an intensity of Mw6.3, occurring in 1880 in Zagreb.
Considering the seismicity in Croatia from 1900, all significant earthquakes with Mw > 5 (Biokovo earthquake in 1962 with Mw6.1, Ston-Slano earthquake in 1996 with Mw6.0, and the earthquake sequence on Jabuka island in south Adriatic in 2003 with Mw5.5 [53]) occurred in the south Adriatic, except the Kupa Valley earthquake, occurred in Pannonian basin in 1909.
Figure 2 displays the earthquakes that happened in the last 16 years, in the period between 2004–2021, over Croatian territory. The time span has been set to the last 16 years due to available seismic data distributed publicly by the European-Mediterranean Seismological Centre (EMSC) [58]. Left subfigure shows the earthquakes that happened in period between 2004 and December 2020, while the subfigure on the right side shows the earthquakes that happened in the period between 15 December 2020 and 1 February 2021. The main aftershocks are occurring along the NW-SE direction, following the Pannonian fault location (see Figure 2, subfigure on the right, orange dots).
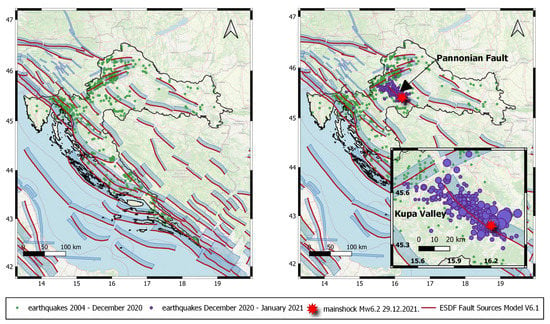
Figure 2.
Figure displays seismic activity on the Croatian territory in the period between 1 January 2004 and 15 December 2020. (left) and in the period between 15 December 2020 and 7 January 2021 (right). Earthquake data was obtained from EMSC [58].
In the last 16 years until December 2020, more than a thousand seismic events happened on the Croatian territory, out of which about 25% were of magnitude . Furthermore, in that period, there have been 19 (data by EMCS) occurrences of earthquakes and only one . This earthquake was also a hazardous earthquake with the epicenter near the Croatian capital city, also dating from 2020 (March), which caused human loss and enormous material damage [59].
3. Study Area
The Pannonian fault is situated between 45° and 45.6° N (see in Figure 2) and 16° and 17° E, as shown in Figure 2 and its dangerous seismic potential is often ignored since most of the seismicity is () is distributed along the Croatian coast (Figure 2), and the Pannnian basin is considered as a low seismic risk zone by recent seismic risk maps of Croatia ([60,61]).
However, on 29 December 2020, Croatia was hit by one of the most hazardous earthquakes in its seismic history, on the Richter scale. According to [62], the earthquake’s intensity can be described by primary and secondary effects via the Environmental Seismic Intensity scale (ESI) 2007. Considering the ESI scale [62], Petrinja earthquake belongs to the IX—destructive type of earthquake, since the ground ruptures developed up to a few km long with offset of about several cm as a primary effect, and as secondary effect, significant cracks in paved road-shave, liquefaction, cracks and fissuring occurred in a diameter of 10 km related to the epicenter.
The tremor occurred at a depth of 6 km [54]. A day before the mainshock, there were two major events of (28 December 2020 at 05:28) and (28 December 2020 at 06:49) that were considered as a mainshock until the 29th. The analysis of the possible preceding events related to the mainshock on the 29th and the main foreshock on the 28th showed that during the one year period prior to the mainshock, there had been only one event exceeding the magnitude of two Richter scale (), in August 2020. Two events greater than magnitude two Richter ( and ) occurred on the day of the mainshock, but regarding the earthquakes of the magnitude around 5 the day earlier, these two events were classified as a normal events following the major shocks while it was still believed that the mainshock was the one of the magnitude .
In the following month after the mainshock until the 1 February, numerous aftershocks occurred in the affected area, more than a thousand of them altogether still occurring at a rate of few of them per day. Most of the earthquakes which occurred after the mainshock had a magnitude bellow , 9 of them exceeded the magnitude , and one out of those nine was stronger than on the Richter scale, on 6 January 2021. The scattered occurrence of aftershocks’ magnitudes can be seen in Figure 3, where it is also visible that the trend of afterquakes’ weakened frequency and magnitude as time passed.
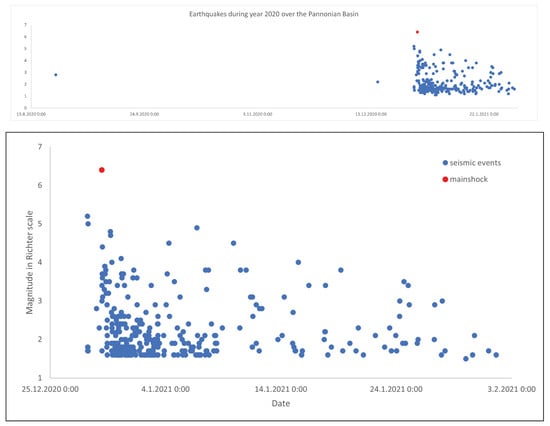
Figure 3.
The graph shows earthquakes with magnitudes over Mw1.5, in the period between 28 December 2020 and 1 February 2021. The data is acquired from EMSC [58]. Silent seismic activity over the year prior to the main foreshock is shown on the upper inset.
4. Data and Methodology
On 29 December 2020, a strong earthquake Mw6.2 hit near Strašnik village in the NW Croatia [63]. The tremor occurred at a depth of around six kilometers, with intensity at the epicenter of VIII EMS scale, occurring on the intersection of longitudinal NW–SE right-lateral and transverse NE–SW left-lateral faults along the transitional contact zone of the Dinarides and the Pannonian Basin [54]. All significant institutions for earthquake detection registered and processed the data of the earthquake. In a recent paper [54], Figure 4 shows the focal parameters of the earthquake determined by the INGV [64] and the USGS that describe it as a result of shallow strike-slip faulting within the Eurasia Plate [65]. In order to map the event of this earthquake and its effects on the ground displacement in the area affected by the earthquake, we analyzed the multiple spatio-temporal Sentinel-1 satellite C-SAR (C-band synthetic aperture radar) images and the continuous s GNSS data of the nearest reference station.
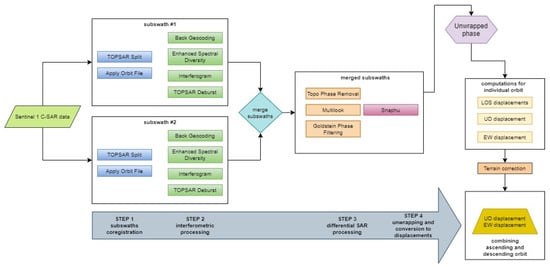
Figure 4.
Sentinel-1 SAR processing workflow.
4.1. SAR Data
Sentinel-1 is the first mission of a Copernicus initiative, the European initiative for online dissemination of global satellite data free of charge. Copernicus is the European Union’s Earth observation program fully operated since 2014 [66]. It is a joint program coordinated in partnership between the European Commission, European Space Agency (ESA), the EU Member States, and EU agencies providing an open information service with satellite and non-satellite Earth observation data. Sentinel-1 has two polar-orbiting satellites: Sentinel-1A and Sentinel-2B launched in 2014 and 2016, respectively. The Sentinel mission has four modes of distribution of its data. We chose the Interferometric Wide Swath (IWS) mode. Overall coverage of one Sentinel image in IWS mode is 250 km swath, 5 × 20 spatial resolution [67]. Each Sentinel-1 IWS image is referred to as swath and is divided into three horizontal areas called sub-swaths. A sub-swath consists of nine vertical areas called bursts. Each satellite has 12 days revisit time cycle with 175 orbits/cycle. They are circulating around the globe with the path on which they travel from the South to the North belonging to the ascending orbit, while the descending orbit is directed vice versa. Therefore, the Sentinel images can be acquired in an ascending or descending orbit. The Sentinel-1 data products are distributed in three levels shown in Table 1. Since the energy of this earthquake caused effects on the building stock, such as the collapse of houses and the destruction of towns and villages, and on the natural environment, such as the activation of landslides, it was necessary to evaluate, quickly, the ground displacements of the land, in order to get a ground displacements assessment. For that purpose, we used a Level-1 images of Sentinel-1, Single Look Complex (SLC), partially processed data with preserved phase (see Table 1). Furthermore, since the most advantageous feature of SAR technology is that it enables acquiring images regardless of the clouds or any weather condition, we used interferometric wide (IW) sub-swaths.

Table 1.
Properties of used Sentinel-1 SAR images.
Even though SAR satellites record the distance along the radar path, it is not possible to say whether the Earth’s surface has moved vertically or horizontally only by using one of the satellite orbits (ascending or descending). The displacement that is identified by SARs corresponds to the spatial displacement vector in the direction of the radar signal. To estimate ground movement, it is necessary to combine both orbits.
Therefore, we chose both Sentinel-1A and Sentinel-1B images. Sentinel-1A images were in ascending orbit, in relative orbit number T146, while Sentinel-1B images were in descending orbit, number T124. The two satellites are complementary, each has revisiting time of twelve days mutually spaced apart by six days, which makes it possible to get the images of the area of interest in a time span of six days. For the first stack of before, we have selected Sentinel-1A on 18 December 2020 and Sentinel-1B on 23 December 2020, and for after earthquake state-of-the-art, we used Sentinel-1A on 30 December 2020. and Sentinel-1B on 4 Januray 2021 respectively (see Table 2). These images were the only ones available for the area of interest at the moment of research, which was in the first week after the earthquake. The images were selected and downloaded via Copernicus Sci Hub data site [68]. Later on, during January 2021, we downloaded two more pairs of corresponding images (Table 2) in order to analyze land displacement after the series of earthquakes.

Table 2.
Displacement values related to each Sentinel orbit separately, in [cm].
We conducted a well established procedure for interferometry processing [69] in a Sentinel Application Platform (SNAP), European Space Agency’s (ESA) open toolbox for Sentinel analysis [70]. Our sequence of processing is given in a Figure 4. We created interferograms of unwrapped phase for each subswath in case of Sentinel-1A, merged them after debursting, and continued with a single product in differential SAR processing and unwrapping the phase. We did the unwrapping with the SNAP’s plugin snaphu outside of SNAP toolbox, but later on, we computed the displacements separately using well known equations for displacement computation from the unwrapped phase (more details in [12,15]). After the determination of the Line of Sight (LOS) displacement, we corrected the values for the topographic correction and finally computed the estimation of vertical ground displacement after the earthquake. The vertical ground displacement was computed by LOS displacement and incident angle θ using the expression ([71,72]):
As for the elevation data for the removal of topographic phase, we used 1 arc second Shuttle Radar Topography Mission (SRTM) [37] digital elevation model (more details on: https://lpdaac.usgs.gov/products/srtmgl1v003/, accessed on 10 Januray 2021).
4.2. GNSS CORS Data
To independently assess the results obtained by SAR analysis, we processed the GNSS data obtained at the national GNSS CORS reference station SISA, located on the observed area, in Sisak. SISA station is one of 30 continuously operating reference stations (CORS), belonging to Croatian GNSS network of continuous observing reference stations. CROPOS was established in 2008, with three running services. It provides the accuracy of 2 cm positional and 4 cm in vertical sense for a real-time (RTK) GNSS measurements and sub-centimeter accuracy for post-processing [73]. High level of accuracy was achieved on the grounds that it had continuous millimeter stability. Such stability is needed in order to have centimeter real-time positioning and in order to act as a national reference frame for displacement and other geophysical studies.
We downloaded and used daily 30 s interval GNSS measurements from SISA reference station for 10 days before and 10 days after the earthquake. The GNSS measurements were downloaded in RINEX (eng. Receiver Independent Exchange) v. 3.03. format from the GPPS service for the purpose of post-processing. Due to the substantial amount of data, the authors found it appropriate to use the 30-minute interval, and therefore, originally sampled data of 1 s were resampled to 30 s. A period of ten days before and ten days after the earthquake was observed. Median value of ten days prior to the earthquake for each of three coordinates was set as a reference coordinate value for further analysis. Regarding the reference value, the shift in northing, easting, and height direction was computed, given in detail in the next section.
5. Results
The interferogrammetric phase represents the difference in a recorded signal’s distance acquired by two SAR’s. It is expressed by wavelength, and it can be mapped on interferogram. Each visible fringe on the interferogram corresponds to the wavelength unit depending on a band used by the radar. In case of C-SAR images used in this study, the wavelength for C-band is 5.6 cm. Figure 5 shows four interferograms: On the upper left, there is the interferogram for the Sentinel-1A ascending orbit, and on the upper right, there is for Sentinel-1B descending orbit acquired in the period of one week before and one after the earthquake, while on the lower left and right insets the interferograms in the period of weeks after the earthquake have been shown determined from the Sentinel-1A ascending orbit and the Sentinel-1B descending orbit, respectively. Both (a) and (b) interferograms shown in Figure 5 show a good correlation with the signal dominated by deformations, not by atmosphere, orbit, or digital elevation model errors. In that way, the interferogram clearly indicates the existence of the deformation. The slight mutual differences are visible, but it is expected due to different incident angles ranging from 36.24 to 45.78 and 35.03 to 41.73 degrees for Sentinel-1A and Sentinel-1B, respectively. From the after-earthquake state-of-the-art interferograms, shown in (c) and (d) insets of Figure 5, the deformation is still visible but on the smaller scale, implicating that the ground displacements are still occurring as the ground continuously trembles a month after the earthquake.
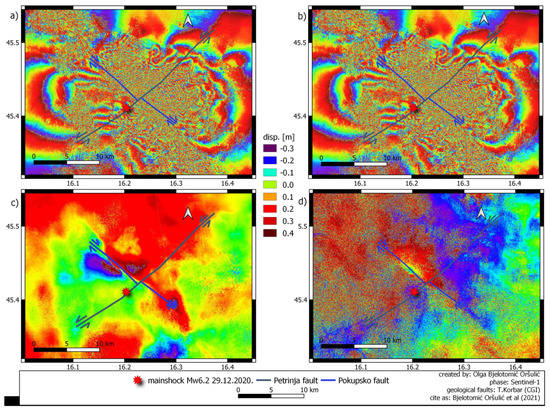
Figure 5.
Figure shows interferograms over the earthquake area in NW Croatia: from the ascending orbit of Sentinel-1A (left) and descending orbit of Sentinel-1B satellite (right).
By unwrapping the interferometric phase, we obtained the displacement in line of sight (LOS) of the SAR radar. Although it is expected for the inverse orbits when analyzed separately to yield different results with mutually inverse sign, it is still interesting to see (Figure 6) the significant differences obtained: Amplitude of LOS displacements obtained by the Sentinel-1A has the range of 74 cm unlike the one obtained by the Sentinel-1B with the range of 53 cm. LOS displacement is not a value that expresses the exact ground movement of the Earth’s surface, but it reveals the existence of land motion. By combining the inverse orbits and having in mind that the SAR is more sensitive to vertical motion than to horizontal, vertical movement can be roughly isolated and determined.
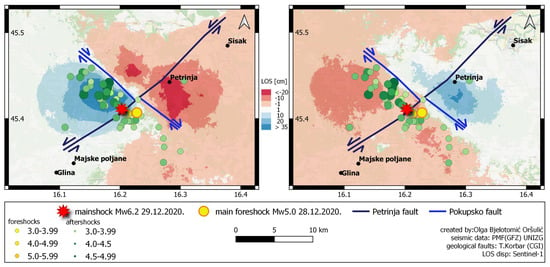
Figure 6.
Figure shows LOS displacement over earthquake area in NW Croatia: ascending orbit of Sentinel-1A (left) and descending orbit of Sentinel-1B satellite (right) [54].
On 9 January 2021, while we were working on this research, the Croatian Geological Institute (CGI) released their new findings [74] about the earthquake, mapping the direction of two faults that are intersecting near the epicenter of this earthquake. The NW-SE fault defined by Croatian Geological Institute is in accordance with the ESDF global Faul Model V6.1, but somewhat eastwards. It is obvious that both sources (ESDF V6.1 and CGI’s faults) have the same fault mapped, but we assume that the global model is a rough estimate, and CGI is a more precise one due to thorough regional measurements made by CGI. Hence, we included the newly mapped faults of Pokupsko fault (stretching NW-SE) and Petrinja fault (stretching SW-NE) determined by Tvrtko Korbar from CGI [54,74]. The two faults are dividing the area distressed by the earthquake in four quadrants. The faults can be clearly recognized from the LOS displacements in the period of the week before and after the mainshock, registered by the SAR satellite, seen in Figure 6.
Based on Equation (1), we made an estimation of the Earth’s surface ground displacement, in vertical up-down and horizontal east-west direction. The computation was made using LOS displacement incident angle values [14] at every pixel prior to conducting the terrain correction. During the DinSAR processing, pixel size was set to 27 m. Incident angle was obtained from the corresponding SAR images, ranging from 36.24 to 45.78 and 35.03 to 41.73 degrees for Sentinel-1A and Sentinel-1B, respectively. The values of computed ground displacement differ from LOS displacement values by 30% and 50% for vertical and horizontal displacements, respectively, as seen in Table 2. This relation between the LOS and ground displacements corresponds to similar studies [71], where authors have used fixed value for the incident angle and therefore got the enlargement of 20% in favor of vertical displacement regarding the LOS displacement. However, for the purpose of this study conducted on a relatively small area, it was found necessary to use origin pixel values of incident angle to estimate behavior of ground deformation as much as possible with SAR data.
During the January 2021, we acquired subsequent time-series of SAR images (see Table 1) and analyzed the behavior of the ground movement in the weeks following the mainshock. We corrected the displacement for the coherence factor of <0.4, eliminating the noise signal and giving the true insight in the most significantly affected areas. We have analyzed four pairs of subsequent images from both orbits, but the ground movement is visible only on the first pair taken shortly prior and after the earthquake. Despite the fact that more than a thousand aftershocks happened during January (see Figure 3), the images acquired in the month following the mainshock show neglectable ground displacement of only few millimeters, while the first pair of images clearly identifies Petrinja town as the most displaced one, shifted up to 40 cm to the east (see Figure 7), situated on the eastern part of the Pokupsko fault. On the western side of Pokupsko fault and on the side of the epicenter, the displacement toward the West is visible with the greatest shift of 60 cm luckily mainly in the uninhabited area, reaching Glina city at its borders. Majske poljane is the village that has been razed to the ground. The Figure 8 gives an insight: Majske poljane is located over the Petrinja fault where there was also the epicenter is located. This is the area mostly affected by the western displacement of Pokupsko surface rupture. The twofold impact made an immense damage both in Majske Poljane and Petrinja.
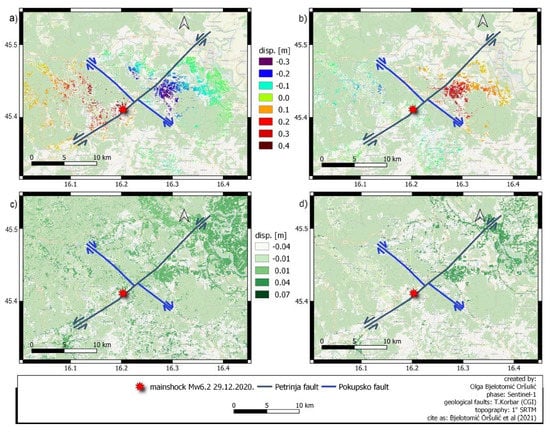
Figure 7.
Figure shows LOS displacement in the period between (a) 18 December 2020 and 30 December 2020 from a Sentinel-1A ascending orbit T146, (b) 24 December 2020 and 4 January 2021 from a Sentinel-1B descending orbit T124, (c) 30 December 2020 and 23 January 2021 from a Sentinel-1A T146, and (d) 04 January 2021 and 28 January 2021 from a Sentinel-1B T124 orbit.
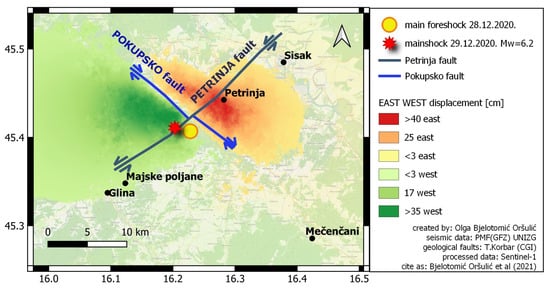
Figure 8.
Figure shows east–west ground displacement over affected area.
Dominant impact of the earthquake on horizontal movement is visible from the computed east–west ground displacement shown in Figure 8. Moreover, the enlargement of the horizontal displacement related to LOS displacement implies such a conclusion. Taking into account that SAR images show the movement relative to satellite position and are not referenced to fixed ground point, ground displacements obtained from the SAR can be used for the interpretation and indication, not as an absolute determination of the displacement. The horizontal ground displacement happened related to Pokupsko fault, shifting the area of Petrinja to the east by up to 40 cm, and the area towards Glina by around 30 cm to the West. The extreme values of horizontal displacement are bounding the longitudinal Pokupsko strike-slip fault with the epicenter at transversal Petrinja strike-slip fault. The horizontal west–east ground displacement seen in Figure 8 identifies the intersection of the Pokupsko and Petrinja strike-slip faults as the maximum horizontal shift occurred at the left and right quadrant related to it. The wider affected area shown in Figure 8 is horizontally displaced within 5 cm, seen on Figure 8, which coincides with GNSS analysis discussed at the end of this section.
The vertical displacements range between −12 cm and 22 cm stretching over the earthquake stricken area (see Figure 9). The spatial split between the land subsidence and the land uplift follows the directions of Pokupsko and Petrinja strike-slip faults mapped by Croatian Geological Institute [74]. Vertical displacement is mostly expressed in the western quadrant; on the other hand, the displacement across the faults themselves is minimal. However, we find the increased values of displacement on the western and southern quadrant relatively expected due to topography indented in that area. On other hand, in the northern and eastern quadrant, the displacement is lower than the topography regarding the faults of Pokupsko and Petrinja, but there is still a displacement range of ±5 cm suggesting a real ground movement related to the earthquake and independent of topography also in a wider affected area. The results of the horizontal west–east displacement coincide with the recently published GNSS field measurements [75]. Comparing the results from [75] with the results of the SAR analysis, the ground displacements around the epicenter are the resultant vector of two identified strike-slip faults: Pokupsko and Petrinja, as seen in Figure 9.
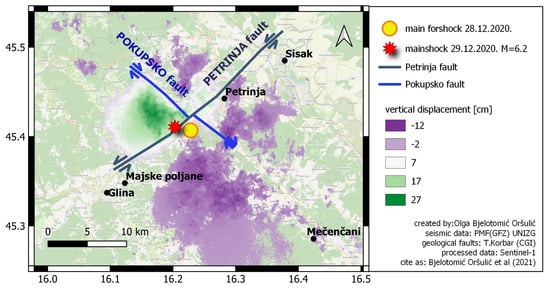
Figure 9.
Figure shows vertical displacement over affected area.
The results of analyzed GNSS data show that there has been a significant shift of SISA station of 5 cm towards the East and 2 cm to the South (see Figure 10). The eastern shift coincides with the results we obtained from the SAR analysis, while the north–south direction is not straightforward in SAR processing since SAR technique is more sensitive to horizontal east–west shift neglecting the north–south shift since the orbit path stretches along the north–south direction. As for the height, the SISA station shows subsidence up to 3 cm, as seen in Figure 11, which is the complementary result obtained by the SAR analysis: The identical displacement is obtained at the location of SISA station when vertical displacement is derived from SAR analysis, shown in Figure 9. Considering the geological field data acquired after the earthquake, a hundred sinkholes [76] opened as one of the extreme post-seismic near-surface effects [54] in a small place Mečenčani, located on a south-east line of Pokupsko strike-slip faults, as shown in Figure 9. Comparing the vertical displacements results obtained by SAR analysis and the geological occurrence of sinkholes, it is visible from Figure 9 that the impact on the vertical dimension was the strongest on the west side of Pokupsko strike-slip fault, reaching −6 cm subsidence over the Mečenčani area, probably activating the occurrence of sinkholes.
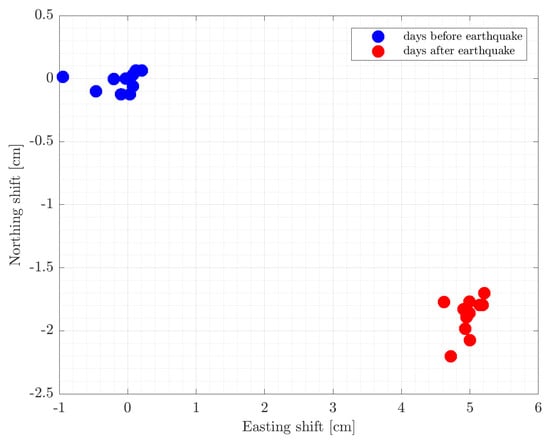
Figure 10.
The graph shows two-dimensional displacement of a CROPOS’s SISA station due to the earthquake, with ten blue dots representing SISA’s location ten days before the earthquake and ten red dots the position during ten days after the earthquake.
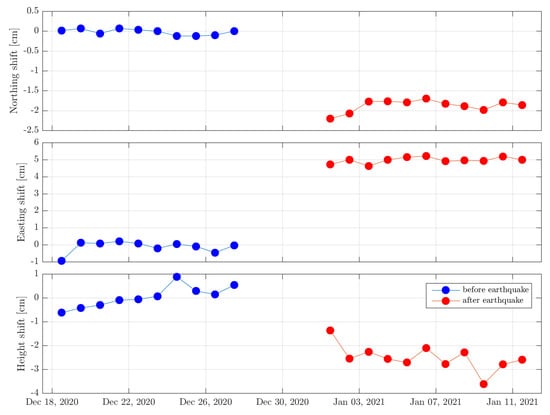
Figure 11.
The graph shows positional (Northing and Easting) and vertical (Height) displacement of a GNSS CORS CROPOS station SISA located 30 km from the epicenter. Blue color represents the state before the earthquake and red color after the earthquake.
6. Conclusions
The work presented in this paper was focused on the hazardous earthquake of Mw = 6.2 that happened in NW Croatia on 29 December 2020. The research was conducted on a real time basis as the Sentinel images were getting available.
By combining the ascending and descending orbits, we estimated the ground displacement over the affected area. The left-lateral and right-lateral surface shifts are visible from the ground displacement maps derived from SAR Sentinel-1 data. Horizontal ground displacement is around 30 cm to the West and 40 cm to the East, shifting to the East and to the West related to Pokupsko strike-slip fault, while vertical displacement has overall range amplitude of 35 cm, most pronounced along Hrastovička gora, the mountainous area on the western side of Pokupsko fault also stretching in the NW-SE direction. Although the majority of foreshocks and aftershocks occurred along the Pokupsko fault, the impact of this complex tectonic setting is visible from the obtained vertical and west–east ground displacements, which are not one-way oriented, but on the contrary, they are dispersed unevenly around the intersection of Pokupsko and Petrinja strike-slip faults. We found the highlighted subsidence of −12 cm in the southern area and an uplift of 22 cm in the north-west area as highly correlated and partially influenced by topography which is indented over that area. However, the whole area distressed by the earthquake is facing vertical displacement in the range of ±5 cm, which we found causes a significant impact on activating the sinkholes at the south–east line of Pokupsko strike-slip fault.
The GNSS analysis has yielded the results compliant to the SAR analysis, clearly showing vertical subsidence of 3 cm in the area of Sisak and horizontal displacement of 5 cm to the south–east. Maximum east–west horizontal displacement of GNSS CORS CROPOS station follows the direction of a resultant vector of Pokupsko and Petrinja fault movement, NW-SE Pokupsko fault striking dextral and NE-SW Petrinja fault striking sinistral, confirming the complex tectonic setting at the intersection of these two strike-slip faults.
Based on the conducted multi temporal SAR analysis, this research confirmed the existence of two surface ruptures, Pokupsko and Petrinja strike-slip fault, seen by separating line, being the boundary line of the area where the ground displacements towards east and west occur. The results are compliant with the recent study of [54], identifying the dextral coseismic strike-slip displacement along the Pokupsko fault and the sinistral strike-slip displacement along the Petrinja fault. However, this research is important since the estimated ground displacements identify and explain some of the secondary post-seismic events that occurred over the affected area. Regarding the range of the estimated ground deformations, the future analysis should address the stability of national reference system and the detail accuracy research of real-time GNSS measurements over the affected area.
Author Contributions
Conceptualization, O.B.O.; methodology, O.B.O.; computation, O.B.O., M.V.; validation, O.B.O., D.M., T.B., M.V.; formal analysis, O.B.O., D.M., M.V., T.B.; data curation, O.B.O., T.B.; writing—original draft preparation, O.B.O.; writing—review and editing, O.B.O., D.M., M.V., T.B.; visualization, O.B.O. All authors have read and agreed to the published version of the manuscript.
Funding
The APC was funded by the scientific project of University North with Danko Markovinović as a project lead.
Institutional Review Board Statement
Not applicable.
Informed Consent Statement
Not applicable.
Data Availability Statement
The data supporting reported results can be found on Copernicus Open Access Datahub: https://scihub.copernicus.eu/, accessed on 15 February 2021.
Acknowledgments
We acknowledge European Copernicus initiative and European-Mediterranean Seismological Centre for their open data policy and Tvrtko Korbar from Croatian Geological Institute for geological data. Nevertheless, we acknowledge fruitful comments of three independent reviewers that helped us to improve this paper.
Conflicts of Interest
The authors declare no conflict of interest.
References
- Dai, K.; Liu, G.; Li, Z.; Li, T.; Yu, B.; Wang, X.; Singleton, A. Extracting Vertical Displacement Rates in Shanghai (China) with Multi-Platform SAR Images. Remote Sens. 2015, 7, 9542–9562. [Google Scholar] [CrossRef]
- Bovenga, F. Special Issue “Synthetic Aperture Radar (SAR) Techniques and Applications”. Sensors 2020, 20, 1851. [Google Scholar] [CrossRef] [PubMed]
- Zhang, Y.; Liu, Y.; Jin, M.; Jing, Y.; Liu, Y.; Liu, Y.; Sun, W.; Wei, J.; Chen, Y. Monitoring Land Subsidence in Wuhan City (China) using the SBAS-InSAR Method with Radarsat-2 Imagery Data. Sensors 2019, 19, 743. [Google Scholar] [CrossRef]
- Mora, O.; Ordoqui, P.; Iglesias, R.; Blanco, P. Earthquake Rapid Mapping Using Ascending and Descending Sentinel-1 TOPSAR Interferograms. Procedia Comput. Sci. 2016, 100, 1135–1140. [Google Scholar] [CrossRef]
- Goorabi, A. Detection of landslide induced by large earthquake using InSAR coherence techniques—Northwest Zagros, Iran. Egypt. J. Remote Sens. Space Sci. 2020, 23, 195–205. [Google Scholar] [CrossRef]
- Jo, M.J.; Jung, H.S.; Yun, S.H. Retrieving Precise Three-Dimensional Deformation on the 2014 M6.0 South Napa Earthquake by Joint Inversion of Multi-Sensor SAR. Sci. Rep. 2017, 7, 5485. [Google Scholar] [CrossRef]
- Xing, X.; Chen, L.; Yuan, Z.; Shi, Z. An Improved Time-Series Model Considering Rheological Parameters for Surface Deformation Monitoring of Soft Clay Subgrade. Sensors 2019, 19, 3073. [Google Scholar] [CrossRef]
- Raspini, F.; Bianchini, S.; Ciampalini, A.; Del Soldato, M.; Solari, L.; Novali, F.; Del Conte, S.; Rucci, A.; Ferretti, A.; Casagli, N. Continuous, semi-automatic monitoring of ground deformation using Sentinel-1 satellites. Sci. Rep. 2018, 8, 7253. [Google Scholar] [CrossRef]
- Fuhrmann, T.; Garthwaite, M.C. Resolving Three-Dimensional Surface Motion with InSAR: Constraints from Multi-Geometry Data Fusion. Remote Sens. 2019, 11, 241. [Google Scholar] [CrossRef]
- Aslan, G.; Cakir, Z.; Lasserre, C.; Renard, F. Investigating Subsidence in the Bursa Plain, Turkey, Using Ascending and Descending Sentinel-1 Satellite Data. Remote Sens. 2019, 11, 85. [Google Scholar] [CrossRef]
- Malmgren-Hansen, D.; Sohnesen, T.; Fisker, P.; Baez, J. Sentinel-1 Change Detection Analysis for Cyclone Damage Assessment in Urban Environments. Remote Sens. 2020, 12, 2409. [Google Scholar] [CrossRef]
- Delgado Blasco, J.M.; Foumelis, M.; Stewart, C.; Hooper, A. Measuring Urban Subsidence in the Rome Metropolitan Area (Italy) with Sentinel-1 SNAP-StaMPS Persistent Scatterer Interferometry. Remote Sens. 2019, 11, 129. [Google Scholar] [CrossRef]
- Kovács, I.P.; Bugya, T.; Czigány, S.; Defilippi, M.; Lóczy, D.; Riccardi, P.; Ronczyk, L.; Pasquali, P. How to avoid false interpretations of Sentinel-1A TOPSAR interferometric data in landslide mapping? A case study: Recent landslides in Transdanubia, Hungary. Nat. Hazards 2019, 96, 693–712. [Google Scholar] [CrossRef]
- Thomas, A. Mapping of surface deformation associated with the 5.2 magnitude Stilfontein earthquake of 3 April 2017 using radar interferometry. Egypt. J. Remote Sens. Space Sci. 2020, 24, 85–108. [Google Scholar] [CrossRef]
- Tzouvaras, M.; Danezis, C.; Hadjimitsis, D.G. Differential SAR Interferometry Using Sentinel-1 Imagery-Limitations in Monitoring Fast Moving Landslides: The Case Study of Cyprus. Geosciences 2020, 10, 236. [Google Scholar] [CrossRef]
- Monti-Guarnieri, A.V.; Brovelli, M.A.; Manzoni, M.; Mariotti d’Alessandro, M.; Molinari, M.E.; Oxoli, D. Coherent Change Detection for Multipass SAR. IEEE Trans. Geosci. Remote Sens. 2018, 56, 6811–6822. [Google Scholar] [CrossRef]
- Burrows, K.; Walters, R.J.; Milledge, D.; Spaans, K.; Densmore, A.L. A New Method for Large-Scale Landslide Classification from Satellite Radar. Remote Sens. 2019, 11, 237. [Google Scholar] [CrossRef]
- Uemoto, J.; Moriyama, T.; Nadai, A.; Kojima, S.; Umehara, T. Landslide Detection Based on Height and Amplitude Differences Using Pre- and Post-Event Airborne X-Band SAR Data. Nat. Hazards 2019, 95, 485–503. [Google Scholar] [CrossRef]
- Jung, J.; Yun, S.-H. Evaluation of Coherent and Incoherent Landslide Detection Methods Based on Synthetic Aperture Radar for Rapid Response: A Case Study for the 2018 Hokkaido Landslides. Remote Sens. 2020, 12, 265. [Google Scholar] [CrossRef]
- Park, S.-E.; Jung, Y.T. Detection of Earthquake-Induced Building Damages Using Polarimetric SAR Data. Remote Sens. 2020, 12, 137. [Google Scholar] [CrossRef]
- Jiang, G.; Wen, Y.; Li, K.; Fang, L.; Xu, C.; Zhang, Y.; Xu, X. A NE-trending oblique-slip fault responsible for the 2016 Zaduo earthquake (Qinghai, China) revealed by InSAR data. Pure Appl. Geophys. 2018, 175, 4275–4288. [Google Scholar] [CrossRef]
- Jiang, G.; Xu, C.; Wen, Y.; Liu, Y.; Yin, Z.; Wang, J. Inversion for coseismic slip distribution of the 2010 Mw 6.9 Yushu Earthquake from InSAR data using angular dislocations. Geophys. J. Int. 2013, 194, 1011–1022. [Google Scholar] [CrossRef]
- Wen, Y.; Li, Z.; Xu, C.; Ryder, I.; Bürgmann, R. Postseismic motion after the 2001 Mw 7.8 Kokoxili earthquake in Tibet observed by InSAR time series. J. Geophys. Res. Solid Earth 2012, 117. [Google Scholar] [CrossRef]
- Wang, S.; Xu, C.; Wen, Y.; Yin, Z.; Jiang, G.; Fang, L. Slip model for the 25 November 2016 Mw 6.6 Aketao earthquake, western China, revealed by sentinel-1 and ALOS-2 observations. Remote Sens. 2017, 9, 325. [Google Scholar] [CrossRef]
- Golshadi, Z.; Rezapour, M.; Atzori, S.; Salvi, S. Multiple source analysis from InSAR data and new insights into fault activation The 2005 Zarand, Iran, earthquake. Terra Nova. 2020. [Google Scholar] [CrossRef]
- Béjar-Pizarro, M.; Álvarez Gómez, J.A.; Staller, A.; Luna, M.P.; Pérez-López, R.; Monserrat, O.; Chunga, K.; Lima, A.; Galve, J.P.; Martínez Díaz, J.J.; et al. InSAR-Based Mapping to Support Decision-Making after an Earthquake. Remote Sens. 2018, 10, 899. [Google Scholar] [CrossRef]
- Ganas, A.; Elias, P.; Briole, P.; Cannavo, F.; Valkaniotis, S.; Tsironi, V.; Partheniou, E.I. Ground Deformation and Seismic Fault Model of the M6.4 Durres (Albania) Nov. 26, 2019 Earthquake, Based on GNSS/INSAR Observations. Geosciences 2020, 10, 210. [Google Scholar] [CrossRef]
- Valkaniotis, S.; Briole, P.; Ganas, A.; Elias, P.; Kapetanidis, V.; Tsironi, V.; Fokaefs, A.; Partheniou, H.; Paschos, P. The Mw = 5.6 Kanallaki Earthquake of 21 March 2020 in West Epirus, Greece: Reverse Fault Model from InSAR Data and Seismotectonic Implications for Apulia-Eurasia Collision. Geosciences 2020, 10, 454. [Google Scholar] [CrossRef]
- Battaglia, M.; Murray, M.H.; Serpelloni, E.; Bürgmann, R. The Adriatic region: An independent microplate within the Africa-Eurasia collision zone. Geophys. Res. Lett. 2004, 31. [Google Scholar] [CrossRef]
- Hadzima-Nyarko, M.; Kalman Šipoš, T. Insights from existing earthquake loss assessment research in Croatia. Earthq. Struct. 2017, 13, 365–375. [Google Scholar]
- Markušić, S.; Herak, M. Seismic zoning of Croatia. Nat. Haz. 1999, 18, 269–285. [Google Scholar] [CrossRef]
- Basili, R.; Kastelic, V.; Demircioglu, M.B.; Garcia Moreno, D.; Nemser, E.S.; Petricca, P.; Sboras, S.P.; Besana-Ostman, G.M.; Cabral, J.; Camelbeeck, T.; et al. The European Database of Seismogenic Faults (EDSF) Compiled in the Framework of the Project SHARE. 2013. Available online: http://diss.rm.ingv.it/share-edsf/ (accessed on 3 January 2021).
- Ustaszewski, K.; Le Breton, E.; Balling, P.; Handy, M.R.; Molli, G.; Tomljenović, B. One microplate-three orogens: Alps, Dinarides, Apennines and the role of the Adriatic plate. In Proceedings of the EGU General Assembly Conference Abstracts, EGU, Vienna, Austria, 23–28 April 2017. Abstract Number 16444. [Google Scholar]
- Prelogović, E.; Cvijanović, D.; Aljinović, B.; Kranjec, V.; Skoko, D.; Blašković, I.; Zagorac, Ž. Seismotectonic activity along the coastal area of Yugoslavia. Geološki Vjesn. 1982, 35, 195–207. [Google Scholar]
- Aljinović, B.; Blašković, I.; Cvijanović, D.; Prelogović, E.; Skoko, D.; Brdarević, N. Correlation of geophysical, geological and seismological data in the coastal part of Yugoslavia. Boll. Oceanol. Teor. Appl. 1984, 2, 77–90. [Google Scholar]
- Horváth, F.; Musitz, B.; Balázs, A.; Végh, A.; Uhrin, A.; Nádor, A.; Koroknai, B.; Pap, N.; Tóth, T.; Wórum, G. Evolution of the Pannonian basin and its geothermal resources. Geothermics 2015, 53, 328–352. [Google Scholar] [CrossRef]
- Farr, T.; Rosen, P.A.; Caro, E.; Crippen, R.; Duren, R.; Hensley, S.; Kobrick, M.; Paller, M.; Rodriguez, E.; Roth, L.; et al. The Shuttle Radar Topography Mission. Rev. Geophys. 2007, 45. [Google Scholar] [CrossRef]
- McKenzie, D.P. Active tectonics of the Mediterranean region. Geophys. J. Int. 1972, 30, 109–185. [Google Scholar] [CrossRef]
- Ward, S. Constraints on the seismotectonics of the central Mediterranean from Very Long Baseline Interferometry. Geophys. J. Int. 1994, 117, 441–452. [Google Scholar] [CrossRef]
- Calais, E.; Nocquet, J.M.; Jouanne, F.; Tardy, M. Current strain regime in the Western Alps from continuous global positioning system measurements, 1996–2001. Geology 2002, 30, 651–654. [Google Scholar] [CrossRef]
- Grenerczy, G.; Sella, G.; Stein, S.; Kenyeres, A. Tectonic implications of the GPS velocity field in the northern Adriatic region. Geophys. Res. Lett. 2005, 32. [Google Scholar] [CrossRef]
- Serpelloni, E.; Anzidei, M.; Baldi, P.; Casula, G.; Galvani, A. Crustal velocity and strain-rate fields in Italy and surrounding regions: New results from the analysis of permanent and non-permanent GPS networks. Geophys. J. Int. 2005, 161, 861–880. [Google Scholar] [CrossRef]
- D’Agostino, N.; Avallone, A.; Cheloni, D.; D’Anastasio, E.; Mantenuto, S.; Selvaggi, G. Active tectonics of the Adriatic region from GPS and earthquake slip vectors. J. Geophys. Res. Solid Earth 2008, 113. [Google Scholar] [CrossRef]
- Devoti, R.; Riguzzi, F.; Cuffaro, M.; Doglioni, C. New GPS constraints on the kinematics of the Apennines subduction. Earth Planet. Sci. Lett. 2008, 273, 163–174. [Google Scholar] [CrossRef]
- Marjanović, M.; Bačić, Ž.; Bašić, T. Determination of Horizontal and Vertical Movements of the Adriatic Microplate on the Basis of GPS Measurements. In Geodesy for Planet Earth, International Association of Geodesy Symposia; Kenyon, S., Pacino, M., Marti, U., Eds.; Springer: Berlin/Heidelberg, Germany, 2012; Volume 136. [Google Scholar]
- Weber, J.; Vrabec, M.; Pavlovčič-Prešeren, P.; Dixon, T.; Jiang, Y.; Stopar, B. GPS-derived motion of the Adriatic microplate from Istria Peninsula and Po Plain sites, and geodynamic implications. Tectonophysics 2010, 483, 214–222. [Google Scholar] [CrossRef]
- Ollier, C.; Pain, C. The apennines, the dinarides, and the adriatic sea: Is the Adriatic microplate a reality? Geogr. Fis. Din. Quat. 2009, 32, 167–175. [Google Scholar]
- Handy, M.R.; Schmid, S.M.; Bousque, R.; Kissling, E.; Bernoulli, D. Reconciling plate-tectonic reconstructions of Alpine Tethys with the geological–geophysical record of spreading and subduction in the Alps. Earth Sci. Rev. 2010, 102, 121–158. [Google Scholar] [CrossRef]
- Le Breton, E.; Handy, M.R.; Molli, G.; Ustaszewski, K. Post-20 Ma Motion of the Adriatic Plate: New Constraints From Surrounding Orogens and Implications for Crust-Mantle Decoupling. Tectonics 2017, 36, 3135–3154. [Google Scholar] [CrossRef]
- Medak, D.; Pribičević, B.; Prelogović, E. Recent geodynamical GPS-project in Croatia, raziskave s področja geodezije in geofizike 2006. In Proceedings of the 12th Strokovno Srečanje Slovenskega Združenja za Geodezijo in Geofiziko, Ljubljana, Slovenija, 18 January 2007. [Google Scholar]
- Kišpatić, M. Earthquakes in Croatia; Yugoslavia Academy of Science and Arts: Zagreb, Croatia, 1892; Volume 1, pp. 1–79. (In Croatian) [Google Scholar]
- Mohorovičić, A. Earthquake of 8 October 1909 (Potres od 8. X. 1909). In Annual Report of Zagreb Meteorological Observatory; Yearly Report of the Zagreb Meteorological Observatory for the Year 1909; Zagreb Meteorological Observatory: Zagreb, Croatia, 1909; pp. 1–63, (In Croatian and German). [Google Scholar]
- Markušić, S. Seismicity of Croatia. In Earthquake Monitoring and Seismic Hazard Mitigation in Balkan Countries; Springer: Dordrecht, The Netherlands, 2008; pp. 81–98. [Google Scholar]
- Markušić, S.; Stanko, D.; Penava, D.; Ivančić, I.; Bjelotomić Oršulić, O.; Korbar, T.; Sarhosis, V. Destructive M6.2 Petrinja Earthquake (Croatia) in 2020—Preliminary Multidisciplinary Research. Remote Sens. 2021, 13, 1095. [Google Scholar] [CrossRef]
- Ivančić, I.; Herak, D.; Herak, M.; Allegretti, I.; Fiket, T.; Kuk, K.; Markušić, S.; Prevolnik, S.; Sović, I.; Dasović, I.; et al. Seismicity of Croatia in the period 2006–2015. Geofizika 2018, 35, 69–98. [Google Scholar] [CrossRef]
- Herak, M.; Herak, D.; Markušić, S. Revision of the earthquake catalogue and seismicity of Croatia, 1908–1992. Terra Nova 1996, 8, 86–94. [Google Scholar] [CrossRef]
- Herak, D.; Herak, M.; Tomljenović, B. Seismicity and earthquake focal mechanisms in North-Western Croatia. Tectonophysics 2009, 465, 212–220. [Google Scholar] [CrossRef]
- European-Mediterranean Seismological Centre. Available online: https://www.emsc-csem.org/ (accessed on 5 January 2021).
- Markušić, S.; Stanko, D.; Korbar, T.; Belić, N.; Penava, D.; Kordić, B. The Zagreb (Croatia) M5.5 Earthquake on 22 March 2020. Geosciences 2020, 10, 252. [Google Scholar] [CrossRef]
- Herak, M. Croatian map of seismic risk. In Proceedings of the IV Conference of Croatian Platform for Decreasing the Risk of Catastrophe, Zagreb, Croatia, 13 December 2012. (In Croatian). [Google Scholar]
- Atalić, J.; Šavor Novak, M.; Uroš, M. Seismic risk for Croatia: Overview of research activities and present assessments with guidelines for the future. Građevinar 2019, 10, 923–947. [Google Scholar]
- Michetti, A.M.; Esposito, E.; Guerrieri, L.; Porfido, S.; Serva, L.; Tatevossian, R.; Vittori, E.; Audemard, F.; Azuma, T.; Clague, J.; et al. Memorie Descrittive Della Carta Geologica D’Italia, Intensity Scale ESI 2007; Guerrieri, L., Vittori, E., Eds.; ISPRA: Roma, Italy, 2007.
- Seismological Service. Available online: https://www.pmf.unizg.hr/geof/seizmoloska_sluzba/ (accessed on 4 January 2021). (In Croatian).
- National Institute of Geophysics and Vulcanology (INGV). Available online: https://ingvterremoti.com/2020/12/29/terremoto-mw-6-2-in-croazia-29-dicembre-2020-ore-1219/ (accessed on 14 March 2021). (In Italian).
- USGS’s Earthquake Hazards Program. Available online: https://earthquake.usgs.gov/earthquakes/eventpage/us6000d3zh/executive (accessed on 14 March 2021).
- European Union. Regulation (EU) No 377/2014 of the European Parliament and of the Council of 3 April 2014 Establishing the Copernicus Programme and Repealing Regulation (EU) No 911/2010; European Union: Brussels, Belgium, 2014; Retrieved 04 January 2021. [Google Scholar]
- De Zan, F.; Guarnieri, A.M. TOPSAR: Terrain Observation by Progressive Scans. Geosci. Remote Sens. 2006, 44, 2352–2360. [Google Scholar] [CrossRef]
- Copernicus Data Hub. Available online: https://scihub.copernicus.eu/ (accessed on 2 January 2021).
- Hanssen, R.F. Radar Interferometry: Data Interpretation and Error Analysis; Springer Science and Business Media: Dordrecht, The Netherlands, 2001; Volume 2. [Google Scholar]
- Veci, L. Interferometry Tutorial. In Sentinel Toolbox; ESA; Array Systems Computing Inc.: North York, ON, Canada, 2015; pp. 1–21. [Google Scholar]
- Aobpaet, A.; Cuenca, M.C.; Hooper, A.; Trisirisatayawong, I. InSAR time-series analysis of land subsidence in Bangkok, Thailand. Int. J. Remote Sens. 2013, 34, 2969–2982. [Google Scholar] [CrossRef]
- Chaussard, E.; Amelung, F.; Abidin, H.; Hong, S.H. Sinking cities in Indonesia: ALOS PALSAR detects rapid subsidence due to groundwater and gas extraction. Remote Sens. Environ. 2013, 128, 150–161. [Google Scholar] [CrossRef]
- CROPOS- Croatian National Positioning Reference Frame. Available online: https://www.cropos.hr/ (accessed on 31 January 2021).
- Croatian Geological Institute—Press Release on Petrinja Earthquake. Available online: https://www.hgi-cgs.hr/press-release-of-the-croatian-geological-survey-hgi-cgs/ (accessed on 9 January 2021).
- State Geodetic Administration—Press Release on First Official Results of GNSS Field Measurements over Petrinja Earthquake Area. (In Croatian). Available online: https://dgu.gov.hr/vijesti/prvi-sluzbeni-rezultati-satelitskih-mjerenja-na-potresom-pogodjenom-podrucju/5645 (accessed on 16 February 2021).
- Croatian Geological Institute—Press Release on Petrinja Earthquake. Available online: https://www.hgi-cgs.hr/urusavanje-tla-u-mecencanima-i-okolici-izazvano-potresom-magnitude-6-2-kod-petrinje-te-prethodnim-i-naknadnim-potresima/ (accessed on 17 March 2021).
Publisher’s Note: MDPI stays neutral with regard to jurisdictional claims in published maps and institutional affiliations. |
© 2021 by the authors. Licensee MDPI, Basel, Switzerland. This article is an open access article distributed under the terms and conditions of the Creative Commons Attribution (CC BY) license (https://creativecommons.org/licenses/by/4.0/).