Article

Sediment Bed-Load Transport: A Standardized Notation

1
TU, Darmstadt, Inst. für Wasserbau und Hydraulik, 64287 Darmstadt, Germany
2
Z & P—Prof. Zanke & Partner, Ackerstr. 21, D-30826 Garbsen-Hannover, Germany
3
CEO BGS-ITE, Pfungstaedter Straße 20, D-64297 Darmstadt, Germany
*
Author to whom correspondence should be addressed.
Geosciences 2020, 10(9), 368; https://doi.org/10.3390/geosciences10090368
Submission received: 7 August 2020 / Revised: 29 August 2020 / Accepted: 1 September 2020 / Published: 16 September 2020

Abstract

:
Morphodynamic processes on Earth are a result of sediment displacements by the flow of water or the action of wind. An essential part of sediment transport takes place with permanent or intermittent contact with the bed. In the past, numerous approaches for bed-load transport rates have been developed, based on various fundamental ideas. For the user, the question arises which transport function to choose and why just that one. Different transport approaches can be compared based on measured transport rates. However, this method has the disadvantage that any measured data contains inaccuracies that correlate in different ways with the transport functions under comparison. Unequal conditions also exist if the factors of transport functions under test are fitted to parts of the test data set during the development of the function, but others are not. Therefore, a structural formula comparison is made by transferring altogether 13 transport functions into a standardized notation. Although these formulas were developed from different perspectives and with different approaches, it is shown that these approaches lead to essentially the same basic formula for the main variables. These are shear stress and critical shear stress. However, despite the basic structure of these 13 formulas being the same, their coefficients vary significantly. The reason for that variation and the possible effect on the bandwidth of results is identified and discussed. A further result is the finding that not only shear stress affects bed-load transport rates as is expressed by many transport formulas. Transport rates are also significantly affected by the internal friction of the moving sediment as well as by the friction fluid-bed. In the case of not fully rough flow conditions, also viscous effects and thus the Reynolds number becomes of importance.

1. Introduction

Preliminary note. For the sake of linguistic simplicity, this article often refers to the dimensionless shear stress τ * = τ / ( ( ρ s ρ ) g d ) only as ‘shear stress’. This is possible and useful since τ * and τ for a given sediment only differ by a numerical factor. From the respective context, confusion with the dimensional shear stress τ [N/m 2 ] is avoided.
The abbreviations of the author names can be found in Table 1.

1.1. Reason and Task

Various transport functions for bed-load transport exist in the literature. There are empirical functions of the curve fitting type which are usually not true in dimensions and are limited to by the range of data used for fitting. Deterministic-analytical transport functions are based more or less on theoretical considerations and derivations. These are characterized by dimensional accuracy. Dimensional accuracy is a necessary (but not sufficient) prerequisite for physical conclusiveness. Dimensionally true formulas also offer the advantage that they can be used independently of the measurement system. However, by a different degree, they also contain empirical parts or coefficients. In addition the deterministic-analytical transport functions, there are the probabilistic approaches (e.g., Einstein [1], Cheng [2], Li, Sun and Lin [3]). A very new method is the development of sediment transport functions based on results of numerical modeling of a cloud of individual particles (e.g., Pähtz and Duran [4]). The latter authors concluded in this way that q b 🟉 ( τ 🟉 τ c 🟉 ) 1 when approximately τ 🟉 τ c 🟉 < 0.1 , where q b 🟉 is the dimensionless transport rate and τ 🟉 , τ c 🟉 are the actual and critical shear stresses. This changes to an exponent of 2 for higher values of ( τ 🟉 τ c 🟉 ) . In contrast, the 13 transport functions analyzed in this article tend to be q b 🟉 τ 🟉 1.5 when τ 🟉 τ c 🟉 . Further investigation is needed in this respect. Since the resulting transport equation is different, it cannot be included in the formula comparison performed below. The same applies to the class of probabilistic approaches.
Which formula to take and why is a common question. One way of addressing this question and creating a degree of clarity here could be a comparison with measurement data. The problem here, however, is that measurement data are more or less uncertain and sometimes also contain measurement errors. On the other hand, for the sake of comparability, all formulas that have been calibrated on this data in any way are not evaluated. Therefore, we are going a different way here. We normalize the formulas to one and the same standardized form and analyze the remaining differences. This procedure was shown to be possible for 13 mainly well-known transport functions in the literature.

1.2. Choice of the Standardized Function Notation

Different looking notations of sediment transport formulas can represent the same physics. A typical example is Meyer-Peter and Mueller’s original notation from 1948 and its notation used nowadays. In this respect, we assumed that several of the bed-load functions published in the past, in whole or in part, could be similar or even identical. In order to investigate this assumption, a transformation into a uniform or standardized notation is necessary. As a basic approach we use
q b = u s , m · s b
i.e., the bed-load transport rate is the product of the effective thickness of moving bed-load layer, s b [m], here defined as the bed-load layer reduced by pore volume, and its transport velocity, u s , m [m/s]. In dimensionless notation this becomes
q b 🟉 = u s , m ρ g d · s b d
Analogously, the mass transport rate is m b 🟉 = ρ s u s , m ρ g d · s b d and the volume-transport rate inclusive pores is q b , b u l k 🟉 = u s , m ρ g d · s b d ( 1 p ) where p = pore volume/total volume. We demonstrate that a number of bed-load transport formulas from literature is or can be expressed by the following dimensionless notation
q b 🟉 = a · τ 🟉 b τ c 🟉 to velocity of bed load · τ 🟉 τ c 🟉 to thickness of bed load layer
The first term basically describes the transport speed of the bed load. Among other things, based on the results of Fernandez-Luque [5], Fernandez-Luque and v. Beek [6] as well as considerations from Zanke (Figure 1) and others. The second term stands for the thickness of the bed-load layer and is based on measurements and considerations from various authors (for an example see Section 2.6.4). A synonymous notation of Equation (3a) is
q b 🟉 = a · τ 🟉 1.5 1 b τ c 🟉 τ 🟉 · 1 τ c 🟉 τ 🟉
The structure of Equations (3a) and (3b) is taken as the standard form for the bed-load equations to be compared in this paper. This way, a structural comparison of 13 bed-load transport formulas was carried out.
In the literature, the results of transport functions are usually represented by only one curve, q b 🟉 = f ( τ c 🟉 τ 🟉 ) or q b 🟉 = f ( τ 🟉 ) . Obviously, the solutions of Equations (3a) and (3b) result in only one curve when a, b and τ c 🟉 are constants. However, the physical effects behind a and b differ with different sediment and different flow conditions (see later on Table 2 and Table 3). Furthermore, τ c 🟉 can only be treated as constant in the case of hydraulically rough conditions. Therefore, Equations (3a) and (3b) result in a range of graphs and not only in a single curve.

2. Transcription of Some Formulas Discussed in This Paper

Before the selected bed-load equations are compared and analyzed in Section 3, remarks on some of them are required on the way they are transformed into the standardized notation. With respect to standardization, we select only formulas with a deterministic-analytical genesis. In Section 2.6, we demonstrate as an example, how bed-load velocity and bed-load layer thickness can be derived.
With the coefficients of the transport functions, the question of the validity limits in relation to the grain sizes arises. In this context it should be noted that the transport formulas were developed/adapted for cohesion-free sediments. Moreover, many transport functions are only valid for hydraulically rough conditions. This results in the applicable particle size range in individual cases. A relevant overview is shown in Table 4.
The transport functions regularly apply first to uniform and to weakly non-uniform sediments. Clearly non-uniform sediments may be captured by fractionwise calculation which is not the subject of the present publication.

2.1. Meyer-Peter and Mueller (1948/1949)

MPM formula [7,8], q b * = 8 ( τ * τ c * ) 1.5 , is true in its dimensions and can be transformed into the standardized structure of Equations (3a) and (3b). With good accuracy, the term ( τ 🟉 τ c 🟉 ) 1 / 2 within the MPM formula can be replaced by 1.28 ( τ 🟉 0.7 τ c 🟉 ) . MPM formula, modified this way, fits MPM’s own data, when corrected after Hunziker [9], without quality loss. It then reads
q b * = 1.28 a τ 🟉 0.7 τ c 🟉 τ 🟉 τ c 🟉 .
With a = 8 from MPM’s original, a m o d = 10.2 . In the following this modified MPM formula is marked as MPM m o d . (Note: We use an adjustment factor of 1.28 instead of 1.33 as suggested by Seminara, Solari and Parker (see below), since this is more appropriate for the higher transport rates).

2.2. Fernandez Luque and Van Beek (FlvB, 1976)

Evaluating their data, FLvB [6] empirically concluded
q b * = 5.7 τ * τ c * 3 / 2 ,
which is the MPM Formula (2) with a slightly different factor. Later Seminara, Solari and Parker [10], approached
( τ 🟉 τ c 🟉 ) 1 / 2 = 1.33 τ 🟉 0.7 τ c 🟉
and proposed a modified version of the FLvB formula:
q b * = 7.59 τ 🟉 0.7 τ c 🟉 τ 🟉 τ c 🟉 .

2.3. Engelund and Fredsoe (1976)

In their derivation, Engelund and Fredsoe [11] arrived at
q b 🟉 = 5 p τ 🟉 0.7 τ c 🟉
with p = 6 π tan φ d τ 🟉 τ c 🟉 and φ d = dynamic angle of internal friction. The authors interpreted p as the probability of particles active in a single layer of bed-load. When τ 🟉 exceeds a certain value, this probability becomes p > 1 and thus loses its physical meaning. For φ d = 27 and τ c 🟉 = 0.05 this is the case for example if τ 🟉 > 0.32 . To overcome this problem, Engelund and Fredsoe constructed an empirically modified term for p. However, Zhang and McConnachie [12] stated that this ‘correction’ fails in case of high intensities of bed-load transport. Compared to Zanke’s expression [13,14,15] for the thickness of the moving bed-load layer (Equation (16)), Engelund and Fredsoe’s p more likely represents the relative thickness s b / d of this layer in case of horizontal bed and fully developed sediment motion. Based on this understanding, p > 1 has indeed a physical meaning. Engelund and Fredsoe formula is therefore considered here with their original p. Based on a widely analytical two-phase flow approach, a formula structurally identical with Engelund/Fredsoe’s equation, was derived by Zhang and McConnachie [12].

2.4. Bridge and Dominic and Bridge and Hanes

Bridge and Dominic (BD) [16] in their derivation arrived at
q b * = v s / v 🟉 tan φ d τ 🟉 τ c 🟉 τ 🟉 τ c 🟉 .
Compared to the notation of Equations (3a) and (3b) is b = 1 . Bridge and Hanes [16] instead of b = 1 changed this as to be b = tan φ d tan φ o . From a fit to experimental data, BD propose
v s / v 🟉 tan φ d 17.57 ( v 🟉 v c 🟉 ) / w s 0.271
with w s = terminal settling velocity. In hydraulically rough case, sediments are typically coarse. Then the settling velocity becomes w s = 1.1 ρ g d (From the balance of weight force and hydraulic resistance, the settling velocity results, w = 4 3 c D ρ g d . In the case of particles d 1 mm for spheres with a density of quartz material, c D 0.4 and w = 1.83 ρ g d while for sand c D 1.09 and w = 1.1 ρ g d (see e.g., Zanke [17])), and the foregoing can be rewritten by
v s / v 🟉 tan φ d 17.12 τ 🟉 τ c 🟉 0.271 .
Bridge and Dominic this way found the current velocity v s which is responsible for the bed-load velocity to be a function of τ 🟉 , τ c 🟉 .

2.5. Parker, Seminara and Solari (PSS)

PSS, for horizontal [18] and nearly horizontal bed derived
q b * = 0.2 v s / v 🟉 tan φ d τ 🟉 0.7 τ c 🟉 τ 🟉 τ c 🟉 .
The authors adopted v s / v 🟉 = 11.5 from Fernandez Luque and assumed tan φ d = 0.3 . The factor ‘a’ in PSS is thus 7.67.

2.6. Zanke (1999, 2001, 2004) and the Inclusion of the Risk of Initial Movement

2.6.1. Consideration of the Probabilistic Character of Beginning of Sediment Motion

In sediment mechanics, it is customary to use the average shear stress in its dimensional or non-dimensional form as the driving variable for the movement of sediments, τ ¯ or τ 🟉 ¯ , (generally simply written τ , τ 🟉 ) . However, current velocities and thus shear stress in turbulent flow are distributed in size, and predominantly their peak values are decisive for sediment movability. The disregard of this by the use of time average values is not a problem as long as the peak values correlate linearly with the time-mean values. However, if only a part of the instantaneous shear stresses can move particles, this no longer holds. When the shear stress continues to decrease, more and more only the peak values of shear stress can move particles in the end. Then τ ¯ or τ 🟉 ¯ have long been subcritical but there may be still a, albeit diminished, transportability (Zanke [19,20,21] and Luckner and Zanke [22]). The effects connected can be described by a probability or risk of initial movement, R. It is R = 0 , when the most unstable situated grains can not be displaced by the strongest velocity fluctuations and R = 100 % when the lowest occurring velocity fluctuations can move even the most stable situated grains of the bed surface. An early laboratory investigation in this context was already done by Grass [23] who described the existence of the probability function of τ * and τ c * . When the stability of embedding is represented by the probability distribution of the individual critical shear stress, p ( τ c 🟉 ) , and the distribution of instantaneous shear stresses is p ( τ 🟉 ) , then (Zanke [20,21])
R = p ( τ ) τ p ( τ c ) d τ d τ .
This is the mathematical solution of the overlap of the probabilities of driving and resisting stresses. However, in reality, the functions p ( τ ) and p ( τ c ) are not well known, and even for Gaussian distributions, this integral can not be solved by a closed solution. Instead, an empirical approach was suggested (Zanke [20,21]):
R = 1 + 10 τ / τ c α 1
The original exponent we have changed from α = 9 by α = 6 for a better fit to data. Critical values (e.g., after Shields [24]) describing the initiation of motion thus stand for a low probability of grain motion (according to Zanke [20,21] ≈10%) but not for an abrupt threshold.
In Equation (7) may be replaced
τ 🟉 τ c 🟉 = τ τ c = u y u c , y 2 = u m u c , m 2 = u 🟉 u c 🟉 2 .

2.6.2. τ c 🟉 tan φ d or τ c 🟉 tan φ o ?

In recent approaches to the beginning of bed-load movement, the angle of internal friction plays a significant role. When τ c 🟉 is expressed via the angle of internal friction, the question comes up whether the static or the dynamic angle is effective.
If an abrupt threshold marked the beginning of movement, the static angle, tan φ o , would undoubtedly apply. The beginning of particle motion, however, extends over the range of 0.5 τ 🟉 / τ c 🟉 1.5 … 2 where τ c 🟉 denotes the beginning of movement after Shields only as a reference. The first particles set into motion at about τ 🟉 = 0.5 τ c 🟉 are situated particularly unstable. They accordingly have a low friction angle. With increasing speed of near-bed current, more stable situated particles begin to move. Finally, at fully developed sediment motion, the dynamic friction is effective. For this reason, the dynamic angle of internal friction, tan φ d is used here as being decisive for the beginning of sediment movement.

2.6.3. Average Transport Velocity of Bed-Load Layer, u s , m

According to the findings by Fernandez Luque [5] and Fernandez Luque and v. Beek [6], saltating grains move horizontally with a mean velocity of u s v 🟉 0.7 v c 🟉 . Based on analytical considerations and illustrated in Figure 1, Zanke [13,19] arrived at u s , m a x = v s 1 b · v c , s / v s = v s 1 b · v c 🟉 / v 🟉 for the particle velocity at the upper edge of bed-load layer, and for the depth averaged bed-load velocity at
u s , m = u s , m u s , m a x v s v 🟉 v 🟉 b v c 🟉 ,
which can be also expressed by
u s , m = u s , m u s , m a x v s v 🟉 τ 🟉 b τ c 🟉 ρ g d
Herein v s = flow velocity at the upper ‘edge’ of a bed-load layer which is taken as being responsible for the bed-load velocity u s , m a x = v s b v c , s , v 🟉 = shear velocity, v c 🟉 = Shields [24] critical shear velocity. In case of R < 1 , only some particles of the bed surface are active because of their individually reduced stability of embedding. In other words, their critical shear stress is reduced. As not all particles are active, the mean particle velocity is less than that of the active particles. This is taken into account by u s , m , R = R · u s , m and is expressed through τ c , R = R τ c 🟉 . Under this prerequisite, Equation (10) is transformed to
u s , m = u s , m u s , m a x v s v 🟉 R τ 🟉 b R τ c 🟉 ρ g d .
Termb, in Zanke ([13,19]) was determined based on Fernandez Luque v. Beek with 0.7 . With respect to the derivation of Duran et al. [25,26] we use b = tan φ d tan φ o .
Term u s , m / u s , max , in Zanke [13,19] was determined as
u s , m / u s , m a x 0.5 ,
by assuming that the particle velocity profile is approximately linear and a slip between non-moving and moving bed can be neglected when u s , m is determined. Hanes Inman [27] found that the vertical velocity distribution of bed-load is indeed linear but with a slip at the bed. Thus, u s , m / u s , m a x could be slightly larger than 1 / 2 but is taken here as 1 / 2 . Then
u s , m = 1 2 v s v 🟉 τ 🟉 tan φ d tan φ o τ c 🟉 ρ g d .
With respect to the probabilistic character of the beginning of motion, (13) is
u s , m = 1 2 v s v 🟉 R τ 🟉 tan φ d tan φ o R τ c 🟉 ρ g d .
Term v s / v 🟉 is given by Equation (31) in combination with Equation (33).

2.6.4. Thickness of Bed-Load Layer s b

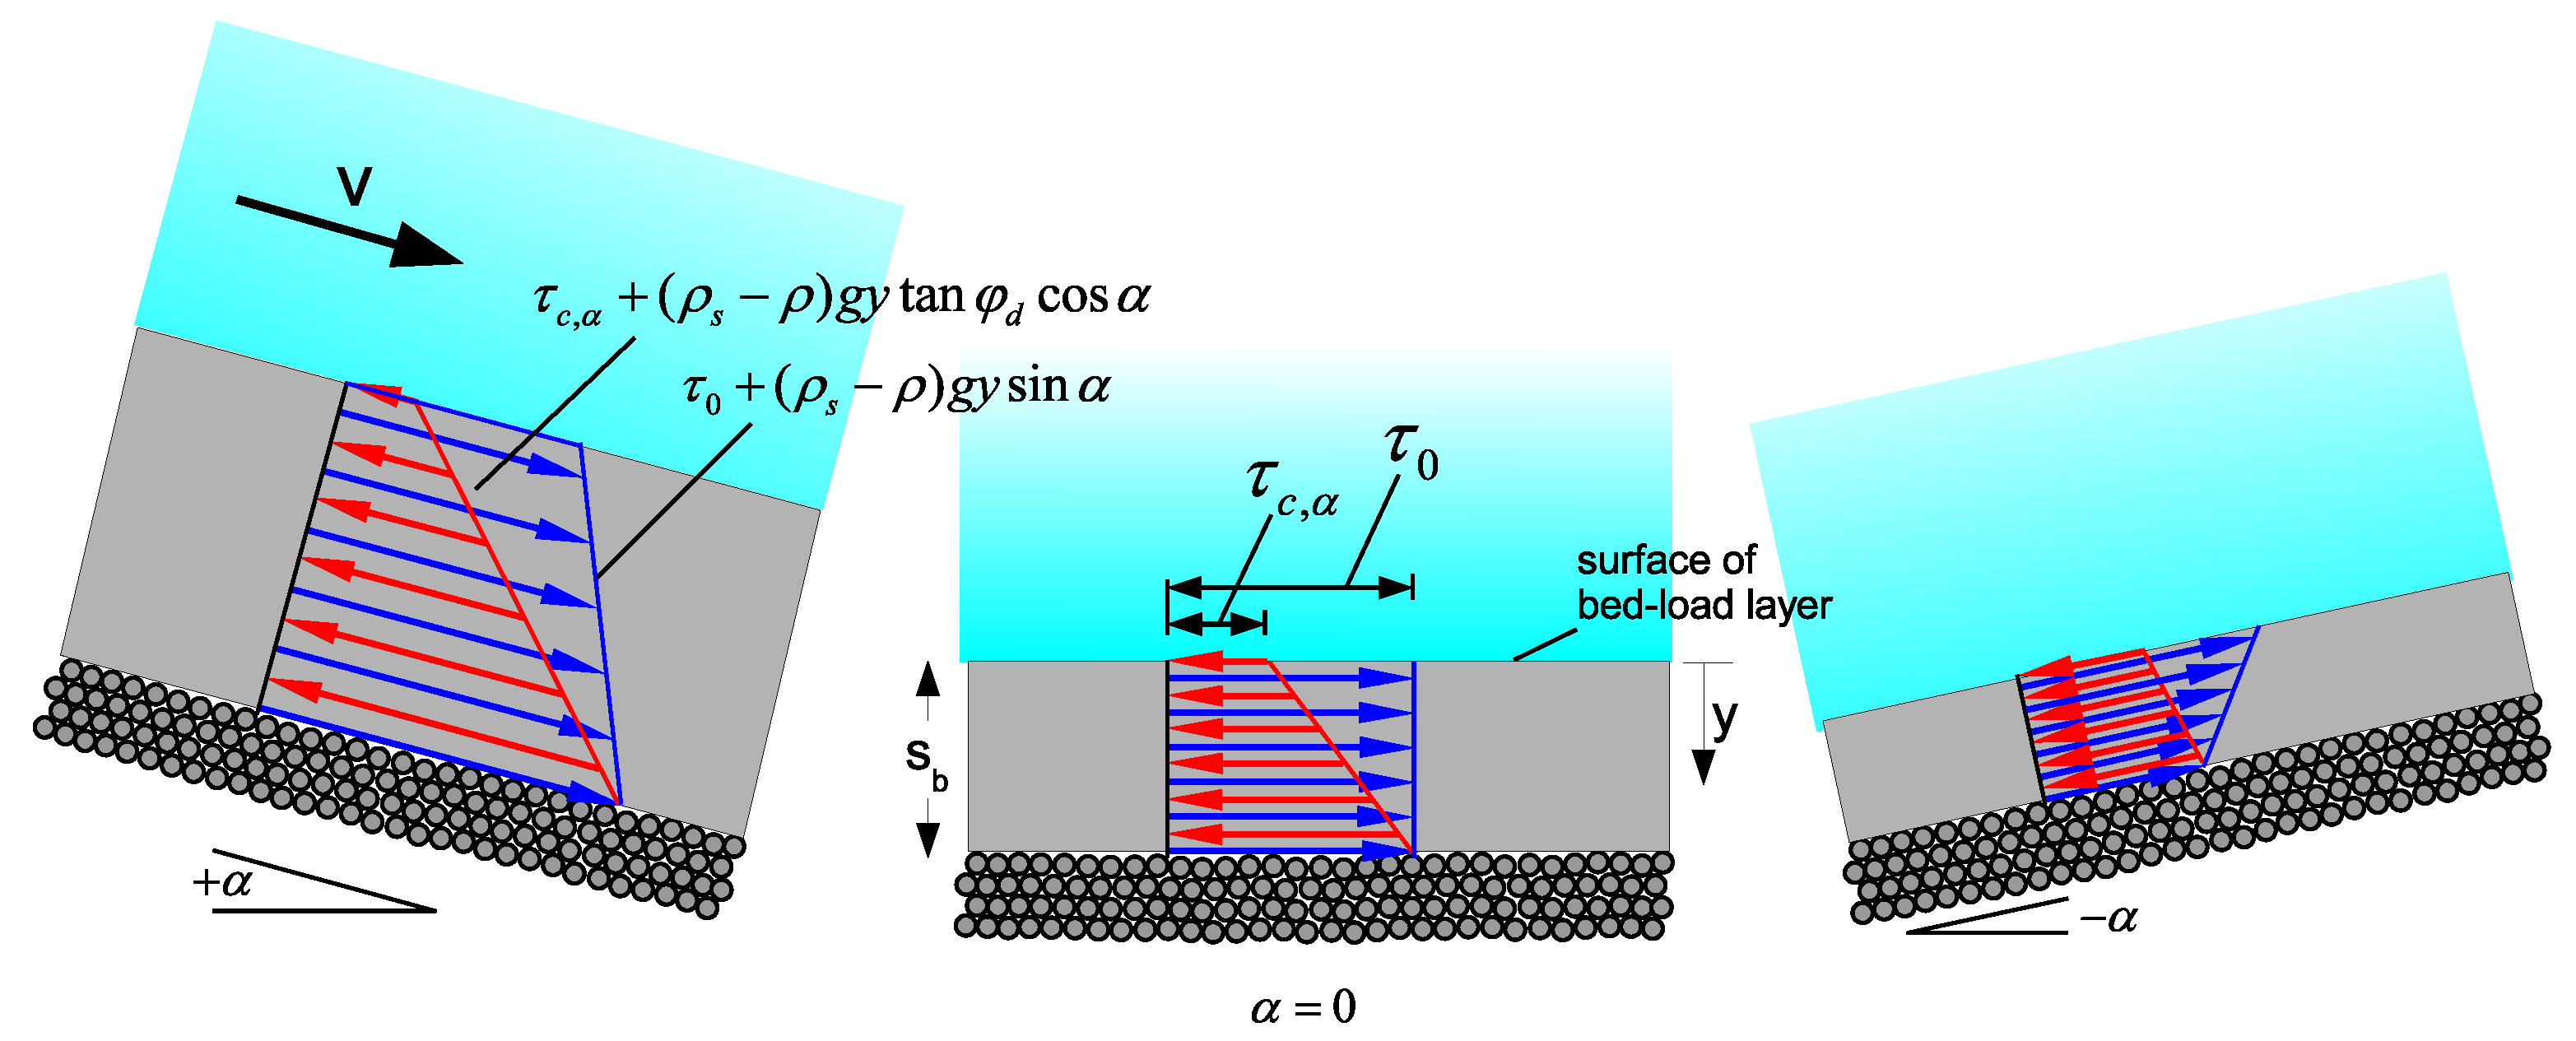
The thickness of the moving bed-load layer is determined by the driving and resisting forces or stresses. Driving is the water body via τ = τ o and, in case of an inclined bed, the down-slope weight of the sediments, ( ρ s ρ ) g y s i n α . Resisting are τ c , α at the bed surface and the friction within the bed, ( ρ s ρ ) g y tan φ d c o s α . At y = s b , the driving forces (or stresses) are equal to the resisting forces (or stresses, (Figure 2). With τ 🟉 = τ ( ρ s ρ ) g d results:
s b d = τ 🟉 τ c , α 🟉 tan φ d · c o s α s i n α = τ 🟉 η · τ c 🟉 η · tan φ d
and, including weak transport conditions considering the risk of initial movement
s b d = R τ 🟉 R τ c , α 🟉 tan φ d · c o s α s i n α = R τ 🟉 η · R τ c 🟉 η · tan φ d
where η describes the effect of the inclination on s b by
η = τ c , α τ c 🟉 = sin ( φ d α ) sin φ d = cos α sin α tan φ d = cos α ( 1 tan α tan φ d )
This classical solution for the effect on Shields critical shear stress for downwards slopes was confirmed by e.g., Chiew and Parker [28]. However, Maurin et al. [29] presented a corrected buoyancy formulation for the case of turbulent flow conditions within the bed-load layer. They also lined out that the effects of bed-slope are different in the case of gravity driven and pressure driven transport.
For a horizontal bed, η = 1 . The balance of stresses results in s b being a linear function of ( τ 🟉 τ c 🟉 ) except in case of low shear stresses when becomes R < 1 . This linearity is confirmed by e.g.,
  • the measurements of the bed-load layer thickness by Sumer et al. [30] showing a linear dependency on τ 🟉 for three lightweight sediments: s b , r e a l / d 12 τ 🟉 . This is valid in the case of τ 🟉 τ c 🟉 as τ c 🟉 is not regarded. Similarly, Wilson [31] found s b , r e a l / d 10 τ 🟉 .
  • Another confirmation of the linearity of Equation (16) can be drawn from numerical simulations by Duran et al., [25,26] and Pähtz/Duran [4], which indicate that the number of transported particles per area is a linear function of τ 🟉 τ c 🟉 . Furthermore, Duran et al., 2012 stated that this linearity is true for both, bed-load and saltation and came to the conclusion ‘that dissipation due to collisions of the moving grains with the bed play the same role in both transport regimes’.

Porosity of Bed-Load Layer

It must be noted that s b in Equation (16) is a statistical time average and thus can be less than one grain diameter. Further, note that in (16), s b describes the effective bed-load layer thickness without pore volume, i.e., its effective thickness (Figure 3). Actually, in reality, the thickness is s b , r e a l , and is accompanied by a porosity p > 0 :
s b , r e a l d = s b d ( 1 p ) .
If the bed-load is determined via s b , r e a l , then additional information on the pore volume, p, would be needed. The advantage of the use of s b as the effective thickness is that no information regarding the pore volume of the bed-load layer is needed when s b is determined. Nevertheless, measurements of the bed-load layer thickness by Sumer et al. [30], based on lightweight sediments, allow an estimation of the pore volume of the bed-load layer. From Sumer’s Figure 16, as already mentioned, results in s b , r e a l / d 12 τ 🟉 . The data in Sumer et al. range up to τ 🟉 5 , i.e., τ 🟉 / τ c 🟉 100 in hydraulically rough cases, wherefore, except very small τ 🟉 , also s b , r e a l d = s b d · ( 1 p ) 12 ( τ 🟉 τ c 🟉 ) can be approached from this data. Compared to Equation (16), this implies p = 1 1 12 tan φ d ( R = 1 and η = 1 assumed). For φ d = 27 , as an example, this results in p 0.83 and is very close to the volume concentration within s b , measured by Sumer et al. of approximately 17%. In other words, the thickness of the real bed-load layer is about 1 / 0.17 6 times the compact layer. The question, if this is a result of general validity and is thus also valid for heavier weight sediments like sand, cannot be answered up to now. For this reason (according to a personal communication with M. Sumer, 2017) the moving bed layer was too thin in its measurements with sandy material. Thus, the resolution of the concentration distribution across the depth was not sufficient to be conclusive. However, based on the lightweight runs by Sumer et al. [30] as a first approach, the thickness of bed-load layers including pores might be assumed to be:
s b , r e a l d 6 R ( τ 🟉 R η τ c 🟉 ) η tan φ d .

2.6.5. Sediment Transport Rate

Realizing Equation (1) with Equations (14) and (16), the bed-load transport rate in the notation of Equation (3a) is
q b 🟉 = 1 2 v s v 🟉 R · τ 🟉 tan φ d tan φ o η R τ c 🟉 u s , m / ρ g d · R η · tan φ d τ 🟉 R η τ c 🟉 s b / d
or in the notation of Equation (3b)
q b 🟉 = 1 2 v s / v 🟉 η · tan φ d · ( R τ 🟉 ) 1.5 1 tan φ d tan φ o η R τ c 🟉 τ 🟉 · 1 η R τ c 🟉 τ 🟉
Accordingly, the transport rate is determined primarily by the shear stress variables τ 🟉 and τ c 🟉 . It is further modulated by the ratio of v s / v 🟉 , which describes the force transfer between water body and bed, and is influenced by the internal friction of the moving sediment via tan φ o and tan φ d . In Section 3.2 the effect of these influences is discussed in detail.
With regard to the introduction of the risk R within the bed-load transport functions, reference is made to Recking [32], who tested 16 common bed-load transport formulas with four data records that correspond to different measurement periods. Recking emphasizes that most threshold formulas are no longer valid if the flow condition is below twice the threshold condition.

2.7. Lajeunesse, Malverti and Charru and Houssais and Lajeunesse

Lajeunesse et al. [33] proposed
q b * = 10.6 τ 🟉 τ c 🟉 + 0.025 τ 🟉 τ c 🟉 .
Within their derivation, Lajeunesse et al. used w s ρ g d to express the settling velocity, which only applies to coarse grains. Among others, the LMC equation is therefore only applicable for coarse sediments, i.e., under hydraulically rough conditions. Under the associated prerequisite of τ c 🟉 0.05 holds 0.025 = 0.112 τ c 🟉 . Then, Equation (22) can be formulated in the here used standardized notation,
q b * = 10.6 τ 🟉 0.89 τ c 🟉 τ 🟉 τ c 🟉 .
Houssais and Lajeunesse [34] changed the factor of 10.6 of (22) by 56.6 ρ / ρ S .

2.8. Duran, Andreotti and Claudin

Duran et al. [25], due to theoretical considerations, derived a transport function which, in the notation used here, reads
q b 🟉 = v s / v 🟉 tan φ d · τ 🟉 tan φ d tan φ o τ c 🟉 · τ 🟉 τ c 🟉

3. A Standardized Structure of Bed-Load Transport Formulas

3.1. Formulas with (Widely) Identical Structures

As is demonstrated in Table 1, a significant number of transport formulae is or can be expressed by the structure of Equations (3a) and (3b). Many of these formulas have been considered fairly reliable in the literature in many cases (but not generally). All 13 formulas of Table 1 represent the effect of shear stress on transport rates structural identical and are represented by Equations (3a) and (3b). At high shear stress, all of them result in
q b 🟉 = a · τ * 1.5 ; ( τ 🟉 τ c 🟉 )
with term a as listed in Table 2. This congruence is remarkable as the formulas result from very different methodical approaches, e.g., empirically (Meyer-Peter and Mueller, 1948/1949), via shear stress balance e.g., (Zanke, 1999/2001/2004), based on an analysis of saltation e.g., (Nino and Garcia [35]) or two-phase flow approach (Zhang and McConnachie [12]) or by analytical considerations as in Duran et al. [26].

3.2. Differences and Congruences of the Bed-Load Formulae

As already stated above, the main effect on transport rates is determined by the shear stress balance. In this respect, all 13 transport functions are entirely or almost identical. However, they differ in the effects which are summarized in terms of ‘a’ and ‘b’.

3.2.1. Differences with Respect to Term ‘a’ of the Equations of Table 1

Following Equation (21),
a = u s , m u s , m a x 1 tan φ d · v s v 🟉 .
Term a concerns the bed-load velocity, u s , m , and the influence of the dynamic internal friction of the sediments, tan φ d , which can be quite different in practice. Another influencing factor is the momentum exchange between bed and fluid which is described by the friction factor f = 8 ( v m / v 🟉 ) 2 . Within Equation (26), the friction related bed–fluid interaction occurs in the form of v s / v 🟉 = v m / v 🟉 · v s / v m .
The consideration of a compared to Equation (26) within the transport formulas is different as can be seen in Table 2. In some formulas, a is simply a fitted constant, in others tan φ d and/or v s / v 🟉 are explicitly considered but in many cases at the end are replaced by fitted constants.

3.2.2. u s , m / u s , m a x

Only Equation (21) explicitly takes u s , m / u s , m a x into account. In all other transport functions u s , m / u s , m a x is not regarded but must be implicitly taken into account by the adapted constants. Disregarding this factor of ≈1/2 for u s , m / u s , m a x , may be a reason for compensating this by using very high specification of the friction angle in some formulas. Bridge and Dominic for example documented φ d = 52 for a natural sand. Considering u s , m / u s , m a x = 1 / 2 , within BD’s transport function, the same value for term ‘a’ would result based on φ d = 32 . 6 . For data on φ compare Figure 4 and note that generally φ d < φ o .

3.2.3. Differences with Respect to tan φ d

As can be seen from Equations (20) and (21), internal friction of sediment affects bed-load velocity, u s , m , as well as its layer thickness, s b . Internal friction coefficients themselves are affected by grain size, grain shape, grain surface roughness, sediment sorting and pore ratio. The dynamic friction angle, tan φ d , is generally less than static friction angle, tan φ o . Angles φ o cover a certain range which is approximately 28 < φ o < 46 . A first guess can be taken from Figure 4. The absolute size of the static friction angle is clearly related to the grain size. For sand with a grain diameter of about 0.2 mm, this angle is about 30 and increases towards gravel and stones, reaching values between 40 and slightly above. Furthermore, there is a clear dependence on the grain shape and the roughness of the grain surface. The smoother and rounder the grains are, the smaller is the angle of friction. In addition, the relation of tan φ d / tan φ o has a bandwidth. In literature, φ d is mentioned as being between 2 and 8 less φ o (Bagnold, 1941; Allen, 1970, 1972, both authors cited in Hanes and Inman [27]) but may be also just φ d 0.5 φ o (Madsen 1991 [37], Nino and Garcia [35]).
Since tan φ d is taken as being non-variable in transport equations by Meyer-Peter and Müller 1948, Fernandez Luque and vanBeek 1976, Fredsoe and Deigaard 1992 and Lajeunesse et al. 2010, these equations are only valid for a specific type of sediment. However equations by Ashida and Michiue [38], Engelund and Fredsoe [11], Bride and Dominic [16], Madsen [37], Zhang and McConnachie [12], Nino and Garcia [35], Zanke 1999, 2001, 2020, Parker, Seminara and Solari [18] and Duran, Andreotti and Claudin [25] explicitly include the dynamic internal friction angle of moving sediment and thus are of more general validity (but only if tan φ d is not ultimately set to constant).
As variations of internal friction may affect transport rates significantly, internal friction conditions should be regarded as variable when transport rates are computed. However, there is a lack of possibilities for the analytical prediction of the friction coefficients of a given sediment. Therefore, measurement of internal friction behavior is recommended in the case of practical application.

3.2.4. Differences with Respect to v s / v 🟉

Differences between the transport function exist with respect to taking v s / v 🟉 as fixed or variable and in the latter case with regard to the way of their determination. From the law of the wall results
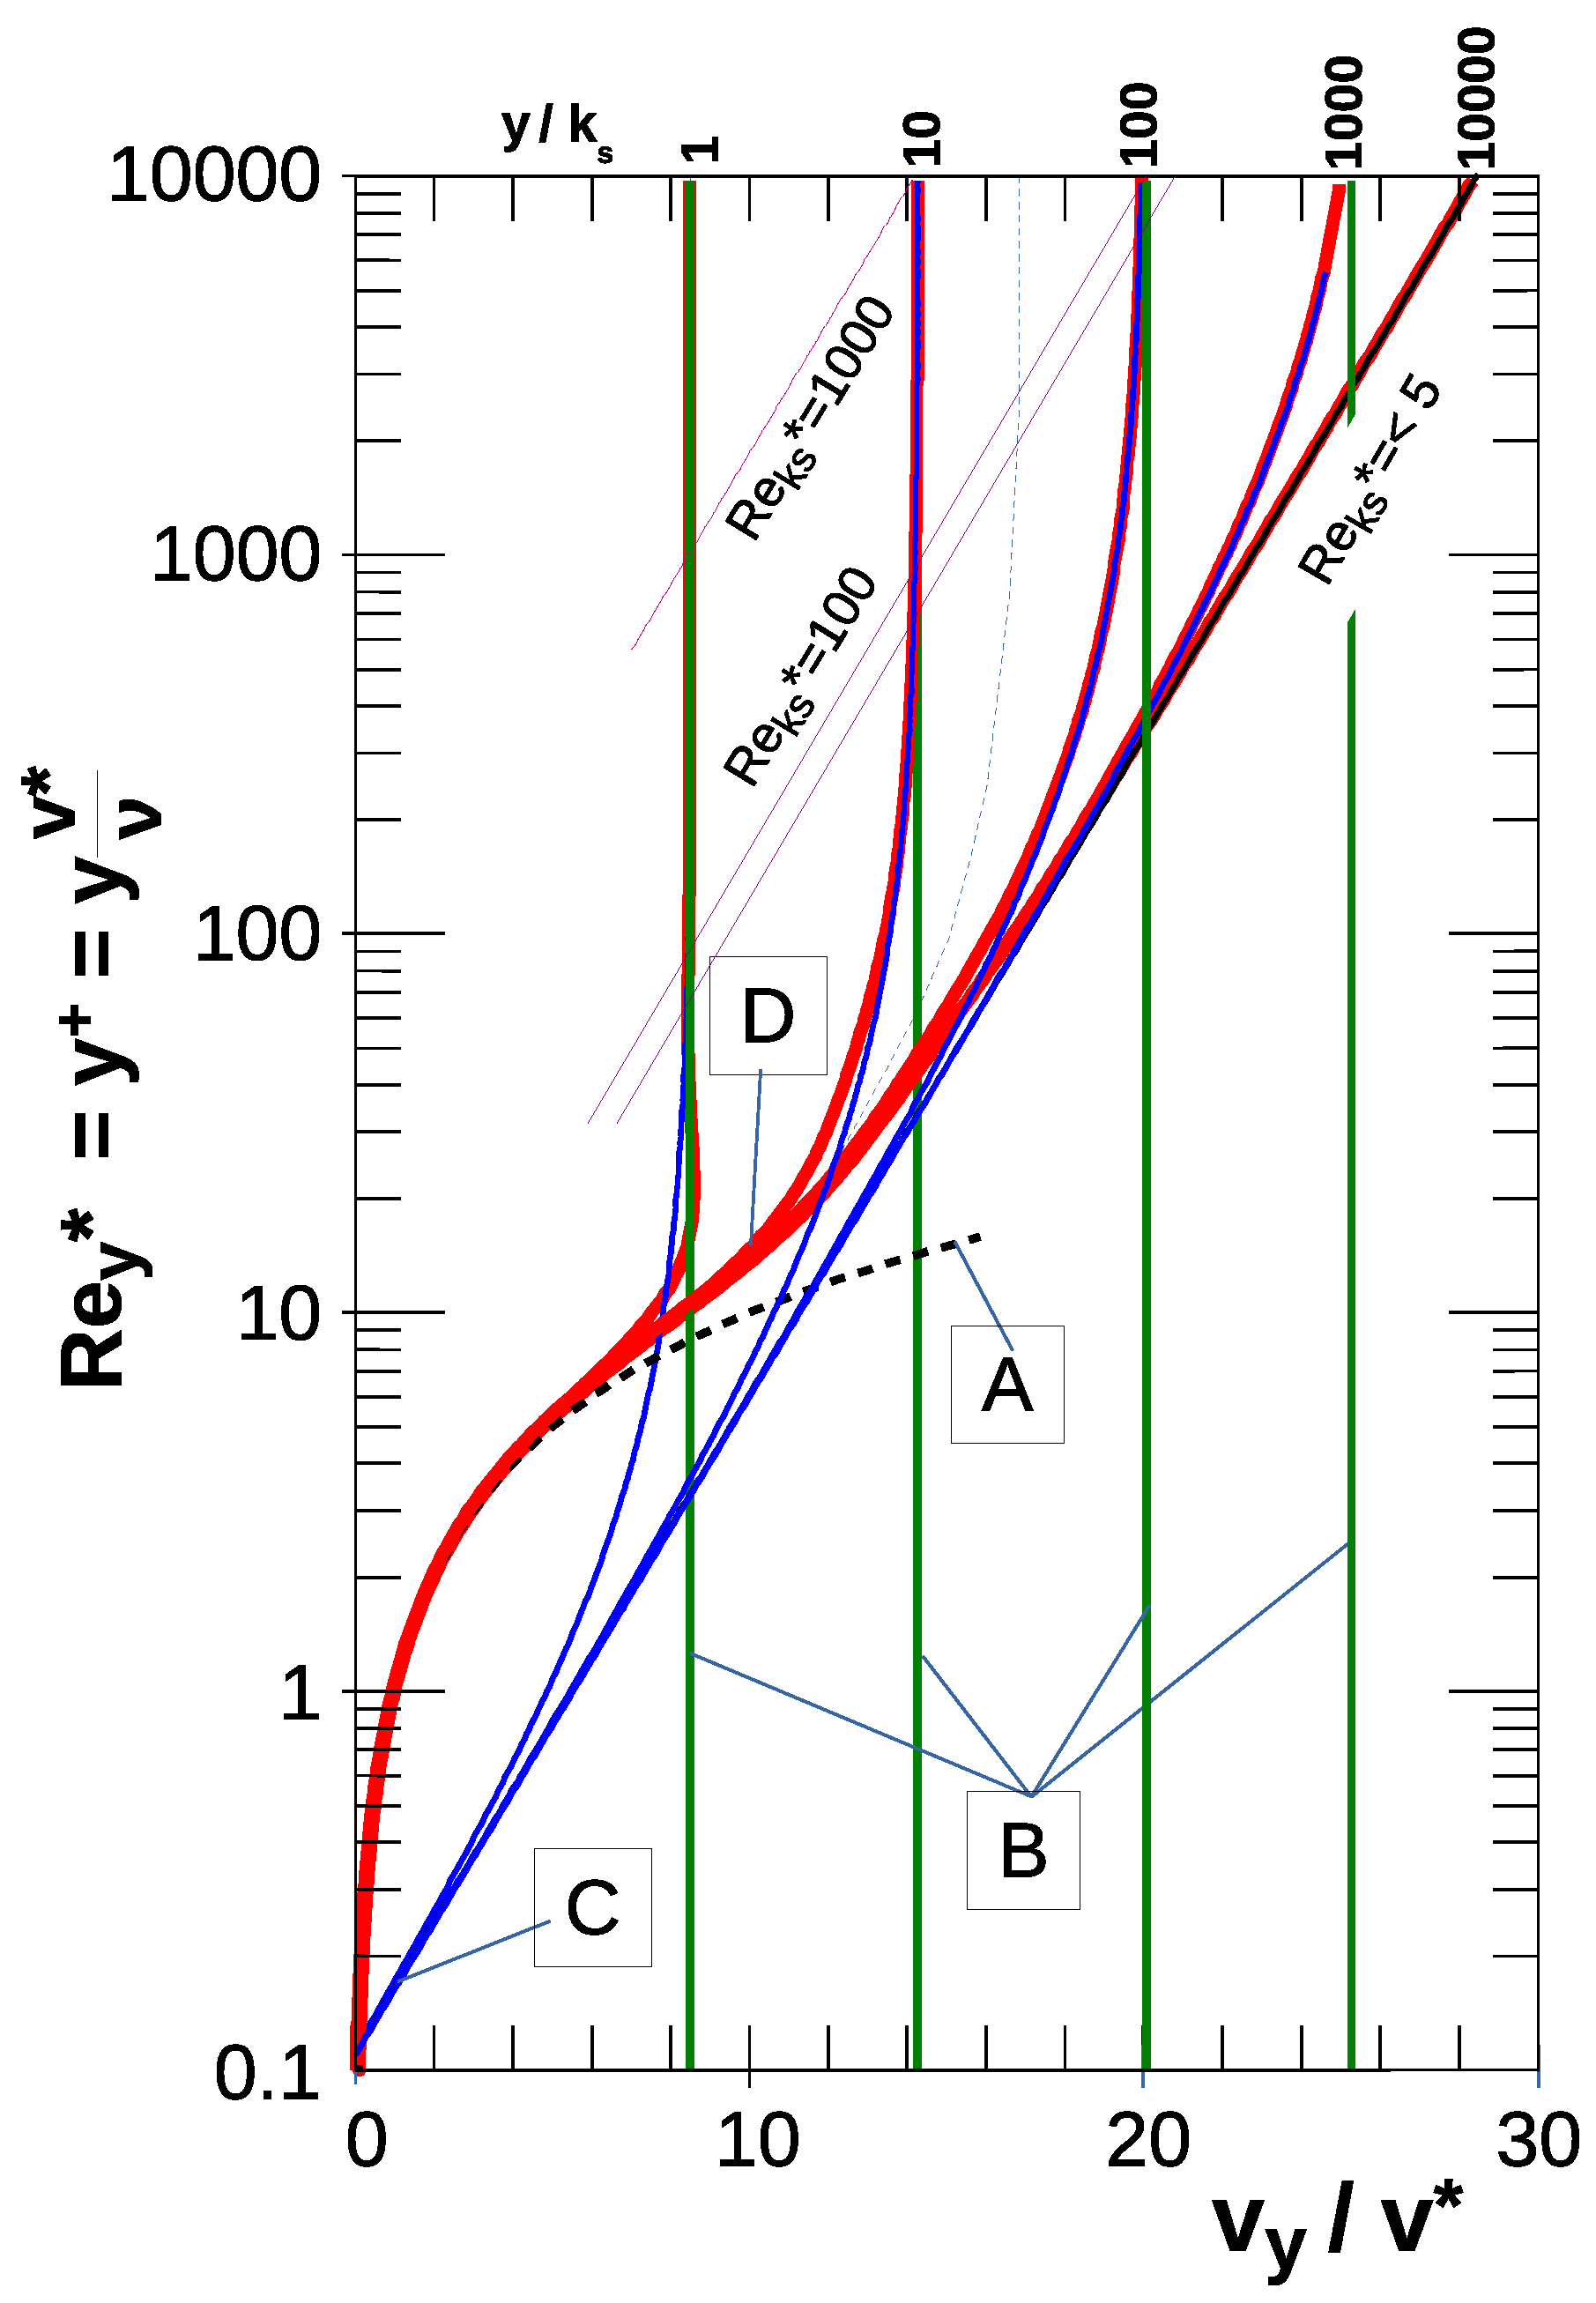
v s v 🟉 = 2.5 l n y s k s + 8.5 Re 🟉 > 70 , i . e . , hydraulically rough
Hydraulically rough conditions in sand/water system exist in case of approximately d > 2 mm or at least say approximately d > 1 mm. Typically, 1 < y s / k s < 5 is estimated and thus 8.5 < v s / v 🟉 < 12.5 is taken in literature. In formulas MPM, EF, MA, FD, NG and LMC, v s v 🟉 is taken as a fixed but different value. The specific formula is then automatically only valid for hydraulically rough conditions. More general, in turbulent flow yields
v s v 🟉 = 2.5 l n y s k s + B smooth , transitional and rough
with e.g.,
B 2.5 l n 1 ( 0.033 + 0.11 / k s + )
as an approach, where B = integration constant of the logarithmic velocity profile, k s + = v 🟉 k s / ν = R e 🟉 k s / d = τ 🟉 D * 3 k s / d , with R e 🟉 = v 🟉 d / ν = τ 🟉 D * 3 , y s = distance from the bed where v y = v s and ν = kinematic viscosity of fluid. The value of k s / d depends on the shape, and the arrangement of the sediment particles at the bed surface and is an ambiguous problem. In this paper, we use k s = d.
Very close to the wall, a viscous sublayer of a thickness of δ = 11.63 ν / v 🟉 exists where the velocity profile is defined by
v y v 🟉 = v 🟉 ν y
The relation of v s / v 🟉 can be represented for all hydraulic stages from viscous to fully turbulent, and for all sediments from fine to coarse, as proposed by Zanke [39]
v y v 🟉 = v 🟉 ν y 2 + P y t 2.5 l n y k s + B 2 1 / 2 full range viscous-turbulent
From this, with y = y s results v s / v * . Herein, P y t the probability of turbulence at level y s
P y t = 1 e x p 0.08 v 🟉 y ν .
Reichardt [40] presented a transitional formula that is practically identical to the result of Equation (31), but is only valid for R e * 5 whereas Equation (31) also covers the transition to hydraulically rough flow.
Figure 5 illustrates the different approaches for determining v s / v * . The application of Equation (27) is equivalent to choosing a fixed value of v s / v 🟉 as suggested by some authors (see Table 2). As can be seen, this only applies in the case of ‘turbulent, rough’ ( R e k s * 70, curves ‘B’). Other researchers determine v s / v 🟉 via Equation (28) (curves ‘C’), which, in case of R e k s * 11.63 deviates heavily from the viscous solution (curve ‘A’). Equation (31) (red curves ‘D’) gives a closed and complete solution, valid from turbulent rough via turbulent smooth to viscous within the sublayer.

Shear Stress Affects v s / v 🟉

Bridge and Dominic [16], for v s / v 🟉 found a dependency on τ 🟉 . The authors empirically recommended Equation (5).
The dependency on τ 🟉 is equivalent to a variable y s / k s . In other words, after BD with increasing shear stress, effective y s / k s also increases.
Zanke [13,14,15] basically found the same and recommends the use of Equation (31) with
y s d = 1 + s b d ( 1 p ) .
to determine the position of the upper edge of bed-load layer and thus the magnitude of u s , m a x . In Zanke [13,19], y s was calculated based on s b at rest. Against the background of the above mentioned results of Sumer et al. ([30], Section 2.6.4), s b , r e a l 6 s b (Equation (19)) and thus
y s d = 1 + 6 s b d .
From Equation (16) results s b d = R ( τ 🟉 R τ c 🟉 ) η tan φ and thus
y s d = 1 + 6 R ( τ 🟉 R τ c 🟉 ) η tan φ d .
This introduced in Equation (27) yields
v s v 🟉 = 2.5 l n 1 + 6 R ( τ 🟉 R τ c 🟉 ) η tan φ d + 8.5 hydraulically rough only
or with Equation (28)
v s v 🟉 = 2.5 l n 1 + 6 R ( τ 🟉 R τ c 🟉 ) η tan φ d + B smooth , transitional and rough .
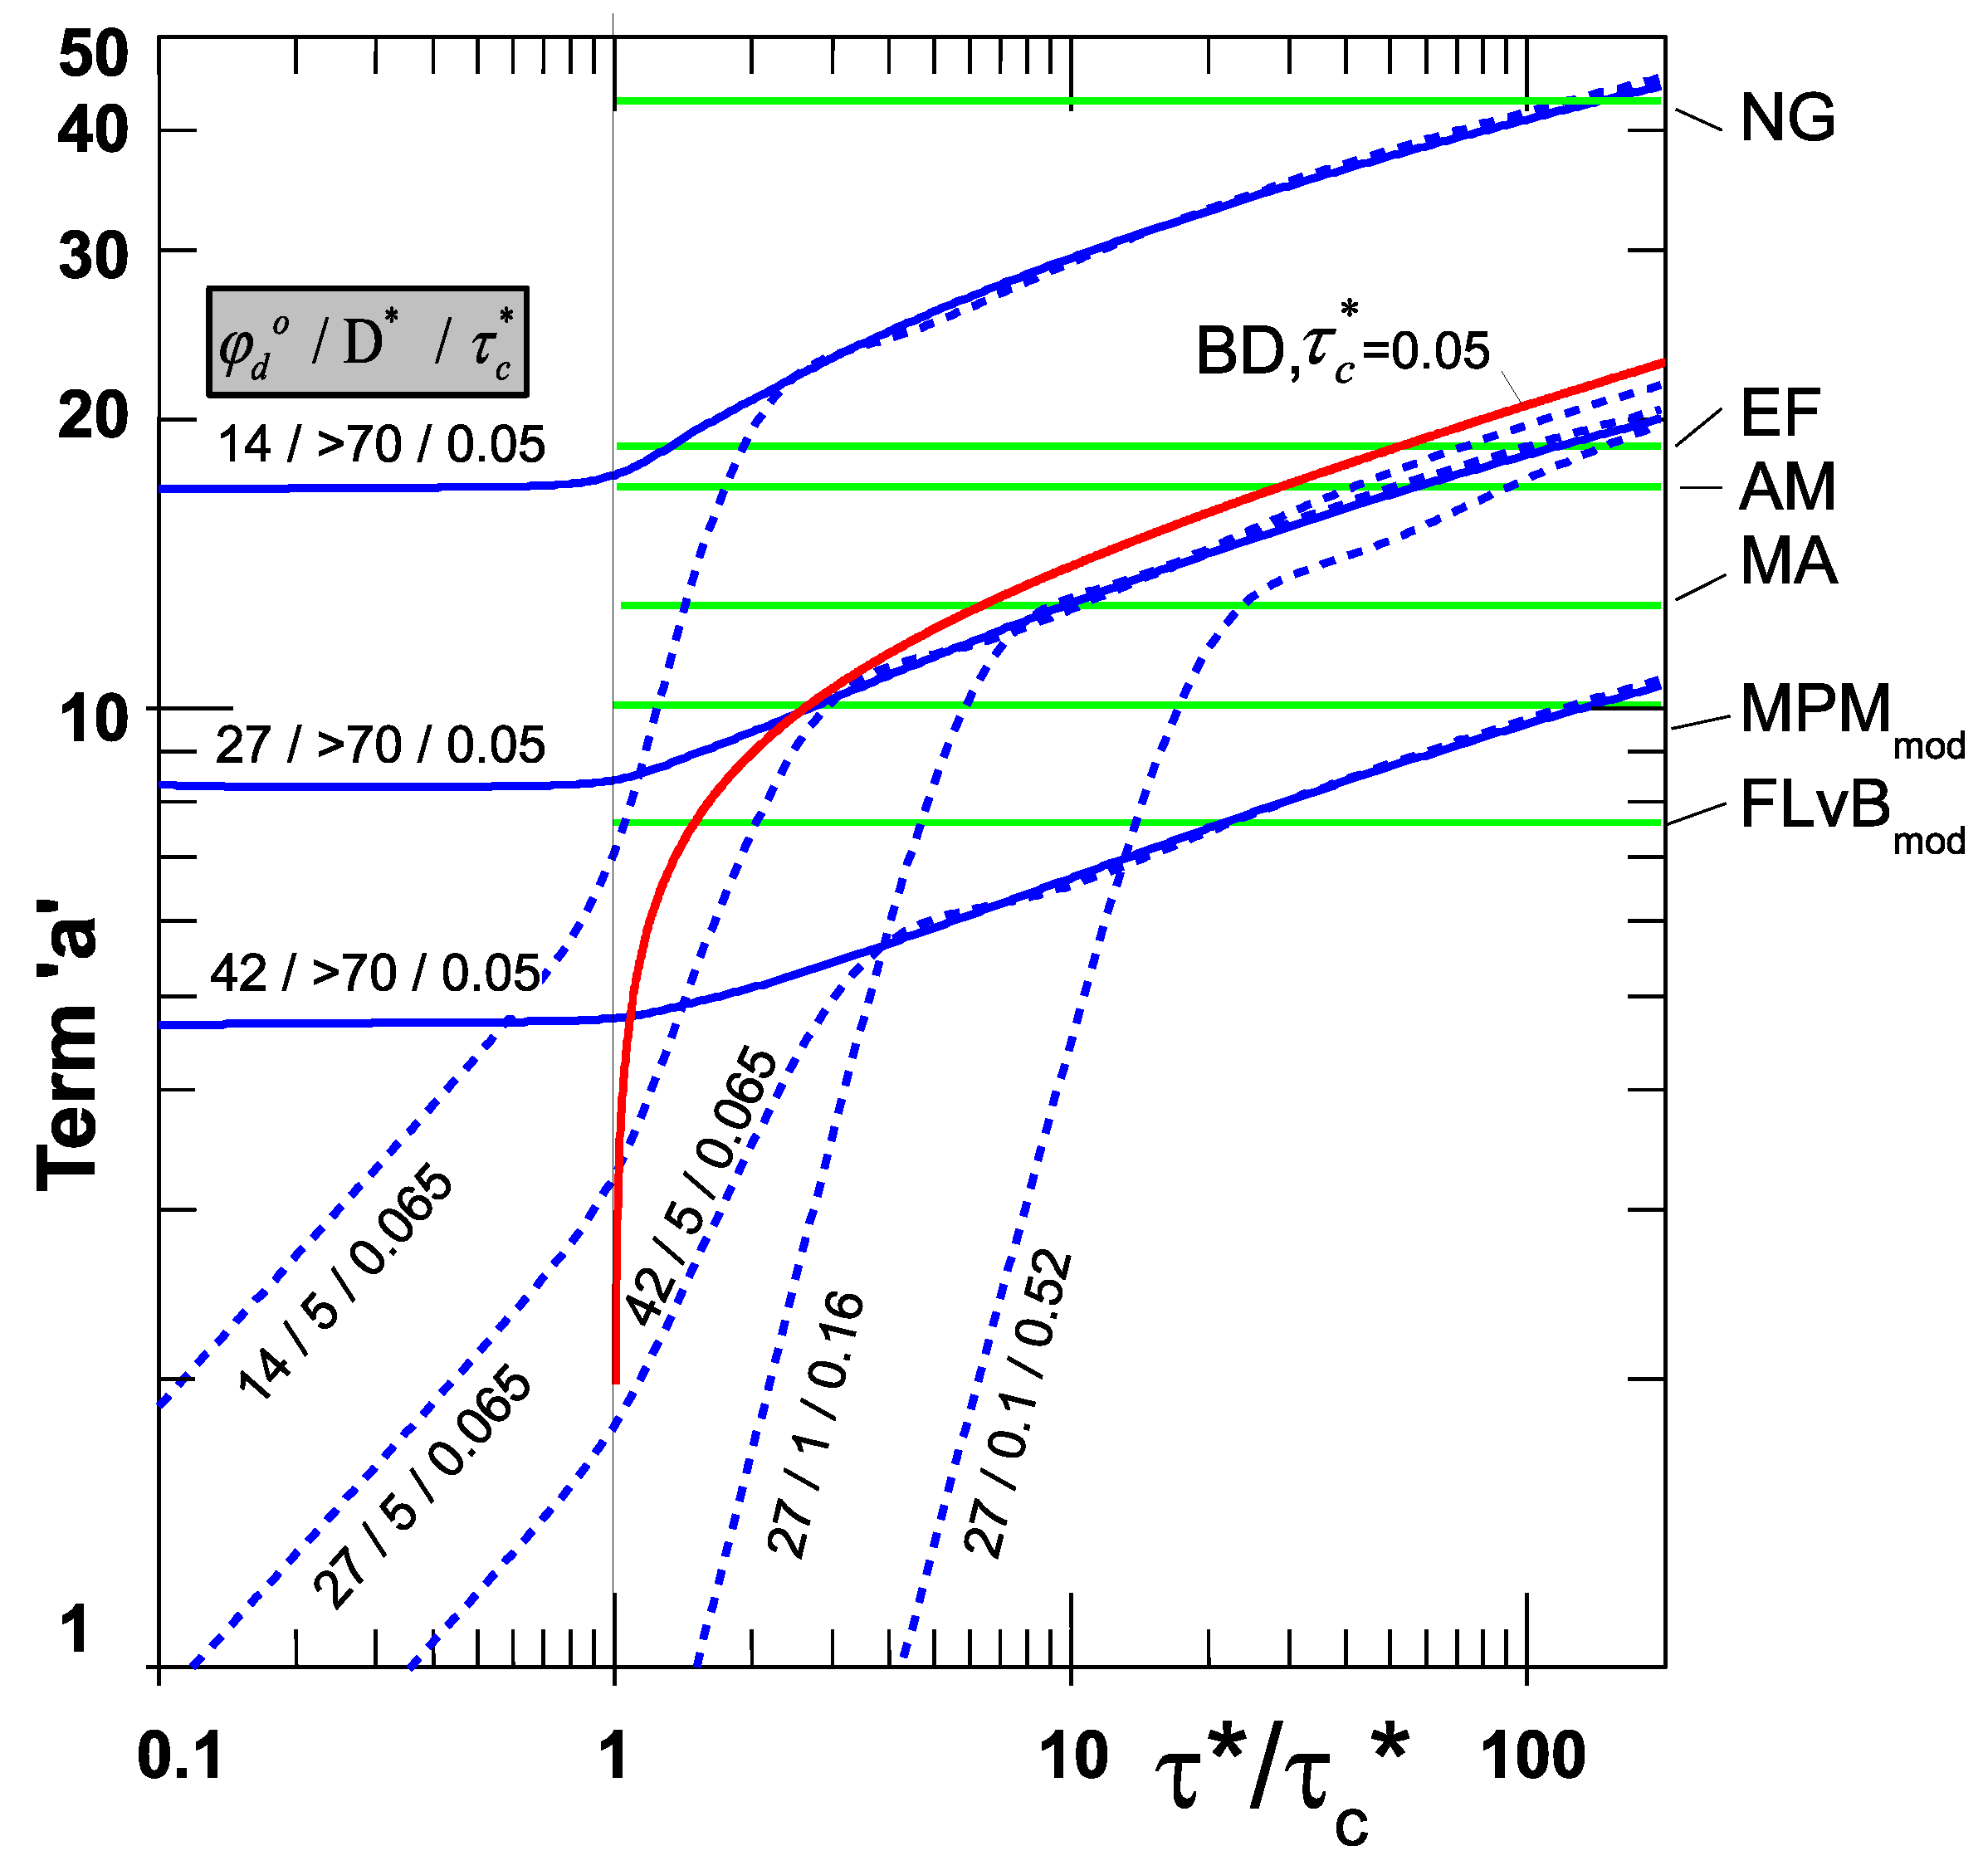
With respect to the effect of shear stress, Equations (36) and (37) show a basic similarity to Bridge and Dominic’s Equation (5). In both approaches v s / v 🟉 is a function of τ 🟉 and τ c 🟉 . When BD’s Equation (5) is modified using the fact that in its original form (red curve in Figure 6) it fits Zanke’s solution for φ d = 25 , it can be rewritten as a = v s / v 🟉 tan φ d 8 tan φ d τ 🟉 τ c 🟉 0.271 . In this notation and under the restriction of τ 🟉 / τ c 🟉 3 , it coincides fairly well with any of the full blue curves which are based on Equation (38) which combines Equation (31) with Equation (35):
v s v 🟉 = R e * 1 + 6 R ( τ 🟉 R τ c 🟉 ) η tan φ d 2 + P y t 2.5 l n 1 + 6 R ( τ 🟉 R τ c 🟉 ) η tan φ d + B 2 1 / 2 .
This consonance is a strong indication for the course of term ‘a’, as shown in Figure 6 when τ 🟉 3 . This way, besides tan φ d , a is a function of only τ 🟉 in hydraulically rough case. In non-hydraulical rough case, also R e 🟉 plays a role.
Figure 6 demonstrates the magnitude and variability of Term ‘a’. As can bee seen, a ranges between approximately 2 and 40 in hydraulically rough flows. According to Equations (31) and (38) (blue lines), a = f ( φ d , D 🟉 , τ c 🟉 ) . Note that instead of D 🟉 also ( R e * 2 / τ 🟉 ) 1 / 3 can be replaced. Under non hydraulically rough conditions, a decreases rapidly (dashed lines in Figure 6).
From Figure 6 also can be taken that formulas with constant a-values are of limited validity (green curves).

3.2.5. Differences with Respect to Slip Factor ‘b’ in Expressions for Bed-Load Velocity, u s , m

The term τ 🟉 b τ c 🟉 describes the transport velocity of the bed-load layer. The slip factor b is specified differently (Table 3). Ashida and Michiue and Lajeunesse et al. assume b = 1 as did Bagnold [41]. In EF, MA, FD, ZMC, NG and PSS, ZA99, according to Fernandez Luque [5,6], b = 0.7 is specified. Based on considerations of the friction angles of the sediment, Bridge and Hanes [16] and Bridge and Bennet [42] suggest b = tan φ d / tan φ o . Later, Duran et al. [25] analytically arrived at b = tan φ d / tan φ o . This solution is adopted here in Equations (20) and (21). However, the choice of the value of b makes a gradual but not a general difference between the results of the listed formulas (except in case of weak transport). In practice, for sediment at rest, only tan φ o exists while in moving sediment, tan φ d < tan φ o is effective and thus b < 1 . From the standpoint of physics, in the case of bed-load must b < 1 generally be.

4. Bandwidth of Results of Bed-Load Formulas

In nature, hydraulic conditions differ as also the properties of sediment do. This results in a range of transport rates when plotted as a function of τ * or τ * / τ c * . This range was estimated based on Equations (3a) and (3b), expressed by Equations (20) and (21). The same would result from the formula of Duran et al. [25] when the risk of initial sediment motion is regarded.
In detail, a parameter variation study of v s / v * , tan φ o , tan φ d (and hence the coefficients ‘a’ and ‘b’ of Equations (3a) and (3b) and τ c * was carried out. The sediment characteristics have been varied in the range of 28 < φ o < 48 for static friction angles in combination with 0.5 φ o < φ d < 0.9 φ o for dynamic friction angles. The results are plotted on Figure 7.
In addition to the transport functions discussed here, Figure 7 shows the curves according to the approaches of v.Rijn [43], Parker [44], Soulsby [45], Wong [46], Cheng & Chen [47] and Li, Sun & Lin [3].
In case of hydraulically rough conditions, the blue area represents the range of q b 🟉 affected by the variation of friction angles φ . Limits of this area belong to (a) low φ o and significantly lower φ d (curve for φ o = 35 and φ o = 16 . 7 , as in Nino and Garcia [35]) and (b) high φ o and φ d close to φ o , curve for φ o = 48 and φ d = 46 ( φ d = 46 mentioned in Sekine and Kikkawa [48]).
Additionally, the outer hatched area characterizes the effect of viscous effects in case of hydraulical not fully rough flow conditions. In order to investigate those effects, R e 🟉 was varied in the range 1 < R e 🟉 < 100. Then v s / v * as well as τ c 🟉 are variable. Note that a variation of R e 🟉 is somehow equivalent to a variation of the dimensionless grain size as D 🟉 = ( R e * 2 / τ 🟉 ) 1 / 3 .
The resulting bandwidth demonstrates how friction angles, which are a specific property of individual sediments, can be of greater influence on the calculated transport rates.
In Figure 7, additionally to the estimation of the bandwidth of transport rates due to the possible bandwidth of of sediment and flow characteristics, a set of 18 transport functions from the literature are added. (Due to their empirical nature, some of them are not included in the structural analysis as they cannot be transferred into the standardized structure of Equations (3a) and (3b)). The range of these transport formulas reflects the range of possible results of Equations (20) and (21). This means that the fixing of variables does not lead to wrong transport rates, but restricts the validity range of the respective formula to a specific sediment-flow case.

5. Results and Conclusions

This paper compares 13 bed-load formulae by writing them in a standardized notation that allows an in-depth analysis of the different properties of these equations. All of these formulas have more or less an analytical background and are correct in their dimensions.
A central result is that all 13 formulas are in principle the same formula, but with different simplifications. Depending on the type of simplification, the associated transport equations have a specifically limited validity. Table 4 gives a brief information on it.
It should be noted that the frequently used representation by only a single curve q b 🟉 = f ( τ 🟉 / τ c 🟉 ) is only possible for a given coefficient tan φ of internal friction and for R e * 70 , i.e., hydraulic rough conditions. In all other cases, different courses occur. The spectrum of these courses is shown by the colored and hatched areas on Figure 7.
If this possible range of transport rates is plotted against the spectrum of 18 transport functions (some empirical and probabilistic formulas are additionally included in this comparison), the effect of the simplifications mentioned above becomes clear.
Table 4 gives an overview of the application areas of the individual transport functions. All functions marked with (**) are fundamentally more complete and generally valid with regard to the influence of the friction angles and the hydraulic friction effect, if the fixed coefficients (*) ultimately proposed by the authors are disregarded (see also Table 2).
The results obtained show a considerable bandwidth for the prediction of bed-load transport rates using 18 empirical and semi-empirical transport functions. This is due to the fact that in different formulas essential influencing variables are simply set to fixed values in different ways.
Furthermore, the analysis leads to the conclusion that the angles of internal friction play an essential role in this respect. This effect has not been taken into account sufficiently so far, which might also be due to the fact that the friction angles, especially the dynamic angle, cannot be determined easily. Against this background it is recommended to pay more attention to the friction angles in questions of sediment movement in the future.

Author Contributions

U.Z.: Conceptualization, Methodology, Validation, Formal Analysis, Investigation, Writing—Original Draft Preparation, Writing—Review & Editing, A.R.: Conceptualization, Formal Analysis, Investigation and Writing—Review & Editing. All authors have read and agreed to the published version of the manuscript.

Funding

This research received no external funding.

Conflicts of Interest

The authors declare no conflict of interest.

Symbols

afactor, regarding effects on transport rate other than shear stress-
Bintegration constant of log. velocity profile-
dgrain diameterm
D * dimensionless grain diameter = ( ρ g / ν 2 ) 1 / 3 d = ( R e * 2 / τ 🟉 ) 1 / 3 -
gacceleration of gravitym/s2
hwater depthm
Ilongitidinal bed slope-
k s equivalent sand roughness height (here k s = d is taken)m
k s + = v 🟉 k s / ν = v 🟉 d / ν · k s / d -
Pprobability-
P y t probability of the flow to be turbulent at level y-
pporosity, relation between pore volume and total volume of a sediment
bulk, if unknown, estimate 30% … 36%-
q b bed-load transport rate (transported sediment volume withoutm3/m/s
pore volume), bulk transport rate = q b / ( 1 p )
q b 🟉 = q b / ρ g d 3 , dimensionless transport rate after EINSTEIN-
Rrisk or probability of grain motion. R 1 when τ / τ c 2 -
R e * = v 🟉 d / ν , particle Reynolds number-
s b = s b , e f f = effective (= net) thickness of moving bed-load layer,m
i.e., thickness without pores
s b , r e a l = s b , e f f / ( 1 p ) = real thickness of moving bed-load layer,m
i.e., thickness with pores
u s , m depth averaged sediment velocity of moving bed-load layerm/s
u s , m a x sediment velocity at top edge of moving bed-load layerm/s
v m depth averaged flow velocitym/s
v m , c depth averaged critical velocity for initiation of sediment motionm/s
v y flow velocity at level ym/s
v s flow velocity at a the upper edge of bed-load layer (Figure 1)m/s
v c critical velocity for initiation of sediment motionm/s
v 🟉 shear velocity = τ / ρ = τ 🟉 ρ g d m/s
v c 🟉 Shields critical shear velocitym/s
w s terminal settling velocitym/s
ydistance from the wallm
y s distance from the wall where v = v s m
α angle of longitudinal bed inclination (positive in direction of flow)
φ angle of repose = angle of internal friction of sediment
φ o angle of repose at rest
φ d angle of internal friction of sediment in motion
if unknown, estimate φ d 0.5 φ o
η factor regarding bed inclinations τ c , α = η τ c , α = 0 🟉 -
ν kinematic viscosity of fluidm2/s
ρ density of fluidkg/m3
ρ s density of sedimentkg/m3
ρ = ( ρ s ρ ) / ρ , relative density-
τ = τ o = ρ g h I , shear stress at the bedN/m2
τ 🟉 = τ / [ ( ρ s ρ ) g d ] = v * 2 / ( ρ g d ) , dimensionless shear stress-
τ c Shields dimensional critical shear stress at horizontal bed = τ c , α = 0 🟉 N/m2
τ c 🟉 dimensionless Shields critical shear stress at the bed-
τ c , α 🟉 Shields critical shear stress at a bed with inclination angle α -

References

  1. Einstein, H.A. The Bed-Load Function for Sediment Transportation in Open Channel Flows; U.S. Department of Agricultural Technology Bulletin: Washington, DC, USA, 1950; Volume 1950.
  2. Cheng, N.-S. Exponential Formula for Bed Load Transport. ASCE J. Hydraul. Eng. 2002, 128, 942–946. [Google Scholar] [CrossRef]
  3. Li, J.-D.; Sun, J.; Lin, B. Bed-Load transport rate based on the entrainment probabilities of sediment grains by rolling and lifting. Int. J. Sediment Res. 2018, 33, 126–136. [Google Scholar] [CrossRef] [Green Version]
  4. Pähtz, T.; Duran, O. Unification of Aeolian and Fluvial Sediment Transport Rate from Granular Physics. Phys. Rev. Lett. 2020, 124, 168001. [Google Scholar] [CrossRef] [Green Version]
  5. Fernandez-Luque, R. Erosion and Transport of Bed-Load Sediment; Dissertation: Delft, The Netherlands, 1974; Volume 14, pp. 127–144. [Google Scholar]
  6. Fernandez-Luque, R.; van Beek, R. Erosion and Transport of Bed-Load Sediment. J. Hydraul. Res. 1976, 14, 127–144. [Google Scholar] [CrossRef] [Green Version]
  7. Meyer-Peter, E.; Mueller, R. Formulas for Bed-Load Transport; IAHR: Stockholm, Sweden, 1948. [Google Scholar]
  8. Meyer-Peter, E.; Mueller, R. Eine Formel zur Berechnung des Geschiebetriebes; Schweizer Bauzeitung: Zürich, Switzerland, 1949; Volume 67. (In German) [Google Scholar]
  9. Hunziker, R. Fraktionsweiser Geschiebetransport. Ph.D. Thesis, Versuchsanst. f. Wasserbau der ETH Zuerich (VAW), Zuerich, Switzerland, 1995. (In German). [Google Scholar]
  10. Seminara, G.; Solari, L.; Parker, G. Bed load at low Shields stress on arbitralily sloping beds: Failure on the Bagnold hypothesis. Water Resour. Res. 2002, 38, 31-1–31-6. [Google Scholar] [CrossRef] [Green Version]
  11. Engelund, F.; Fredsoe, J. A sediment trensport model for straight alluvial channels. Hydrol. Res. 1976, 7, 294–298. [Google Scholar] [CrossRef] [Green Version]
  12. Zhang, X.; McConnachie, G.L. A reappraisal of the Engelund bed load equation. Hydrol. Sci. 1994, 39, 561–567. [Google Scholar] [CrossRef]
  13. Zanke, U. Zur Physik von Stromungsgetriebenem Sediment (On the Physics of Flow Driven Sediments); Mitt. des Instituts für Wasserbau und Wasserwirtschaft der TU Darmstadt, Heft 106; RWTH Publications: Aachen, Germany, 1999. [Google Scholar]
  14. Zanke, U. On the Physics of Flow Driven Sediments (Bed Load). Int. J. Sediment Res. 2001, 16, 1–18. [Google Scholar]
  15. Zanke, U. Vorlesungsskript ‘Sedimenttransport’ (Scriptum ‘Sediment Transport’); Institut fuer Wasserbau und Wasserwirtschaft der TU Darmstadt, RWTH Publications: Aachen, Germany, 2004; Unpublished work. [Google Scholar]
  16. Bridge, J.S.; Dominic, D.F. Bed Load Grain Velocities and Sediment Transport Rates. Water Resour. Res. 1984, 20, 476–490, Correction in 1985, 21, 775. [Google Scholar] [CrossRef]
  17. Zanke, U. Calculation of the Sink Rate of Sediments; Mitteilungen des Franzius-Instituts, Univ. Hannover, Heft 46; RWTH Publications: Aachen, Germany, 1977. (In German) [Google Scholar]
  18. Parker, G.; Seminara, G.; Solari, L. Bed load at low Shields stress on arbitralily sloping beds. Water Res. Res. 2003, 39, 1–11. [Google Scholar] [CrossRef] [Green Version]
  19. Zanke, U. On the Influence of Turbulence on the Initiation of Sediment Motion; Mitt. des Instituts für Wasserbau und Wasserwirtschaft der TU: Darmstadt, Germany, 2001. (In German) [Google Scholar]
  20. Zanke, U. The beginning of sediment movement as a probability problem. In Proceedings of the International Symposium on Sediment Transport Modeling, Sediment Commission, ASCE Hydraulics Division, New Orleans, LA, USA, 4–18 August 1989. [Google Scholar]
  21. Zanke, U. The Beginning of Sediment Motion as a Probability Problem; Wasser- und Boden, Mitteilungen des Franzius-Instituts, Univ. Hannover, Heft 1; RWTH Publications: Aachen, Germany, 1990. (In German) [Google Scholar]
  22. Luckner, T.; Zanke, U. An analytical solution for calculating the initiation of sediment motion. ASCE J. Hydraul. Eng. 2007, 22, 87–102. [Google Scholar]
  23. Grass, A.J. Initial instability of fine bed sand. J. Hydraul. Div. ASCE 1970, 96, 619–632. [Google Scholar]
  24. Shields, A. Application of Similarity Mechanics and Turbulence Research on Bed Load Movement; Mitt. der Preussischen Versuchsanstalt fuer Wasser-, Erd- und Schiffbau Heft, Volume 26; RWTH Publications: Aachen, Germany, 1936. (In German) [Google Scholar]
  25. Duran, A.; Andreotti, B.; Claudin, P. Numerical simulation of turbulent sediment transport, from bed load to saltation. Phys. Fluids 2012, 24, 103306. [Google Scholar] [CrossRef] [Green Version]
  26. Duran, A.; Andreotti, B.; Claudin, P. Numerical Simulations of Turbulent Sediment Transport; Marine and River Dune Dynamics-Marid IV: Bruges, Belgium, 2013. [Google Scholar]
  27. Hanes, D.M.; Inman, D.L. Experimental evaluation of a dynamic yield criterion for granular fluid flows. J. Geophys. Res. Solid Earth 1985, 90, 3670–3674. [Google Scholar] [CrossRef]
  28. Chiew, Y.-M.; Parker, G. Incipient sediment motion on non-horizontal slopes. IAHR J. Hydraul. Res. 1994, 32, 649–660. [Google Scholar] [CrossRef]
  29. Maurin, R.; Chauchat, J.; Frey, P. Revisiting Slope Influence in Turbulent Bedload Transport; Cambridge University Press: Cambridge, UK, 2018. [Google Scholar]
  30. Sumer, M.; Kozakievicz, A.; Fredsoe, J.; Deigaard, R. Velocity and concentration profiles in sheet flow layer of movable bed. J. Hydraul. Eng. 1996, 122, 549–558. [Google Scholar] [CrossRef]
  31. Wilson, K.C. Analysis of Bed-Load Motion at high Shear Stress Properties on Transport Dynamics, Dynamics of Gravel Bed Rivers. J. Hydraul. Eng. 1987, 113, 97–103. [Google Scholar] [CrossRef]
  32. Recking, A.; Liébault, F.; Peteuil, C.; Jolime, T. Testing bedload transport equations with consideration of time scales. Earth Surf. Process. Landf. 2012, 37, 774–789. [Google Scholar] [CrossRef]
  33. Lajeunesse, E.; Malverti, L.; Charru, F. Bed load transport in turbulent flow at the grain scale: Experiments and modeling. J. Geophys. Res. 2010, 115, 1–13. [Google Scholar] [CrossRef]
  34. Houssais, M.; Lajeunesse, E. Bed load transport of a bimodal sediment bed. J. Geophys. Res. 2012, 117. [Google Scholar] [CrossRef]
  35. Nino, Y.; Garcia, M. Using Lagrangian particle saltation observations for bedload sediment transport modelling. Hydrol. Process. 1998, 12, 1197–1218. [Google Scholar] [CrossRef]
  36. Simons, D.B. Theory and Design of Stable Channels; Colorado State University Dept. of Civil Engineering: Fort Collins, CO, USA, 1957. [Google Scholar]
  37. Madsen, O.S.; Grant, W.D. Mechanics of Cohesionless Sediment Transport in Coastal Waters; Coastal Sediments’91; ASCE: New York, NY, USA, 1991. [Google Scholar]
  38. Ashida, K.; Michiue, M. Study on Hydraulic Resistance and Bed Load Transport Rate in Alluvial Streams. Proc. Jpn. Soc. Civ. Eng. 1972, 1972, 206. (In Japanese) [Google Scholar] [CrossRef] [Green Version]
  39. Zanke, U. Zum Übergang Hydraulisch Glatt—Hydraulisch Rauh (On the Transition Hydraulically Smooth-Hydraulically Rough); Wasser und Boden, Heft 10; RWTH Publications: Aachen, Germany, 1996. (In German) [Google Scholar]
  40. Reichardt, H. Complete representation of the turbulent velocity distribution in smooth pipes. ZAMM 1951, 31, 208–219. (In German) [Google Scholar] [CrossRef]
  41. Bagnold, R.A. The nature of saltation and of bed load transport in water. Ser. A Proc. R. Soc. Lond. 1973, 332, 473–504. [Google Scholar]
  42. Bridge, J.S.; Bennet, S. A model for the entrainment and transport of sediment grains. Water Resour. Res. 1992, 28, 337–363. [Google Scholar] [CrossRef]
  43. van Rijn, L.C. Sediment Transport, Part I: Bed Load Transport. J. Hydraul. Eng. 1984, 110, 1431–1456. [Google Scholar] [CrossRef] [Green Version]
  44. Parker, G. Hydraulic geometry of active gravel rivers. ASCE J. Hydraul. Eng. 1979, 105, 1185–1201. [Google Scholar]
  45. Soulsby, R. Dynamics of Marine Sands; Thomas: Telford, UK, 1997. [Google Scholar]
  46. Wong, M. Does the bedload equation of Meyer-Peter & Müller fit its own data? In Proceedings of the 30th Congress IAHR, Thessaloniki, Greece, 24–29 August 2003; pp. 78–80. [Google Scholar]
  47. Cheng, N.-S.; Chen, X. Slope Correction for Calculation of Bedload Sediment Transport Rates in Steep Channels. ASCE J. Hydraul. Eng. 2014, 140, 04014018. [Google Scholar] [CrossRef]
  48. Sekine, M.; Kikkawa, H. Mechanics of saltating grains II. J. Hydraul. Eng. 1992, 118, 536–558. [Google Scholar] [CrossRef]
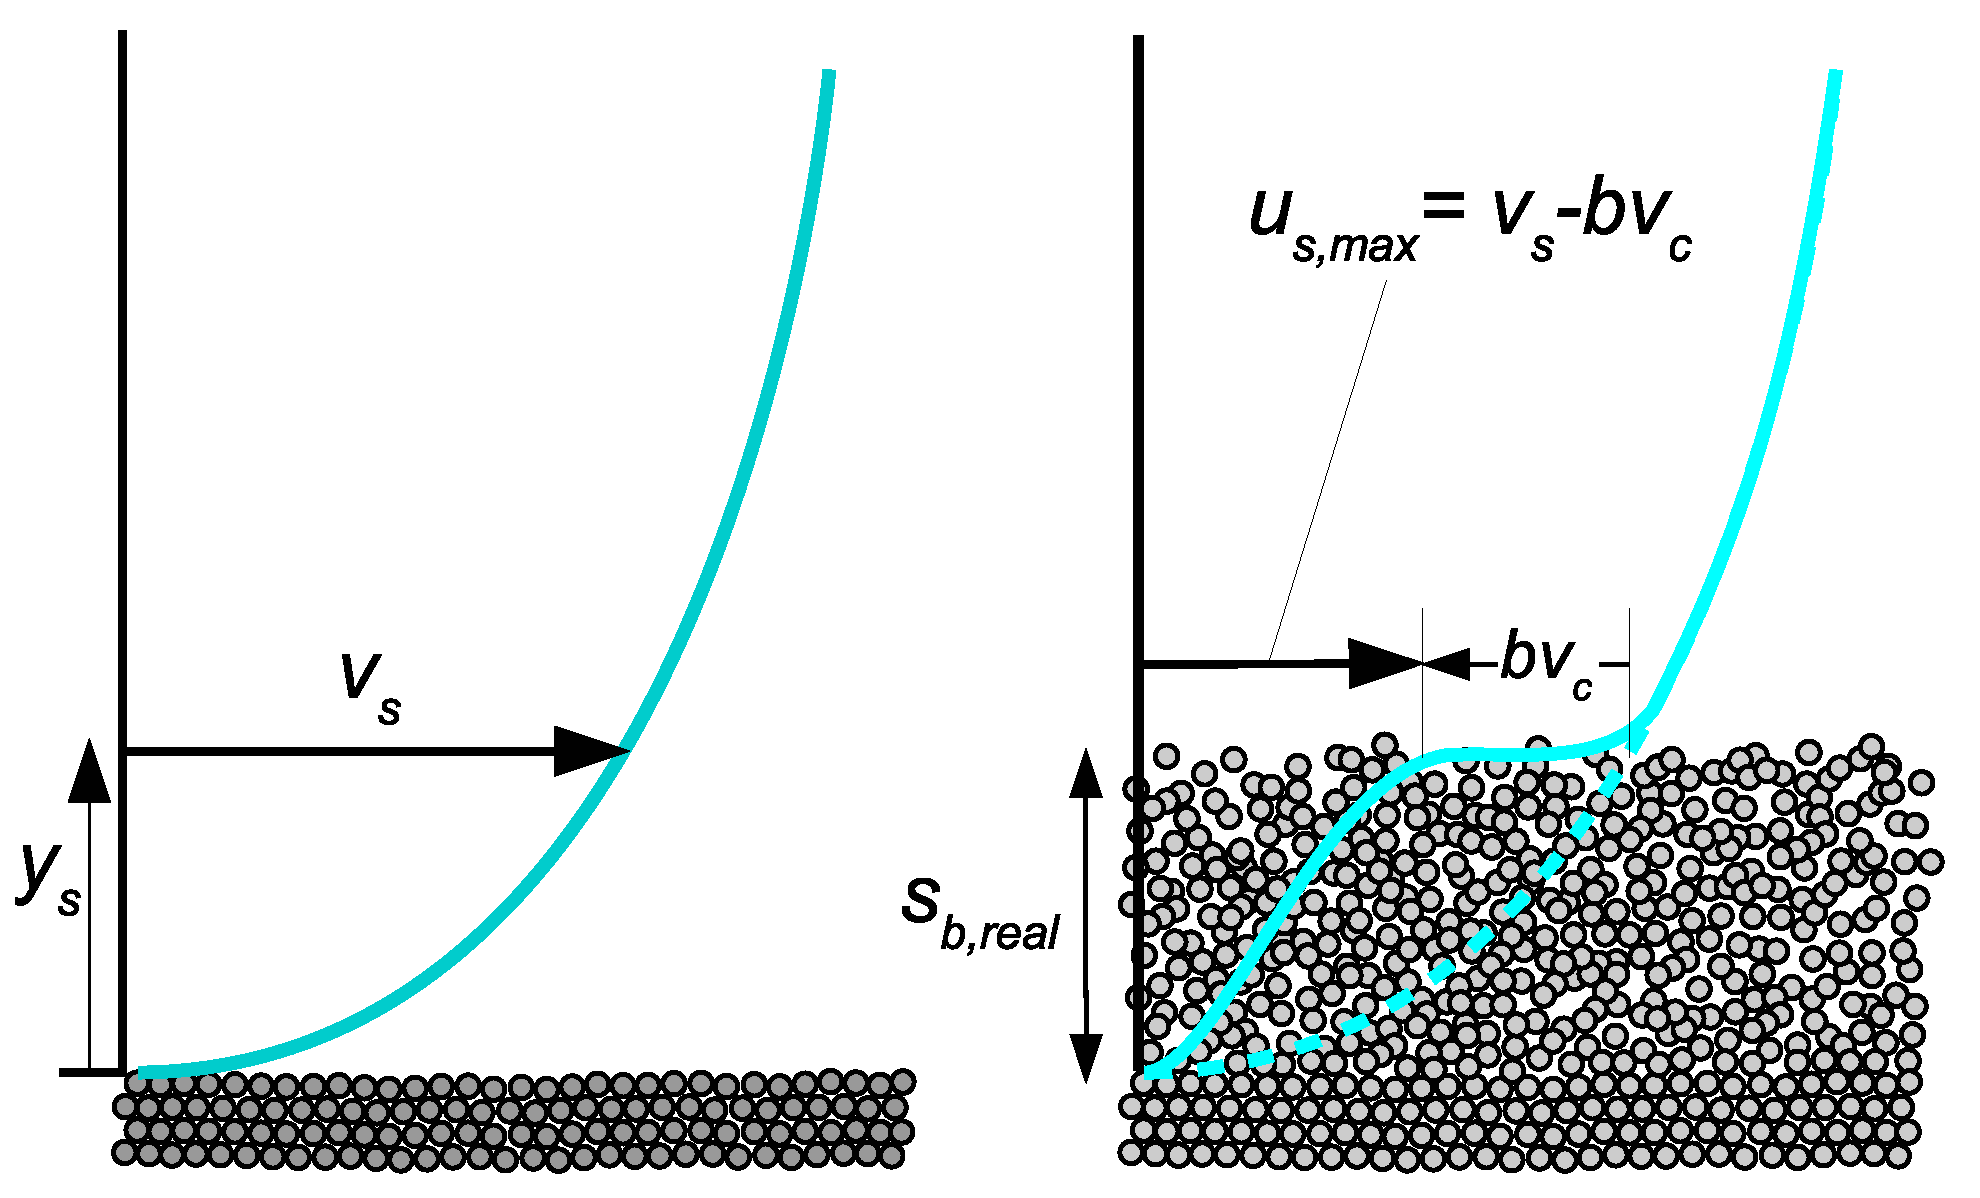
Figure 1. Velocity distribution near bed, schematically. (Left): fluid only; (Right): fluid and bed-load layer.
Geosciences 10 00368 g001
Figure 2. Bed-load layer thickness, balance of stresses (schematically).
Geosciences 10 00368 g002
Figure 3. Bed-load layer, real and effective thicknesses (schematically).
Geosciences 10 00368 g003
Figure 4. Estimation of static angle of repose, by curve fit. (Data from Simons [36]).
Geosciences 10 00368 g004
Figure 5. v y / v 🟉 at level y / k s as a function of R e y 🟉 . A = viscous sublayer Equation (30), B = Equation (27), C = Equation (28), D = Equation (31).
Geosciences 10 00368 g005
Figure 6. Terms ‘a’ of the different bed-load formulae. Full lines indicate hydraulically rough flow conditions, dashed lines stand for not hydraulically rough flow. Blue lines result from Equations (31) and (38) in combination with Equation (33). Red curve: Equation (5).
Geosciences 10 00368 g006
Figure 7. Bandwidth of Equations (20) and (21) due to different φ o and φ d : Blue area: hydraulically rough conditions (edges of the blue area are denoted by (a) and (b)). Dashed area: transitional and hydraulically smooth conditions.
Geosciences 10 00368 g007
Table 1. The 13 bed-load transport formulas with similar or identical structure.
q b 🟉 = a M P M τ 🟉 1.5 1 τ c 🟉 τ 🟉 1 τ c 🟉 τ 🟉 Meyer-Peter and Müller 1948/1949
q b 🟉 = a M P M , m τ 🟉 1.5 1 0.7 τ c 🟉 τ 🟉 1 τ c 🟉 τ 🟉 MPM mod.
q b 🟉 = a A M τ 🟉 1.5 1 1 , 0 τ c 🟉 τ 🟉 1 τ c 🟉 τ 🟉 Ashida and Michiue 1972
q b 🟉 = a F L B m τ 🟉 1.5 1 0.7 τ c 🟉 τ 🟉 1 τ c 🟉 τ 🟉 Fernandez-Luque and v. Beek mod. 1976
q b 🟉 = a E F τ 🟉 1.5 1 0.7 τ c 🟉 τ 🟉 1 τ c 🟉 τ 🟉 Engelund and Fredsoe 1976
q b 🟉 = a B D , B D H τ 🟉 1.5 1 tan φ d tan φ 0 τ c 🟉 τ 🟉 1 τ c 🟉 τ 🟉 Bridge/Dominic 1984, Bridge/Hanes 85
q b 🟉 = a M A τ 🟉 1.5 1 0.7 τ c 🟉 τ 🟉 1 τ c 🟉 τ 🟉 Madsen 1991
q b 🟉 = a F D τ 🟉 1.5 1 0.7 τ c 🟉 τ 🟉 1 τ c 🟉 τ 🟉 Fredsoe and Deigaard 1992
q b 🟉 = a Z M C τ 🟉 1.5 1 0.7 τ c 🟉 τ 🟉 1 τ c 🟉 τ 🟉 Zhang and McConnachie 1994
q b 🟉 = a N G τ 🟉 1.5 1 0.7 τ c 🟉 τ 🟉 1 τ c 🟉 τ 🟉 Nino and Garcia 1998
q b 🟉 = a Z A 99 τ 🟉 1.5 1 0.7 τ c 🟉 τ 🟉 1 τ c 🟉 τ 🟉 Zanke 1999/2001
q b 🟉 = a P S S τ 🟉 1.5 1 0.7 τ c 🟉 τ 🟉 1 τ c 🟉 τ 🟉 Parker, Seminarai and Solari 2002
q b 🟉 = a L M C τ 🟉 1.5 1 0.89 τ c 🟉 τ 🟉 1 τ c 🟉 τ 🟉 Lajeunesse, Malverti and Charru 2010
q b 🟉 = a D A C τ 🟉 1.5 1 tan φ d tan φ 0 τ c 🟉 τ 🟉 1 τ c 🟉 τ 🟉 Duran, Andreotti and Claudin 2012
q b 🟉 = a Z A ( R τ 🟉 ) 1.5 1 tan φ d tan φ 0 R τ c 🟉 τ 🟉 1 R τ c 🟉 τ 🟉 Zanke 2020
Table 2. Terms ‘a’ of Equations (3a) and (3b).
a M P M = 8 τ c 🟉 = 0.047 and τ = τ considered, or a M P M = 5 with τ c 🟉 = 0.0495 and τ fully considered
a M P M , m o d = 1.28 a M P M
a A M = v s / v 🟉 tan φ d recommended by the authors: a A M = 17
a F L B , m o d = 7.59
a E F = 9.3 tan φ d for sand, after EF is φ d = 27 o from which results a E F = 18.74
a B D / B H = v s / v 🟉 tan φ d approach BD: v s / v 🟉 tan φ d 17.57 v 🟉 v c 🟉 w s 0.271
a M A = 8 tan φ d 8 0.63 12.8 for sliding grains; 9.5 for saltating grains
a F D = 9.55
a Z M C = 9.3 tan φ d
a N G = 12 tan φ d recommended by NG: a N G 43
a Z A 99 = 1 2 v s / v 🟉 η tan φ d η = sin ( φ α ) sin φ     α = bed inclination angle
a P S S = 11.5 · 0.2 tan φ d = 7.67 tan φ d = 0.3
a L M C = 10.6(Houssais & Lajeunesse2012: a L M C = 56.6 ρ / ρ s )
a D A C = v s / v 🟉 tan φ d
a Z a 20 = 1 2 v s / v 🟉 η tan φ d · R 1.5 R = risk of initial sediment motion
Table 3. Terms ‘b’ of Equations (3a) and (3b).
Term ‘b’Author
1MPM, AM, LMC
0.7 MPM m o d , FLB, EF, MA, FD, NG, PSS, ZMC, ZA99
tan φ d tan φ o BDH
tan φ d tan φ o DAC, ZA20
Table 4. Application limits. (*) = coefficients as proposed by the author(s), (**) = as derived by the author(s), but proposed coefficients neglected.
Author(s)Hydraulic ConditionsSedimentEffective
RoughTransition and SmoothGrain SizeShear Stress
Meyer-Peter and MuellerMPM+> 1 2 mm 1.5 τ c 🟉
Ashida and MichiueAM (*)+>1 … 2 mm 1.5 τ c 🟉
Ashida and MichiueAM (**)++any, cohesion free 1.5 τ c 🟉
Fernandez-Luque and v.BeekFLB+>1 … 2 mm 1.5 τ c 🟉
Engelund and FredsoeEF+>1 … 2 mm 1.5 τ c 🟉
Bridge and Dominic/HanesBD, BDH (*)+>1 … 2 mm 1.5 τ c 🟉
Bridge and Dominic HanesBD, BDH (**)++any, cohesion free 1.5 τ c 🟉
MadsenMA+>1 … 2 mm 1.5 τ c 🟉
Fredsoe and DeigaardFD+>1 … 2 mm 1.5 τ c 🟉
Zhang and McConnachieZMC+>1 … 2 mm 1.5 τ c 🟉
Nino and GarciaNG+>1 … 2 mm 1.5 τ c 🟉
Zanke 1999ZA99++any, cohesion free 1.5 τ c 🟉
Parker, Seminara and SolariPSS (*)+>1 … 2 mm 1.5 τ c 🟉
Parker, Seminara and SolariPSS (**)++any, cohesion free 1.5 τ c 🟉
Lajeunesse, Malverti and CharruLMC+>1 … 2 mm 1.5 τ c 🟉
Duran, Andreotti and ClaudinDAC++any, cohesion free 1.5 τ c 🟉
ZankeZA++any, cohesion freeno limitation