1. Introduction
Lithodynamic processes at the land–sea interface result in different morphologies of the coastal zone, dominated by elevated cliff sections or coastal dunes. These forms may reflect the history of development of the coastal zone, where swash hydrodynamics steer the intensity of erosion and accumulation processes [
1,
2]. The spatial and temporal changes with the coastal sediment budget are usually related to increased cliff and beach erosion and redeposition of sedimentary material [
3]. Undercut dunes or cliffs, with visible signs of mass movement, point to domination of erosion and marine ingression, whereas the development of dune ridges on sandy spits, as well as dunes at the forefront of temporarily inactive cliff shores, is indicative of equilibrium or even accumulation occurring in the coastal zone [
4,
5,
6]. However, the swash-dominated gravel beaches are scarcely mentioned in sediment transport studies, or related to morpholithodynamics [
2,
7,
8,
9,
10,
11].
Gravel beaches are accumulations of shore material formed into distinctive shapes by waves and currents, and contain lithic particles in the gravel size range (2–64 mm). The beach form is a generally seaward-sloping boundary between a water body and mobile sediment, and a flat or landward-sloping surface at the upper limit of the beach. One or more gravel ridges may exist in the subaerial profile. Natural beaches composed of coarse material are common especially in the high latitudes, where coastal sediments indicate glacial transport history and reworking processes. Gravelly beaches also occur in other geographical latitudes, being associated with eroded cliff sections in the backshore and formation of a nearshore sedimentary bench of glacial or postglacial origin [
12].
Mixed sand and gravel beaches are often partially composed of coarse material (>2 mm), with supplementary fine fractions, which are the main products of fluvial, glacial, or erosive processes. Gravel beaches are especially important for coastal dynamics, with protection provided by a natural system of shoreline stabilization where its response to sea-level forcing is distinctive and can be preserved, even in the long-term geological record [
13].
Distinctive sedimentary features of mixed sand and gravel beaches include (i) a greater amount of coarse sand fraction and relatively high content of fine gravel fraction; (ii) the existence of multimodality within the gravel fraction; (iii) very limited shape sorting; and (iv) high spatial and temporal variability. The beach profile responses occur over semidiurnal, spring-neap, and seasonal time scales [
14,
15]. The coarse–fine grain sorting processes are usually related to longshore movement of sedimentary material in the swash zone, especially during storms [
2,
16,
17,
18,
19].
Saltation, traction bedload, and sheet flow dominate the nearshore of gravel beaches. The individual clast motion of coarse grains is dictated by a number of micromechanical factors attributable to size and shape variation occurring over a heterogeneous bed. Transport mode affects sediment sorting and morphodynamic feedbacks. Gravels are relatively large, compared to the sandy fraction, so they account for a greater proportion of the sediment volume in the swash zone. Therefore, sheet flow is likely to be most important in gravel beach dynamics, especially when developed as a fluid-thin backwash [
2,
20].
The different cross-shore size–shape zonation of gravel pebbles, compared to sand, exists on gravel beaches and was postulated by numerous authors, e.g., [
21,
22,
23]. The discoidal and spheroidal particles usually show a tendency to be transported upslope, acting like a hydrodynamic “wing”. The spherical and spindle gravels are usually transported downslope [
22,
24,
25,
26]. Additionally, the flattened particles are prone to longshore sediment transport. However, in some cases it is not clear whether sorting by size and shape, are achieved by these two mechanisms, or what aspects of anisotropy are important (e.g., “shape” or sphericity, aspect ratio, and elongation, and the axially less dominant third dimension, or
c-axis, which may produce different responses to flow, either individually or as part of mixed beds) [
27,
28]. The longshore transport of particles cause colliding and rubbing, which may produce different shapes of pebbles that may be used as an indicator of erosion processes [
29]. Irregular particles generally indicate a high potential for mechanical reworking, whereas rounded particles are a direct manifestation of the erosion that has occurred. These processes are partially related to lithological variability and textural features of different types of rocks. Soft rocks (limestones, marbles, shales or sandstones) are definitely less resistant, compared to magmatic or metamorphic components of gravel beaches [
30]. Coarse sediments may be directly related to changes in lithodynamics, sediment redistribution pathways, or intense material transport. Heavy gravels are less sensitive to wave and wind dynamics, and are applicable for estimating relative changes in sediment transport rates.
Lithological responses to erosion are established in particle size, roundness, sphericity, flatness, and asymmetry. Pebble roundness, flatness, and rate of mechanical destruction depend on wave intensity, initial rock types, and nature of the coast (sheltered or exposed). The intensity of erosion is established by particle morphology, mainly their roundness and flatness. Thus, a greater intensity of erosion is indicated by larger roundness and flatness indices [
29,
30]. The variability of gravel pebbles may show a different transport pattern under low energy conditions. Spherical grains, resulting from their capability to roll over in the swash zone, usually cover longer distances and indicate more dynamic conditions, when compared to discoidal grains [
19]. Compared to sandy beaches, gravel beach sediments are usually spatially differentiated in terms of size and shape to a greater degree, affecting more obvious textural zonation, mainly in the form of mixtures of relatively fine and coarse fractions [
21,
24]. The step, cusp horns, strands, and berms are composed of larger grains compared with the foreshore, although a number of levels of textural zonation may be discernible as sediments are continuously redistributed [
2,
24].
Studies on geodynamic processes and lithodynamics of the coastal zone are essential in different branches of the economy (e.g., fisheries, tourism) and in maritime spatial planning [
24,
31,
32,
33,
34]. Increased coastal erosion resulting from a sediment deficit, related to a reduction of river input, dredging processes, and coastal embankments, affects the formation of narrow beaches composed of relatively coarse sedimentary components. Gravel beaches usually form due to erosion of indurated cliff coasts, built mainly of moraine tills with small amounts of loose sediments. Increased volumes of beach rocks exposed due to the coastal erosion can effectively protect sensitive parts of the seacoast; however, during high sea level stands caused by wave storms, water can flow through gaps in coarse material, thereby increasing water saturation and slope instability [
3,
35].
Recently, erosion has been dominant along nearly the full length of southern Baltic coast. Erosion rates are highly variable and accompanied by simultaneous accumulation processes, either generating or rebuilding accumulative forms. The spatial and temporal distribution of these forms has varied significantly during the last 100 years, related mainly to increases in mean sea level and anthropogenic activity, which affected the intensity and varied the redistribution patterns of sedimentary material. The present rapid rate of dune and cliff erosion is an indirect proof of insufficiency of these sediment resources [
36].
Frequent wave storms are the main cause of coast erosion in the southern Baltic. The foreshore in the study area is shallow, with the 10 m isobath located more than one kilometer from the shoreline. The source of redeposited sedimentary material is related to eroded sections of cliff and dune coast; however, the geologic framework of the shallow foreshore also contributes to the total balance of pebble load. During the elevated sea level stands and wave storms, thin layers of sands and gravels developed on moraine tills are mixed, crushed, and redistributed towards the shoreline, and incorporated with the sands and gravels eroded from the cliff sections [
1,
37].
The Baltic nearshore in the study area is frequently covered by Holocene sands constituting the in-shore bedload [
38,
39,
40]. The Pleistocene series is lithologically more variable compared to the Holocene sands, and composed of moraine tills, glaciofluvial sands, muds, clays, and organic sediments (mainly peats). Sediments are often laminated and lie in the form of beds or lenses. In some cases, water-bearing horizons are present and promote mass displacements or cliff degradation. Residuals of beach pebbles reflect regional differentiation of glacial tills from which they originate [
38]. For example, a greater content of limestone among the other petrographic components of beach gravels located east of Pogorzelica indicates erosion of the bench and morainic material redeposition towards the shore.
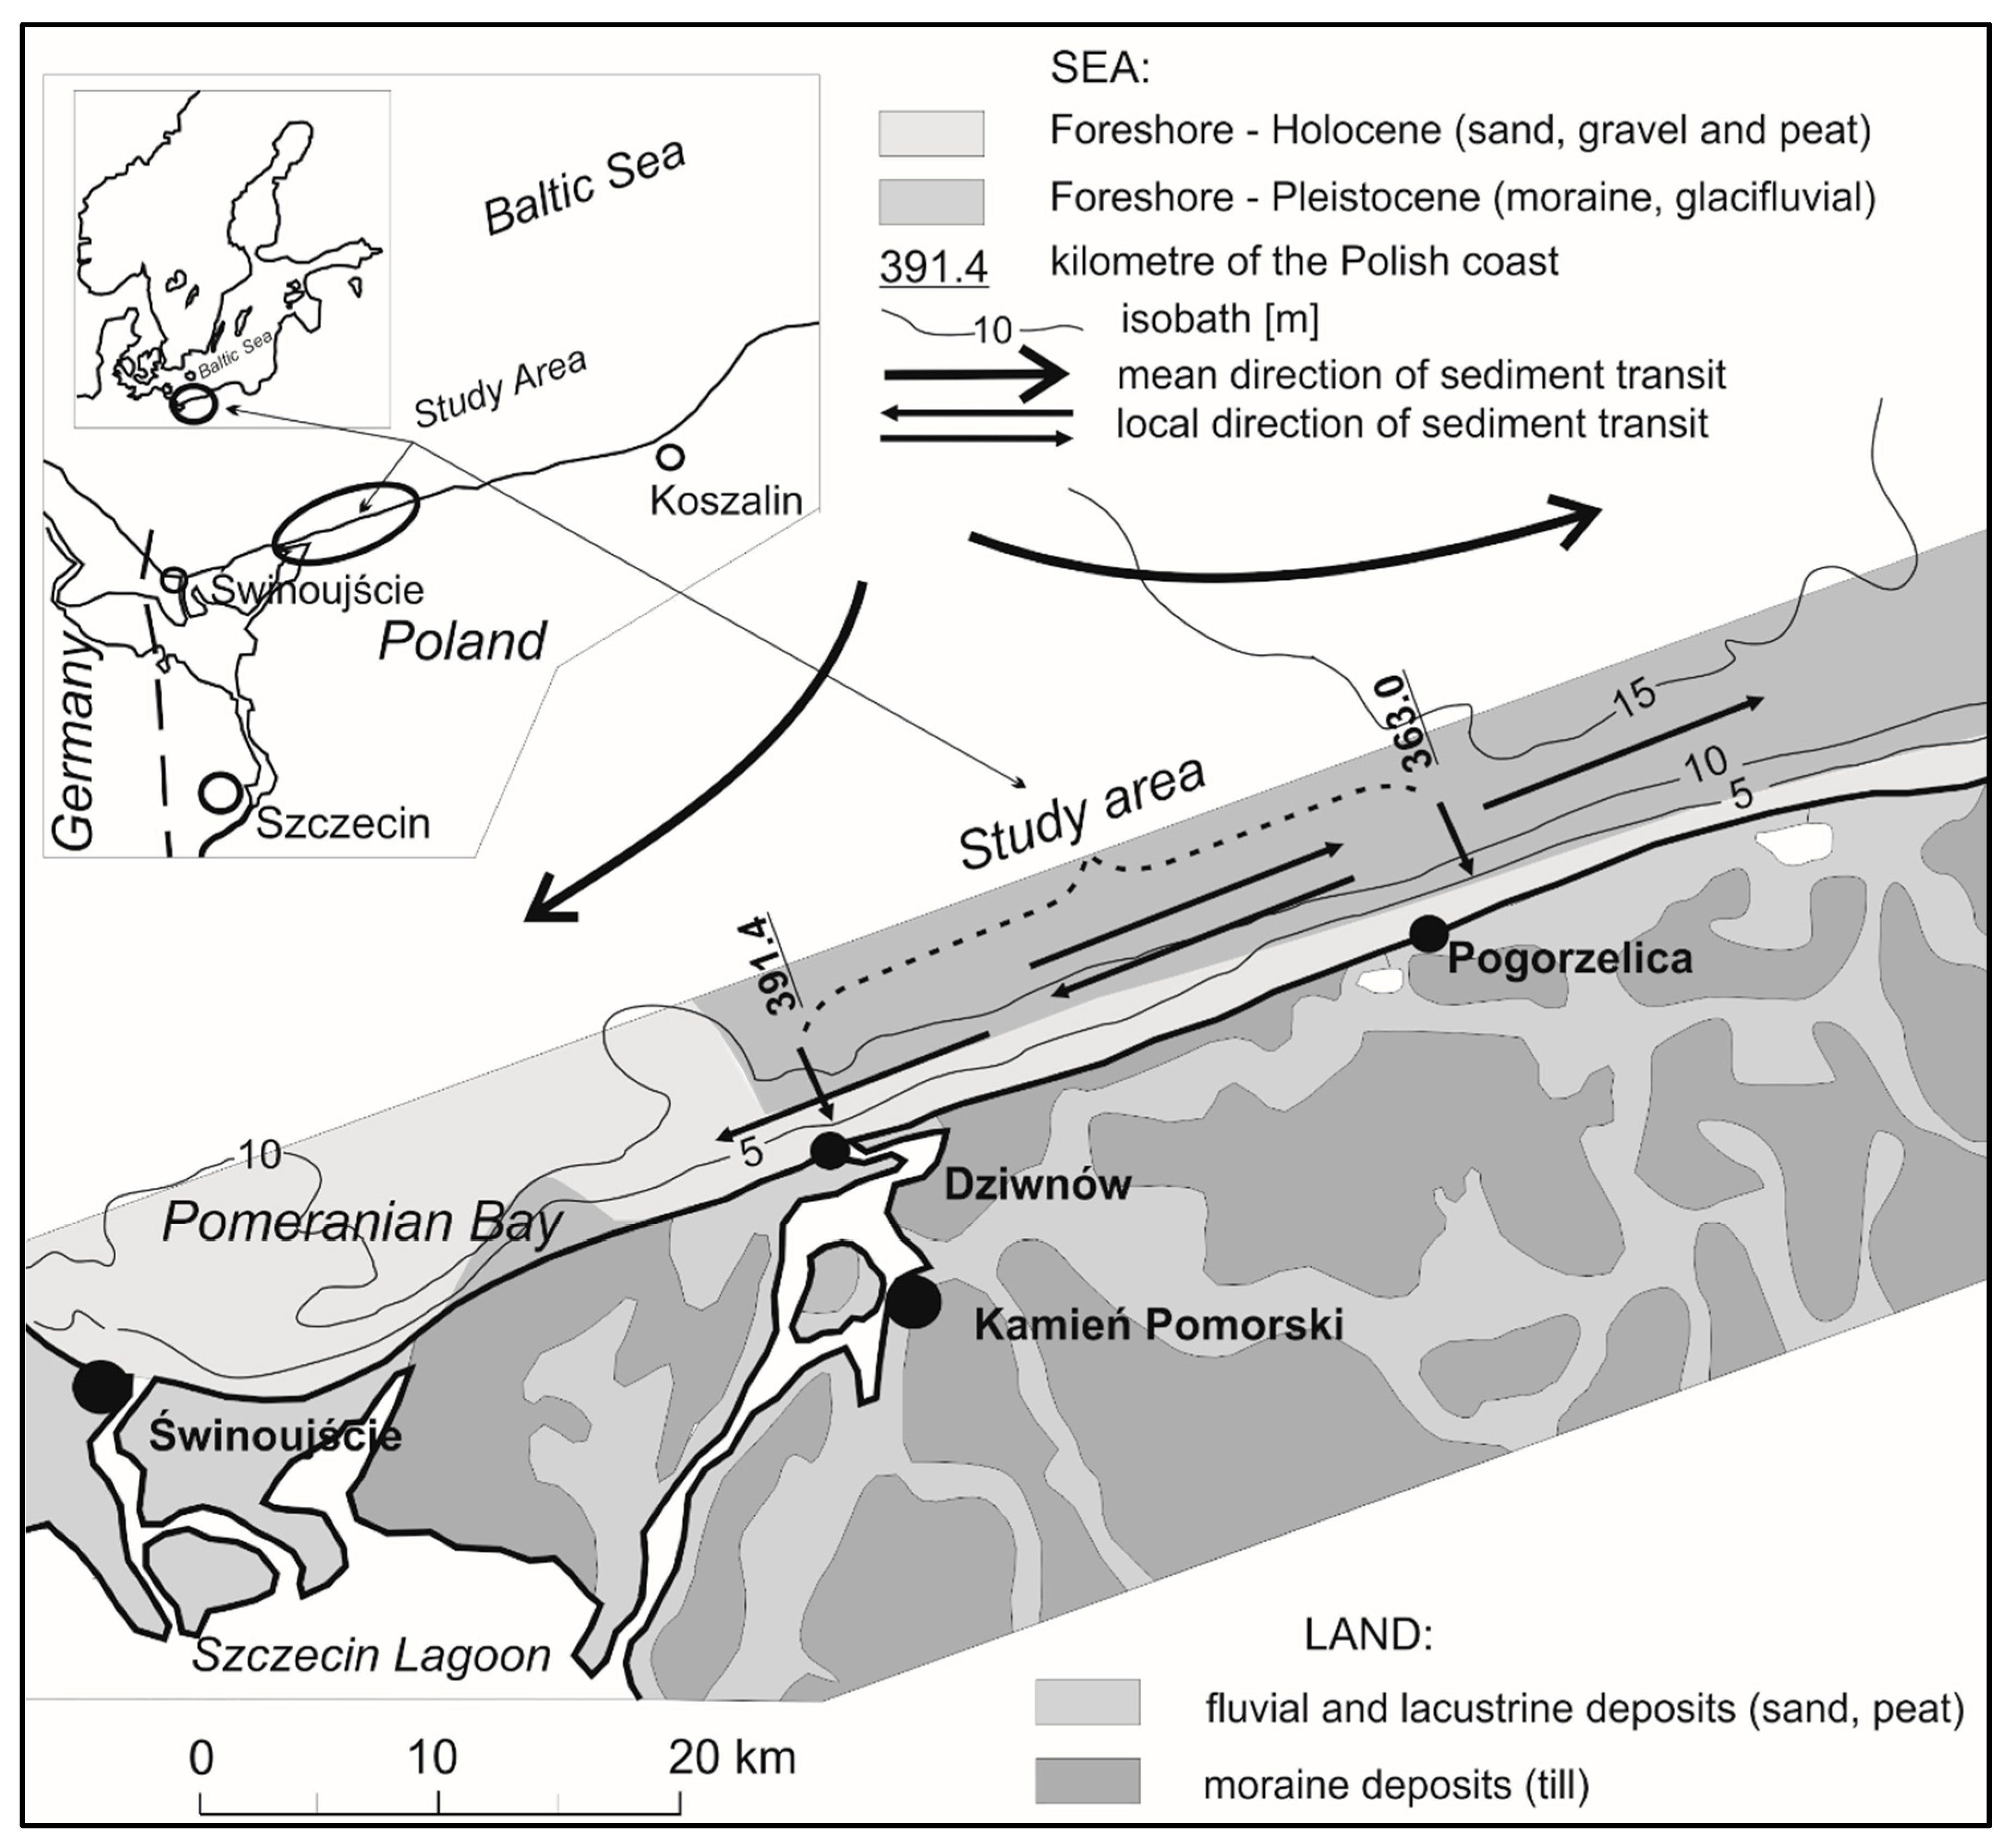
The article characterizes the changes in petrographic composition and grain shape variability of beach gravels sampled in the storm berm (or beach face) along the almost 30 km-long shore of the Baltic Sea, extending from Pogorzelica, Poland, (coastline kilometer363.0) and ending at the River Dziwna mouth (391.4 km;
Figure 1). Grain size parameters of beach gravels were estimated by application of the traditional Zingg method [
41].
The major aims of the study are to determine the petrographic composition of beach gravels, compare these with similar initial data for gravels collected from cliff sections, map coast sections affected by erosion and accumulation processes, and then link the results to morphodynamics estimated by applying nongeological methods, accounting for the presence of coastal protection structures. This is also the first detailed study of petrographic composition and measurements of Zingg grain shape parameters of beach gravels conducted along the coastline of Western Pomerania, Baltic Sea, Poland. By assessing of developmental trends of the coast, the petrographic composition and morphometric characteristics of gravels may indicate changes in erosion intensity, and contribute complementary information indicating longshore bedload transport [
42,
44].
2. Study Area
The section investigated is a part of Trzebiatów Coast, itself a part of the Southern Baltic Coastal Zone, Poland. It features cliff- and dune-type shores [
32,
45,
46]. The study covered the western part of the sandbar–dune Rega Gate area from coastline kilometer 363, the entire Rewal Upland cliff shore section, and the eastern part of the sandbar–dune Dziwna Gate area to the River Dziwna mouth (391.4 km).
Research carried out in the area by various authors [
5,
32,
38,
47,
48,
49,
50,
51,
52,
53] demonstrated the nature of geodynamic processes and developmental trends. This study builds on research conducted by Jahn [
54] on beach pebbles of the Polish Baltic coast, as well as on comprehensive coastal zone research (including beach gravels) in the Niechorze–Trzęsacz section of the coast, carried out in the early 1970s [
42].
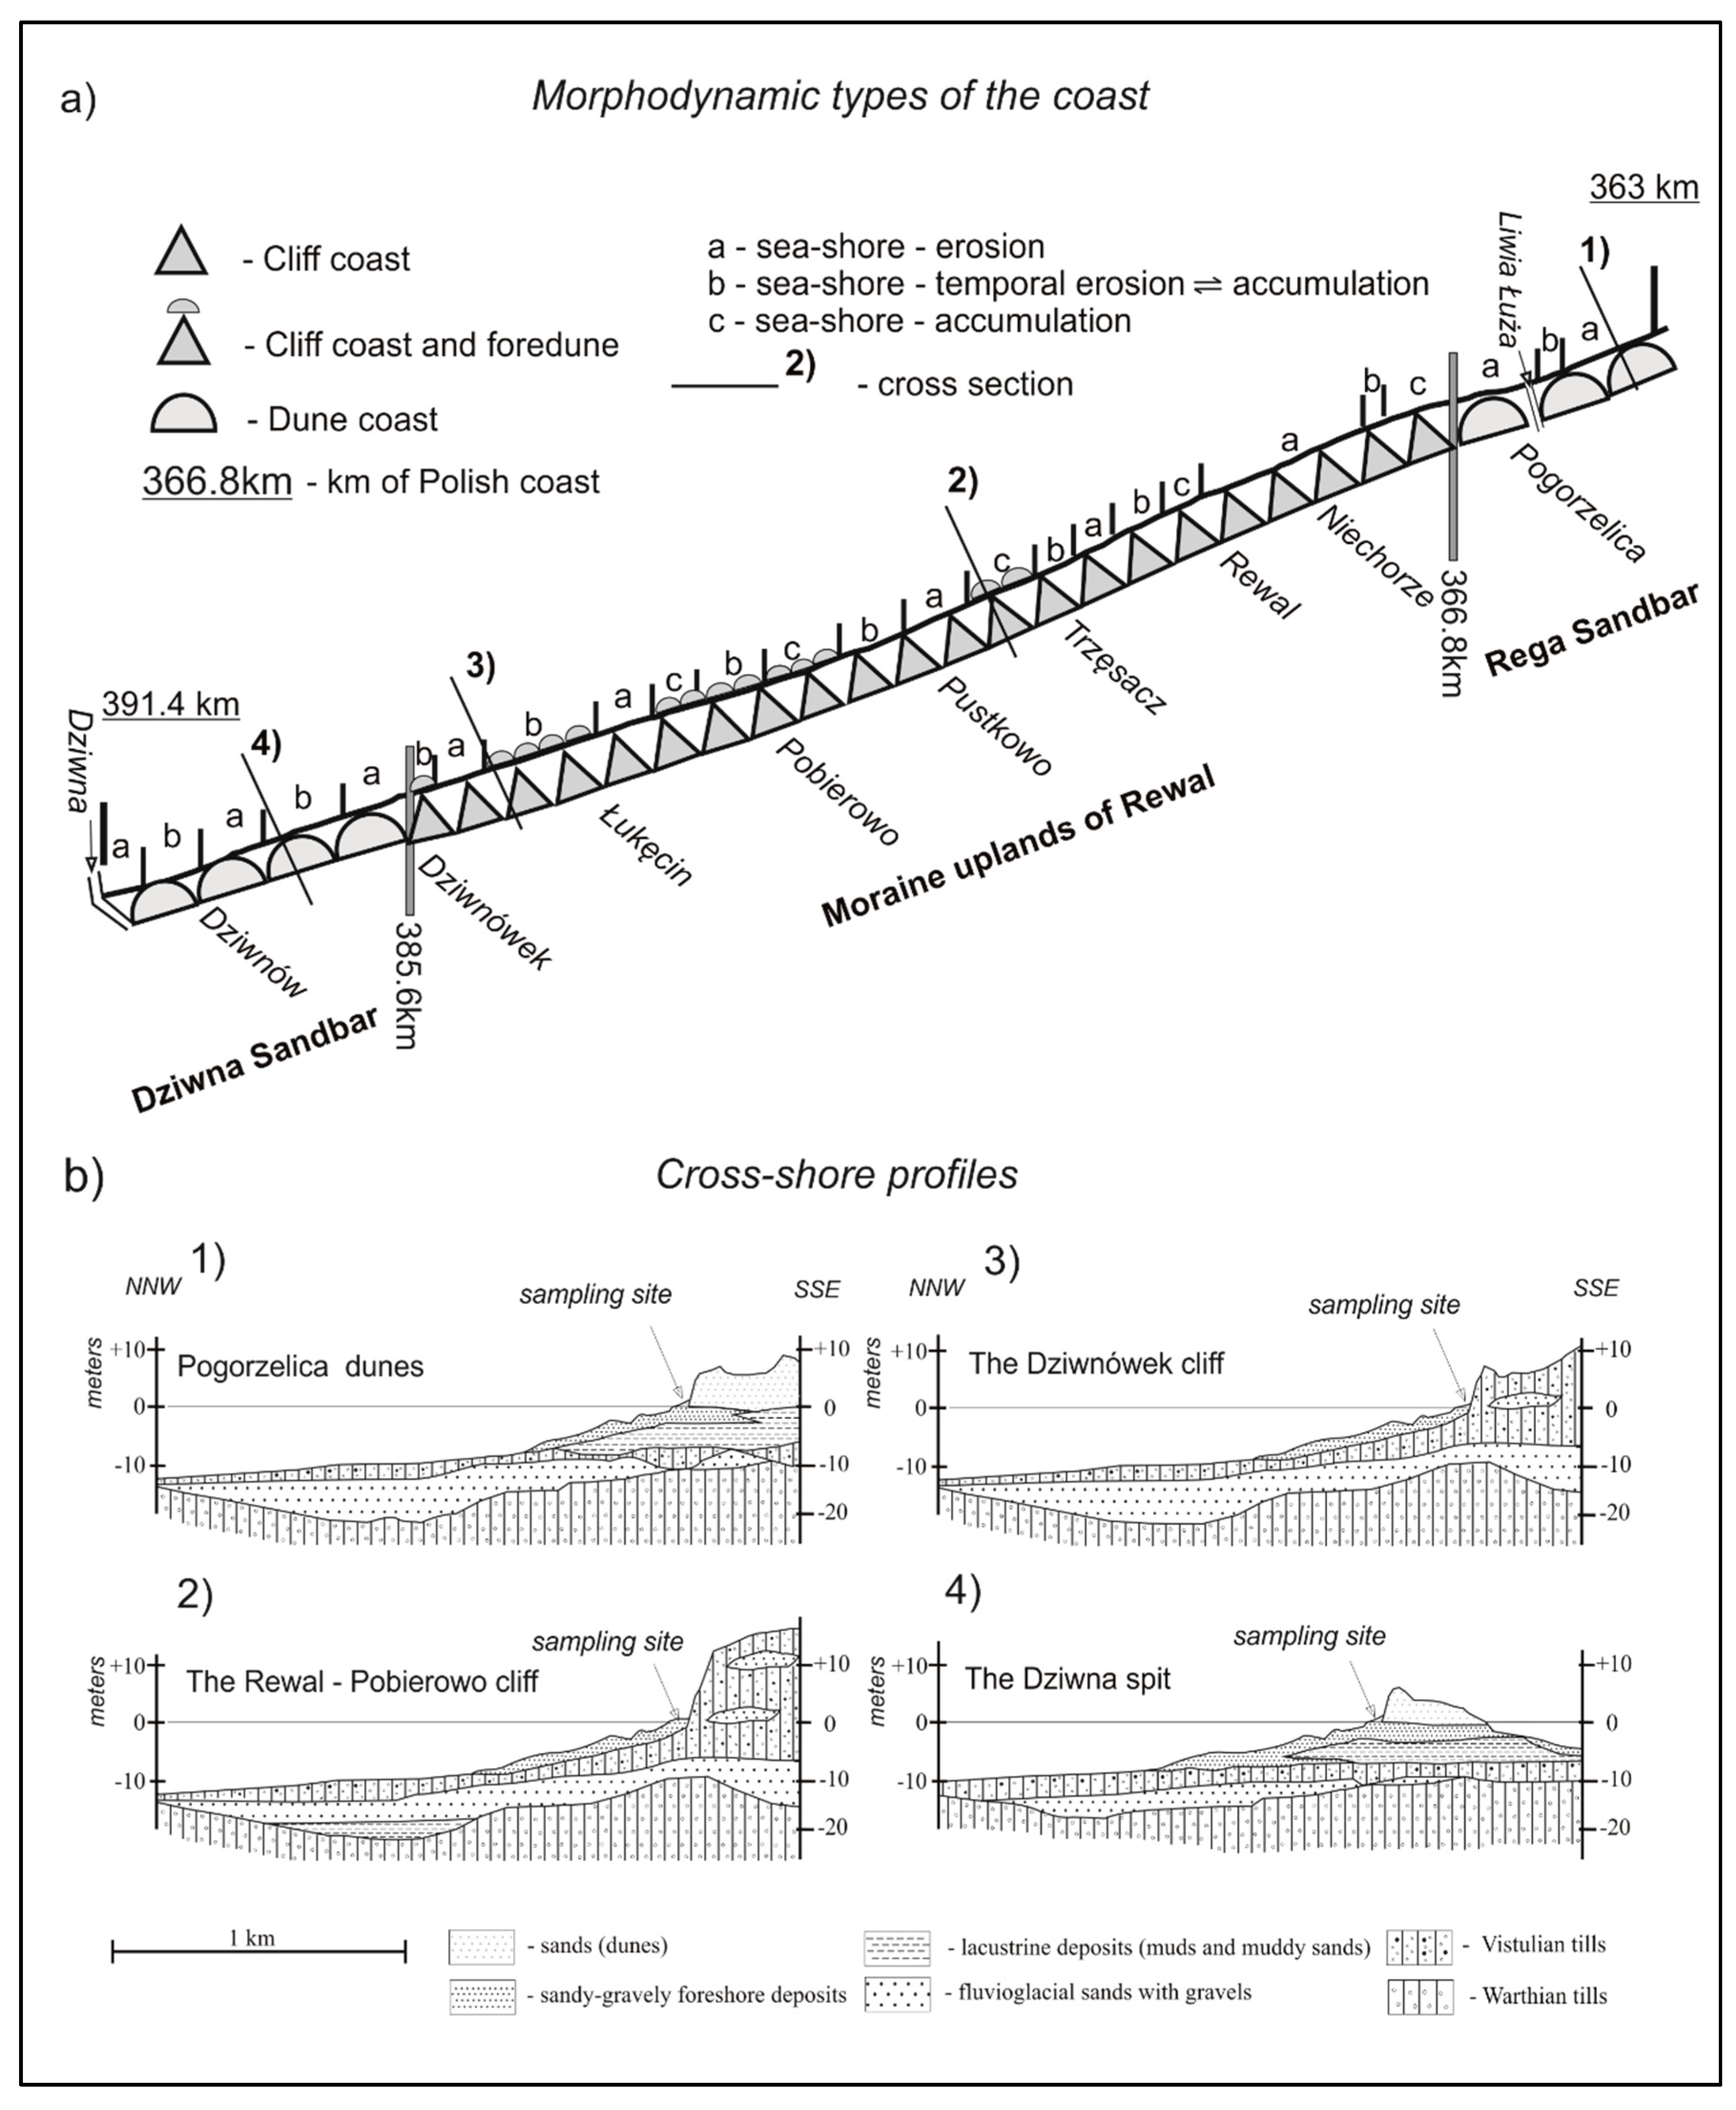
Owing to the specificity of the sea–land interactions, the Trzebiatów Coast has been divided into the following morphodynamic regions (
Figure 2a,b) [
4,
55]:
The sandbar–dune area of the Rega Gate (345.5–366.8 km;
Figure 2a,b (profile 1)) exhibits a high and moderate dune shore and a tendency to erode (mainly at 363.0–366.8 km). During the last 25 years, the annual erosion rates have reached 0.25–0.3 m/year [
56].
The cliff area of the Rewal Upland (366.8–385.7 km;
Figure 2a,b (profile 2)) has variable shore types, from the eroded upper foreshore part (e.g., 386.5–371.2 km), to varying developmental phases (e.g., 372.0–374.0 km), and locally with a tendency to erode (e.g., the Pobierowo cliff at 374.0–375.0 km and 378.0–379.0 km). In the area of Rewal, the estimated mean decadal rate of erosion is >1.0 m/year. Between 372–386 km, the erosion rate stabilizes between 0.2 and 0.3 m/year [
56].
The sandbar–dune area of the Dziwna Gate (385.7–397.4 km;
Figure 2a,b (profiles 3 and 4)) exhibits a dominant tendency toward erosion of the upper foreshore part. Varying labile development is seen only in the central part (386.5–388.0 km). The area has a large degree of anthropogenic transformation (groins, revetments, bulkheads) [
57] and beach nourishment. The rates of erosion–accumulation are highly variable and vary from −0.3 to +0.4 m/year (dune sections with seawalls) to as much as −0.8 to +0.5 m/year in area of Dziwnów jetty [
56].
The entire area of study, including the shallow foreshore, represents a morainic upland built mainly of morainic tills, occasionally separated by glaciofluvial sediments [
37,
58,
59]. The sandy-gravelly deposits of the foreshore are located only in the central part of the Dziwna Gate. The sandbar areas show older valleys of different origins, with distinct horizons of organic sediments, mainly of lake and lacustrine origin [
51,
60].
The Rega Gate area is a part of a riverine floodplain valley covered by sandy spit and aeolian deposits. The Rewal Upland area is a fragment of a Pleistocene upland with variable denivelation, the depressions of which are frequently covered by aeolian sands [
38,
61].
The Dziwna Gate area is a fragment of a “bridge” connecting Pomeranian Bay with Kamień Lagoon, remodeled by sandbar deposits and intersected by the River Dziwna mouth [
60].
The Pogorzelica–Dziwnów coast section shows a sandbar–dune backshore built by Holocene sands, and cliffs formed by Pleistocene morainic and glaciofluvial deposits. The entire section (except for its westernmost part with the old River Dziwna bed) features an erosional platform built mostly by morainic tills or locally by glaciofluvial sediments, and frequently covered by thin layers of marine sands. During storms, these sands (or gravelly sands) work as an active layer and their movement erodes the platform [
58,
62].
The estimated rate of cliff sections erosion during last 100 years erosion has varied from 0.5 to 2 m/year. Due to the presence of embankments along Rewal cliff, the accumulation along the dunes slowed to <2 m/year, sometimes indicating even erosion (~0.7 m/year), especially around the Dziwna spit, where intensive erosion dominates [
56].
According to meteorological conditions, the study area is dominated by southwestern and western winds annually, with mean wind speeds of 2 to 4 m/s, and frequency reaching 20 to 25% (light to gentle breeze). The frequency of 6–8 m/s winds varies 15 to 20% (gentle to fresh breeze). Frequency of strong winds and storms (>8 m/s) is only about 1–2%. The highest wind speeds occur during autumn and winter, usually 0.6–1.4 m/s and more intense compared to summer and spring [
6].
The frequency and intensity of storm events in the study area increased during last 70 years. Storms induce an increase of the wave splash zone, which usually reach approximately 2–2.5 m above the seasonal mean high water. The frequency of waves with heights <0.5 m, depending on the season, exceeds 90%. The annual mean sea level increase induced by global climate forcing varies from 0.04 to 0.08 cm/y [
63,
64].
The dune and cliff foot positions in the study area are positively correlated, especially in the area between Rega and Rewal (correlation coefficient >0.75; significance level
α = 0.05). In the western part of the study area, the correlation is less (<0.25;
α = 0.1). During the last 40 years, the correlations decreased, mainly due to more embankments and the increasing mean sea level, which heavily disturb circulation of pebbles in the study area [
36]. In the western part, longshore currents distribute particles towards Wolin Island. Meanwhile, in the eastern part, bedload transport towards Kołobrzeg dominates. In the middle part, the divergence zone was observed, with no visible processes of gravel redeposition (temporal erosion–accumulation) [
43].
Figure 2.
(
a) Morphodynamic types of the coast in the study area, (
b) representative geological cross-shore profiles 1–4 (adapted from [
65]).
Figure 2.
(
a) Morphodynamic types of the coast in the study area, (
b) representative geological cross-shore profiles 1–4 (adapted from [
65]).
Lithodynamic processes in the study area are strongly related to seasonal variability of meteorological and hydrodynamic conditions. The grain size composition along sandy coast sections can be characterized by individual groups of so-called “lithodynamic belts”. The transformation of initial grain size depends on stormy conditions and intensity of aeolian processes. These differences are related to (i) grain size variability in the surf zone and backshore, (ii) intensity of wave storms, (iii) spatiotemporal changes of winds and air streams, (iv) different rates of seashore drying or wetting by rainfall, (v) influxes of the water from the surf zone, and (vi) marine aerosols or dew [
66]. Deposition and redeposition of coarse sedimentary material may be attributed to three stages:
During the storm conditions, the greatest effect of particle dispersion is usually observed in the backshore. The weakest dispersion is noted in the foreshore. Additionally, the balanced liability between scattered and drifting particles is visible.
In poststorm conditions, the selective processes of granular differentiation in dunes material and backshore are observed. The coarse layer becomes thicker, and predominance of sediment movement and accumulation is obvious, rather than redeposition (erosion and secondary accumulation). Accumulation in the foreshore is negligible. The processes of redeposition and movement of sedimentary material slowly appear to develop on poorly dampened surfaces.
The prestorm conditions are dominated by aeolian processes, which are mainly represented by redeposition (wind erosion and sediment mass movement). The thinnest and finest fractions are removed and gravels are exposed. The fine fractions are flushed from the cliff sections and redeposited into the deeper parts of the Odrzana and Pomorska Bays [
66].
The beach sections in the study area are composed mainly of fine and medium sands. The amount of gravel is generally low, especially during periods between storms. Among the gravels, the 2–5 cm subfraction dominates. During the wave storms the relative amount of coarse grains increases, mainly due to the removal of fine fractions, or by redeposition of foreshore gravels [
42,
44].
3. Methodology of Field and Laboratory Studies
Field work was conducted following stormy weather and in the second half of September 2004. At of the end of 2004 and the start of 2005, parts of the coast section studied were subjected to beach nourishment with dredged material. Beach sampling was carried out for two days, during field classes given to students in the Construction Program of the former Technical University of Szczecin (currently the West Pomeranian Technological University in Szczecin, Poland). Gravels with a dominant grain size diameter of 2–5 cm were collected from the berm (or beach face) of dune and cliff sections of the Polish seacoast.
Owing to the low water temperature, the underwater part of the beach was not sampled. During storms and strong winds, the lower and middle parts of the beach were flooded; therefore it was assumed that gravel samples collected in the beach just after the storm cessation are representative for the assessment of morpholithodynamic processes at the land–sea interface. The weather during sampling was rainy. The sea state was 2–3 Beaufort scale, and the wind was westerly. Immediately before the sampling, the weather was windy (moderate breeze), with SW and W winds dominating (4–7 m/s), and 4–5 Beaufort scale. The atmospheric pressure was decreasing from 1020 to 998 hPa [
67].
During the sampling, the beach width varied from 10 to 40 m. The beach width in the cliff sections varied 10–15 m, whereas in cliff sections with developed foredune, the width was 20–40 m.
The beach gravels were collected at a radius of about 50 m, along 250 m intervals of the coastline. Individual samples weighed from 2 to 5 kg and were collected in the area of 10 × 10 m squares. If the amount of collected rock material was above 2 kg, the sampling procedure was finished; if <2 kg, then the sampling area was expanded to 50 × 10 m rectangles. Gravel samples were collected simultaneously by two groups of eight individuals. One group started sampling in Pogorzelica (363.0 km), the other starting from the Dziwnów jetty (391.4 km). The sampling operation took two days, because—once the windy conditions were over—the gravels were rapidly covered by sand blown in by the wind, and the beach became sandy. The gravels deposited during the storm lay beneath a thin aeolian layer [
68].
Next, the gravel samples were examined for their petrographic composition. Additionally, the grain shape among individual petrographic groups was determined.
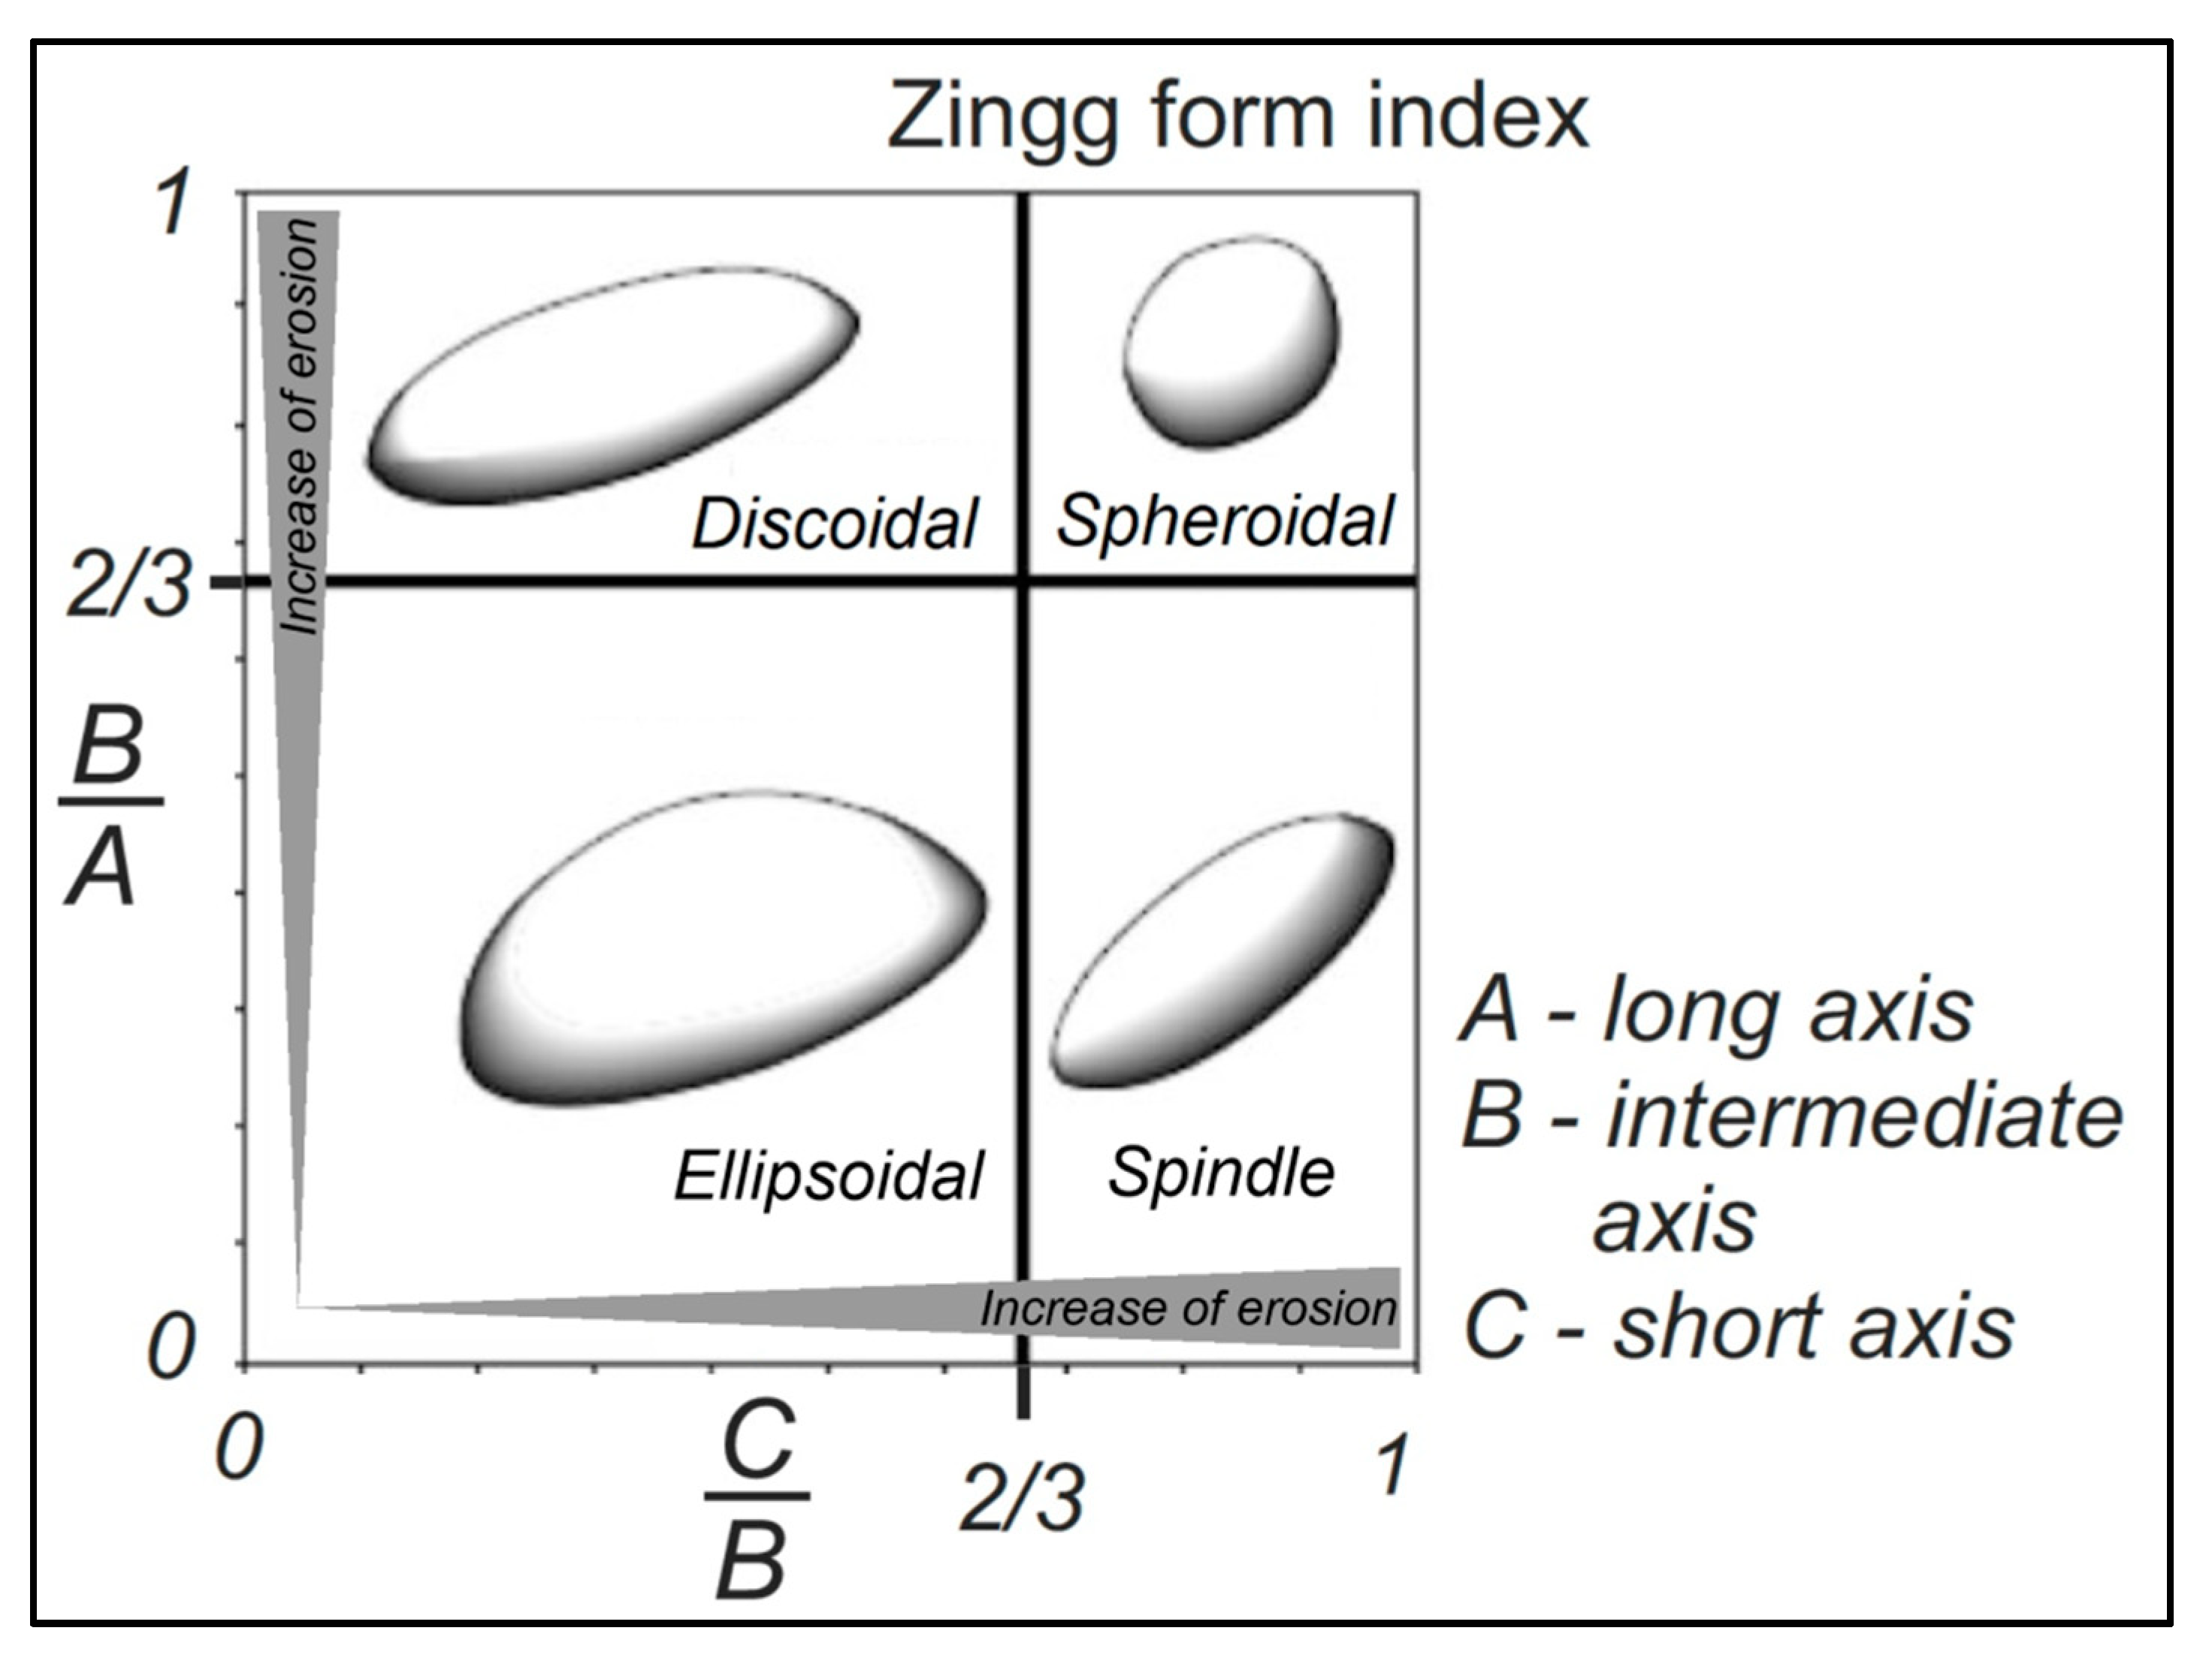
The basic petrographic groups included (i) high resistant igneous and metamorphic crystalline rocks with quartz; (ii) low resistant limestone; and (iii) low resistant sandstone, dolomite, and others (shales, flints, brick and concrete fragments). The samples consisted of 200–400 gravel grains. The grain axes were measured in each petrographic group to arrive at the maximum length, maximum width, and maximum height. Gravel morphometry was determined using the flatness index (
Ws) of Wentworth and the gravel shape as described by Zingg [
41]. The
Ws was estimated using equation
Ws = (
A +
B)/
C [
69]. Zingg’s method describes the grain shape based on (i) the ratio between the intermediate (
B) and longest (
A) axis, and (ii) the ratio between the shortest (
C) to intermediate (
B) axis. The gravel grains were classified by their shape as discoid, ellipsoid, spheroid, and spindle-shaped (
Figure 3).
The basic statistical parameters (arithmetic mean and standard deviation) of grain shape indices and petrographic group classification were calculated for the set of data consisting of 113 sampling stations and total number of 17,882 gravel pebbles. The mean number of gravel grains collected from single stations was 172. At nine stations gravels were not found, so only 104 stations were used in the further analysis of lithodynamics.
The petrographic composition of beach gravels may point to the source of the initial material and directions of transport in the in-shore zone. A comparison of the proportion of gravel in individual petrographic groups with the initial material allows a qualitative assessment of the intensity of the gravel-destructing processes in those groups. Also, the gravel shape may useful for interpreting the coastal dynamics. When assessing the intensity of shore erosion, lithodynamics of the coastal zone may be subject to rank-based evaluation [
51,
70]. Assuming the general knowledge of individual sections of the Polish coast (erosive or accumulative), and simple mechanical properties of selected group of rocks, such as hardness or presence of slaty cleavage (e.g., greater hardness of crystalline rocks, compared to sandstones, limestones, or shales), the zones of increased mechanical reworking of rocky material can be distinguished. Proportions between different types of rocks, compiled with the basic Zingg measurement statistics indicate primary depositional patterns (instantaneous deposition with no mechanical reworking traces, accumulation of initial sedimentary material) or redeposition (erosion and accumulation, reworking, or sorting traces). Presence of cusps and embayments located along the study area affects coastal dynamics, and may decrease movement of sedimentary debris (i.e., greater amount of discoidal and ellipsoidal gravels that indicate shorter mechanical reworking) [
57,
71].
Finally, the data obtained were subjected to lithostatistical analysis. Considering the large number of collected and measured gravel samples (
n = 17,882), the basic statistics (means, standard deviations, and percentages) were calculated with 90% confidence intervals. Calculated parameters (amount of gravels in selected petrographic groups, shape parameters, and
Ws) were compared with coastal dynamics data (1986–2004) and presence of groins, wavebreakers, and seawalls [
56,
57].
The mean values of each parameter were estimated and subsets between half the standard deviation (0.5 SD) above and below the mean were considered as unimportant for the lithodynamics interpretation. The subsets above half of the standard deviation (+0.5 SD) were treated as positive anomalies, whereas the subsets below the half the standard deviation (–0.5 SD) were negative anomalies. The positive anomalies in the group of discoidal and ellipsoidal gravels are indicators of accumulation (direct deposition without secondary reworking of sedimentary material). The positive anomalies in the group of spheroidal and spindle-shaped gravels may indicate the dominance of erosion, increased mechanical reworking, and longshore movement of sedimentary debris [
70]. In this particular case study, the statistical application of 0.5 SD may be justified by robust sampling data and a flattening of distribution. Additionally, the shorter subsets expose properly obtained anomalies.
Similarly as above, the positive anomalies of the gravel flattening index (
Ws) are indicators of accumulation, whereas negative anomalies are related to erosion and redeposition processes [
44,
70]. The
Ws index positively correlates with contents of ellipsoidal and discoidal gravels.
4. Variability of Petrographic Composition
The petrographic composition of morainic structures making up the cliff shore and the shallow foreshore is dominated by fragments of crystalline rocks (about 40–50%), limestone gravels (30–50%) and sandstones with dolomites (10–15%). The remaining gravels contribute less than 10% [
59,
72,
73,
74]. The gravels occurring on the beach eroded from morainic deposits and were rapidly sorted in both petrographic composition and shape. The contribution of mechanically resistant components (mainly crystalline-rock gravels) increases and contents of less resistant gravels (shales, sandstones, limestones) decrease with distance from the source of the initial material.
Table 1 summarizes contributions of initial gravels originating in morainic tills, which make up the cliffs and the gravels collected on the beach. The percentages of beach gravels are shown in relation to the total gravel weight and to the number of gravel grains collected. In individual petrographic groups, there are small differences between the percentages associated with the gravel weight and number of grains. Because the grain shape was measured on each grain, the contribution of individual petrographic groups to the total number of gravels examined is given (
Table 1).
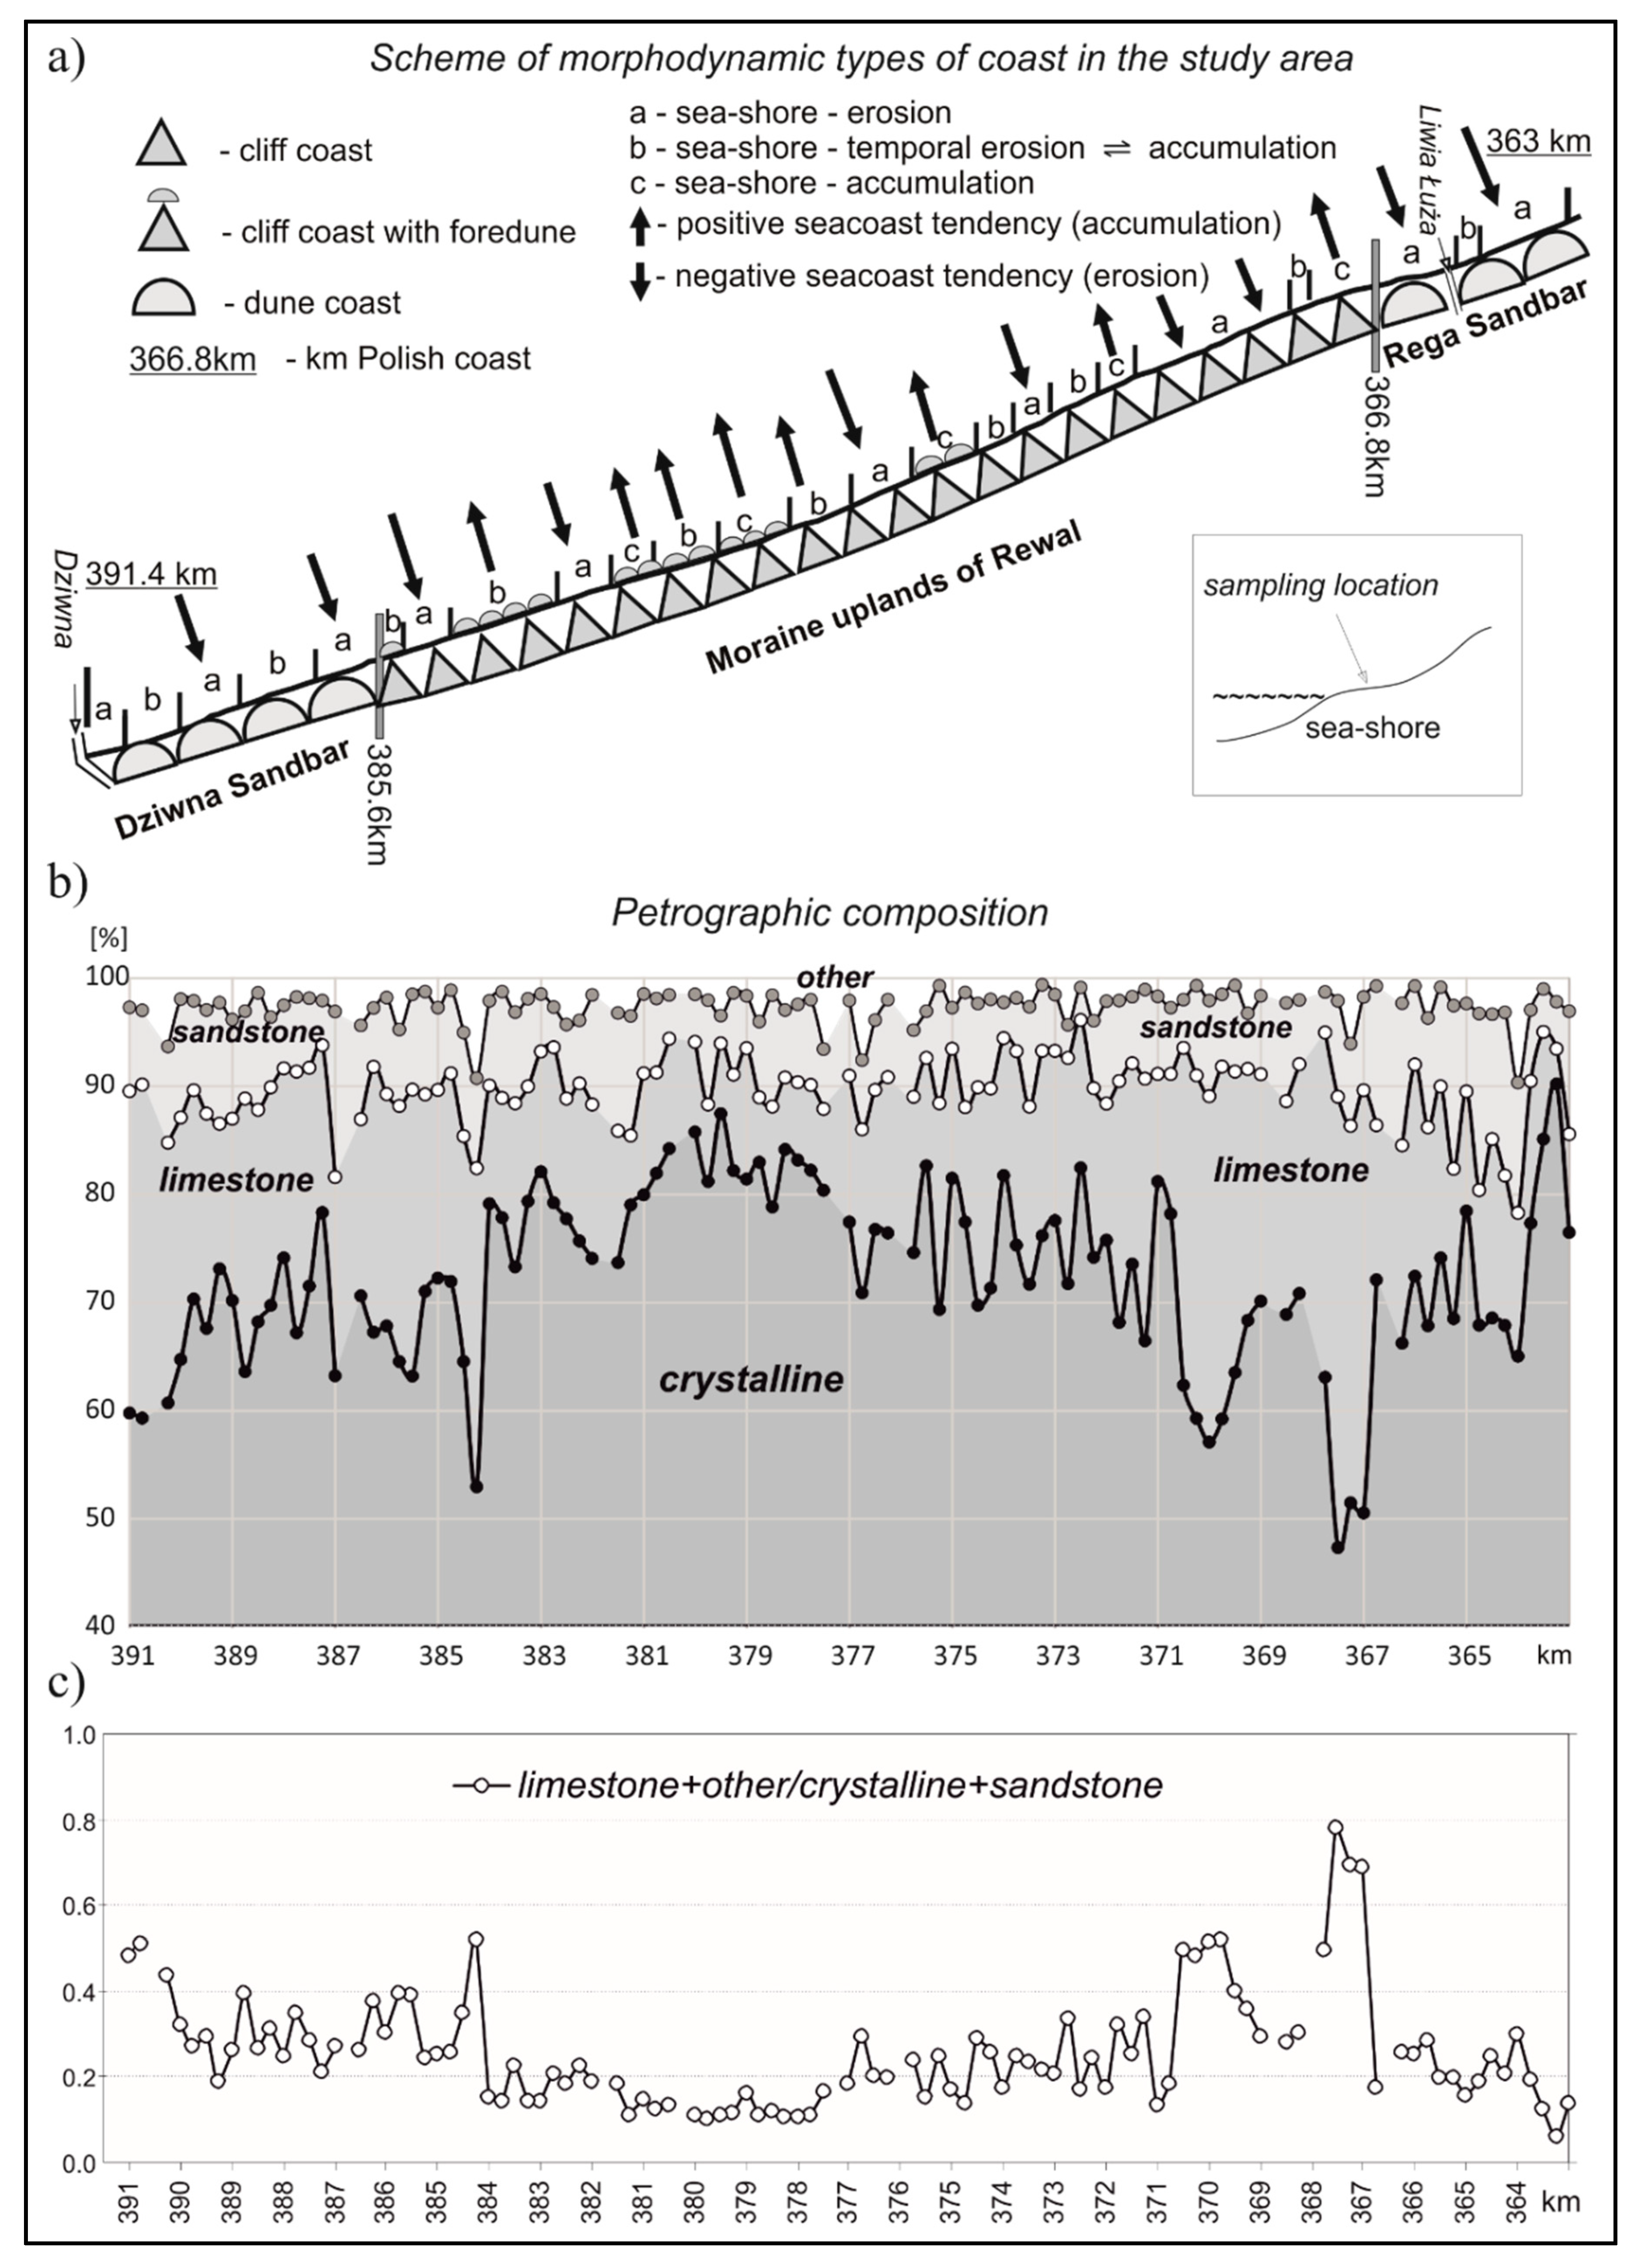
The petrographic composition along the shore section showed considerable variability (
Figure 4a–c). The mean weight content of crystalline rock gravels was 75.8%, and ranged within 50–90%. The highest contribution of crystalline gravels (over 75%) was found in the Rewal Upland cliff, where glacial tills dominate in the shallow nearshore and are intensively mechanically reworked during stormy weather, creating an additional source of crystalline components. These processes are especially visible between 375.0 and 383.0 km. The lowest proportion of those gravels (below 70%) was revealed in a zone of contact between the cliff area and the sandbar section of the Dziwna Gate (384.0–387.0 km), as well as on the Rewa Gate dune shore sections in the vicinity of the Rewal Upland dune coast (364.5–368.0 km), and the Dziwna Gate (390.0–391.4 km). The contribution of limestone gravels averaged about 15%. The highest proportions of limestone gravels (above 25%) were recorded in the area of active cliffs from Niechorze to Trzęsacz (368–373 km) and (about 20%) between Łukęcin and Dziwnówek (384.0–386.0 km), as well as in the vicinity of the Dziwnów jetty. The lowest contribution (about 10%) of limestone gravels occurred in the cliff area between Pustkowo and Łukęcin (375.0–384.0 km) and east of the Liwia Łuża mouth (365.5 km). The average percentages of sandstone gravels ranged within 5–15%; elevated contributions (10–15%) of sandstones were found only in the dune shore section in Pogorzelica (364.5–365.5 km) and in the zone of contact between the cliff and dunes at Dziwnówek (386.0–366.5 km). The remaining shore sections showed a similar content of sandstone gravels (5–10%).
The ratio between gravels of less resistant rocks (limestones and sandstones) and more resistant rocks (crystalline rocks with quartz) was at its highest (above 0.4) in the area of active cliff and the Liwia Łuża mouth between Niechorze and Rewal, somewhat lower ratios (0.3–0.4) were recorded between Łukęcin (384.0 km) to the cliff–dune contact zone (386.5 km) to the River Dziwna mouth (391.4 km). The lowest ratios, about 0.2 and below 0.2 were found in sandbar areas east of the Liwia Łuża mouth towards Mrzeżyno, and at a temporally active cliff at Pobierowo, respectively, as well as at a cliff in a labile developmental phase (371–377 km), except for clearly eroded sections (
Figure 4a). The greatest domination of crystalline rock gravels over limestones and sandstones was revealed east of Pogorzelica and between the Pobierowo cliff to Łukęcin (375–383 km). Similar were the relationships between sandstones and limestones. At the Pobierowo cliff, the sandstone to limestone ratio was the highest, declining east of Rewal (371–364 km) and west of Łukęcin (381–391 km). Increased ratios were also related to the presence coastal protection structures, which trap less-resistant gravel components and decrease mechanical reworking of the material.
5. Shape Variability
The mean values (and standard deviations) of the Zingg gravel shape index and flatness index are shown in the
Table 2. The table also contains contributions of remaining gravels, but their contributions were very low (below 5%) and are disregarded in the subsequent discussion, as they are not important for insights into the beach lithodynamics.
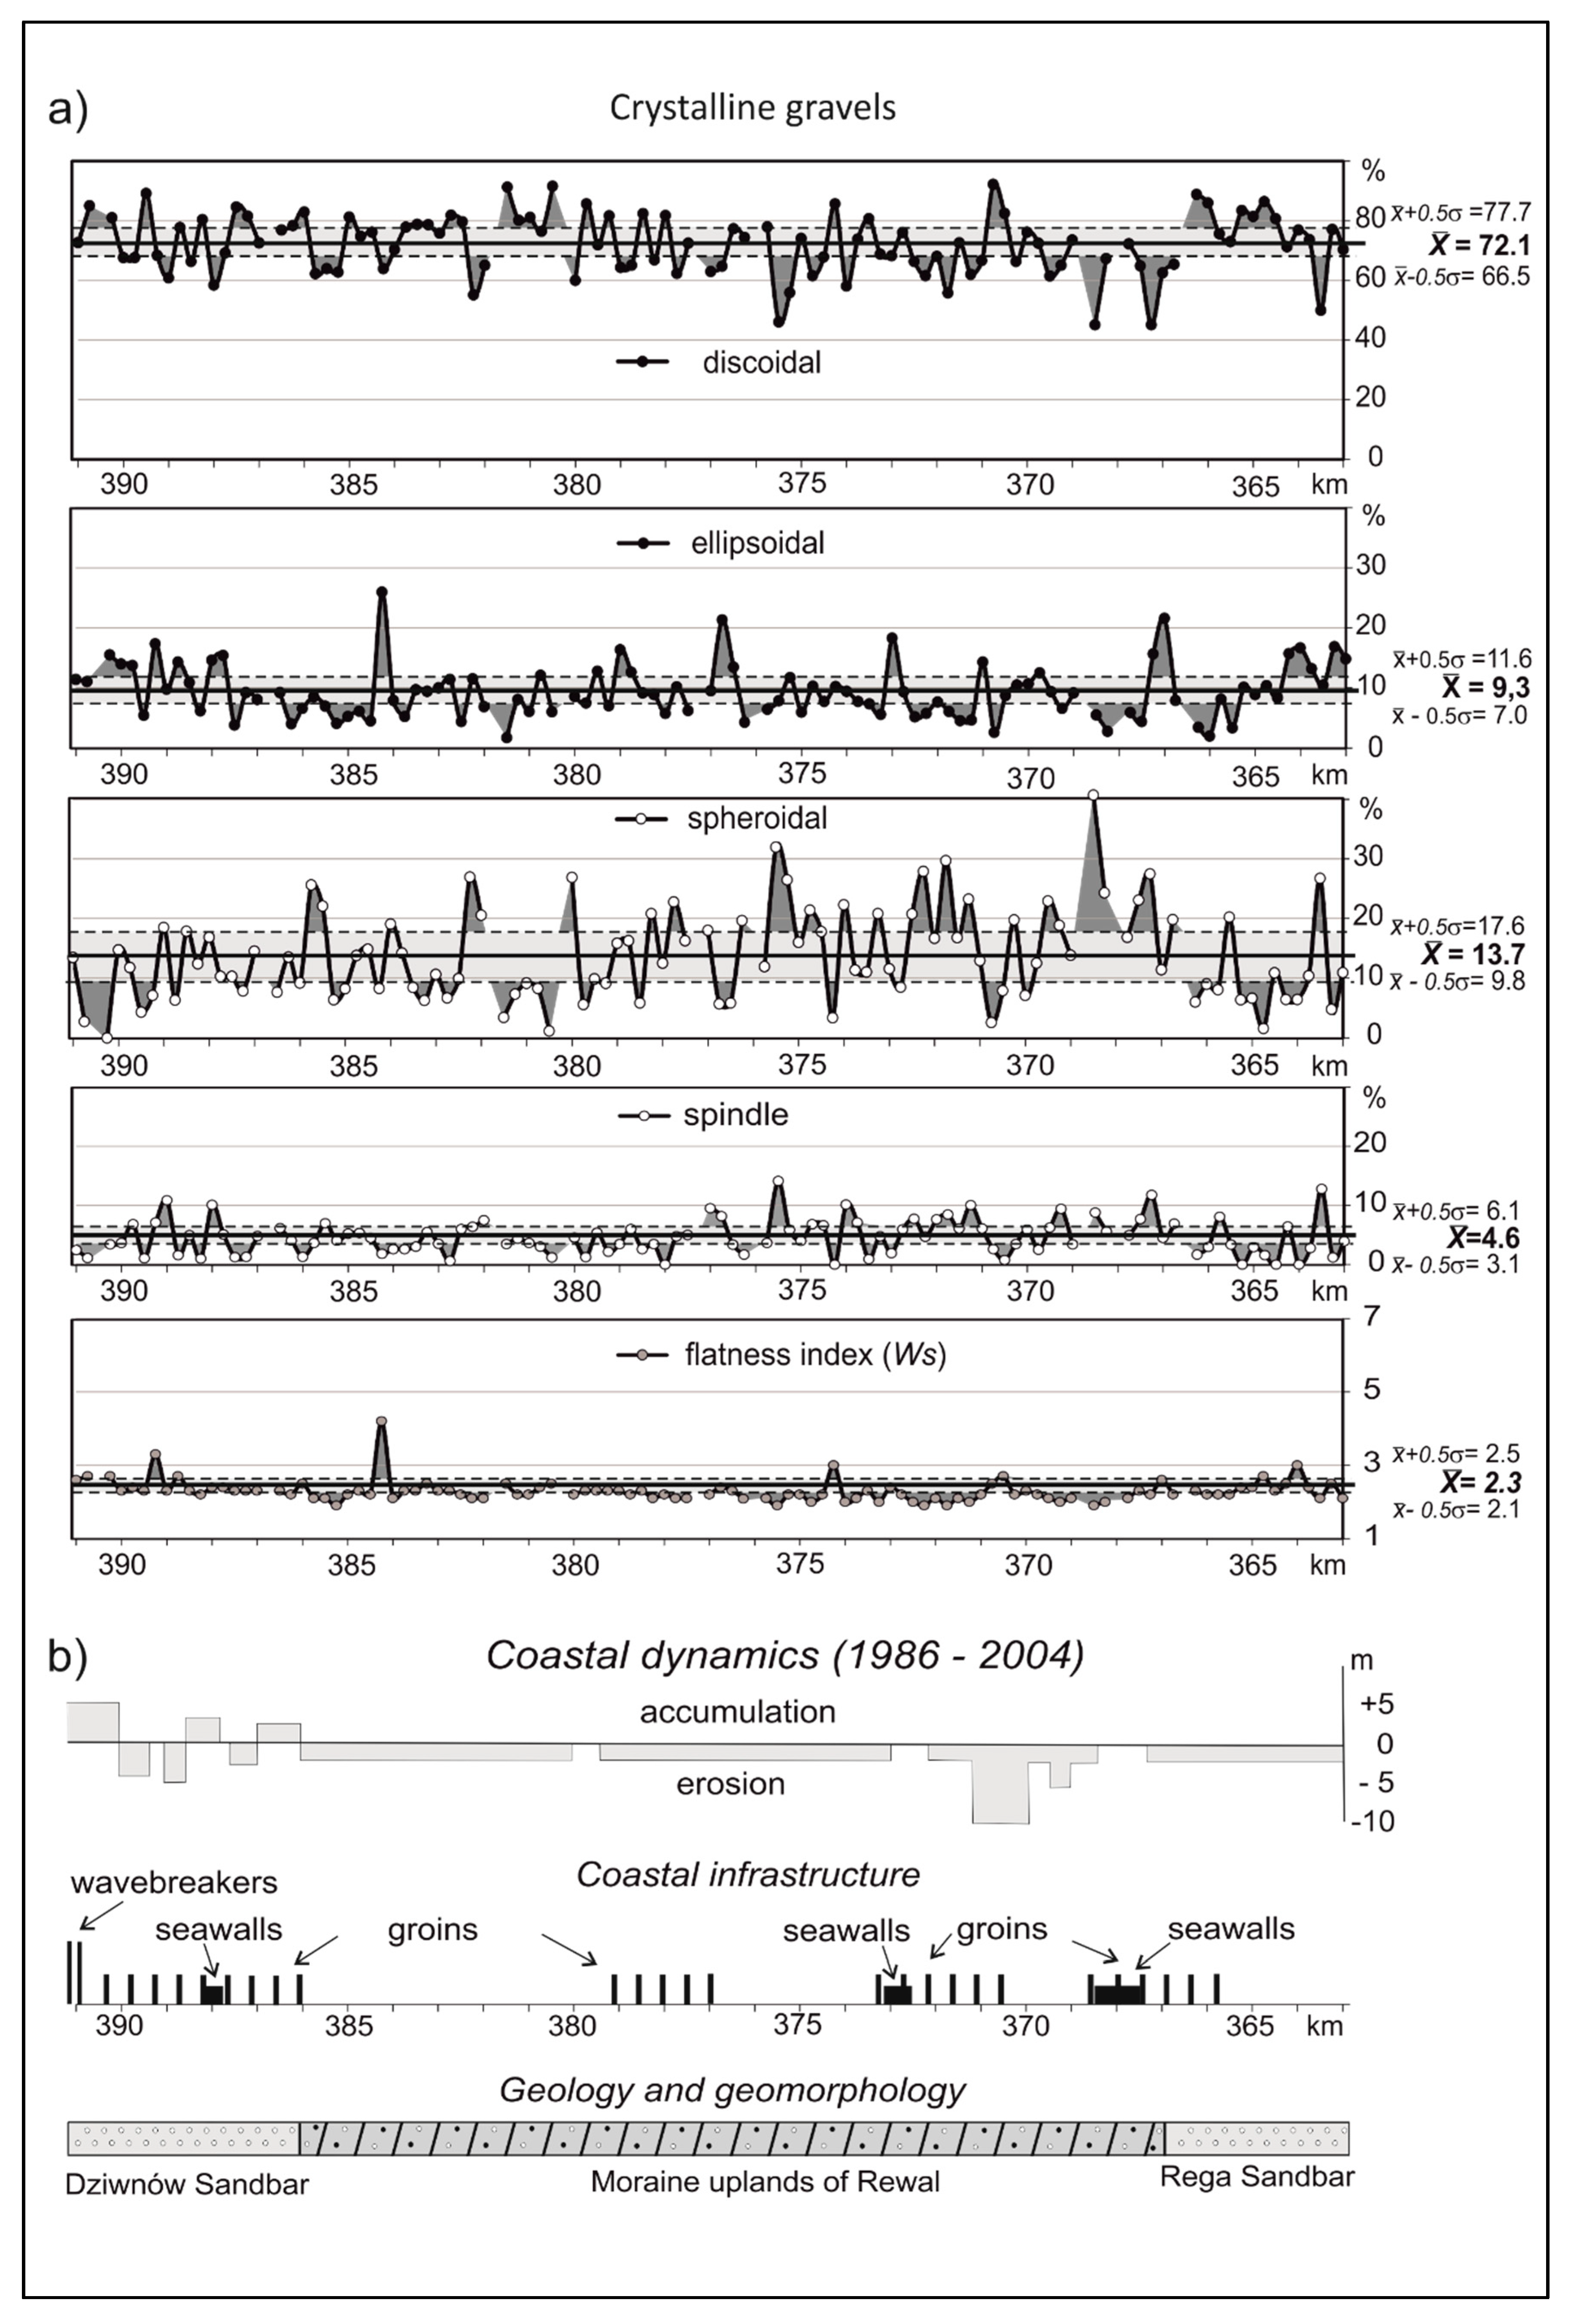
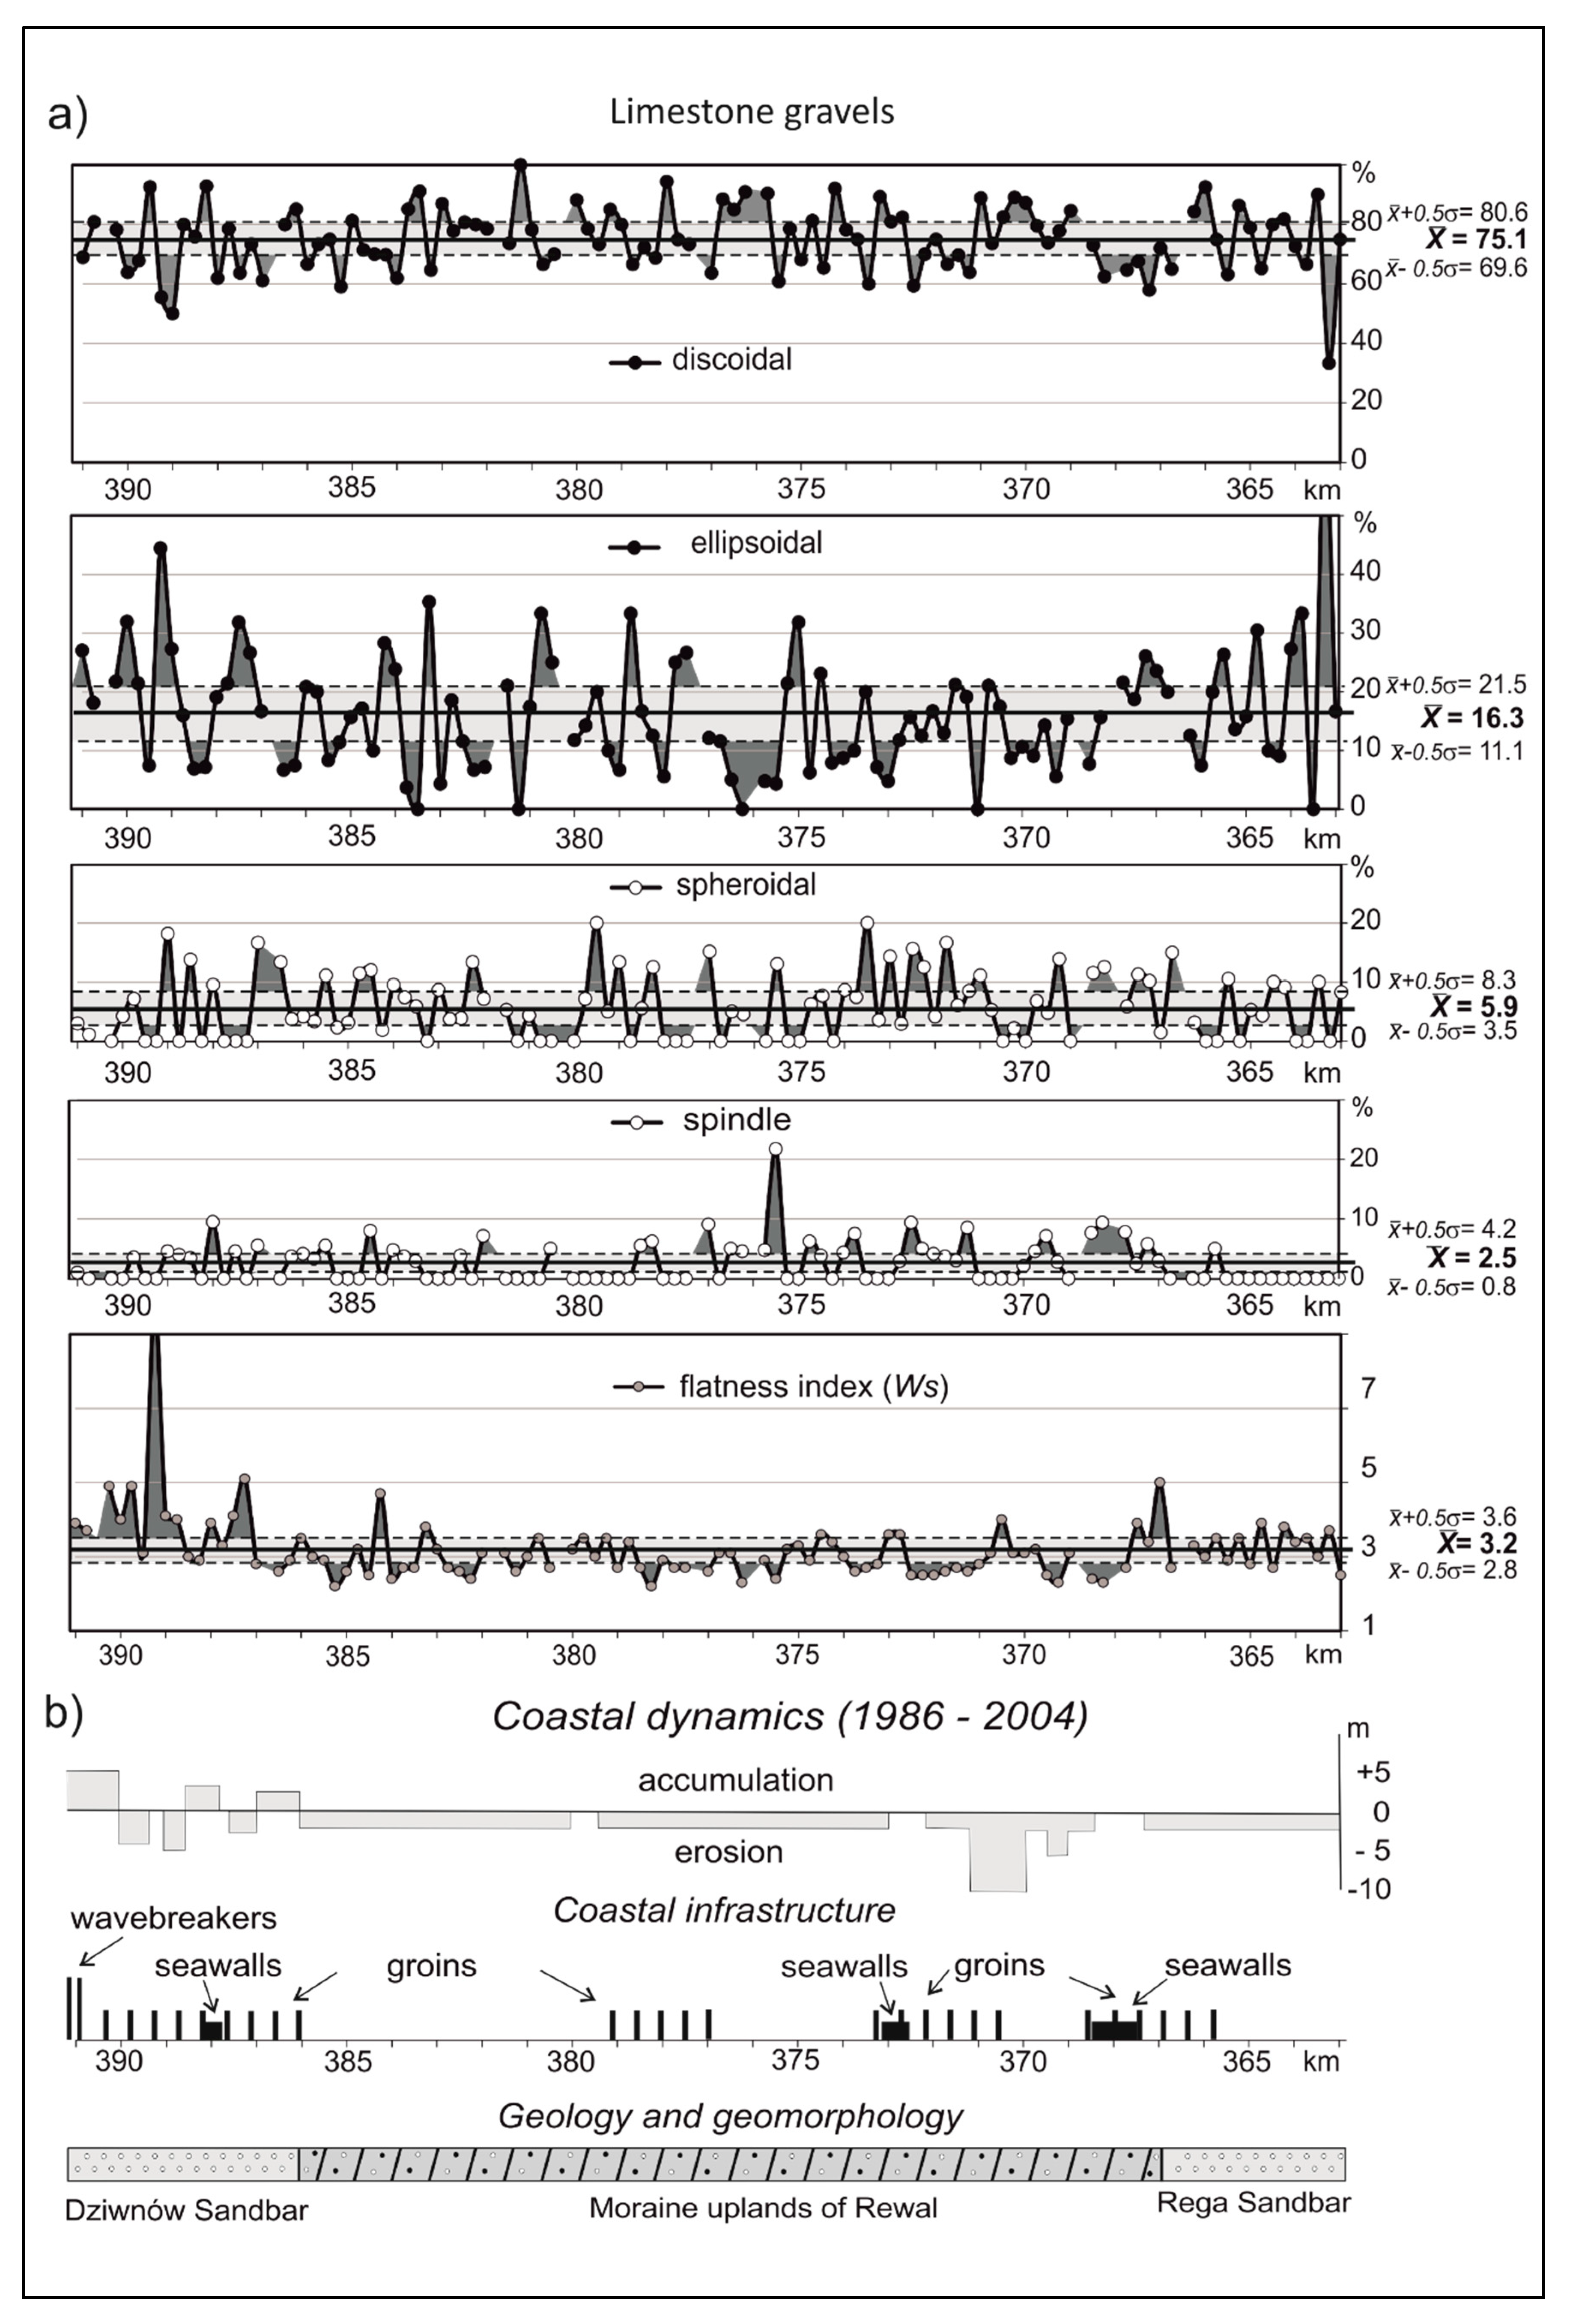
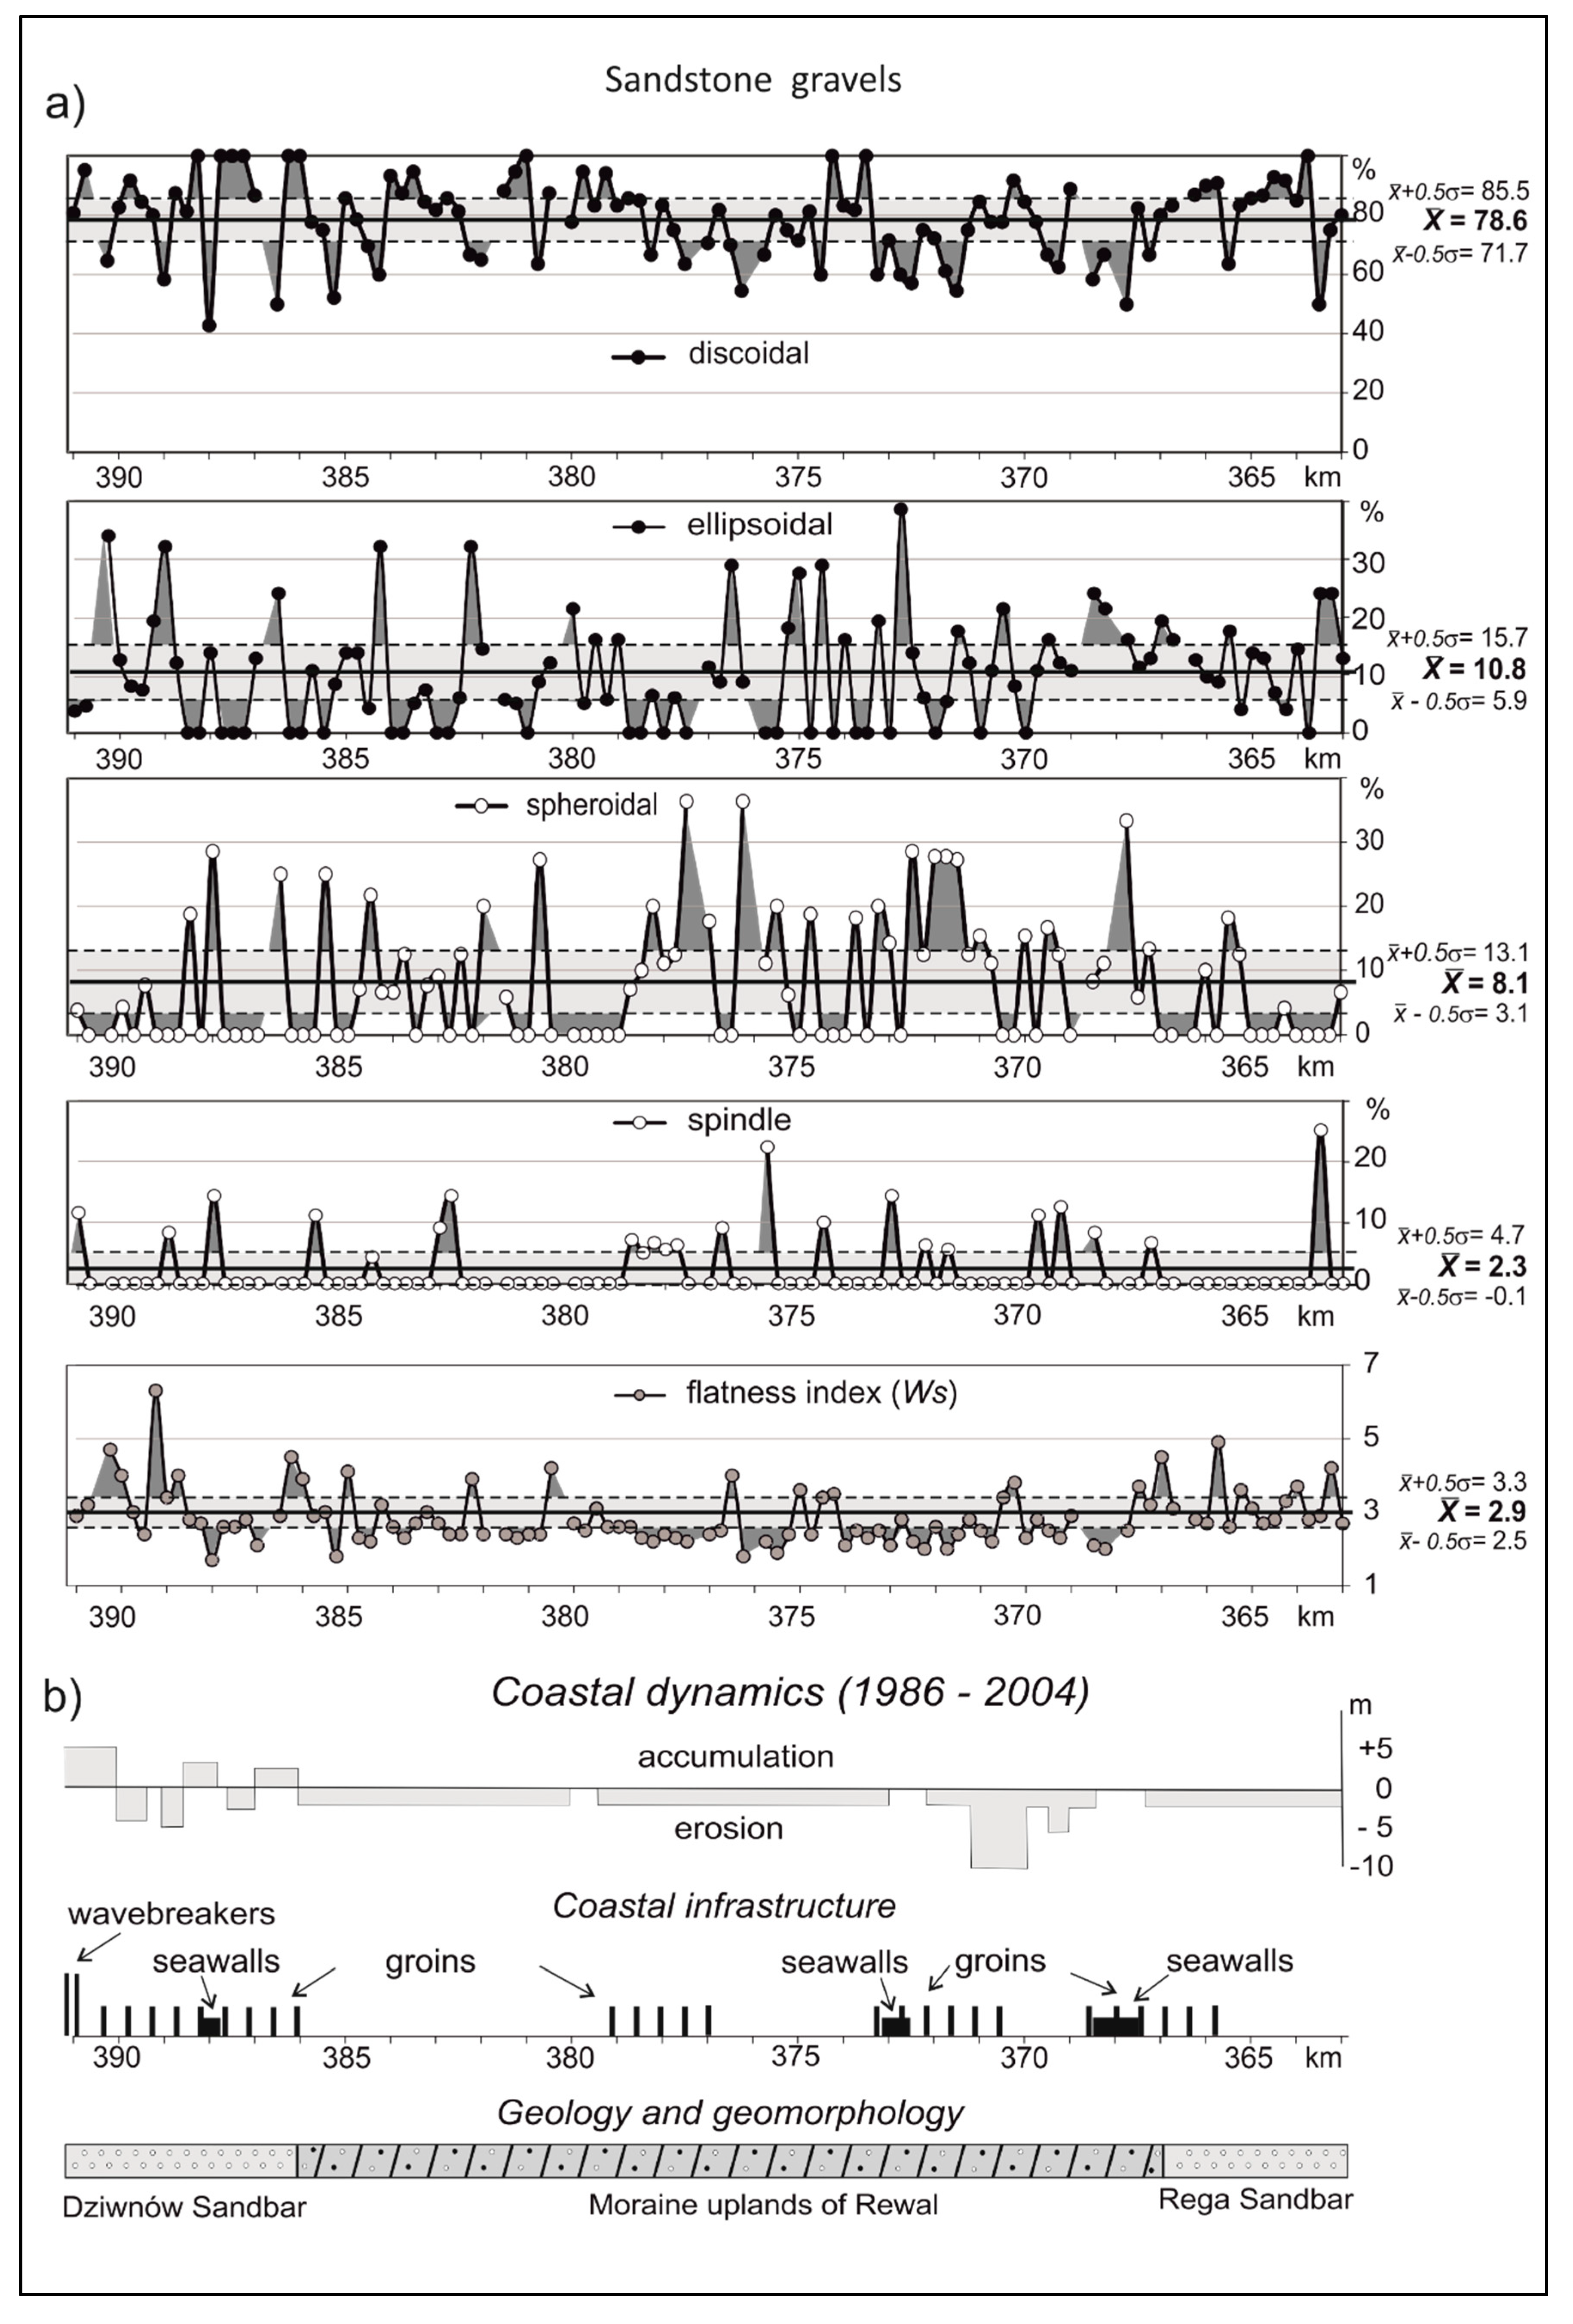
The beach was generally dominated by discoidal gravels, which contributed greatly (78.6%) to the sandstones, as well as the limestones (75.1%), crystalline rocks (72.1%), and other gravel (70.8%). A high content of discoidal pebbles is related to processing intensity during storm events or strong winds, when less resistant gravels are flushed out from the shallow foreshore and partially reworked in the surf zone. The lowest standard deviation (10.1%) was found in the mean contribution of crystalline gravels, and the highest in other gravel (29.7%). Ellipsoid gravels contributed most (22.4%) to the other gravel group, but with the highest standard deviation (26.2%). This is one of the reasons why this group is disregarded in the further discussion on lithodynamics. Ellipsoid gravels contributed 16.3, 10.8, and 9.3% to limestone, sandstone, and crystalline gravels, respectively. The lowest standard deviation was found for the crystalline gravels. Spheroid gravels contributed most (13.7%) to the crystalline rock gravels and least (5.9%) to the limestone gravels. Spindle-shaped gravel grains accounted for 4.6 and 2.3% of the crystalline and sandstone gravels, respectively.
Figure 5,
Figure 6 and
Figure 7a,b illustrate the variability of gravel grain shape in the petrographic groups.
As the discoid gravels contributed most to all of the petrographic groups, they should form the basis for evaluating the sedimentary environment dynamics in the coastal zone between Pogorzelica and Dziwnów. The remaining data should be treated as auxiliary.
The preponderance of subsets containing discoid and ellipsoid gravels, in relation to the values within the standard deviation from the mean for the entire coastal section, is indicative of the domination of accumulation over erosion and redeposition in the individual shore sections. On the other hand, the preponderance of subsets containing spheroid and spindle-shaped grains, compared to the values within the standard deviation from the mean along the section analyzed, points to domination of erosion and redeposition over accumulation (instantaneous deposition).
The contributions of the discoid crystalline gravels above half the standard deviation occur primarily in the western part of the Rega Sandbar (364.5–366.5 km), in the area of a stabilized cliff (379.5–381.5 km), and locally in the area of the Dziwna Sandbar shore armoring (386–391 km). A similar distribution is characteristic of the crystalline ellipsoid gravels. It is only in the Rega Sandbar that higher values occur within 363.0–364.5 km, whereas a very similar distribution is found in the Dziwna Sandbar (
Figure 5a,b).
Contributions of discoid crystalline gravels below half the standard deviation occur mainly in the eroded cliff sections, except for those parts of the cliffs characterized by labile development, and even by dune accretion in front of the cliff. Contributions of ellipsoid gravels less than half of the standard deviation are similar to those of the discoid gravels, except for the areas of the Rega Sandbar and the Dziwna Sandbar (
Figure 5a,b).
Contributions of discoid limestones and sandstones accentuate the preponderance of deposition on sandy spit areas, with certain exceptions, as well as domination of deposition in the cliff section (376.0–382.0 km). The distributions of limestone and sandstone gravels are similar to those of the crystalline gravels, but more visible is their increase in the Rega and Dziwna Sandbars, as well as in the western part of the cliff, less susceptible to erosion processes (
Figure 6 and
Figure 7).
Contributions of spheroid and spindle-shaped gravels above half the standard deviation in all the petrographic groups point to domination of the cliff coast erosion within 367–378 km, and to a labile equilibrium in the western part of the cliff (378–385 km), with a tendency toward stabilization. Contributions below half the standard deviation were found in the Rega Sandbar and, partly, in the Dziwna Sandbar, indicating domination of accumulation over erosion. However, local variation in development trends is visible (
Figure 5,
Figure 6 and
Figure 7).
Increased values of the gravel flatness index (
Ws) provide information on the degree of gravel roundness. The values obtained indicate increased mechanical reworking of gravel grains. The
Ws is related to domination of discoidal and ellipsoidal gravels, and additionally with increased contents of mechanically less resistant rocks. If the
Ws value is low, it means that the gravels are dominated by rounded (spheroidal or ellipsoidal) pebbles; if it is high or extremely high, it means domination by flat nonrounded grains. The flatness index distributions along the shore are shown for different petrographic groups (
Figure 5a,
Figure 6 and
Figure 7a). The crystalline rock gravels are less rounded than the less resistant limestones and sandstones. In the sandbar areas (363–368 km) and in the eastern part of the Dziwna Sandbar (387–391 km), the limestone and sandstone gravels show higher flatness index values (above the mean and half the standard deviation). In the remaining areas, the
Ws were very low (except for a few samples). Other gravels, due to their low abundance, are disregarded, although their
Ws values were similar to those of sandstones and limestones, with a somewhat larger standard deviation from the mean.
The Ws values of limestone and sandstone gravels above half the standard deviation occur on the sandbars and locally in the cliff areas, but only in those at the labile development phase or with domination of sediment accumulation. The lowest values are characteristic of erosion-dominated cliff areas. The flatness index values of crystalline gravels show no particular variability along the coastal section under study. It is only the most eroded cliff section (368–378 km) that shows lower values of the index.
6. Discussion
The analyses showed that the beach gravels collected from Pogorzelica to Dziwnów differed widely in their petrographic composition. The cliff sections of the beach, in labile equilibrium, showed the highest proportion of crystalline rock gravels. Their contribution declined in sections affected by erosion and in the sandbar sections. Limestone gravels dominated in active cliff areas (Niechorze–Pustkowo and Łukęcin–Dziwnówek) and in a part of the Dziwnów Sandbar, indicating increased erosion. Occasionally, their contribution was twice that found in the stable or nonactive cliff sections (e.g., cliff shore in Pobierowo). Attention must be drawn, however, to the eroded foreshore that nourishes the beach, too. Increased reworking of gravel material leaves only the most resistant gravels and their distribution along the shore may be indicative of the direction of the longshore bedload transport.
The direction of the longshore bedload transport in the shore section under study is still unclear. In the 1950s, Zenkowicz [
75] pointed to west-to-east bedload transport. Subsequently, Bączyk [
43] noticed a divergence of the sandy bedload transport off the Pobierowo cliff, eastwards towards the Koszalin Bay and westwards towards the Pomeranian Bay. In his studies of the shallow foreshore, Cieślak [
76] demonstrated the direction and intensity of the sandy bedload transport to be both eastward (measured at Niechorze, 368 km) and westward (measured at the River Dziwna mouth, 391.4 km). In the Niechorze–Dziwnów section, Furmańczyk [
71] showed the locally varying directions of the bedload transport along the shallow foreshore, and associated the variation with cellular currents occasionally producing embayments, as well as larger or smaller cusps. Between Pogorzelica and Dziwnów, channel-like locations termed “underwater circulation gates” were identified [
77]. They distort the bedload transport and serve as outlets allowing export of substantial amounts of material during storms.
In general, the coast sections investigated are affected by long term erosion, which can be seasonally less intensive, or limited by coastal infrastructure (so-called “unstable equilibrium”). Gravel circulation is strongly related to erosion and accumulation (direct deposition), considered as a primary removal of sedimentary material, e.g., from morainic cliff sections, and secondary accumulation directly within the cliff base or shallow nearshore, with no significant mechanical reworking patterns. Redeposition occurs due to secondary movement of this material, mainly resulting from strong wave storms. The same process may be related to erosion of shallow seashore, which remobilizes sedimentary material towards the coastline and partially rounds the gravels.
The contribution of individual petrographic groups does not allow for strictly pinpointing the dominant direction of the bedload transport. The increased proportions of crystalline gravels in the cliff area between Rewal and Łukęcin would be indicative of washing-out of this part of the erosional platform and the deposition of “fresh” gravel material in sandbar–dune areas. This is evidenced by an increased contribution of gravels representing rocks less resistant to destruction, both in the Rega and Dziwna Sandbars.
The longshore distribution of less resistant and more resistant gravels may indicate the absence of any distinct direction of bedload transport along the shore, e.g., from the southwest to the northeast or back. Shoreline armoring (breakwaters, revetments, bulkheads, groins, etc.) significantly limits the unimpeded bedload transport along the shore. Most likely, the most intensive bedload movement proceeds seaward from the shore and back, and it is then that the material is most exposed to destruction. Zones with dominance of crystalline magmatic and metamorphic pebbles may indicate increased redeposition. On the other hand, the increased amount of soft limestones or sandstones may suggest longshore bedload transport (high rate of accumulation). The greater contents of crystalline pebbles found along the cliff bench sections with developed foredunes may indicate a long period of mechanical reworking. Thus, the soft pebbles were mechanically destroyed or chemically dissolved. Additionally, the greater contents of crystalline pebbles may be related to redeposition from cliff sections or shallow foreland.
The increased proportions of discoid and ellipsoid gravel grains and higher flattening indices are indicative of the dominance of material accumulation, and were recorded mainly in the sandbar–dune areas, or in the western part of the cliff shore (378.0–386.0 km). These areas include shore sections with lower proportions of the discoid and ellipsoid gravels, indicative of intensified erosion of the beach. Most likely, this is associated with earlier gravel deposition during periods of strong storms. Shore sections with evidence of accumulation (elevated contributions of discoid and ellipsoid gravels) are separated by sections with lower proportions of these gravels. This is most likely associated with the presence of 100–500 m long cusps and embayments in the shore area discussed. Those cusps and embayments were shown by Furmańczyk to be structures affecting the shore dynamics [
71]. Therefore, areas of increased accumulation may feature sections indicating erosion characterized by erosion–redeposition processes (instantaneous redeposition).
Increased proportions of spheroid and spindle-shaped gravels were found mainly in the eastern part of the cliff shore (368.0–378.0 km), indicating domination of erosion processes and further mechanical reworking of the sedimentary material.
Generally, the lithostatistical data provided indicate increased erosion and redeposition processes occurring in the middle part of coast section studied, which are significantly reduced in the area of Dziwna and Rega Sandbars. The variability of Ws index in the group of limestones indicates low rates of erosion in areas of seawalls and groins, where bedload transport is also significantly reduced, especially between 367–369 km and 387–391 km. The large number of flat and relatively mechanically low resistant gravels, such as limestones and marbles, indicate tendencies of dominating accumulation. These gravels do not experience sufficient time and energy to be rounded. Discoidal or ellipsoidal grains may indicate lower energy and shorter bedload transport.
Elevated contents of spheroidal gravels in the crystalline and limestone groups, visible especially between 370 and 375 km, may be related to increased erosion and material reworking, and disturbed by the presence of seawalls and groins. A similar situation occurs between 374 and 375 km, or in the eastern part Dziwnów embankments, where low number of spheroidal gravels and slightly increased discoidal and ellipsoidal shape indicate low accumulation. The variability of sandstones is comparable, with highest contents of spheroidal pebbles in low erosion sections, and discoidal or ellipsoidal pebbles in areas of increased accumulation.
It must be borne in mind that the coastal zone dynamics pattern presented here, as concluded from the petrographic composition and gravel grain shapes, reflects the post-early-autumn storm conditions. Generally, characteristics indicative of material deposition and redeposition contribute to the developmental trends in the part of the Polish coast studied. Additionally, the results can inform comprehensive coastal protection programs.
