Article

Evaluation of Satellite Rainfall Estimates for Meteorological Drought Analysis over the Upper Blue Nile Basin, Ethiopia

1
Institute of Disaster Risk Management and Food Security Studies, Bahir Dar University, P.O. Box 5501 Bahir Dar, Ethiopia
2
Department of Earth and Planetary Sciences, Johns Hopkins University, Baltimore, MD 21218, USA
3
Department of Geography and Environmental Studies, Bahir Dar University, P.O. Box 79 Bahir Dar, Ethiopia
*
Author to whom correspondence should be addressed.
Geosciences 2020, 10(9), 352; https://doi.org/10.3390/geosciences10090352
Submission received: 16 June 2020 / Revised: 26 August 2020 / Accepted: 31 August 2020 / Published: 4 September 2020

Abstract

:
The objective of this study was to evaluate the performance of satellite rainfall estimates (Climate Hazards Group Infrared Precipitation with Stations version 2 (CHIRPSv2) and Multi-Source Weighted-Ensemble Precipitation version 2 (MSWEPv2) from 1981 to 2018 for monthly meteorological drought analysis over the Upper Blue Nile (UBN) basin. The reference for the performance evaluation was rainfall measured in situ selected with reference to the elevation zones of the basin: Highland, midland, and lowland. Both the measured and estimated rainfall datasets were aggregated by month at a spatial resolution of 10 km × 10 km with a temporal coverage of 38 years from 1981 to 2018 and evaluated with respect to raw precipitation statistics and the standardized precipitation index (SPI). The values of SPI were validated with reference to documented meteorological drought records of the country. The mean bias, correlation coefficient, probability of bias (PBias, %), mean error (ME, mm), and root mean square error (RMSE, mm) values across the elevation zones for CHIRPSv2 were found to be 1.07, 0.91, 6.75, 7.74, and 122.34, respectively. The corresponding values were 1.19, 0.87, 18.56, 19.54, and 130.26 for MSWEPv2. Based on this result, CHIRPSv2 was employed to analyze the magnitude of drought in the different elevation zones of the UBN. The magnitude (SPI) of monthly meteorological drought over the entire UBN basin from 1981 to 2018 ranged from 0 to −3.74. The strongest negative SPI value (−3.74) was observed in August 1984 in midland areas. The highest magnitude of drought was −3.0 in July 2015 over the highland and −3.03 in June 2015 over the lowland during 2014–2017. The observed drought was characterized by extreme, severe, and moderate levels. The mean frequency of severe/extreme meteorological drought in the 38-year period over the highland, midland, and lowland parts of the UBN ranged from 7% to 11%. The average of severe/extreme drought events in each of the elevation zones of the basin was 9%, that is, drought occurred almost every 10 years for all elevation zones of the basin. Over the 38-year period, severe/extreme drought occurred at the onset and/or offset time of rainy season over all elevation zones of the basin. The UBN is characterized as a drought-prone basin. However, the frequency and magnitude of drought could neither be described as a decreasing nor as an increasing linear trend. Thus, the farming practices in the basin need to be enhanced with an improved early warning system and drought-resistant seed technologies.

1. Introduction

Most of the water used in the lowlands between Ethiopia and the Mediterranean Sea originates in the Ethiopian Highlands. The Blue Nile basin alone contributes 60–70% of the water in the River Nile flowing through Sudan and Egypt [1]. According to the authors of [2], in Sudan and Egypt, up to 95% of the water used is blue water from the Nile. Until recently, more than 95% of the agricultural area in the headwaters depended almost exclusively on green water from precipitation [3]. Smallholder-based rainfed agriculture is the backbone of the Ethiopian economy [4]. The effect of climate change is expected to be more severe in developing economies, as their livelihood depends on subsistence-based rainfed agriculture [5]. In this regard, Ethiopia’s economy is subject to the direct impact of climate change and meteorological drought [6,7,8,9]. In Ethiopia, drought is a frequently recurring phenomenon that is often accompanied by serious and diversified impacts on human lives and the environment [10,11]. The authors of [12], in an investigation on country economies versus rainfall deficit, confirmed that national gross domestic product (GDP) consistently depends on rainfall deficit and meteorological drought.
In line with the finings mentioned above, rainfall is one of the most important parameters for the characterization of water cycle and drought. In Africa, the assessment, planning, and management of water resources are often constrained by a lack of reliable rainfall data [8,13]. The density and spatial distribution of rain gauges in the Upper Blue Nile Basin is uneven and time-varying [8,14,15]. To solve problems caused by the shortage of spatiotemporal precipitation data for drought analysis, scientific communities have generated satellite-based products [16,17]. According to the performance assessment study conducted in the last decade in Ethiopia, various researchers have suggested different rainfall products.
The Climate Hazards Group Infrared Precipitation with Stations (CHIRPS) product has been shown to be significantly better than the African Rainfall Climatology version 2 (ARC2) product, having higher skill and low or no bias [18]. CHIRPS was also found to be slightly better than the latest Tropical Applications of Meteorology using Satellite data (TAMSAT) products on monthly timescales. The authors of [8] chose and used the CHIRPS rainfall product to assess the spatial and temporal variability of meteorological drought.
As reported by the authors of [19], event detection showed that Multi-Source Weighted-Ensemble Precipitation (MSWEP) outperformed both adjusted and unadjusted satellite-based products of the Tropical Rainfall Measuring Mission (TRMM) Multisatellite Precipitation Analysis (TMPA), the National Oceanic and Atmospheric Administration (NOAA) Climate Prediction Center (CPC) Morphing Technique (CMORPH), Precipitation Estimation from Remotely Sensed Information using Artificial Neural Networks (PERSIANN), and European Center for Medium-Range Weather Forecast (ECMWF) ERA Interim reanalysis. The MSWEP performed better in rainfall event detection. The authors of [19] performed TMPA, CMORPH, PERSIANN, and ECMWF ERA interim reanalysis and evaluated MSWEP estimates.
The Climate Hazards Group Infrared Precipitation, CHIRPS [16], Multi-Source Weighted-Ensemble Precipitation, MSWEP [17], Climate Prediction Center morphing method, CMORPH [20], Precipitation Estimation from Remotely Sensed Information using Artificial Neural Networks, PERSIANN [21], Tropical Applications of Meteorology Using Satellite Data and Ground-Based Observations, TAMSAT [22], the Tropical Rainfall Measuring Mission, Multisatellite Precipitation Analysis real-time product 3B42RT, TMPA-RT [23], and Global Satellite Mapping of Precipitation, GSMaP [24] are among the sources of multisatellite precipitation products. The unique nature of MSWEPv2 and CHIRPSv2 products is the availability of data since 1979 and 1981, respectively, at high spatial resolution. To date, no research has assessed the performance of the two available satellite-based rainfall products (MSWEPv2 and CHIRPSv2) mentioned above over the various elevation zones of the Upper Blue Nile (UBN) basin in the northwestern highlands of tropical Africa. Accordingly, the objective of the study was to evaluate the performance of satellite rainfall estimates (CHIRPSv2 and MSWEPv2) from 1981 to 2018 in meteorological drought analysis over the various elevation zones of the UBN basin, Ethiopia. The research tried to answer the question: Which satellites rainfall estimates, MSWEPv2 or CHIRPSv2, were more accurate from 1981 to 2018 for meteorological drought analysis over the elevation zones of Upper Blue Nile (UBN)?

2. Materials and Methods

2.1. Background of the Study Area

The UBN basin, locally called Abbay in Ethiopian, is located in the northwestern region of the country within 7.5° to 12° N and 34° to 40° E (Figure 1). The basin contributes a large share of water to the main Nile (above 60% of the Nile total flow) and covers a total area of 176,000 km2 upstream of the Ethiopia–Sudan border [1]. The geological formations of the basin are dominated by volcanic rock and Precambrian basement rock, and small areas are covered by sedimentary rock [1]. Highlands with rugged mountainous areas in the central and eastern part of the basin and the lowlands in the western part of the basin are the two major topographic features. The altitude in the basin ranges from ~490 m above sea level (a.s.l.) in the lowlands (near the Ethio–Sudan border) and up to ~4300 m a.s.l. in the highlands (central part of Ethiopia). The dominant soil types in the UBN are leptosols, alisols, nitosols, vertisols, and cambisols [25]. Dry land crop, pastures, savannah, grassland, woodland, water bodies, and sparsely vegetated plants [26,27] dominate the land cover in the UBN.
The annual rainfall of the UBN basin is estimated as 787–2200 mm. The UBN basin is characterized by bimodal rainfall seasons, locally called Belg and Kiremit. Belg is a short rainfall season from March to May, whereas Kiremit is the main rainfall season from June to September [28]. Following the seasonality of the rainfall, 82% of the annual flow occurs during the main rainy season in June to September [28]. The average temperature in the basin is 21 °C [29].

2.2. The Dataset

2.2.1. Satellite Rainfall Estimates

(1) Multi-Source Weighted-Ensemble Precipitation Version 2 (MSWEPv2)
As described by the authors of [17], MSWEPv2 is a fully global, historic precipitation dataset (1979–present) with a three-hour temporal and 0.1° (~11 km at the equator) spatial resolution. This satellite rainfall is produced from satellite estimates, reanalysis data sources, and gridded gauge. It is validated at the global scale using observations from ~70,000 gauges and hydrological modeling for ~9000 catchments, with daily gauge corrections.
As stated by the authors of [30], MSWEPv1 relies exclusively on reanalysis and gauge data during the pre-TRMM era (before 1998). For MSWEPv2, the reanalysis and gauge data were supplemented with rainfall estimates based on cloud-top IR temperatures during the pre-TRMM era to improve the accuracy in convection-dominated regions. The authors of [17] identified the following several unique aspects of the product: (i) Full global coverage, including all land and oceans (most satellite-based datasets are limited to 50° or 60° latitude); (ii) high spatial (0.1°) and temporal (three-hour) resolution, increasing the local relevance of the precipitation estimates; (iii) optimal merging of a wide range of gauge, satellite, and reanalysis precipitation datasets to obtain the best possible P estimates at any location; (iv) correction for distributional biases to eliminate spurious drizzle and restore attenuated peaks; (v) correction of systematic terrestrial P biases due to gauge undercatch using observed river discharge from 13,762 catchments worldwide; (vi) corrections using daily observations from 76,747 gauges across the globe; and (vii) a gauge correction scheme that accounts for gauge reporting times.
(2) Climate Hazards Group InfraRed Precipitation version 2 (CHRIPSv2)
The Climate Hazards Group Infrared Precipitation (CHIRP) and CHIRP, combined with station observations (CHIRPS), are recently produced satellite-based rainfall products with relatively high spatial and temporal resolutions and quasi-global coverage [18]. As described by the authors of [16], CHIRPS represents 35+ years of quasi-global geostationary thermal infrared (TIR) satellite observations. It spans 50° S–50° N (and all longitudes). CHIRPS incorporates in-house climatology, Climate Hazards Center’s Precipitation Climatology (CHPclim), 0.05° resolution satellite imagery, and in situ station data to create gridded rainfall time series for trend analysis and seasonal drought monitoring. The satellite rainfall estimates were produced by the Climate Hazards Center of the Department of Geography of the University of California Santa Barbara in collaboration with the United States Geological Survey (USGS) EROS Center. The estimates focused on combining models of terrain-induced precipitation enhancement with interpolated station data. Recently, new observations such as gridded satellite-based precipitation estimates from NASA and NOAA have been leveraged to build high-resolution (0.05°) gridded precipitation climatologies.
The retrieval algorithm of CHIRPS (i) is built around a 0.05° climatology that incorporates satellite information to represent sparsely gauged locations; (ii) incorporates pentad, and monthly data from 1981 to present a spatial resolution with a grid size of 0.05°. Cold Cloud Duration (CCD)–based precipitation estimates (i) blend station data to produce a preliminary information product with a latency of about two days and a final product with an average latency of about three weeks, and (ii) use a novel blending procedure incorporating the spatial correlation structure of CCD–estimates to assign interpolation weights. Version 2.0 of CHIRPS was completed and made available to the public as of 12 February 2015 [16].
A summary of the descriptions of the two rainfall products is presented in Table 1. In the current study, the monthly rainfall products of MSWEP v2 and CHIRPS v2 with a spatial resolution of 0.1° (~11 km) grid size and monthly time scale for the period 1981–2018 were examined.

2.2.2. Observed Dataset

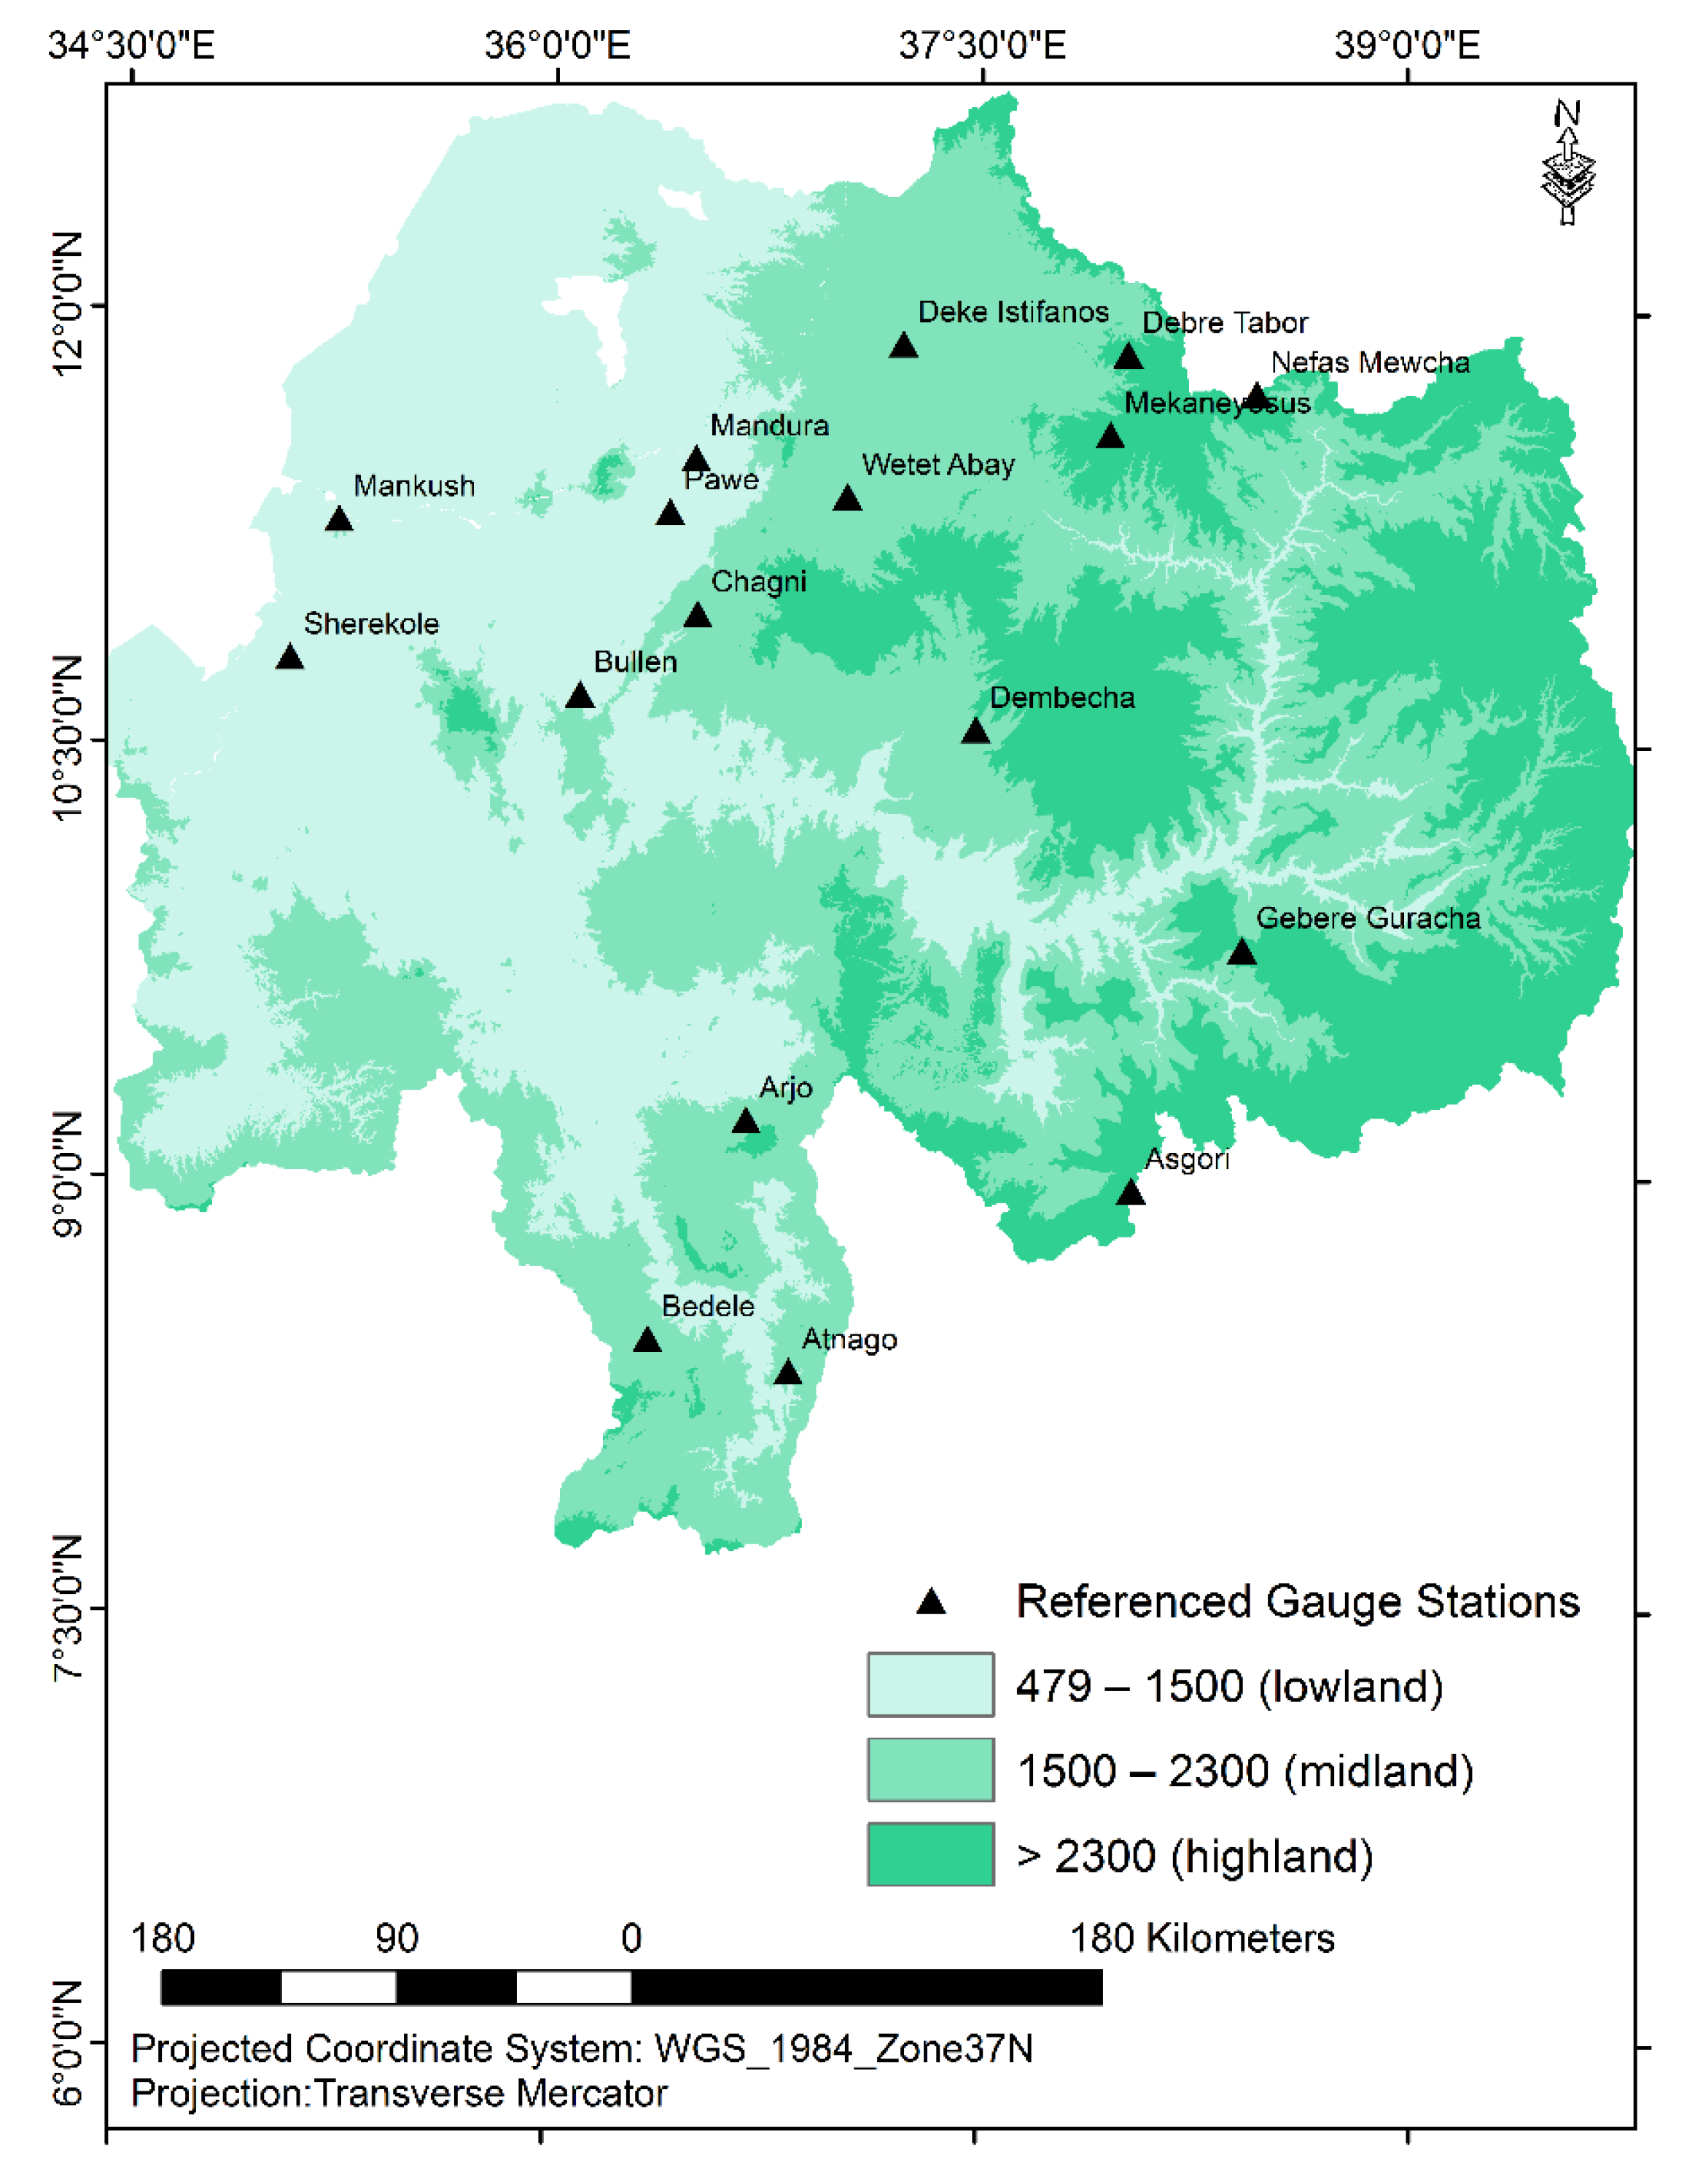
The observed dataset was used as a reference to validate the performance of satellite rainfall estimates. The spatial distribution of the gauge stations that were used in the current study is presented (Figure 2). As stated by the authors of [15], the Ethiopian National Meteorological Agency (NMA) performs routine quality checks for the data in their archives. The NMA has recently updated its station coordinates using GPS. However, we found a mismatch among a few reported GPS readings. Additional quality checks such as identifying suspicious rainfall values were completed. The most challenging and time-consuming task was ensuring the accuracy of station coordinates.

2.3. Performance Evaluation of Satellite Rainfall Estimates

The gauge stations selected as a reference for the performance evaluation were assumed to represent the traditional agroclimatic zones of the UBN (Figure 2). The three major zones of the UBN are as follows: Lowland (warm semiarid) ranges from 500 m a.s.l. to 1500 m a.s.l. with an average temperature of 27.5 °C, midland (cool subhumid) ranges from 1500 m a.s.l. to 2300 m a.s.l. with an average temperature of 20 °C, and highland (cool and humid) ranges from 2300 m a.s.l. to 3200 m a.s.l. with an average temperature of 17.5 °C. The same zonation was used to select grid cells of satellite estimates to run the performance evaluation. The summer season was the focus of the study due to the fact that the season has the majority of rainy time for cereal crop production in the study basin. The Pearson correlation coefficient (r), bias, probability of bias (PBias), mean error (ME), and root mean square error (RMSE) were the pairwise comparison statistics techniques that were employed in the process of evaluating the performance of satellite rainfall estimates of CHIRPSv2 and MSWEPv2. The description of the comparison statistics employed in the current study is presented in Equations (1)–(5). The same techniques were employed as in previous scientific papers [8,18,19,31].
r is used to measure the goodness of fit and linear association between two variables. It measures the linear association and how well the satellite rainfall product corresponds to the observed rainfall (Equation (1)). Its value ranges between −1 to 1, where 1 indicates a perfect score.
r   =   ( O   S ¯ ) ( S   S ¯ ) ( O   O ¯ ) 2   ( S   S ¯ ) 2
where r is the correlation coefficient, O is the gauge rainfall measurement, O ¯ is the average gauge rainfall measurement, S is the satellite rainfall estimate, S ¯ is the average satellite rainfall estimate, and n is the number of data pairs.
Bias reflects how well the mean of the satellite rainfall corresponds with the mean of the observed rainfall (Equation (2)). A bias value closer to 1 indicates that the cumulative satellite rainfall estimate is closer to the cumulative observed rainfall. A bias value of 1 is a perfect score. The bias ratio is an error metric measuring the systematic error component with a perfect score of 1, whereas a value less or greater than 1 shows underestimation and overestimation, respectively. The probability of bias (PBias) is defined in Equation (3).
Bias   = S O  
where S is the mean of the satellite estimate, and O is mean of the observed rainfall.
PBias   =   ( S O ) O × 100 %
where PBias is the probability of bias, S is mean of the satellite estimates, and O is mean of the observed rainfall.
ME (mm) estimates the average error (Equation (4)). A positive value indicates an overestimate of the satellite rainfall, whereas a negative value indicates an underestimate as compared to the observed rainfall. An ME value of zero is a perfect score.
ME   =   1 N ( S O )
where ME is the mean error in mm, O is the gauge rainfall measurement, and S is the satellite rainfall estimate.
RMSE (mm) was used to measure the average magnitude of the estimated errors between the satellite rainfall and the observed rainfall (Equation (5)). A lower RMSE value means greater central tendencies and small extreme error. An RMSE value of zero is a perfect score.
RMSE   =   1 n ( S O ) 2
where RMSE is the root mean square error in mm, O is the gauge rainfall measurement, and S is the satellite rainfall estimate.
As a measure of goodness-of-fit, coefficient of model accuracy (CMA) and alternative coefficient of model accuracy (ACMA) comprise the product of nonparametric sample correlation and model bias [32]. Accordingly, newly introduced goodness-of-fit metrics were also employed in the current study (Equations (6a)–(6b)). The value of CMA and ACMA varied over the range 0–1. CMA or ACMA equal to one indicates a perfect model (no errors). However, CMA equal to zero indicates that the model is not better than the comparison baseline (such as the mean of observed data).
CMA   =   f × β × θ
ACMA   =   f × λ × θ
where CMA is the coefficient of model accuracy, f is the normalized trend slope, β is beta, θ is the theatre. Beta is a measure of covariation of the two series being compared. Theatre is the measure of the differences between the squared means of observed and modeled series. Lamda is the measure of the differences between the squared standard deviations of observed and modeled series.

2.4. Meteorological Drought Index

The Standardized Precipitation Index (SPI) was first presented to the international scientific community by the authors of [33]. This index is one of the most widely used meteorological drought indicators across the world [34,35,36,37]. According to the report by the authors of [38], SPI is widely used for monitoring Eastern African droughts because it is more easily adapted to the local climate, has modest data requirements, can be computed for at almost any time scale, has no theoretical upper or lower bounds, and is easy to interpret. By identifying SPI as an index for broad use, the World Meteorological Organization (WMO) provided direction for countries aiming to establish a level of early warning for drought. In terms of its effectiveness, the WMO recommended SPI for member countries as it is the best drought index [36]. For meteorological drought, the SPI is a highly valuable estimator of drought severity [39]. The authors of [38] recommended SPI for Eastern African countries. The authors of [40] also suggested SPI for drought assessment.
The SPI index is a probability (statistical) index that provides a representation of abnormal wetness and dryness on a given timescale from the long-term average precipitation. This index can be calculated on as little as 20 years of data, but ideally, the time series should have a minimum of 30 years of data, even when missing data are considered. The index can track drought on multiple timescales, including 1, 3, 6, 9, and 12 months. The SPI methodology does not change whether using daily, weekly, or monthly data [33]. In the case of the current study, the timescale was limited to one month because the study was conducted in a basin where the single-season cereal crop production is the mainstay of the economy. These crops are grown during the 3–4 month rainy season [28], and during this period, it is recognized that drought on the order of 4 weeks duration at any stage of the crops’ growth can have an adverse effect on crop yield.
The SPI gives the number of standard deviations by which the observed value would deviate from the long-term mean for a normally distributed random variable [33,41]. The SPI calculation involves the selection of a distribution model that fits best with the season to be studied. The commonly used statistical probability distributions are gamma, normal, and log-Pearson [42]. Gamma distribution is often used when calculating the SPI [33,41,43,44] because it has a lower bound at zero, which agrees with the observed distribution. The gamma distribution fitted the rainfall record well in the majority of the stations in Ethiopia [45]. Accordingly, the gamma distribution was used in the current study (Equations (7a)–(7c)). Details on how to run the gamma distribution are presented by the authors of [41,45]. Overall, this standardization provides the advantage of consistent values in space and time for the frequency of extreme dry and wet events.
As stated by the authors of [41], the gamma distribution is defined by its frequency or probability density function:
g ( x )   =   1 β o   r ( a )   x a 1 e x β ,   f o r   X > 0
where a and β are the shape and scale parameters, respectively; x is the precipitation amount; and Γ(a) is the gamma function. Parameters α and β of the gamma probability density function (pdf) were estimated for each station and for each time scale of interest (1, 3, 6, 9, 12 months, etc.). The maximum likelihood estimations of α and β are:
a   =   1 4 A   ( 1 + 1 + 4 A 3   ) , β   =   x ¯ a   ,   where   A   =   l n ( x ¯ ) l n ( x ) n
where n is the number of observations and ln is the natural logarithm function. The resulting parameters were then used to find the cumulative probability of an observed precipitation event for the given month and time scale for the location in question. Since the gamma function is undefined for x = 0 and a precipitation distribution may contain zeros, the cumulative probability (the value of SPI) becomes:
H ( x )   =   q + ( 1 q ) G ( x )
where q is the probability of zero precipitation and G(x) is the cumulative probability of the incomplete gamma function. If m is the number of zeros in a precipitation time series, then q can be estimated by m/n. The cumulative probability H(x) is then transformed to the standard normal random variable z with mean zero and variance of one, which is the value of the SPI.
For this study, to assess the drought over the UBN, sample grid data were extracted from relatively accurate rainfall estimates. At this point, it would be possible to employ both rainfall estimates for meteorological drought assessment. The sample grids were selected based on their geographic location. Whether highland, midland, or lowland, geographic location was considered. The number of points considered at each elevation were six, seven, and seven in the highland, midland, and lowland respectively. The value of a point/grid refers to mean value of 3 × 3 pixels. The SPI index was computed employing (Equations (7a)–(7c)) with the help of Drought Indices Calculator version 2 (DrinCv2). DrinCv2 is a software package developed for computing drought indices including SPI. Its application in several locations, especially in arid and semi-arid regions, shows that it is a useful research tool [41]. In the current study, the SPI of all elevation zones was analyzed separately following all the procedures required by the software.
As stated by the authors of [33], based on SPI values, meteorological droughts are classified into levels of magnitude: extreme, severe, moderate, near normal/mild, and no drought (Table 2).
The ratio of the number of severe/extreme meteorological drought months over the 38-year period to the total number of given rainy months over the period was calculated to obtain the value of the frequency of severe/extreme meteorological drought (Equation (8)). The frequency (%) of drought was analyzed by month over the highland, midland, and lowland elevation zones of the UBN basin in the period of 1981–2018:
Pi   =   ( n N ) × 100 %
where Pi is a grid within the region, n is the number of drought months over a given years, and N is the length of the data series or the number of rainy months over a given year.
The performance of the SPI (rainfall deficit) was evaluated with respect to documented historic drought events. The information on historic droughts considered in this study was reviewed from previous published articles [7] and the Emergency Events Database (EM–DAT) International Disaster Database, Centre for Research on the Epidemiology of Disasters (CRED) [46].
Mapping SPI Values: Assuming that meteorological droughts are regional in nature and commonly cover large areas, the properties of regional meteorological droughts can be studied by analyzing the spatial pattern of at-site (point) droughts [47,48]. Considering the presence of climate change and variability, mapping the most recent spatial distribution of drought was assumed to be more useful for agricultural development practices. In this regard, we considered sample grid (point) values of SPI extracted in the elevation zone of the basin to index and map the magnitude of the meteorological drought that occurred from 2014 to 2017. The value of a point/grid refers to mean value of 3 × 3 pixels. In addition to elevation, the sample grids were extracted to capture the possible effect of direction on the spatial distribution of meteorological drought over the basin.
SPI is all about measuring the abnormal dryness/wetness of a given specific place at a specific time. Please note that to detect the correct mean SPI (drought months), it was essential to exclude values with nondrought seasons/months. Thus, if we aggregated the value of SPI for the whole study period, it would not possible to show months/seasons that could face extreme/severe meteorological drought. In relative terms, various corners of the basin experienced severe drought in 2014–2017. At the same time, this period could show us the most recent drought phenomenon over the basin.

3. Results and Discussions

3.1. Performance Evaluation of the Satellite Rainfall Estimates

The mean values of the bias, r, PBias (%), ME (mm), and RMSE (mm) for CHIRPSv2 over the all elevation zones of the UBN were found to be 1.07, 0.91, 6.75, 7.74, and 122.34, respectively. These values were 1.19, 0.87, 18.56, 19.54, and 130.26 for MSWEPv2 (Table 3 and Table 4). The values of the indicated parameters were 0.78–1.36, 0.82–0.97, −20.63 to 36.21, 0.24–31.04, and 54–186 for CHIRPSv2, respectively. Similarly, the values of the indicated parameters were 0.83–1.56, 0.78–0.95, −16.89–59.76, 18.01–74.12, and 79.61–198.14 for MSWEPv2, respectively. Relatively, compared to other parameters, the bias values of both products in the highland, midland, and lowland elevation zones were found to be close. Similarly, closer RMSE values were observed in the highland part of the basin for both products. In relative terms, mean values of under-estimation were observed in the highland elevation zone for CHIRPSv2. The performance evaluation of the satellite rainfall estimates for each parameter is presented below.
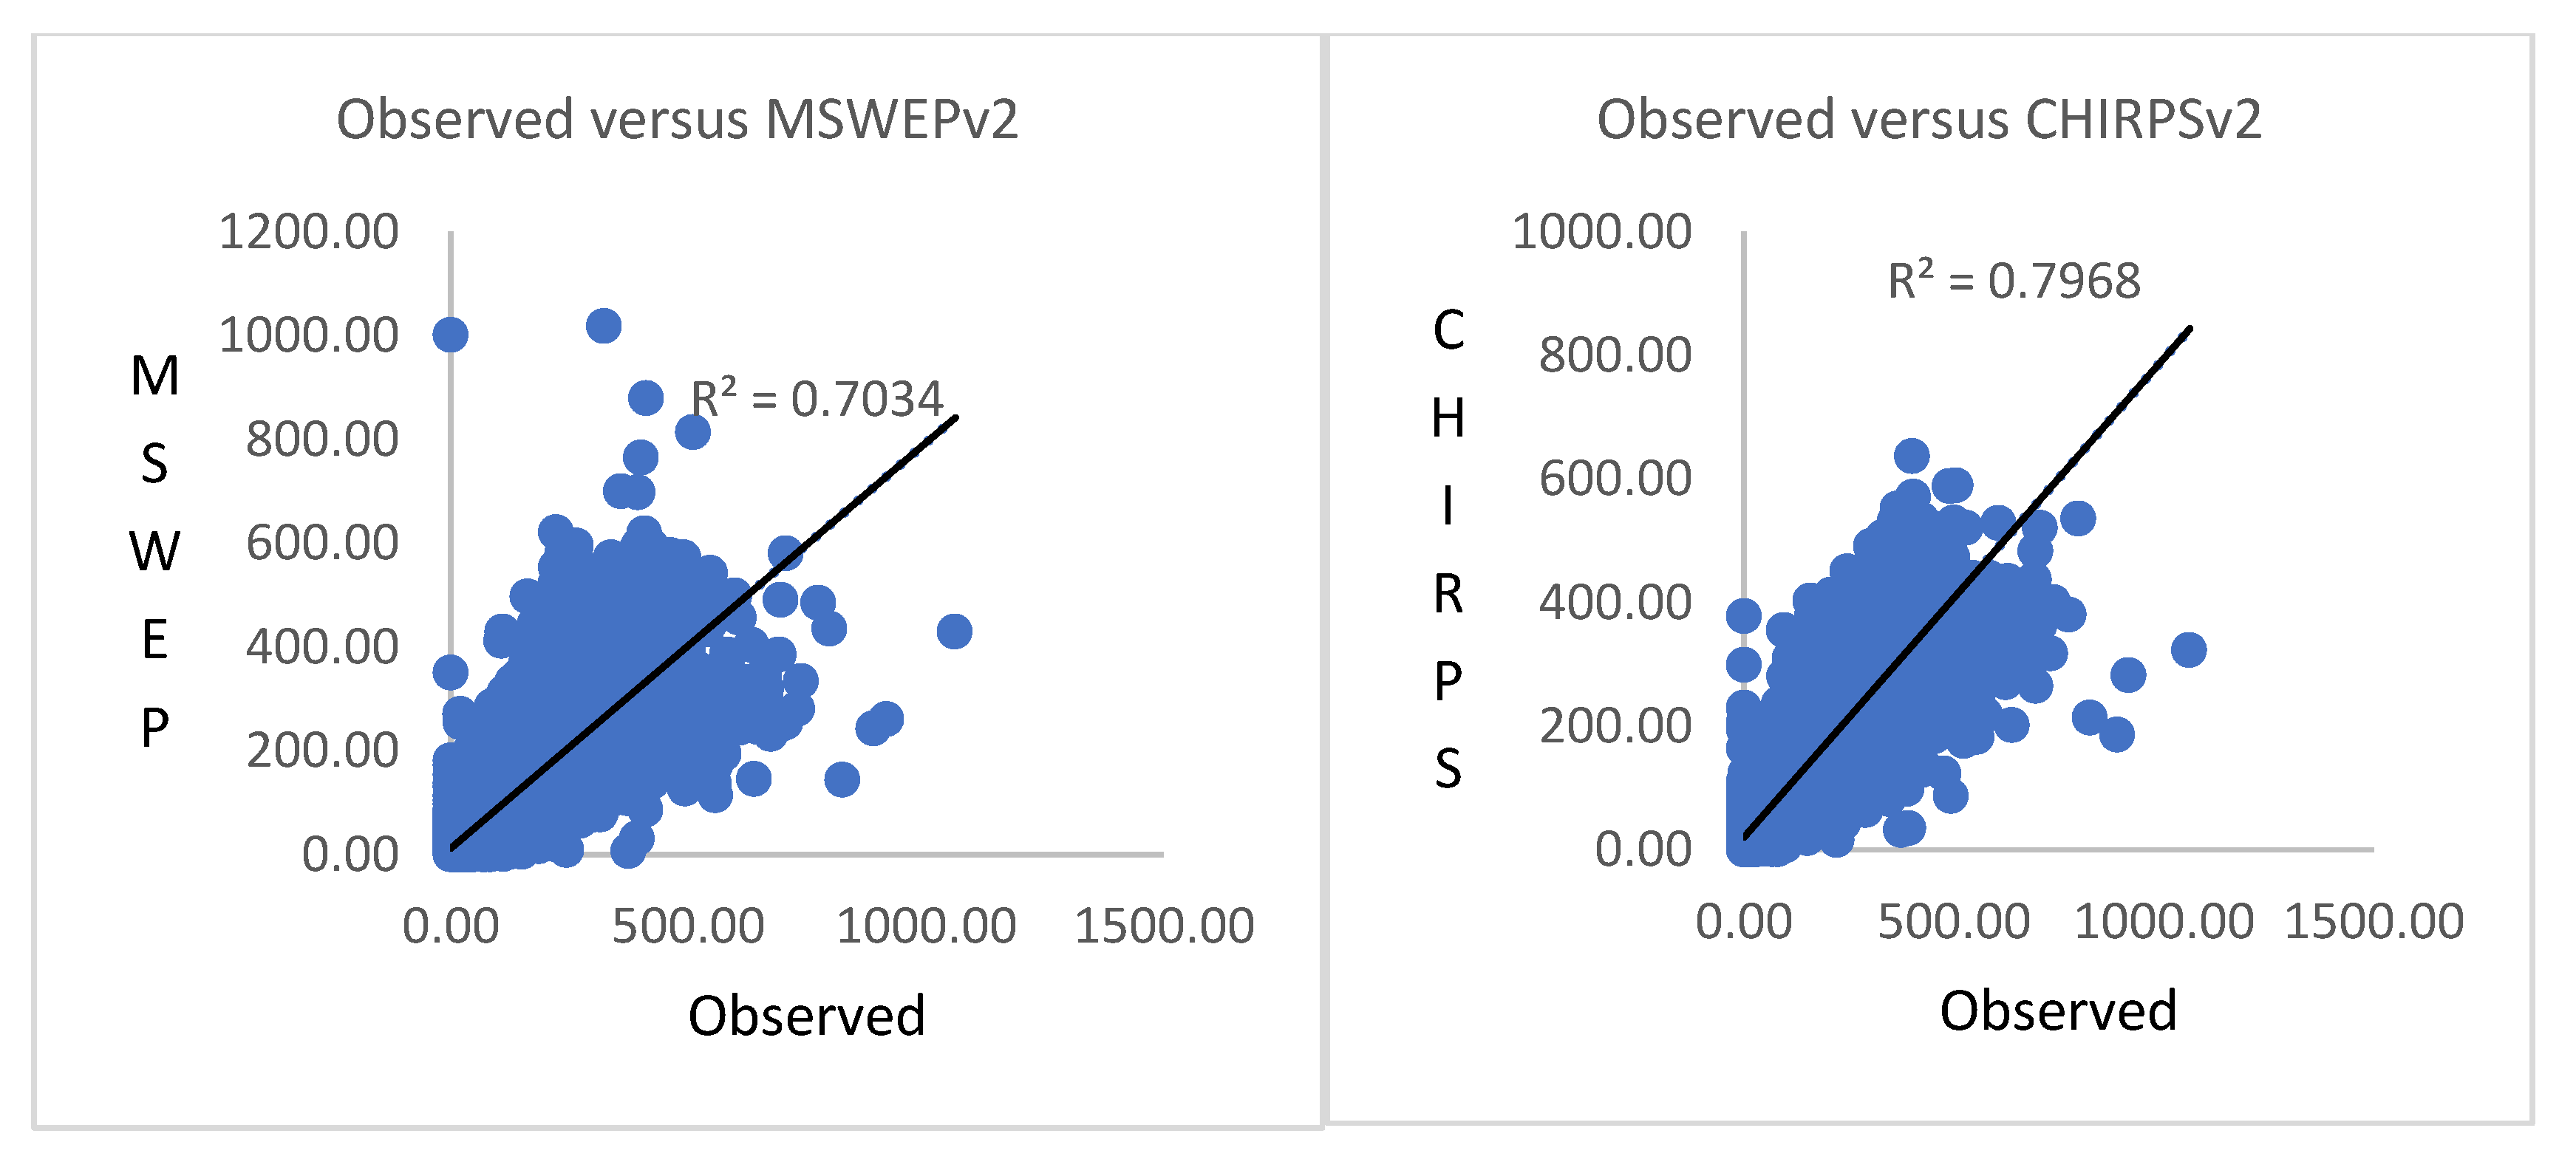
Correlation coefficient (r): The mean value of r across the elevation zones of the UBN were 0.90–0.92 and 0.86–0.88 for CHIRPSv2 and MSWEPv2, respectively. The mean r values of CHIRPSv2 and MSWEPv2 were found to be 0.91 and 0.87, respectively. The value of r did not show a meaningful difference across the highland, midland, and lowland parts of the UBN for CHIRPSv2 and MSWEP v2 products. The mean value of r was nearly equivalent to the perfect score in both CHIRPSv2 and MSWEPv2, that is, the presence of a linear association between the measured and estimated rainfall datasets was observed. However, in relative terms, CHIRPSv2 showed a better performance in the case of UBN. As presented in the scatterplot (Figure 3), the value of R–Squared (R2) was higher in the case of CHIRPSv2. Similarly, the value of CMA and ACMA became 0.6 and 0.71, respectively, for CHIRPS, whereas the values were 0.63 and 0.58 for MSWEP. Accordingly, CHIRPS could be taken as a relatively perfect model.
Bias: The mean bias values of CHIRPSv2 and MSWEPv2 for the different elevation zones of the UBN were 0.97–1.13 and 1.15–1.20, respectively. The mean bias values of CHIRPSv2 and MSWEPv2 were found to be 1.07 and 1.19, respectively, where a value less than one shows underestimation, a value greater than one shows overestimation, and the perfect value is one. The bias value indicated the presence of almost the same level of error across the highland, midland, and lowland parts of the UBN for both rainfall estimates. The mean values of PBias (%) of the two products were 6.75 and 18.56, respectively. The mean value of bias was near to the perfect score in both CHIRPSv2 and MSWEPv2, that is, the mean of the satellite rainfall corresponded with the mean of the observed rainfall. In other words, the cumulative satellite rainfall estimate was found to be close to the cumulative observed rainfall. However, in relative terms, CHIRPSv2 performed better for the UBN. Similarly, the authors of [18] found that the CHIRPSv2 product showed low or no bias.
ME (mm): The mean values of ME ranged from −3.74 to 13.99 and −14.72 to 25.52 across the elevation zones for CHIRPSv2 and MSWEPv2, respectively. The result showed the presence of over- and underestimation for both products. The average ME values of CHIRPSv2 and MSWEPv2 were found to be 7.74 and 19.54, respectively. The ME value showed the presence of almost the same level of error across the highland, midland, and lowland parts of the basin for both rainfall estimates. However, in contrast to MSWEPv2, a mean value of ME and PBias indicating underestimation was observed in the highland part of the basin for CHIRPSv2. Both products showed overestimation according to the average ME values. However, in relative terms, CHIRPSv2 showed a better performance in the case of the UBN.
RMSE indicates the random error component. The mean values were 97.20–145.98 and 79.61–198.14 across the elevation zones for CHIRPSv2 and MSWEPv2, respectively. The mean RMSE values of CHIRPSv2 and MSWEPv2 were found to be 122.34 and 130.26, respectively. The mean RMSE value revealed the presence of almost the same level of error across the highland, midland, and lowland parts of the basin for both rainfall products. The result shows the presence of a lower-level magnitude of the estimated errors between the satellite rainfall and the observed rainfall, and greater central tendencies and small extreme error for CHIRPSv2 in the case of the UBN. Overall, CHIRPSv2 was found to be superior to MSWEPv2 with respect to essential parameters of performance assessment. Above all, the ME and RMSE between the satellite rainfall and the observed rainfall were smaller in the case of CHIRPSv2. In accordance with the result of the current study, the existence of a good agreement between the weather stations and satellite estimates over the UBN was reported by the authors of [8,19] for CHIRPSv2 and MSWEPv2 products, respectively. Similar to the results found by the authors of [8,18], the existence of a good agreement between the weather stations and satellite estimates over Eastern Africa was found. As a result, the current study used CHIRPSv2 to analyze the magnitude of monthly meteorological drought in the last 38 years over the UBN. Consistent with the current study, the authors of [8] reported that CHIRPS could be used as a source of information in developing the grid-based drought monitoring tools for the basin that could help in developing early warning systems.

3.2. Meteorological Drought in the UBN Basin

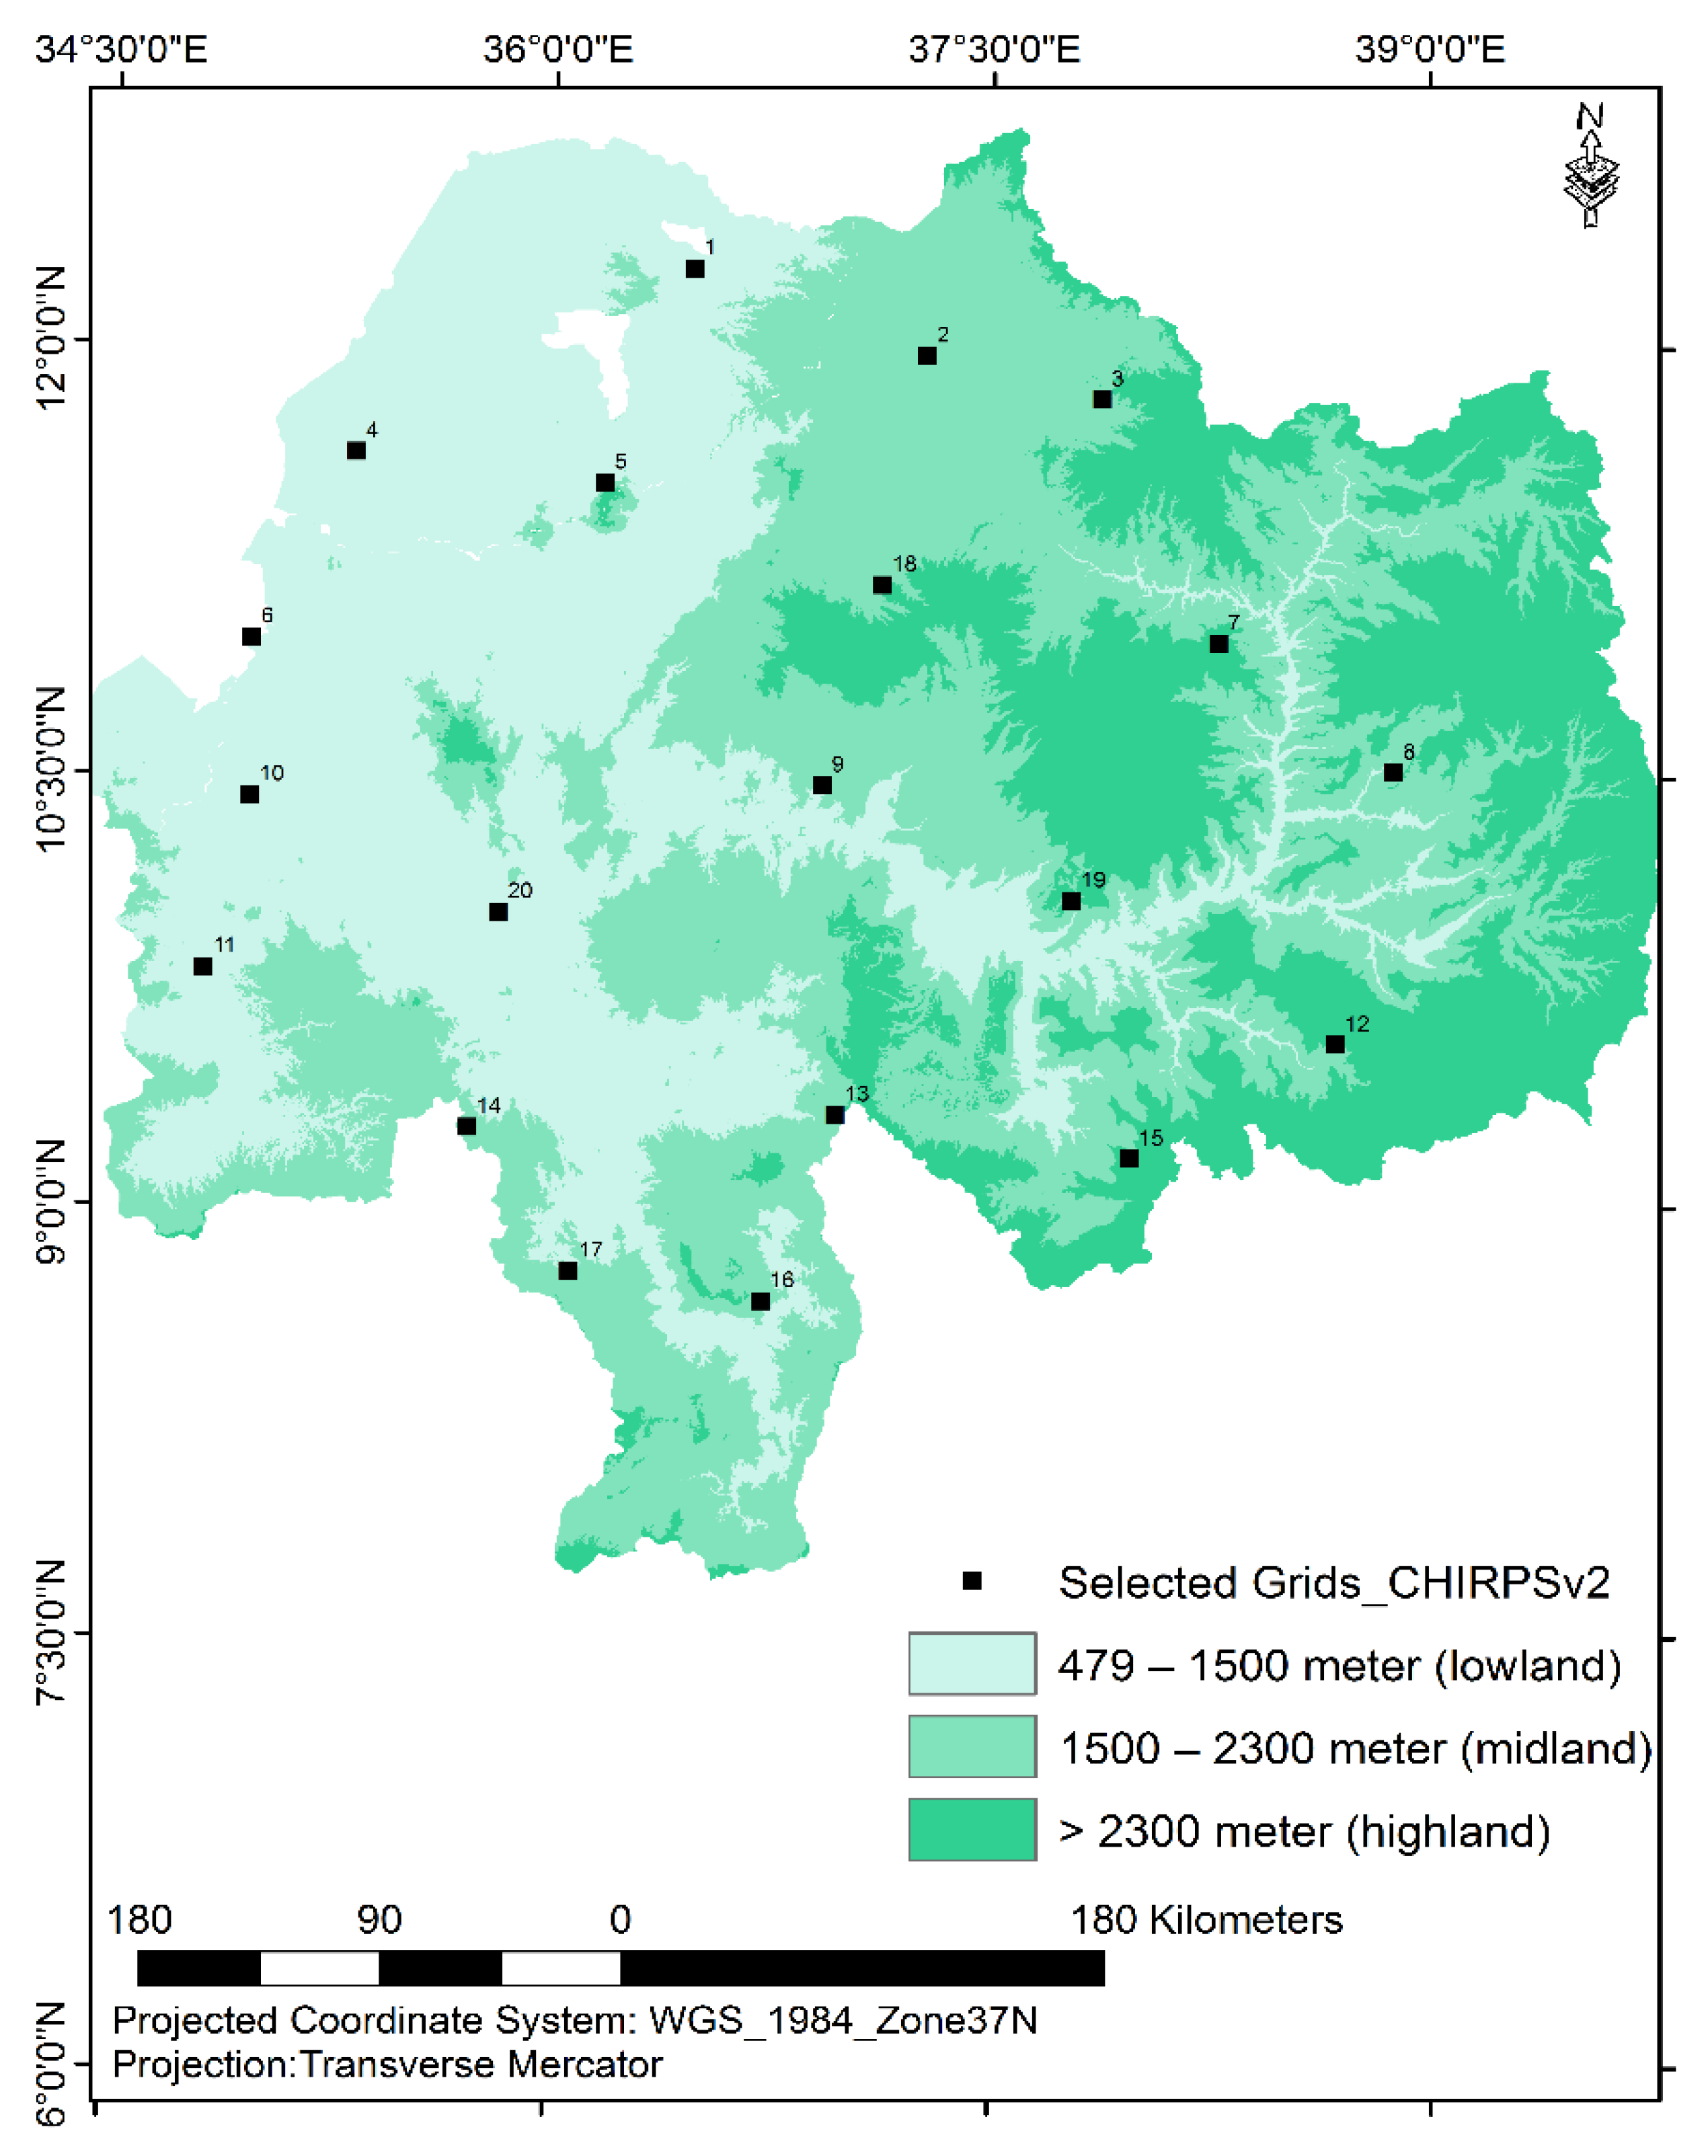
According to the result of the current study, CHIRPSv2 was found to present a relatively more accurate satellite estimate of monthly rainfall in the case of the UBN basin. Thus, the monthly rainfall estimate of CHIRPSv2 was used to analyze the magnitude (SPI) and frequency of meteorological drought in the last 38 years over the highland, midland, and lowland elevation zones of the basin. At this point, it is necessary to note that employing the other rainfall estimate for drought analysis in the basin may not result in a significant difference. The spatial distribution of grids (CHIRPSv2) extracted from the elevation zones of the basin to analyze the meteorological drought over the UBN is shown (Figure 4). The sample grids were selected based on their geographic location. Whether highland, midland, or lowland, geographic location was considered.
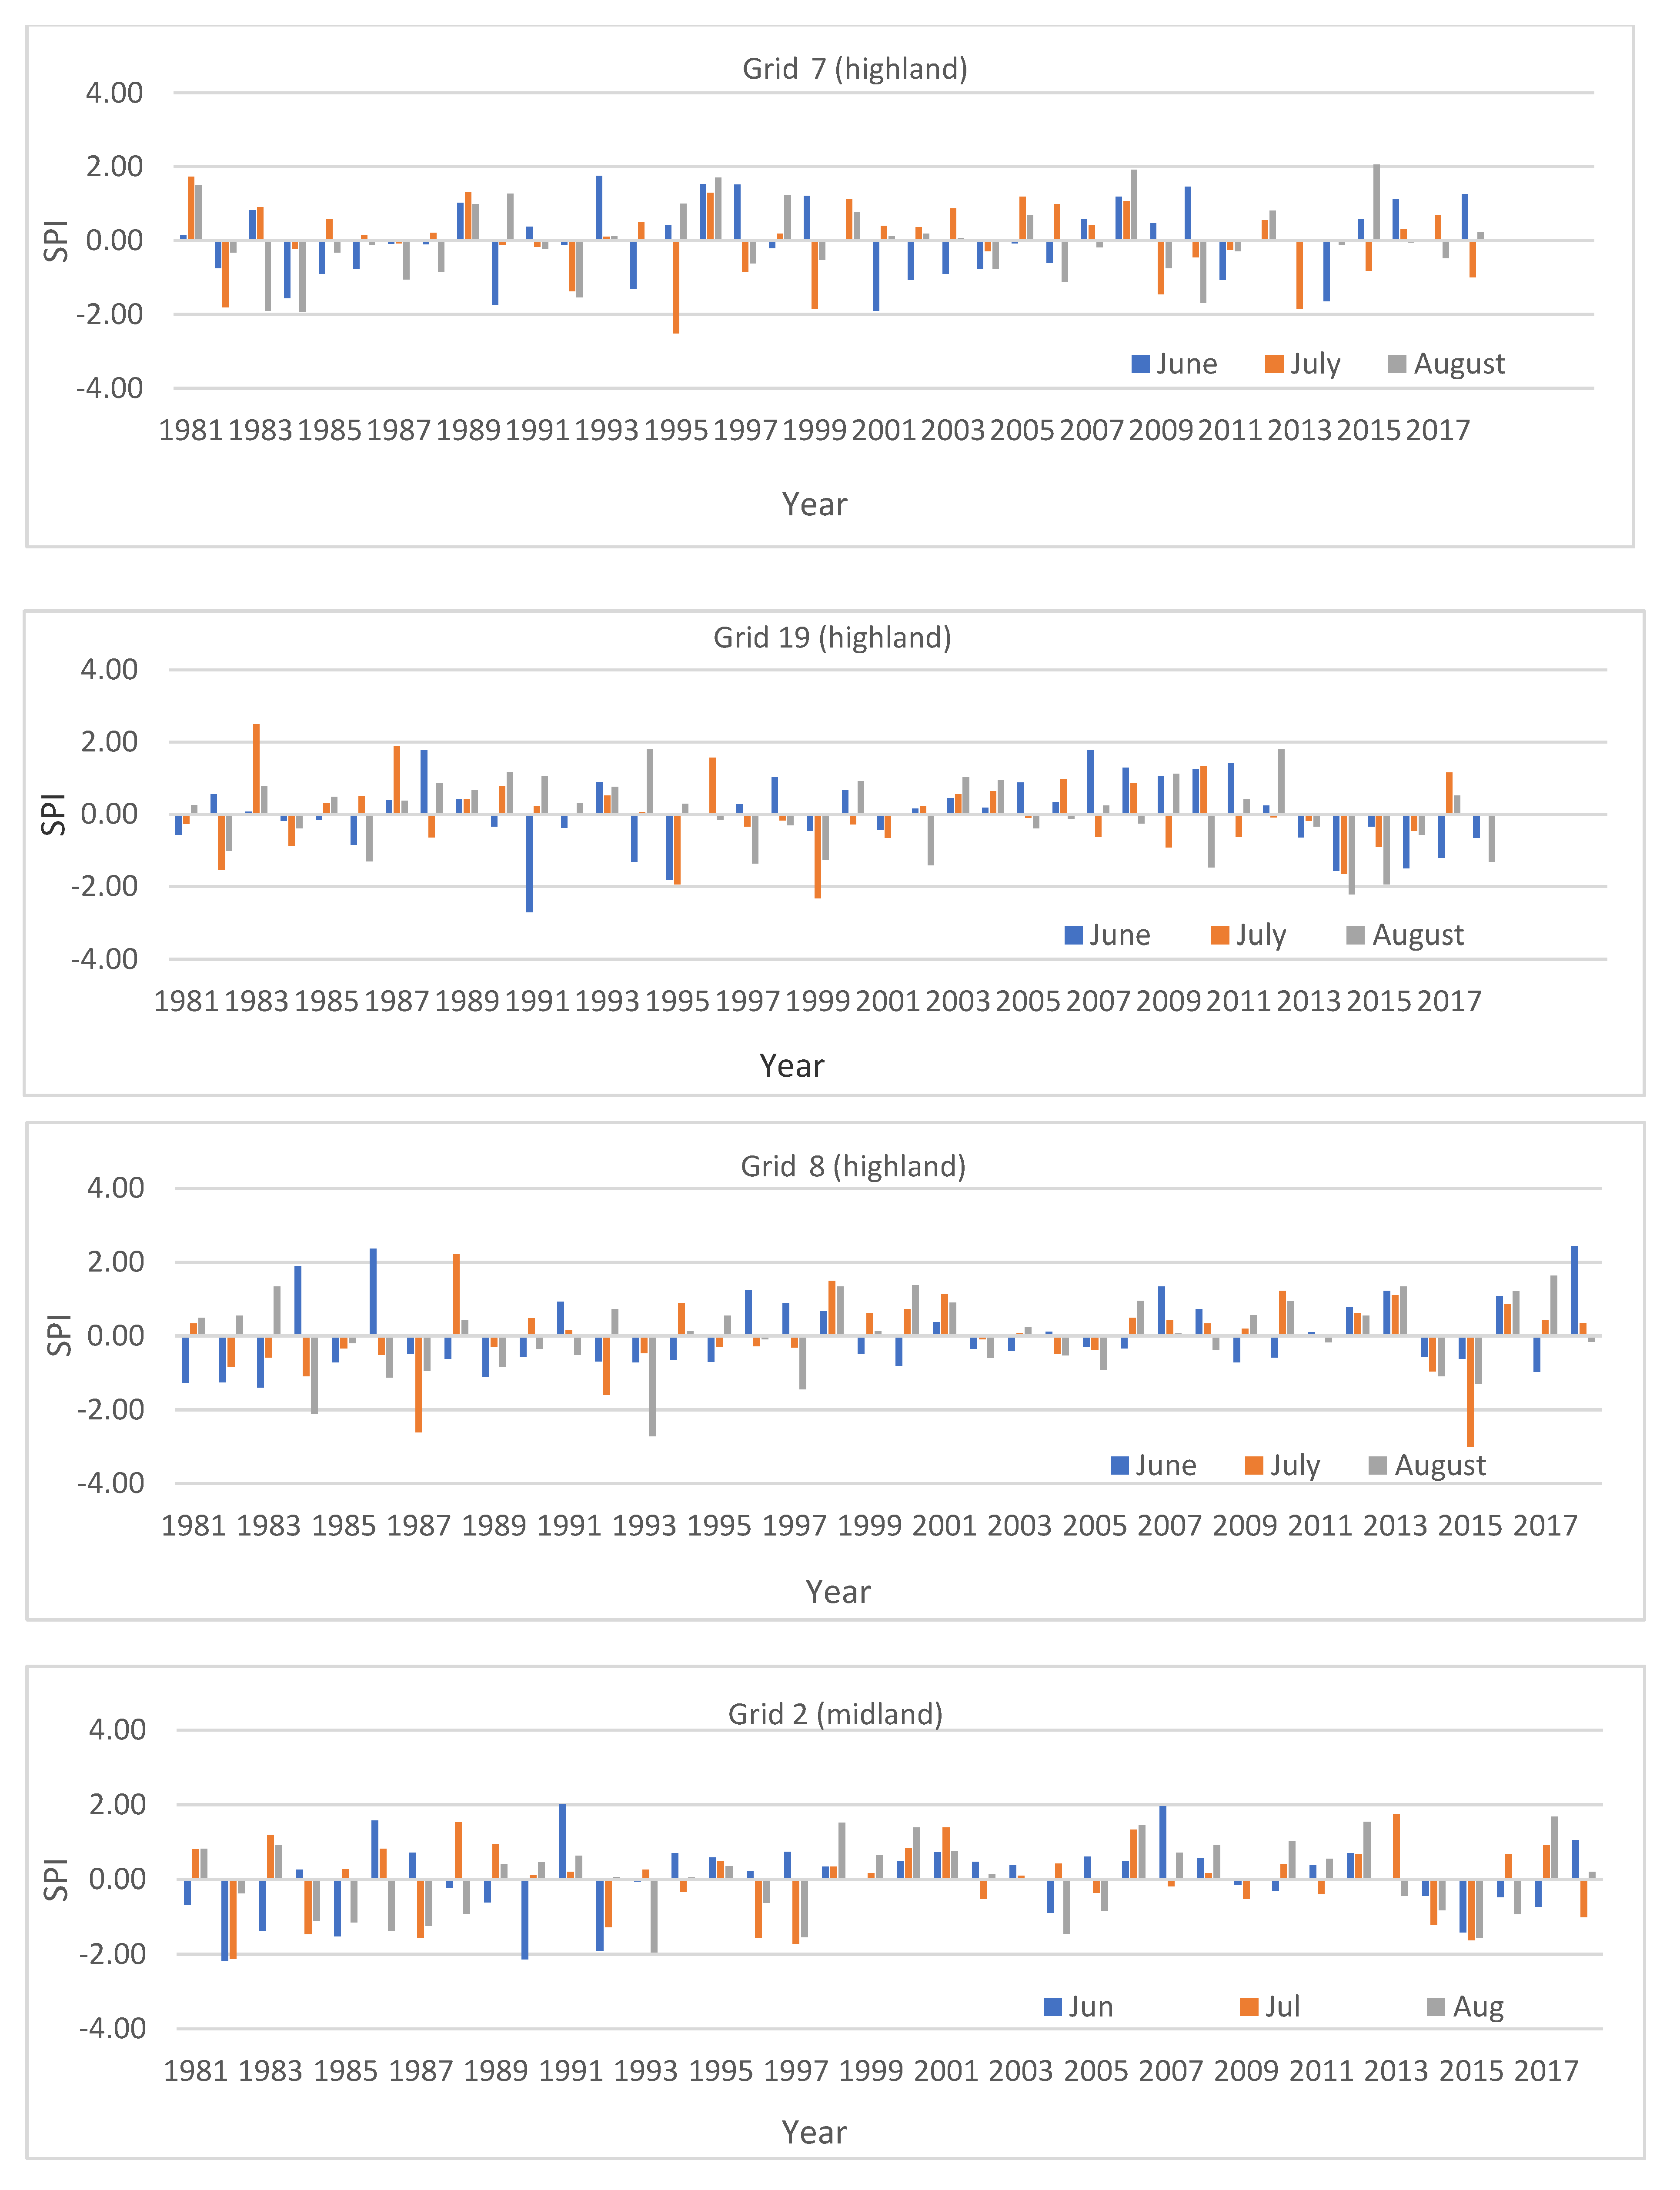
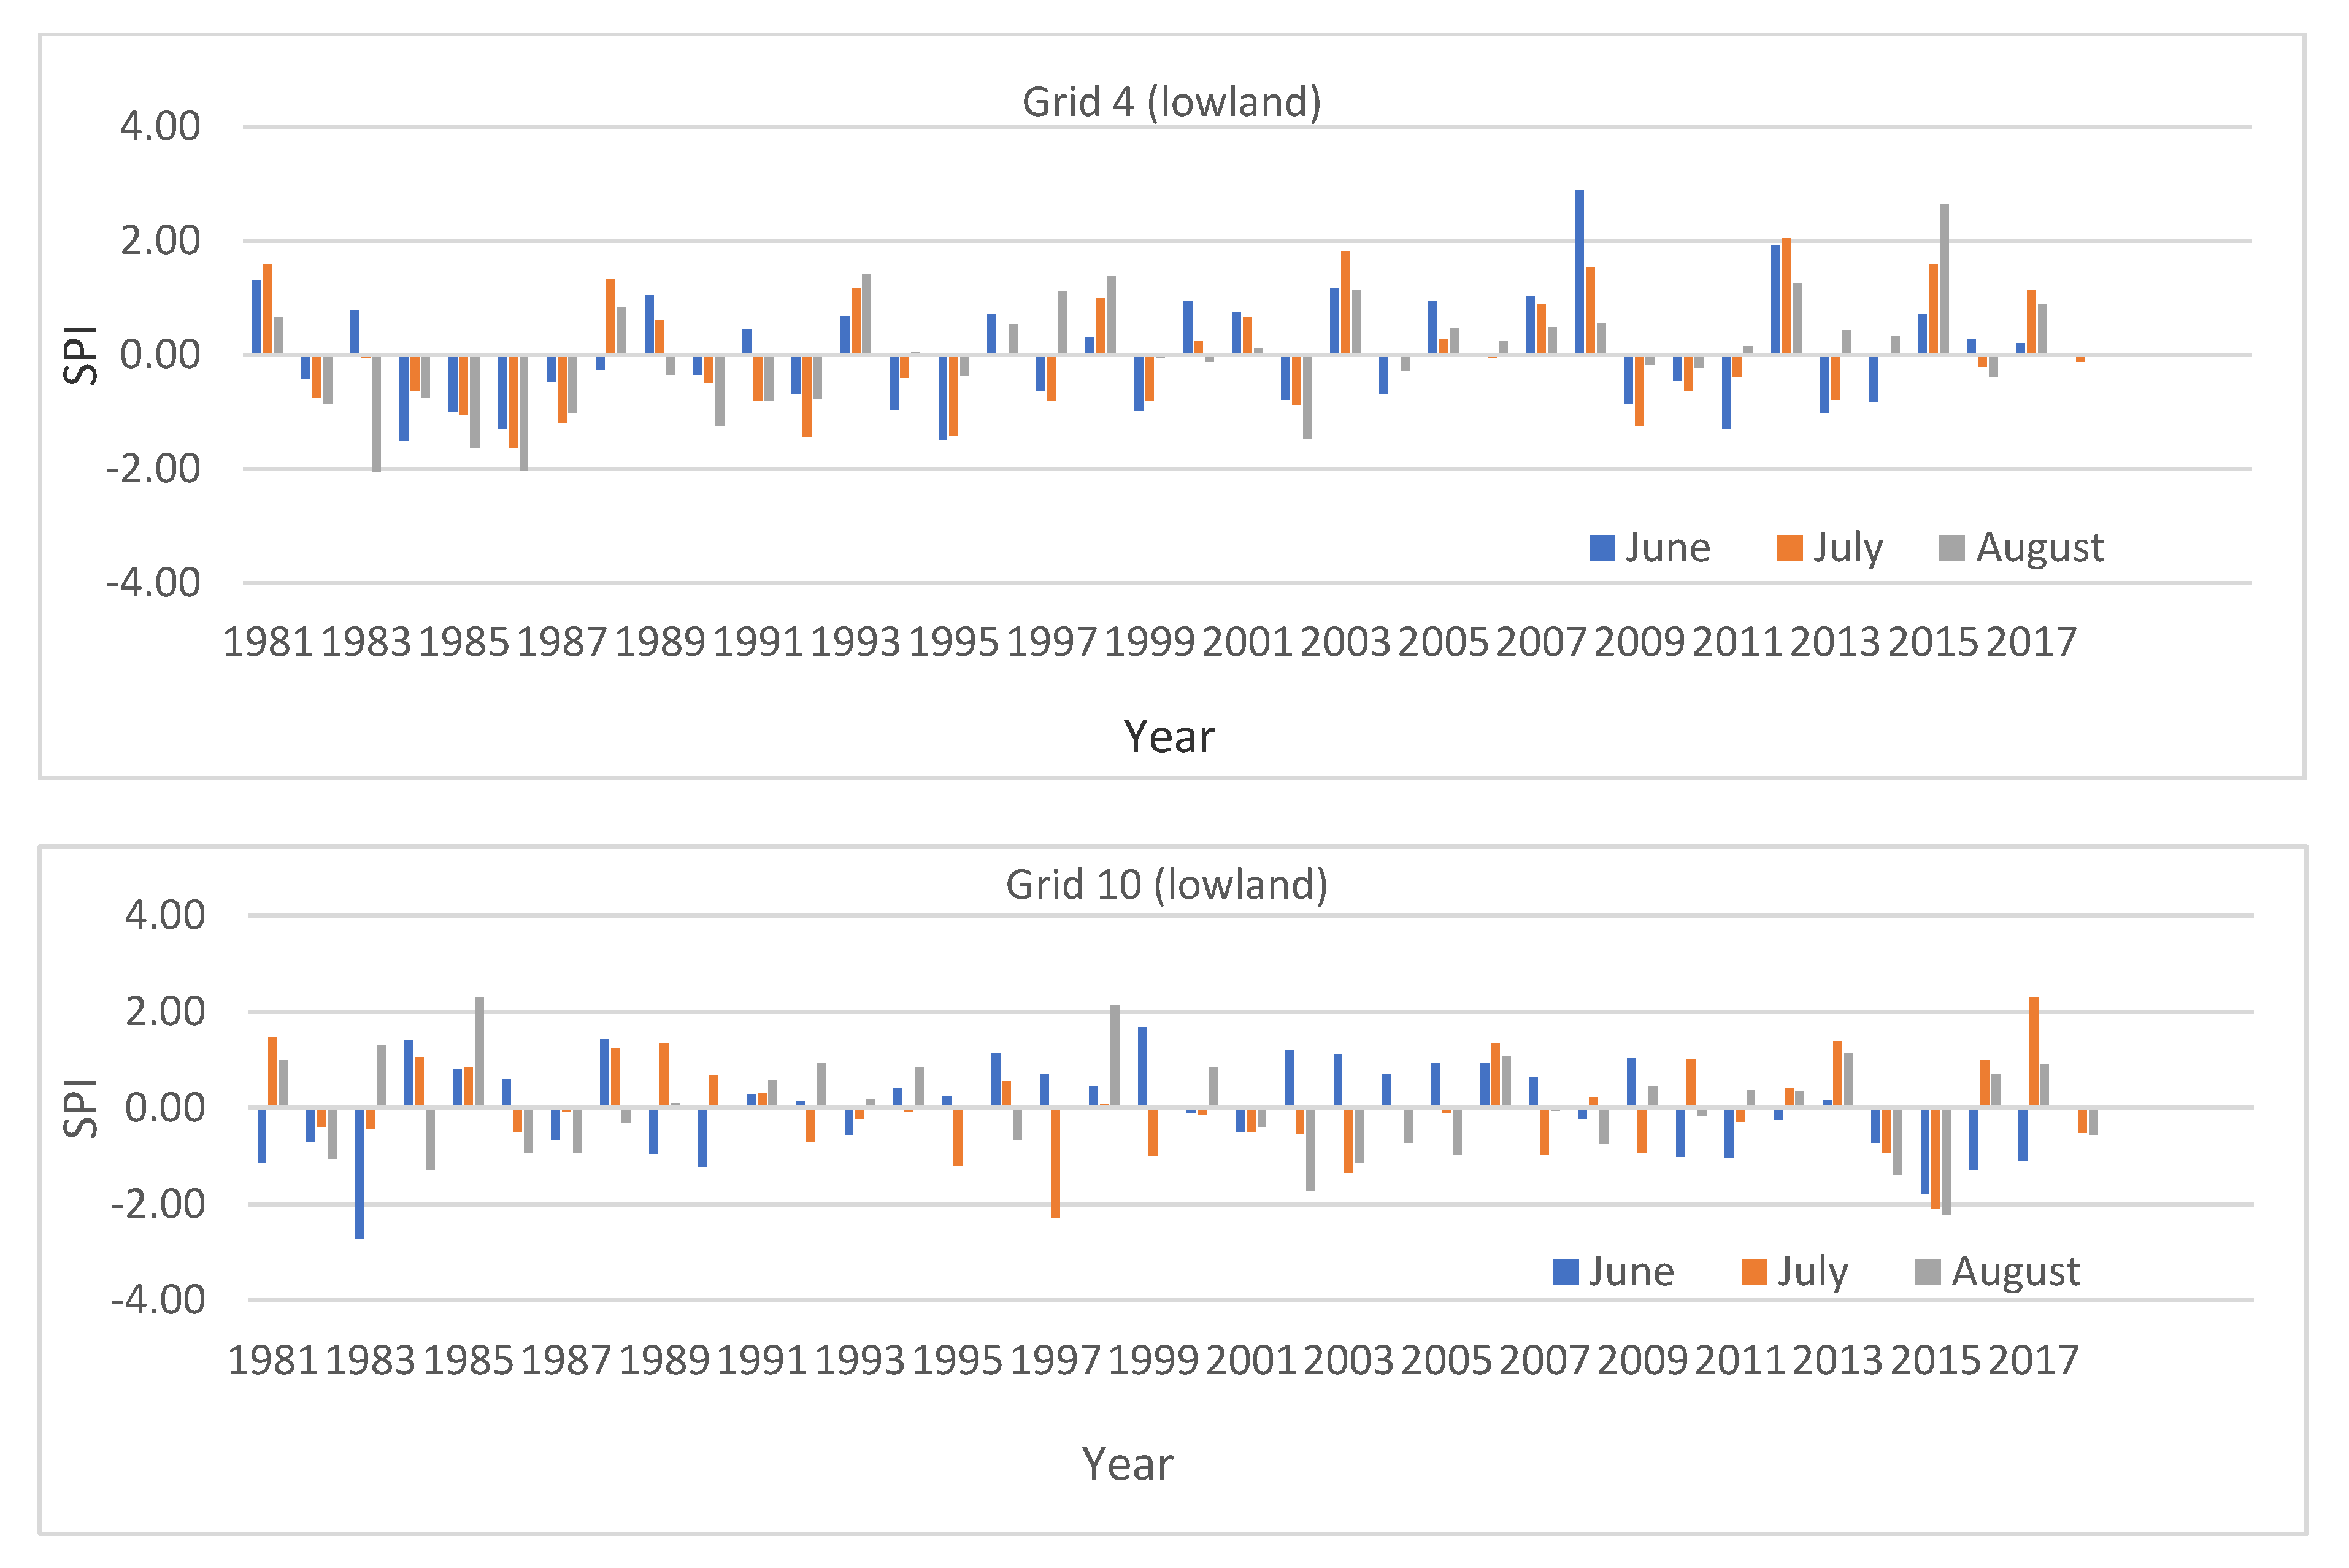
The magnitude (SPI) of monthly meteorological drought over the entire UBN basin from 1981–2018 ranged from 0 to −3.74. The highest SPI (−3.74) was observed in August 1984 over the midland, in the southern part of the UBN (Figure 5). In 2014–2017, the highest magnitude of drought was −3.0 in July 2015 over the highland and −3.03 over the lowland in June 2015. The highest SPI value in the last six years was also found to be −3.03 over the midland, recorded in July 2015 over the southern part of the UBN. Over the 38-year period, severe/extreme drought occurred at the onset and/or offset time of rainy season over all elevation zones of the basin. The result implies the presence of varied levels of exposure to meteorological drought in different elevation zones of the UBN. According to the guidelines described by the authors of [33], the observed magnitude of meteorological drought over the elevation zones of the basin could be characterized by extreme, severe, and moderate levels. The prevalence of moderate, severe, and extreme magnitudes of meteorological drought in the basin was also reported by the authors of [46].
In accordance with the result of the current study, Reference [7], and the EM–DAT International Disaster Database, Centre for Research on the Epidemiology of Disasters (CRED), the authors of [46] revealed the occurrence of severe drought in various years and places of Ethiopia, including provinces situated in the UBN in the 38-year-period. For instance, consistent with the report by the authors of [7], 1982, 1984, 1987, 1997, 2002, 2014, 2015, and 2016 could be taken as severe/extreme drought years in the UBN (Figure 4 and Figure 5). However, while most parts of Ethiopia were exposed to severe/extreme drought in 2000, 2008, and 2009 [7], limited corners of the UBN were found to be exposed to moderate drought in the current study. The authors of [14,49,50] also showed the presence of climate variability in the UBN.
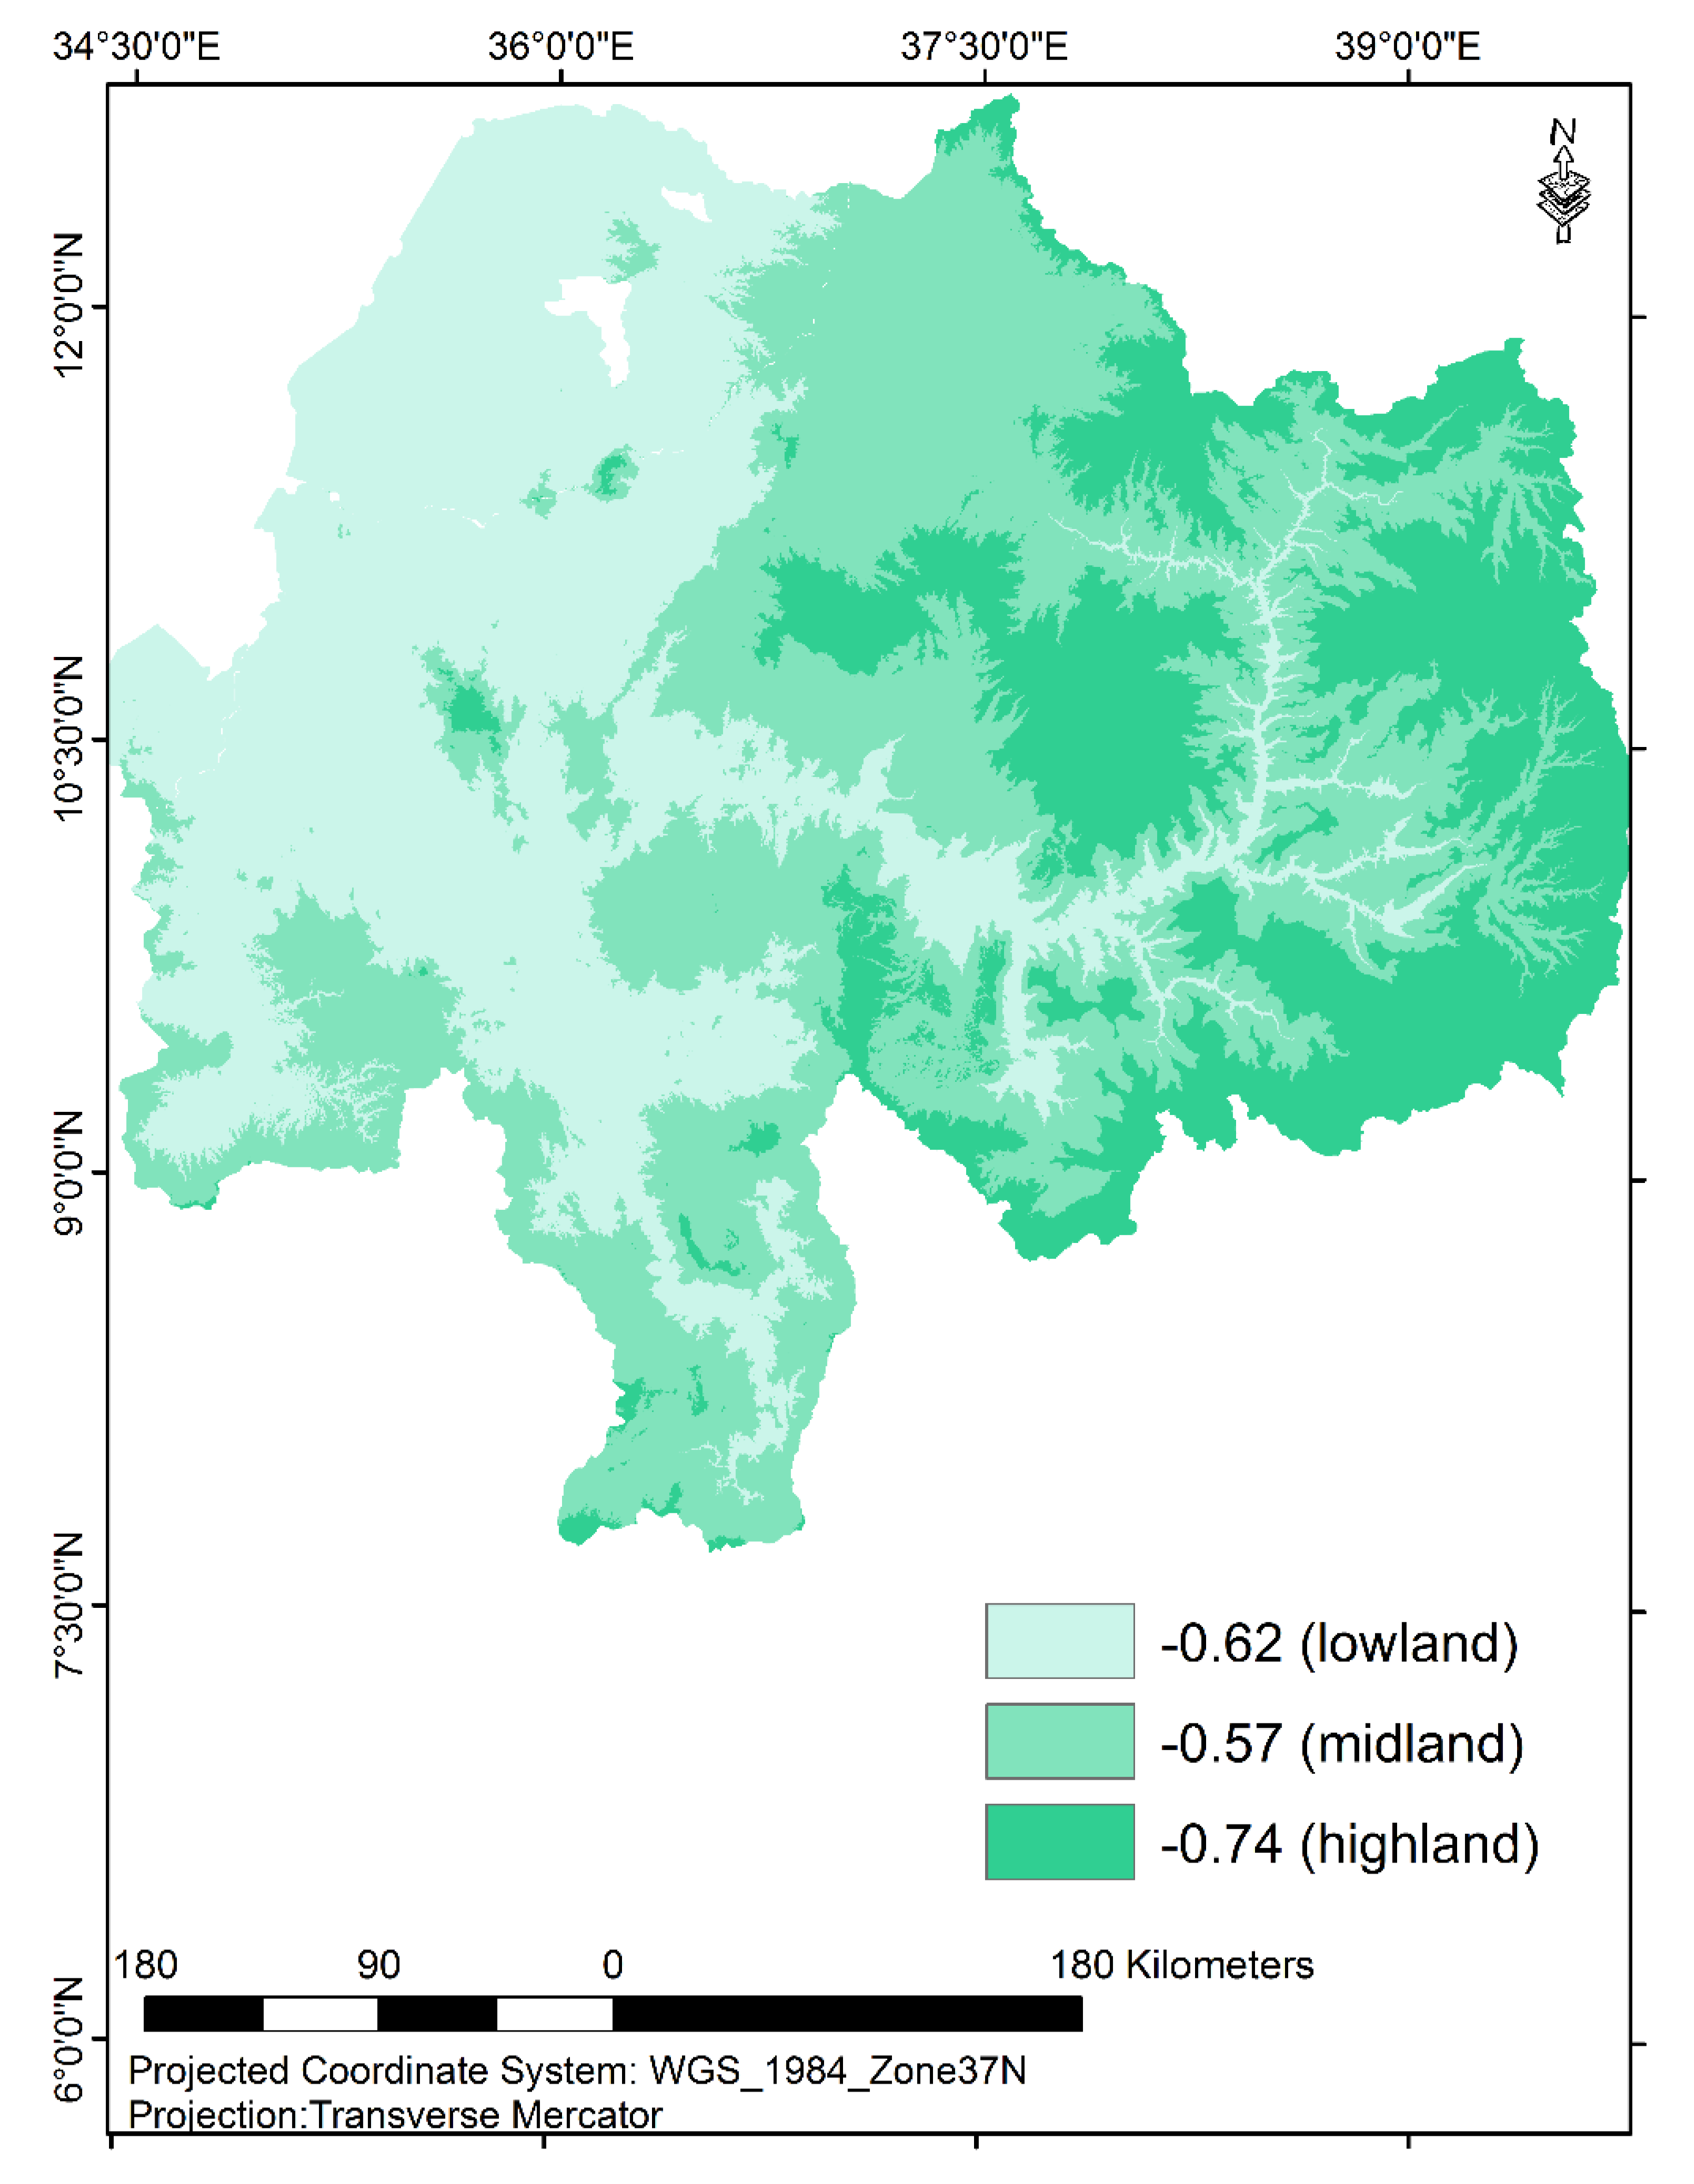
To map the monthly magnitude of meteorological drought over the UBN, we had to compute the SPI of the most recent years, 2014–2017, for the selected grids/places situated in the elevation zones of the basin. According to the monthly SPI analysis result done for selected grids and years (2014–2017) employing CHIRPSv2 rainfall estimates, the mean SPI values over the highland, midland and lowland varied both in space and in time. The aggregated mean SPI value from 2014–2017 became −0.74 in the highland, −0.57 in the midland, and −0.62 in the lowland (Table 5 and Figure 6). Both the mean and aggregated mean SPI values over the elevation zones did not show the occurrence of extreme/severe meteorological drought for the UBN for the period 2014–2017. The highest mean SPI values over the last four years, −1.63 in July 2015 and −1.1 in June 2015, were observed in the highland and lowland parts of the basin, respectively. These mean SPI values show the presence of severe and moderate levels of meteorological drought in the corresponding elevation zones. Due to the fact that meteorological drought index can explain more than one specific drought category to a certain degree [46], the presence of rainfall deficiency over the study period in the UBN implies the prevalence of agricultural drought. In 2014–2017, specific places/grids experienced extreme meteorological drought with mean SPI values of −3.0 over the midland and highland in July 2015, and −2.27 over the lowland in June 2015. More importantly, considering the mean value of SPI over 2014–2017, the average suggests that these four years were somewhat dry, indicating that the SPI in this four-year period was slightly lower than the long-term average (Figure 5). As indicated by the authors of [45], the drought years identified by this SPI analysis for the UBN basin are known for their devastating impact.
Regarding the computation of the frequency (%) of severe/extreme meteorological drought by month for the selected grids/places in the UBN basin, the ratio of the observed number of severe/extreme meteorological drought months to the total number of years considered for the analysis was calculated (Table 6). Here, the total number of years considered for drought analysis in the basin was 38 years, 1981–2018. Regarding the monthly analysis result, a varied frequency of severe/extreme drought was observed in different parts of the basin for the 38 years. The frequency (%) of severe/extreme meteorological drought over the selected grids/sites for the months of June, July, and August were 0–13.5, 5.4–16.2, and 2.5–13.5, respectively (Table 6). The widest frequency range occurred in the month of June, which is the onset time of the rainy season.
Spatial variability in severe/extreme drought frequency was also notable. The highest frequency of severe/extreme meteorological drought months was observed in the northeast and southwest lowland parts of the basin, whereas the lowest frequency was found in the southeastern part of the UBN. Similarly, as reported by the authors of [1], annual rainfall over the basin decreased from the southwest (>2000 mm) to the northeast (around 1000 mm). Considering each site separately, there was a specific place/grid in the midland that faced extreme/severe drought six times (16.2%) in the month of July over the 38 years. There were also specific places and sites that had a zero frequency of severe/extreme drought in the month of June over the highland part of the basin.
The range of extreme drought frequencies seen for different months and different sites shows the highly temporally variable and spatially localized nature of climate variability in this basin. The SPI values were calculated using distributions fit to all monthly data for each elevation zone. Deviations from the mean severe/extreme drought frequency for June thus indicated that this is a particularly variable month relative to July and August. This is consistent with June having a higher percentage of rainfall variability, including high-impact variability at the onset of the rainy season [51]. Spatial variability either indicates that drought-relevant climate variability occurs at a finer scale than the defined elevation zones or simply that, in a 38-year record, site-specific noise can lead to substantial differences in drought frequency. The authors of [45] reported the absence of statistical evidence for a conclusive decreasing or increasing trend in the severity and frequency of meteorological droughts in the basin. As reported by the authors of [52], various empirical and modeling studies proved that climate change is very likely to increase the magnitude, frequency, and duration of droughts over some parts of the world in the coming decades.

4. Conclusions and Recommendations

Relatively, the performance of CHIRPSv2 monthly rainfall estimates was better than MSWEPv2 with respect to ME and RMSE error metrics over the highland, midland, and lowland parts of the UBN for 1981–2018. CHIRPSv2 showed lower statistical error in terms of the over- and under-estimation of monthly rainfall. CHIPRSv2 was found to be a more accurate source of monthly satellite rainfall estimates over the elevation zones of the basin. The meteorological drought observed in the 38-year period over the UBN was characterized by moderate, severe, and extreme magnitudes. The magnitude of monthly drought over the basin varied spatially and temporally. Exploring the reason for the presence of variation in meteorological drought among the elevation zones could be a potential future research area. The frequency of severe/extreme drought months in the basin also varied spatially. The drought magnitude could be described neither as a decreasing nor as an increasing linear trend. However, the UBN could be characterized as a drought-prone basin. Accordingly, since the livelihood of farmers depends on rainfed agriculture, the farming practices in the basin need to be enhanced with an improved early warning system, surface water use, and drought-resistant seed technologies.

Author Contributions

Conceptualization, M.T.; Formal analysis, M.T.; Methodology, M.T., D.S. and B.F.Z.; Supervision, M.N.; Writing—original draft, M.T. All authors have read and agreed to the published version of the manuscript.

Funding

Bahir Dar University covered the cost of conducting the study, whereas the publication fee was provided by Belmont Forum, via the NSF award ICER-1624335.

Acknowledgments

The study acknowledges the National Meteorological Agency of Ethiopia (NMA) for providing the study with long-term observed and estimated rainfall data sets. The support of Kasu Ferede in organizing the dataset needs to be acknowledged.

Conflicts of Interest

The authors declare no conflict of interest.

References

  1. Conway, D. The climate and hydrology of the Upper Blue Nile River. Geogr. J. 2000, 166, 49–62. [Google Scholar] [CrossRef] [Green Version]
  2. Abou Hadid, A.F.; Mohamed, A.A.A.; Ahmed, M.S.M.; Abdrabbo, M.A.A. Trend of Change in Cultivated Area and Water Budget for Major Crops in Egypt using GIS and Field Survey Technique. J. Agric. Inform. 2015, 6, 42–56. [Google Scholar]
  3. Hagos, F.; Makombe, G.; Namara, R.E.; Awulachew, S.B. Importance of Irrigated Agriculture to the Ethiopian Economy: Capturing the Direct Net Benefits of Irrigation; International Water Management Institute (IWMI): Colombo, Sri Lanka, 2009; Volume 128. [Google Scholar]
  4. CSA; World Bank. Ethiopia Rural Socioeconomic Survey (ERSS); CSA: Addis Ababa, Ethiopia; World Bank: Washington, DC, USA, 2013. [Google Scholar]
  5. Cook, B.I.; Mankin, J.S.; Anchukaitis, K.J. Climate change and drought: From past to future. Curr. Clim. Chang. Rep. 2018, 4, 164–179. [Google Scholar] [CrossRef]
  6. Segele, Z.T.; Lamb, P.J. Characterization and variability of Kiremt rainy season over Ethiopia. Meteorol. Atmos. Phys. 2005, 89, 153–180. [Google Scholar] [CrossRef]
  7. Mohammed, Y.; Yimer, F.; Tadesse, M.; Tesfaye, K. Meteorological drought assessment in north east highlands of Ethiopia. Int. J. Clim. Chang. Strateg. Manag. 2018, 10, 142–160. [Google Scholar] [CrossRef] [Green Version]
  8. Bayissa, Y.; Tadesse, T.; Demisse, G.; Shiferaw, A. Evaluation of satellite-based rainfall estimates and application to monitor meteorological drought for the Upper Blue Nile Basin, Ethiopia. Remote Sens. 2017, 9, 669. [Google Scholar] [CrossRef] [Green Version]
  9. Gray, C.; Mueller, V. Drought and population mobility in rural Ethiopia. World Dev. 2012, 40, 134–145. [Google Scholar] [CrossRef] [Green Version]
  10. Degefu, W. Some Aspects of Meteorological Drought in Ethiopia; Cambridge University Press: Cambridge, UK, 1987. [Google Scholar]
  11. Evangelista, P.; Young, N.; Burnett, J. How will climate change spatially affect agriculture production in Ethiopia? Case studies of important cereal crops. Clim. Chang. 2013, 119, 855–873. [Google Scholar] [CrossRef]
  12. Sadoff, C. Can Water Undermine Growth? Evidence from Ethiopia; The World Bank: Washington, DC, USA, 2006. [Google Scholar]
  13. Mulat, A.G.; Moges, S.A. Assessment of the impact of the Grand Ethiopian Renaissance Dam on the performance of the High Aswan Dam. J. Water Resour. Prot. 2014, 2014, 583–598. [Google Scholar] [CrossRef] [Green Version]
  14. Taye, M.; Simane, B.; Zaitchik, B.F.; Selassie, Y.G.; Setegn, S. Rainfall Variability across the Agro-Climatic Zones of a Tropical Highland: The Case of the Jema Watershed, Northwestern Ethiopia. Environments 2019, 6, 118. [Google Scholar] [CrossRef] [Green Version]
  15. Dinku, T.; Hailemariam, K.; Maidment, R.; Tarnavsky, E.; Connor, S. Combined use of satellite estimates and rain gauge observations to generate high-quality historical rainfall time series over Ethiopia. Int. J. Climatol. 2014, 34, 2489–2504. [Google Scholar] [CrossRef] [Green Version]
  16. Funk, C.; Peterson, P.; Landsfeld, M.; Pedreros, D.; Verdin, J.; Shukla, S.; Husak, G.; Rowland, J.; Harrison, L.; Hoell, A.; et al. The climate hazards infrared precipitation with stations—A new environmental record for monitoring extremes. Sci. Data 2015, 2, 1–21. [Google Scholar] [CrossRef] [PubMed] [Green Version]
  17. Beck, H.E.; Wood, E.F.; Pan, M.; Fisher, C.K.; Miralles, D.G.; van Dijk, A.I.; McVicar, T.R.; Adler, R.F. MSWEP V2 global 3-hourly 0.1 precipitation: Methodology and quantitative assessment. Bull. Am. Meteorol. Soc. 2019, 100, 473–500. [Google Scholar] [CrossRef] [Green Version]
  18. Dinku, T.; Funk, C.; Peterson, P.; Maidment, R.; Tadesse, T.; Gadain, H.; Ceccato, P. Validation of the CHIRPS satellite rainfall estimates over eastern Africa. Q. J. R. Meteorol. Soc. 2018, 144, 292–312. [Google Scholar] [CrossRef] [Green Version]
  19. Sahlu, D.; Moges, S.A.; Nikolopoulos, E.I.; Anagnostou, E.N.; Hailu, D. Evaluation of high-resolution multisatellite and reanalysis rainfall products over East Africa. Adv. Meteorol. 2017, 2017, 1–14. [Google Scholar] [CrossRef]
  20. Huffman, G.J.; Bolvin, D.T.; Nelkin, E.J.; Wolff, D.B.; Adler, R.F.; Gu, G.; Hong, Y.; Bowman, K.P.; Stocker, E.F. The TRMM multisatellite precipitation analysis (TMPA): Quasi-global, multiyear, combined-sensor precipitation estimates at fine scales. J. Hydrometeorol. 2007, 8, 38–55. [Google Scholar] [CrossRef]
  21. Joyce, R.J.; Janowiak, J.E.; Arkin, P.A.; Xie, P. CMORPH: A method that produces global precipitation estimates from passive microwave and infrared data at high spatial and temporal resolution. J. Hydrometeorol. 2004, 5, 487–503. [Google Scholar] [CrossRef]
  22. Osczevski, R.J. Windward cooling: An overlooked factor in the calculation of wind chill. Bull. Am. Meteorol. Soc. 2000, 81, 2975–2978. [Google Scholar] [CrossRef] [Green Version]
  23. Tarnavsky, E.; Grimes, D.; Maidment, R.; Black, E.; Allan, R.P.; Stringer, M.; Chadwick, R.; Kayitakire, F. Extension of the TAMSAT satellite-based rainfall monitoring over Africa and from 1983 to present. J. Appl. Meteorol. Climatol. 2014, 53, 2805–2822. [Google Scholar] [CrossRef] [Green Version]
  24. Okamoto, K.I.; Ushio, T.; Iguchi, T.; Takahashi, N.; Iwanami, K. The global satellite mapping of precipitation (GSMaP) project. In Proceedings 2005 IEEE International Geoscience and Remote Sensing Symposium, Seoul, Korea, 29 July 2005. IGARSS’05; IEEE: New Jersey, NJ, USA, 2005; Volume 5, pp. 3414–3416. [Google Scholar]
  25. Betrie, G.D.; Mohamed, Y.A.; van Griensven, A.; Srinivasan, R. Sediment Management Modelling in the Blue Nile Basin Using SWAT Model; Copernicus, GmbH: Göttingen, Germany, 2011. [Google Scholar]
  26. Taye, M.; Simane, B.; Zaitchik, B.F.; Selassie, Y.G.; Setegn, S. Land Use Evaluation over the Jema Watershed, in the Upper Blue Nile River Basin, Northwestern Highlands of Ethiopia. Land 2019, 8, 50. [Google Scholar] [CrossRef] [Green Version]
  27. Gebremicael, T.G.; Mohamed, Y.A.; Betrie, G.D.; van der Zaag, P.; Teferi, E. Trend analysis of runoff and sediment fluxes in the Upper Blue Nile basin: A combined analysis of statistical tests, physically-based models and landuse maps. J. Hydrol. 2013, 482, 57–68. [Google Scholar] [CrossRef]
  28. Mellander, P.E.; Gebrehiwot, S.G.; Gärdenäs, A.I.; Bewket, W.; Bishop, K. Summer rains and dry seasons in the Upper Blue Nile Basin: The predictability of half a century of past and future spatiotemporal patterns. PLoS ONE 2013, 8, e68461. [Google Scholar] [CrossRef] [PubMed] [Green Version]
  29. McCartney, M.; Girma, M.M.; Demissie, S.S. Implications of climate change on existing and planned water resource development in the Upper Blue Nile. In International Water Management Institute Conference Papers; International Water Management Institute: Colombo, Sri Lanka, 2013. [Google Scholar]
  30. Beck, E.H.; van Dijk, A.I.J.M.; Levizzani, V.; Schellekens, J.; Miralles, D.G.; Martens, B.; de Roo, A. MSWEP: 3-hourly 0.25 global gridded precipitation (1979–2015) by merging gauge, satellite, and reanalysis data. Hydrol. Earth Syst. Sci. 2017, 21, 589–615. [Google Scholar] [CrossRef] [Green Version]
  31. Zhang, T.; Li, B.; Wang, J.; Hu, M.; Xu, L. Estimation of areal mean rainfall in remote areas using B-SHADE Model. Adv. Meteorol. 2016, 2016, 1–13. [Google Scholar]
  32. Onyutha, C. From R-squared to coefficient of model accuracy for assessing goodness-of-fits. Geosci. Model. Dev. Discuss. 2020, 1–25. [Google Scholar] [CrossRef]
  33. McKee, B.T.; Doesken, N.J.; Kleist, J. The Relationship of Drought Frequency and Duration to Time Scales. In Proceedings of the 8th Conference on Applied Climatology, Anaheim, CA, USA, 17–22 January 1993; pp. 179–183. [Google Scholar]
  34. Hayes, M.; Svoboda, M.; Wall, N.; Widhalm, M. The Lincoln declaration on drought indices: Universal meteorological drought index recommended. Bull. Am. Meteorol. Soc. 2011, 92, 485–488. [Google Scholar] [CrossRef] [Green Version]
  35. Svoboda, M.; Fuchs, B.A. Handbook of Drought Indicators and Indices. In Integrated Drought Management Programme (IDMP), Integrated Drought Management Tools and Guidelines; Series 2; World Meteorological Organization (WMO): Geneva, Switzerland; Global Water Partnership (GWP): Stockholdm, Sweden, 2016. [Google Scholar]
  36. Svoboda, M.; Hayes, M.; Wood, D. Standardized Precipitation Index User Guide; World Meteorological Organization: Geneva, Switzerland, 2012. [Google Scholar]
  37. Vicente-Serrano, M.S.; Beguería, S.; Lorenzo-Lacruz, J.; Camarero, J.J.; López-Moreno, J.I.; Azorin-Molina, C.; Revuelto, J.; Morán-Tejeda, E.; Sanchez-Lorenzo, A. Performance of drought indices for ecological, agricultural, and hydrological applications. Earth Interact. 2012, 16, 1–27. [Google Scholar] [CrossRef] [Green Version]
  38. Ntale, H.K.; Gan, T.Y. Drought indices and their application to East Africa. Int. J. Climatol. 2003, 23, 1335–1357. [Google Scholar] [CrossRef]
  39. Keyantash, J.; Dracup, J.A. The quantification of drought: An evaluation of drought indices. Bull. Am. Meteorol. Soc. 2002, 83, 1167–1180. [Google Scholar] [CrossRef]
  40. Morid, S.; Smakhtin, V.; Moghaddasi, M. Comparison of seven meteorological indices for drought monitoring in Iran. Int. J. Climatol. 2006, 26, 971–985. [Google Scholar] [CrossRef]
  41. Tigkas, D.; Vangelis, H.; Tsakiris, G. DrinC: A software for drought analysis based on drought indices. Earth Sci. Inform. 2015, 8, 697–709. [Google Scholar] [CrossRef]
  42. Svensson, C.; Hannaford, J.; Prosdocimi, I. Statistical distributions for monthly aggregations of precipitation and streamflow in drought indicator applications. Water Resour. Res. 2017, 53, 999–1018. [Google Scholar] [CrossRef] [Green Version]
  43. Lloyd-Hughes, B.; Saunders, M.A. A drought climatology for Europe. Int. J. Climatol. 2002, 22, 1571–1592. [Google Scholar] [CrossRef]
  44. Stagge, H.J.; Tallaksen, L.M.; Gudmundsson, L.; van Loon, A.F.; Stahl, K. Candidate distributions for climatological drought indices (SPI and SPEI). Int. J. Climatol. 2015, 35, 4027–4040. [Google Scholar]
  45. Bayissa, A.Y.; Moges, S.A.; Xuan, Y.; van Andel, S.J.; Maskey, S.; Solomatine, D.P.; van Griensven, A.; Tadesse, T. Spatio-temporal assessment of meteorological drought under the influence of varying record length: The case of Upper Blue Nile Basin, Ethiopia. Hydrol. Sci. J. 2015, 60, 1927–1942. [Google Scholar] [CrossRef]
  46. Bayissa, A.Y.; Maskey, S.; Tadesse, T.; van Andel, S.J.; Moges, S.; van Griensven, A.; Solomatine, D.P. Comparison of the performance of six drought indices in characterizing historical drought for the upper Blue Nile basin, Ethiopia. Geosciences 2018, 8, 81. [Google Scholar] [CrossRef] [Green Version]
  47. Hisdal, H.; Stahl, K.; Tallaksen, L.M.; Demuth, S. Have streamflow droughts in Europe become more severe or frequent? Int. J. Climatol. 2001, 21, 317–333. [Google Scholar] [CrossRef]
  48. Tallaksen, L.; Hisdal, H. Regional analysis of extreme streamflow drought duration and deficit volume. FRIEND’97 Reg. Hydrol. Concepts Models Sustain. Water Resour. Manag. 1997, 246, 141. [Google Scholar]
  49. Taye, M.; Simane, B.; Zaitchik, B.F.; Setegn, S.; Selassie, Y.G. Analysis of the Spatial Patterns of Rainfall across the Agro-Climatic Zones of Jema Watershed in the Northwestern Highlands of Ethiopia. Geosciences 2019, 9, 22. [Google Scholar] [CrossRef] [Green Version]
  50. Mengistu, D.; Bewket, W.; Lal, R. Recent spatiotemporal temperature and rainfall variability and trends over the Upper Blue Nile River Basin, Ethiopia. Int. J. Climatol. 2014, 34, 2278–2292. [Google Scholar] [CrossRef]
  51. Berhane, F.; Zaitchik, B.; Dezfuli, A. Subseasonal analysis of precipitation variability in the Blue Nile River Basin. J. Clim. 2014, 27, 325–344. [Google Scholar] [CrossRef]
  52. Field, C.B. Climate Change 2014–Impacts, Adaptation and Vulnerability: Regional Aspects; Cambridge University Press: Cambridge, UK, 2014. [Google Scholar]
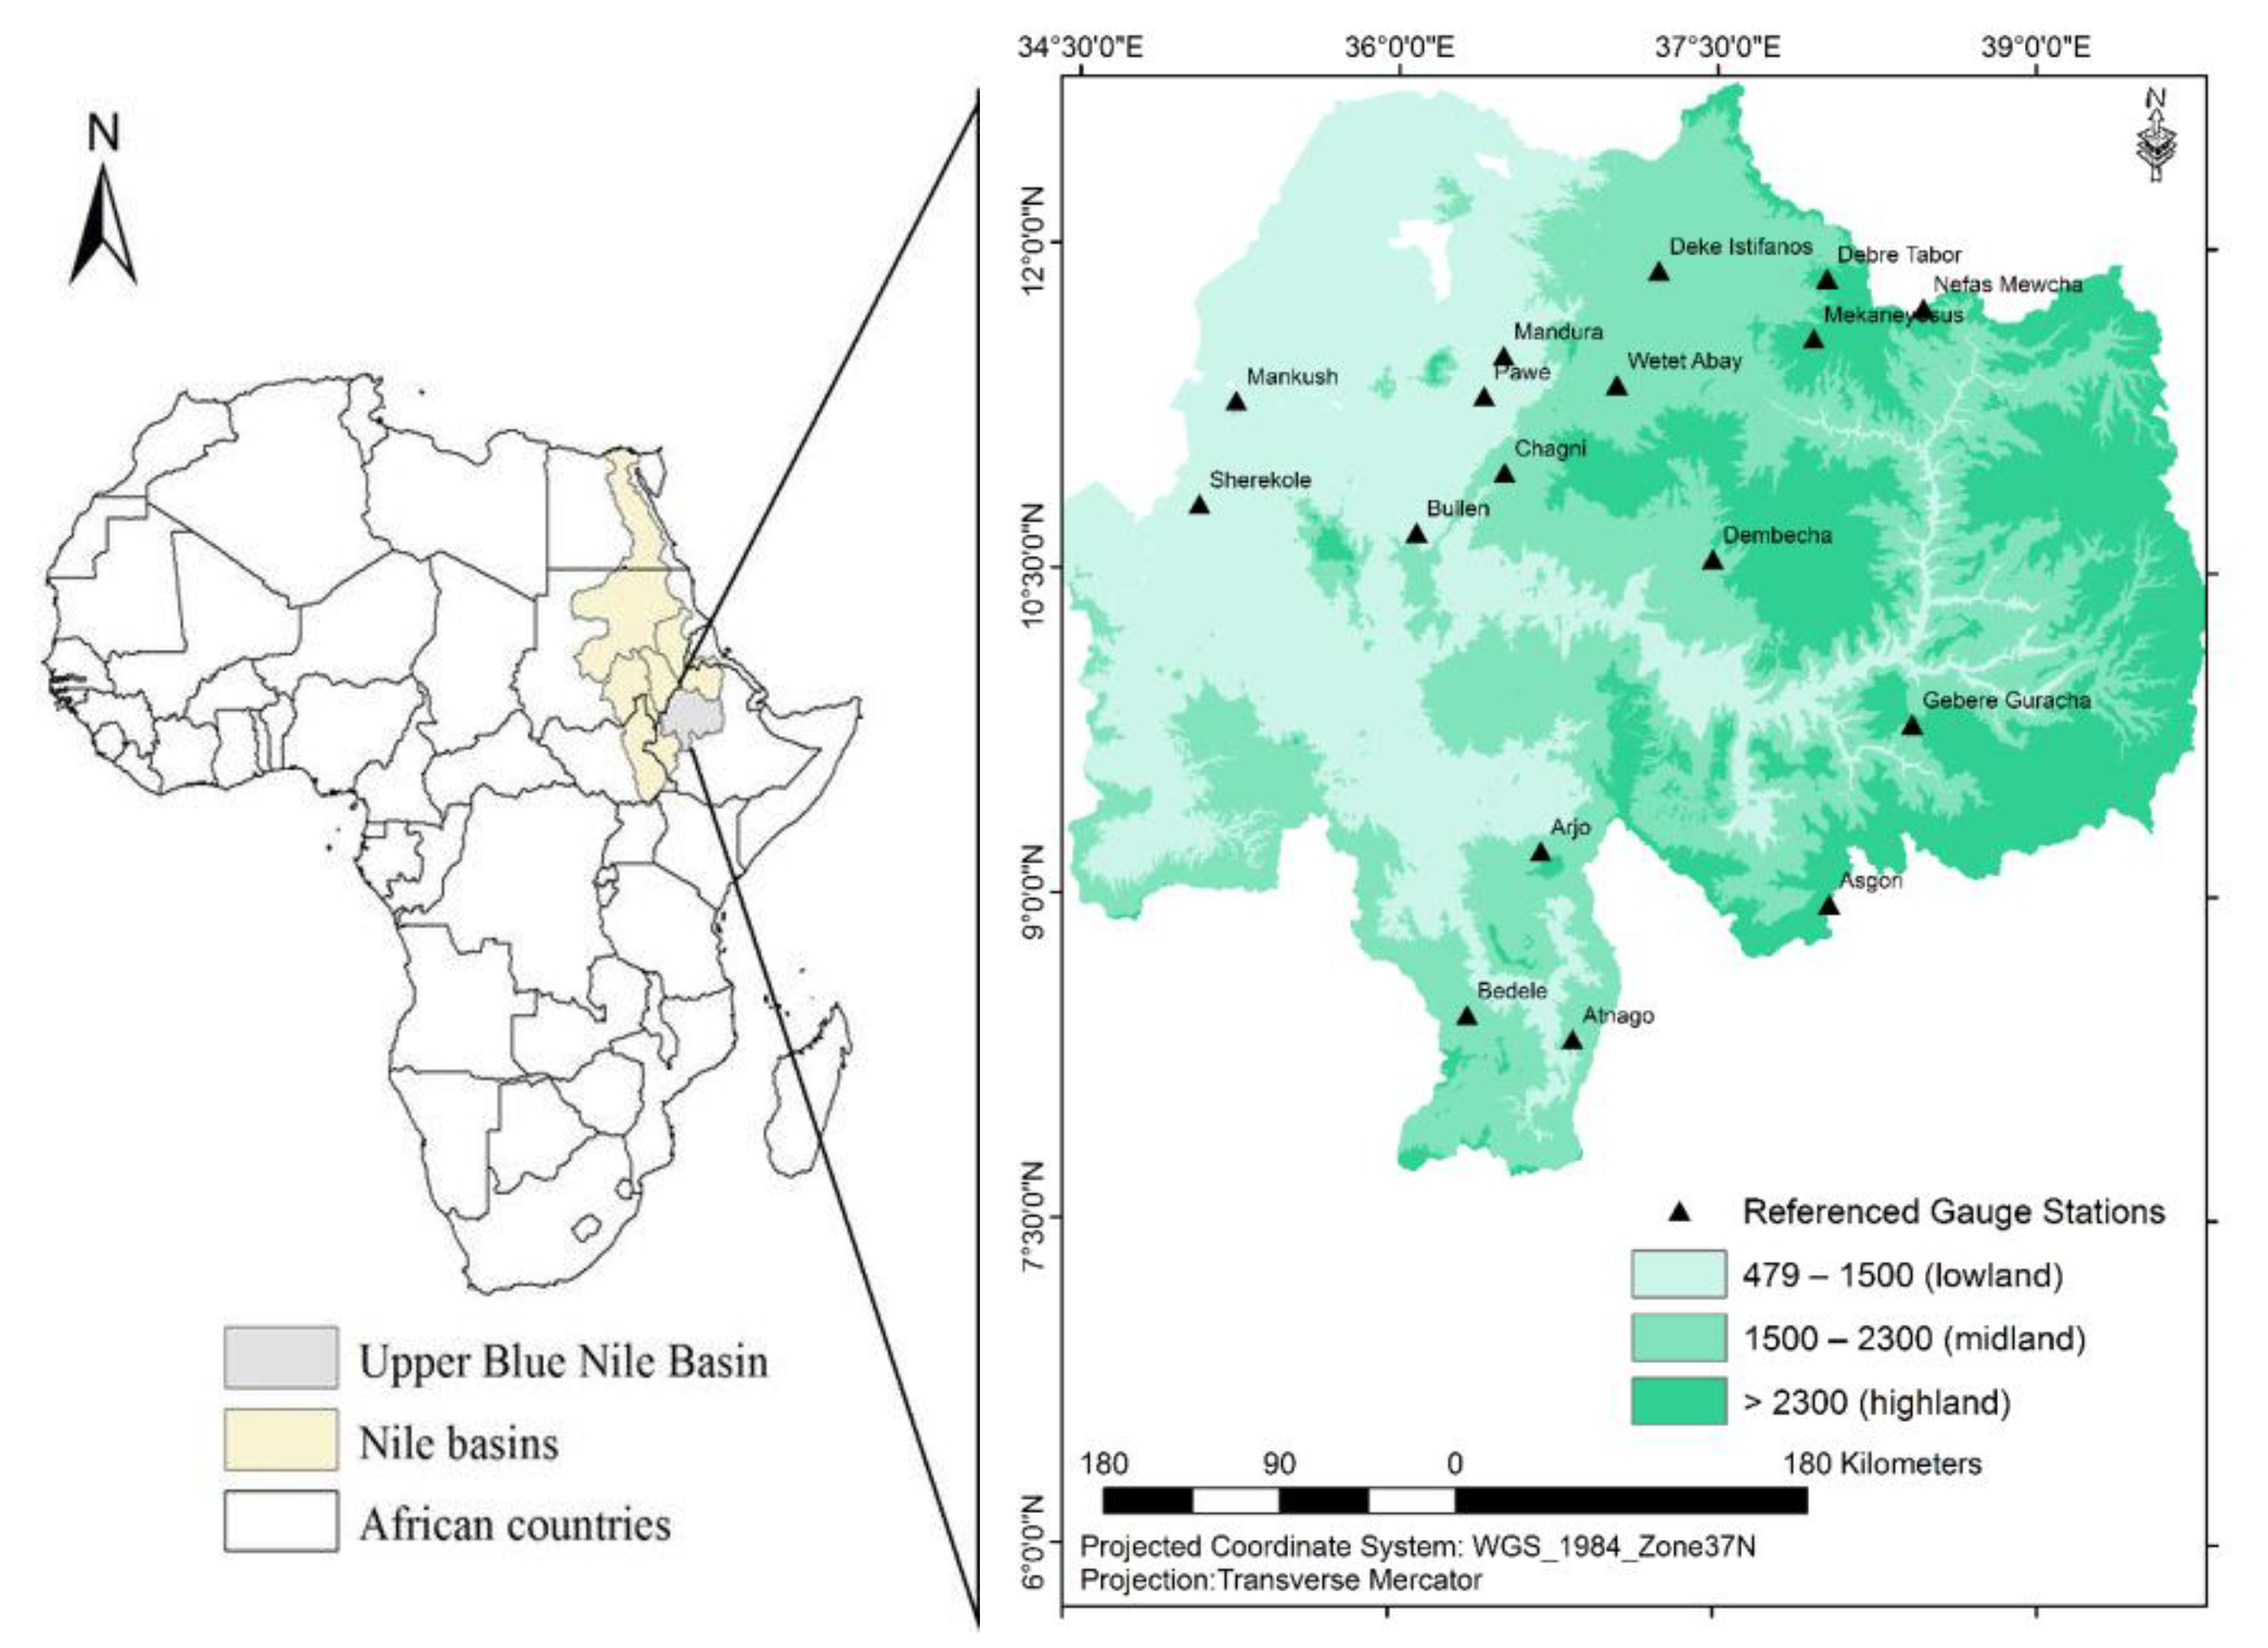
Figure 1. Location map of the Upper Blue Nile basin, Ethiopia.
Geosciences 10 00352 g001
Figure 2. The distribution of referenced gauge stations over the elevation zones of the Upper Blue Nile basin.
Geosciences 10 00352 g002
Figure 3. Scatterplots for monthly rainfall of Climate Hazards Group Infrared Precipitation with Stations version 2 (CHIRPSv2) and Multi-Source Weighted-Ensemble Precipitation version 2 (MSWEPv2) over the Upper Nile Basin (UBN).
Geosciences 10 00352 g003
Figure 4. Selected grid points (with their given ID) of CHIRPSv2 used to compute SPI.
Geosciences 10 00352 g004
Figure 5. Monthly SPI in the selected places (grids) over the elevation zones of the Upper Blue Nile basin.
Geosciences 10 00352 g005aGeosciences 10 00352 g005bGeosciences 10 00352 g005c
Figure 6. Mean SPI values (drought magnitude) from 2014–2017 in June and July over the elevation zones of the UBN.
Geosciences 10 00352 g006
Table 1. Summary of the satellite rainfall products evaluated in the current study.
Satellite Rainfall Product NameTemporal CoverageSpatial ResolutionTemporal ResolutionSpatial CoverageInputData Source Reference
1 MSWEPv21979–present0.1°DailyGlobal Satellite estimates, reanalysis data sources, and gridded gauge 3 G–WADI
USA
[17]
2 CHIRPSv21981–present0.05°PentadQuasi-global (Spanning 50° S–50° N (and all longitudes)TIR satellite observation and gauge Meteosat thermal infra-red (TIR) imagery)4 USGS
5 EROS
University of California Santa Barbara
[16]
1 Multi-Source Weighted-Ensemble Precipitation version 2, 2 Climate Hazards Group Infrared Precipitation version 2,3 Water& Development Information for Arid Lands—A Global Network, 4 USGS = United States Geological Survey, 5 Earth Resources Observation and Science.
Table 2. Standardized Precipitation Index (SPI) values with different categories of drought magnitude [33].
SPI ValueDrought Severity
−2.00 and lessExtreme
−1.50 to −1.99Severe
−1.00 to −1.49Moderate
0 to −0.99Near normal or mild
Above 0No
Table 3. Error report for CHIRPSv2 for the different elevation zones of the Upper Blue Nile. PBias: Probability of bias; ME: Mean error; MAE: Mean average error; RMSE: Root mean square error.
StationrBias (mm)PBias
(%)
ME
(mm)
MAE
(mm)
RMSE (mm)
Highland
1. Asgori0.860.79−20.63 −20.6720.6779.52
2. Debre Tabor0.9710.150.190.19123.69
3. Gebere Guracha0.931.329.9125.9125.91112.52
4. Mekaneyesus0.850.78−21.92−24.3624.3686.79
5. Nefas Mewcha0.9710.290.240.2483.47
Mean0.920.97−2.44−3.7414.2797.20
Midland
1. Atnago0.871.021.872.622.62142.84
2. Arjo0.911.2928.6541.4841.48186.26
3. Bedele0.931.077.3310.7410.74157.35
4. Chagni0.950.91−9.18−15.0315.03148.72
5. Deke Istifanos0.91.1918.6420.8320.83132.55
6. Dembecha0.931.022.322.542.54111.71
7. Wetet Abay0.921.1413.6217.0717.07142.44
Mean0.921.099.0411.4615.76145.98
Lowland
1. Bullen0.931.022.392.852.85121.95
2. Mandura0.91.3534.944.7944.79173.11
3. Mankush0.90.87−13.27−13.2813.2886.79
4. Pawe0.951.033.484.554.55135.38
5. Sherekole0.821.3636.2131.0431.0454.68
Mean0.901.1312.7413.9919.30114.38
Mean to the UBN0.911.076.757.7416.36122.34
Table 4. Error report for MSWEPv2 for the different elevation zones of the Upper Blue Nile. PBias: Probability of bias; ME: Mean error; MAE: Mean average error; RMSE: Root mean square error.
StationrBias (mm)PBias
(%)
ME
(mm)
MAE
(mm)
RMSE (mm)
Highland
6. Asgori0.840.99−0.54−0.430.4379.61
7. Debre Tabor0.931.439.5837.0737.07130.73
8. Gebere Guracha0.91.5655.5541.2941.29115.61
9. Mekaneyesus0.780.83−16.89−18.0118.0188.65
10. Nefas Mewcha0.951.1919.0713.6813.6885.41
Mean0.881.1919.3514.7222.10100.00
Midland
8. Atnago0.81.099.513.0113.01150.03
9. Arjo0.871.659.7674.1274.12198.14
10. Bedele0.911.110.3515.0915.09160.86
11. Chagni0.91.098.8611.9611.96147
12. Deke Istifanos0.841.2323.0926.826.8142.89
13. Dembecha0.861.065.626.036.03113.49
14. Wetet Abay0.851.2525.4531.6131.61155.8
Mean0.861.2020.3825.5225.52152.60
Lowland
6. Bullen0.90.91−8.65−11.7711.77124.38
7. Mandura0.851.5150.6361.861.8183.86
8. Mankush0.890.86−14.32−14.8114.8188.65
9. Pawe0.931.110.4512.5512.55132.61
10. Sherekole0.781.3838.0932.2132.21116.77
Mean0.871.1515.2416.0026.63129.25
Mean to the UBN0.871.1918.5619.5424.84130.26
Table 5. SPI value in the elevation zones of UBN from 2014 to 2018 in June and July.
Given
ID Under Elevation Zones
SPI
(June 2014)
SPI
(July 2014)
SPI
(June 2015)
SPI
(July 2015)
SPI
(June 2016)
SPI
(July 2016)
SPI
(June 2017)
SPI
(July 2017)
Aggregated Mean
High
land
3−0.45−1.23−1.24−1.67−0.490−0.870
7−1.64−0.040−0.8200−0.03−0.68
8−0.57−0.96−0.61−3.000−0.970
12−0.03−0.04−1.48−0.72−1.14−0.35−0.790
15−1.47−1.81−0.18−2.68−0.17−0.89−1.090
19−1.56−1.65−0.34−0.9−1.5−0.46−1.20
Mean−0.95−0.96−0.64−1.63−0.55−0.28−0.83−0.11−0.74
Mid
Land
2−0.44−1.21−1.41−1.62−0.46−0.67−0.720
9−0.46−0.55−0.59−2.9400−1.280
130−0.72−0.19−3.0300−0.79−0.13
14−1.03−1.09−0.24−0.930−0.1400
16−0.87−1.47−1.410−1.61−0.72−0.790
17−1.39−0.690000−0.520
18−1.0500000−0.380
Mean−0.75−0.82−0.55−1.22−0.30−0.22−0.64−0.02−0.57
Low
land
1−1.53−1.09−1.44−0.44−0.75−0.02−0.250
4−0.82−0.02000−0.0200
5−0.28−0.10−0.660−0.390−0.980
6−0.66−0.75−2.27−1.76−1.350−1.120
10−0.72−0.93−1.78−2.10−1.280−1.100
11−1.15−0.270−0.550000
20−1.63−1.79−0.90−0.44−1.77−0.84−0.710
Mean−0.97−0.71−1.01−0.76−0.79−0.13−0.590−0.62
Table 6. The frequency (%) of severe/extreme meteorological drought months * during 1981–2018 for the elevation zones of Upper Blue Nile.
Given Grid ID Count of Severe/Extreme Drought during 1981–2018Count of Years ConsideredFrequency (%) of Severe/Extreme
JuneJulyAugustJuneJulyAugust
Highland
34543810.813.510.8
74543810.813.510.8
80333808.18.1
12321388.15.42.7
154443810.810.810.8
194433810.810.88.1
Mean343389109
Midland
2364388.116.210.8
9132382.78.15.4
13332388.18.15.4
14232385.48.15.4
16265385.416.213.5
17243385.410.88.1
184333810.88.18.1
Mean243387118
Lowland
15313813.58.12.7
4124382.75.410.8
5352388.113.55.4
6333388.18.18.1
10222385.45.45.4
114253810.85.413.5
204353810.88.113.5
Mean33338888
* There are three rainy months (June, July, and August) per year in the Upper Blue Nile.