Evaluation of Satellite Rainfall Estimates for Meteorological Drought Analysis over the Upper Blue Nile Basin, Ethiopia
Abstract
1. Introduction
2. Materials and Methods
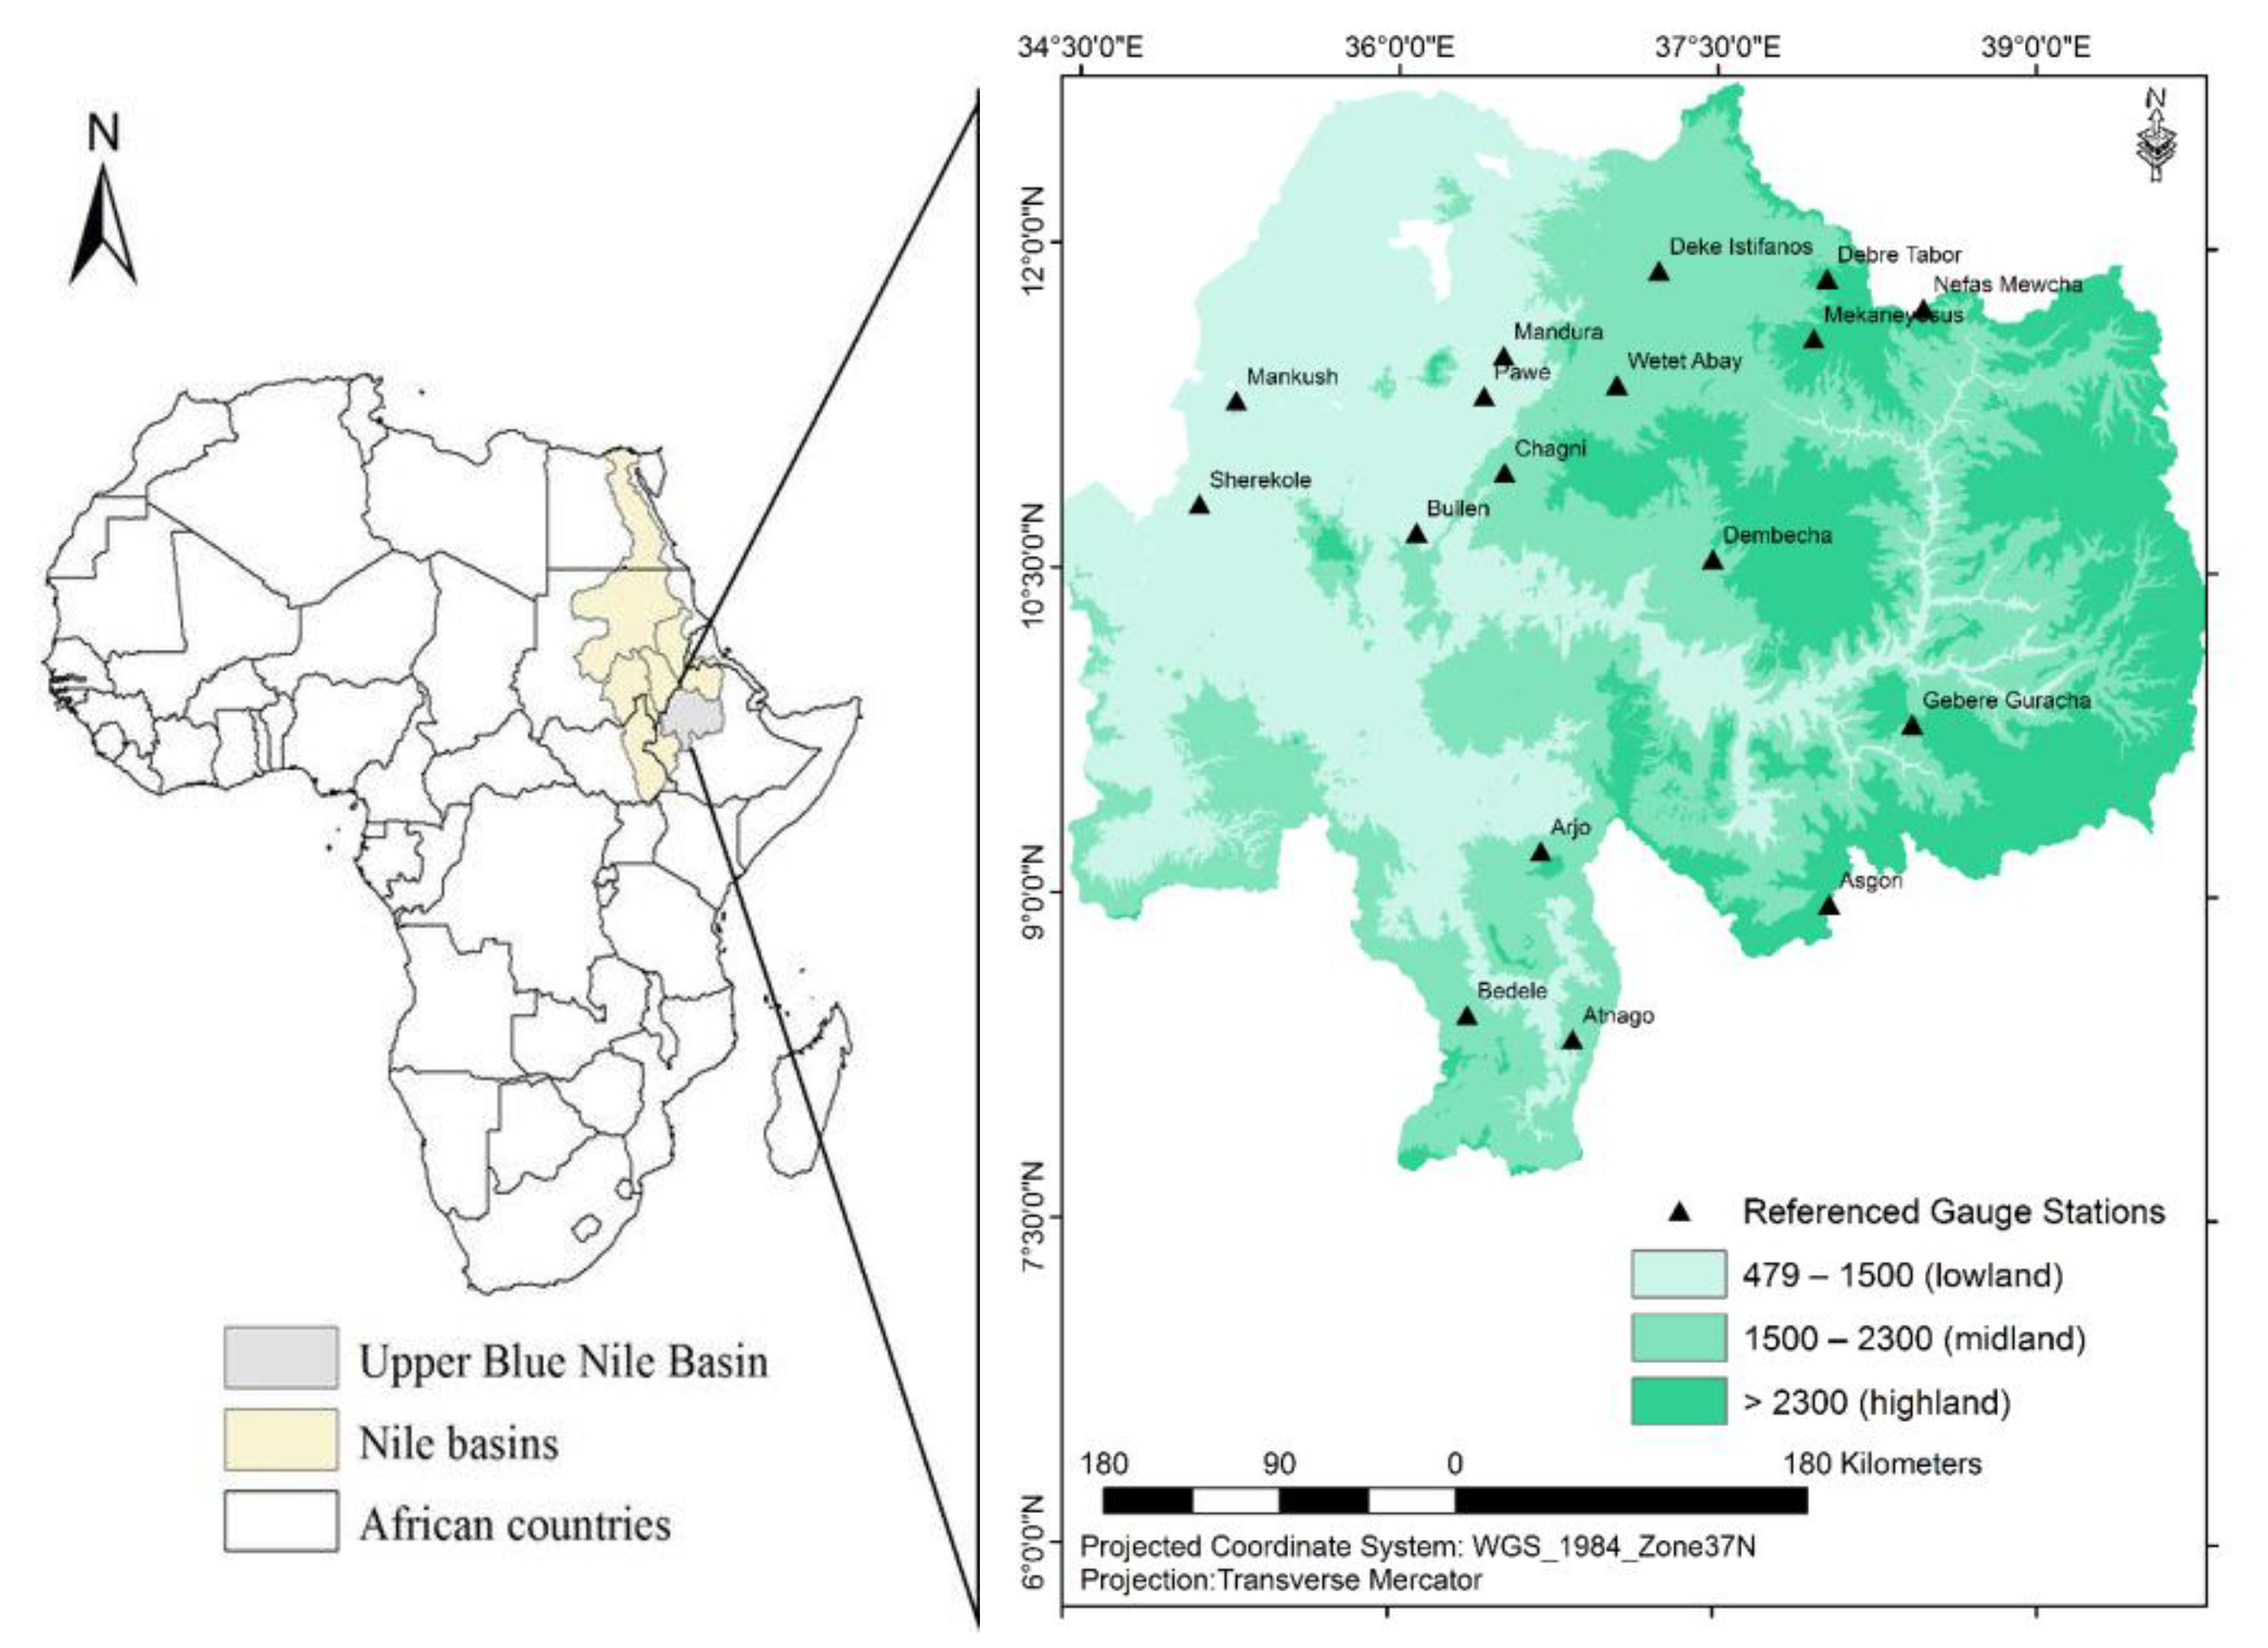
2.1. Background of the Study Area
2.2. The Dataset
2.2.1. Satellite Rainfall Estimates
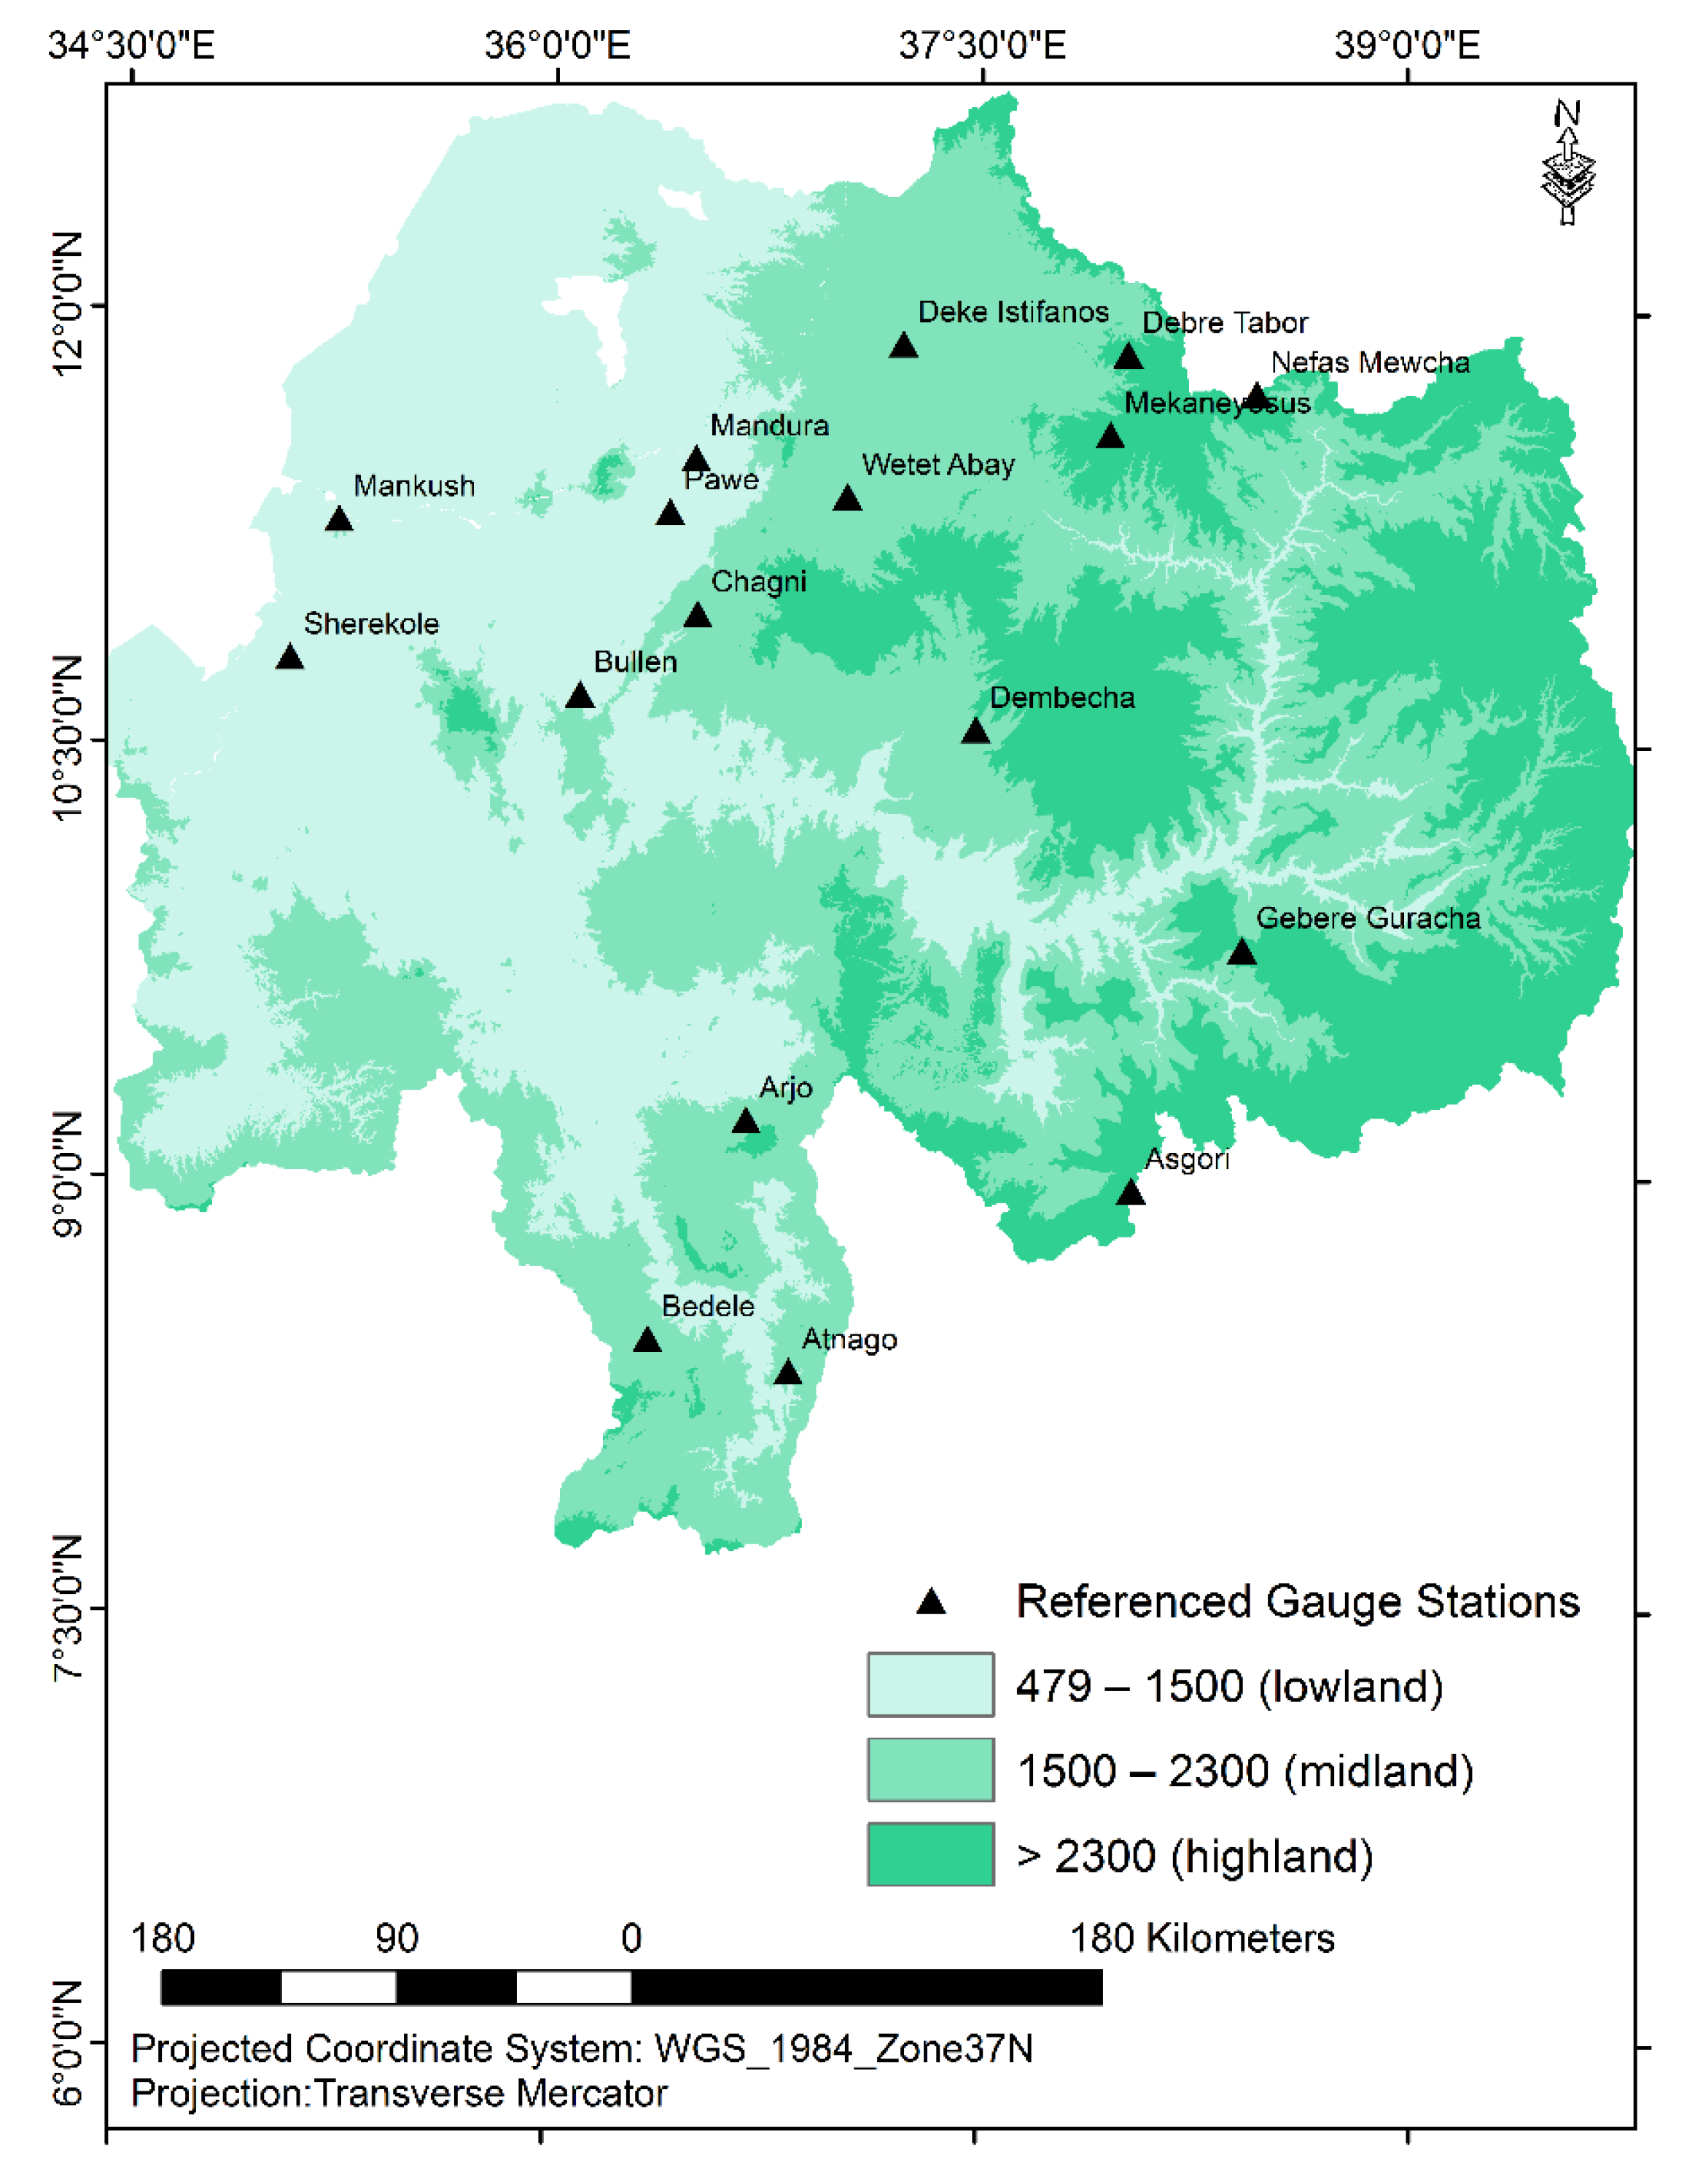
2.2.2. Observed Dataset
2.3. Performance Evaluation of Satellite Rainfall Estimates
2.4. Meteorological Drought Index
3. Results and Discussions
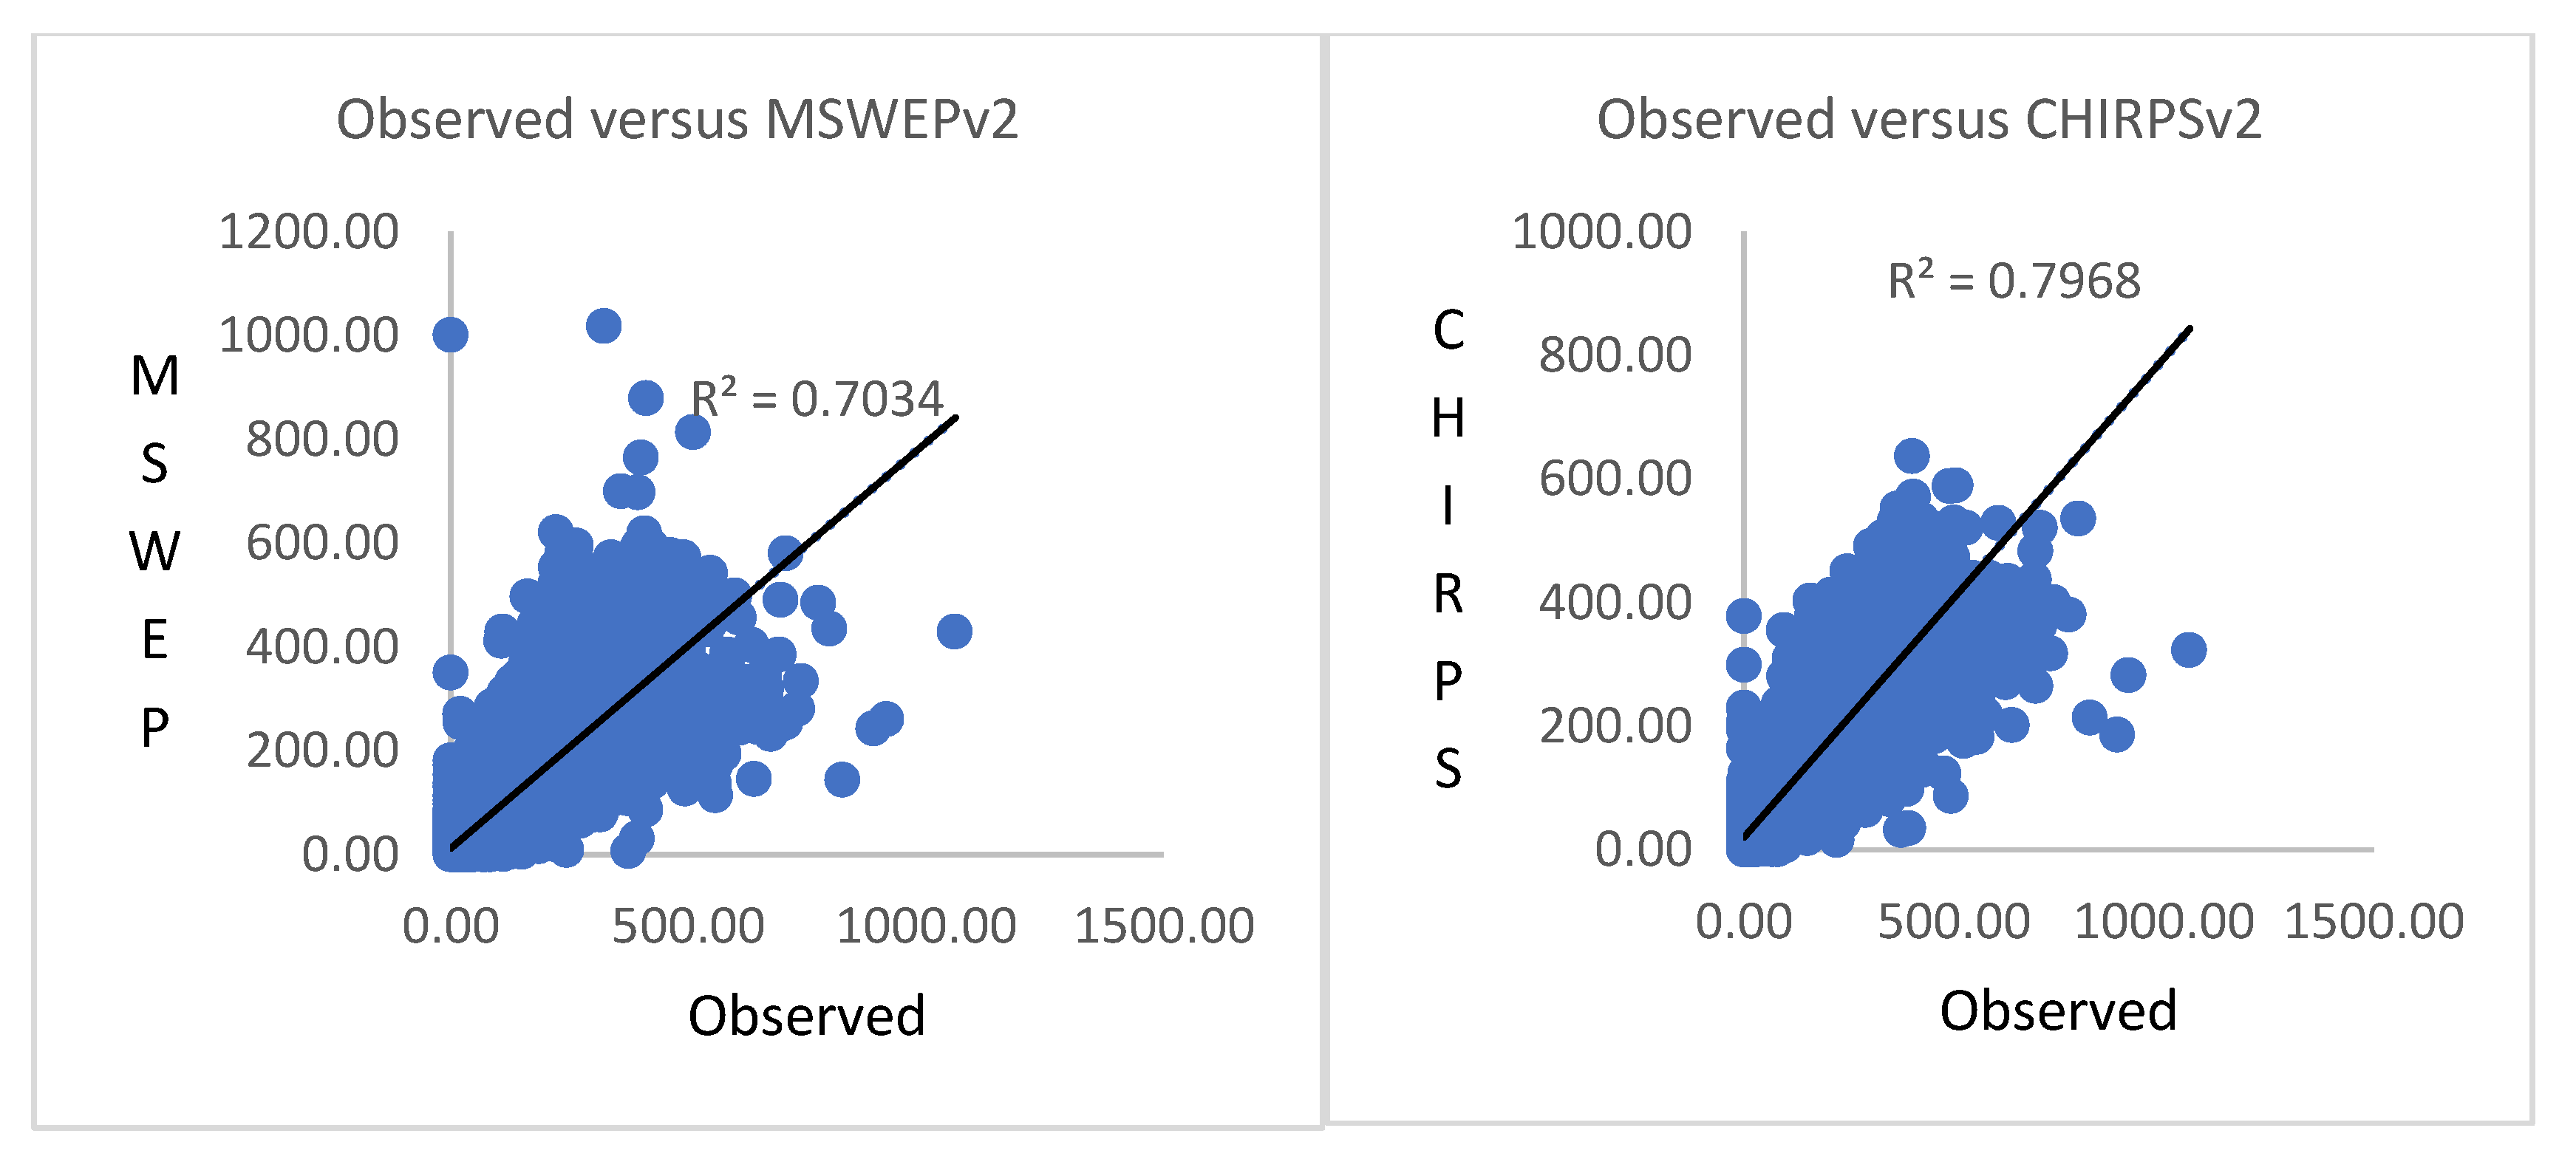
3.1. Performance Evaluation of the Satellite Rainfall Estimates
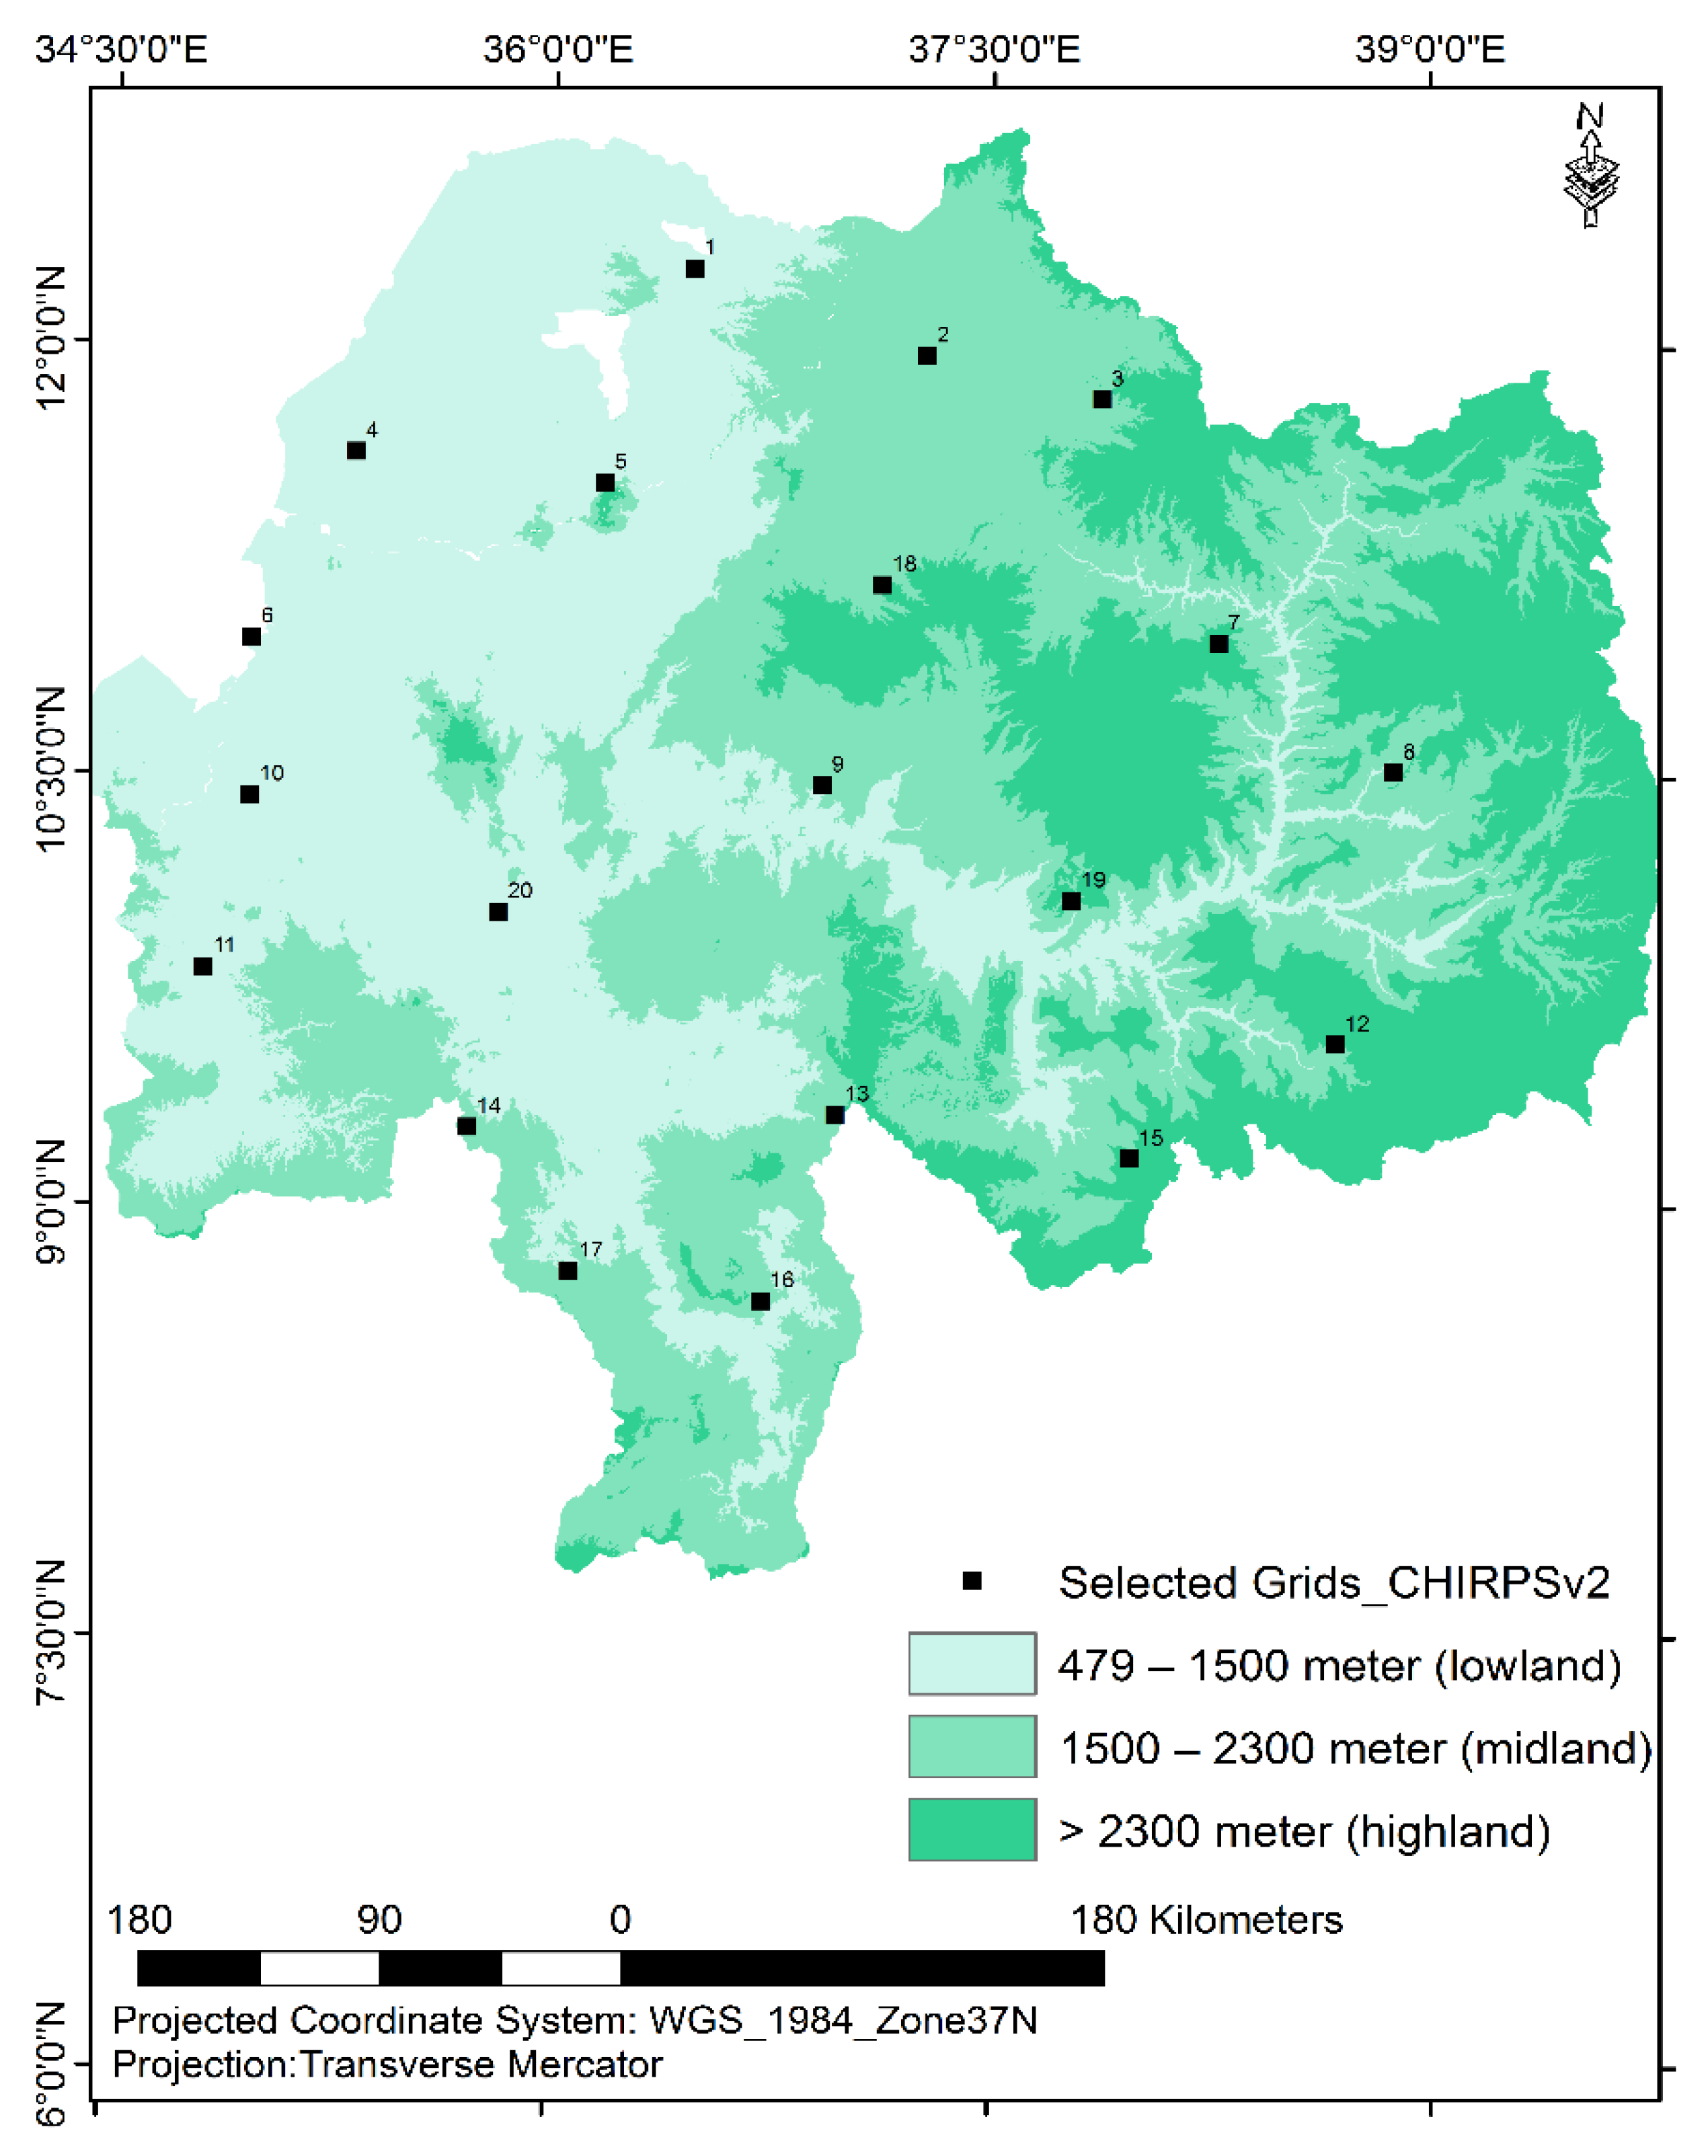
3.2. Meteorological Drought in the UBN Basin
4. Conclusions and Recommendations
Author Contributions
Funding
Acknowledgments
Conflicts of Interest
References
- Conway, D. The climate and hydrology of the Upper Blue Nile River. Geogr. J. 2000, 166, 49–62. [Google Scholar] [CrossRef]
- Abou Hadid, A.F.; Mohamed, A.A.A.; Ahmed, M.S.M.; Abdrabbo, M.A.A. Trend of Change in Cultivated Area and Water Budget for Major Crops in Egypt using GIS and Field Survey Technique. J. Agric. Inform. 2015, 6, 42–56. [Google Scholar]
- Hagos, F.; Makombe, G.; Namara, R.E.; Awulachew, S.B. Importance of Irrigated Agriculture to the Ethiopian Economy: Capturing the Direct Net Benefits of Irrigation; International Water Management Institute (IWMI): Colombo, Sri Lanka, 2009; Volume 128. [Google Scholar]
- CSA; World Bank. Ethiopia Rural Socioeconomic Survey (ERSS); CSA: Addis Ababa, Ethiopia; World Bank: Washington, DC, USA, 2013. [Google Scholar]
- Cook, B.I.; Mankin, J.S.; Anchukaitis, K.J. Climate change and drought: From past to future. Curr. Clim. Chang. Rep. 2018, 4, 164–179. [Google Scholar] [CrossRef]
- Segele, Z.T.; Lamb, P.J. Characterization and variability of Kiremt rainy season over Ethiopia. Meteorol. Atmos. Phys. 2005, 89, 153–180. [Google Scholar] [CrossRef]
- Mohammed, Y.; Yimer, F.; Tadesse, M.; Tesfaye, K. Meteorological drought assessment in north east highlands of Ethiopia. Int. J. Clim. Chang. Strateg. Manag. 2018, 10, 142–160. [Google Scholar] [CrossRef]
- Bayissa, Y.; Tadesse, T.; Demisse, G.; Shiferaw, A. Evaluation of satellite-based rainfall estimates and application to monitor meteorological drought for the Upper Blue Nile Basin, Ethiopia. Remote Sens. 2017, 9, 669. [Google Scholar] [CrossRef]
- Gray, C.; Mueller, V. Drought and population mobility in rural Ethiopia. World Dev. 2012, 40, 134–145. [Google Scholar] [CrossRef]
- Degefu, W. Some Aspects of Meteorological Drought in Ethiopia; Cambridge University Press: Cambridge, UK, 1987. [Google Scholar]
- Evangelista, P.; Young, N.; Burnett, J. How will climate change spatially affect agriculture production in Ethiopia? Case studies of important cereal crops. Clim. Chang. 2013, 119, 855–873. [Google Scholar] [CrossRef]
- Sadoff, C. Can Water Undermine Growth? Evidence from Ethiopia; The World Bank: Washington, DC, USA, 2006. [Google Scholar]
- Mulat, A.G.; Moges, S.A. Assessment of the impact of the Grand Ethiopian Renaissance Dam on the performance of the High Aswan Dam. J. Water Resour. Prot. 2014, 2014, 583–598. [Google Scholar] [CrossRef]
- Taye, M.; Simane, B.; Zaitchik, B.F.; Selassie, Y.G.; Setegn, S. Rainfall Variability across the Agro-Climatic Zones of a Tropical Highland: The Case of the Jema Watershed, Northwestern Ethiopia. Environments 2019, 6, 118. [Google Scholar] [CrossRef]
- Dinku, T.; Hailemariam, K.; Maidment, R.; Tarnavsky, E.; Connor, S. Combined use of satellite estimates and rain gauge observations to generate high-quality historical rainfall time series over Ethiopia. Int. J. Climatol. 2014, 34, 2489–2504. [Google Scholar] [CrossRef]
- Funk, C.; Peterson, P.; Landsfeld, M.; Pedreros, D.; Verdin, J.; Shukla, S.; Husak, G.; Rowland, J.; Harrison, L.; Hoell, A.; et al. The climate hazards infrared precipitation with stations—A new environmental record for monitoring extremes. Sci. Data 2015, 2, 1–21. [Google Scholar] [CrossRef] [PubMed]
- Beck, H.E.; Wood, E.F.; Pan, M.; Fisher, C.K.; Miralles, D.G.; van Dijk, A.I.; McVicar, T.R.; Adler, R.F. MSWEP V2 global 3-hourly 0.1 precipitation: Methodology and quantitative assessment. Bull. Am. Meteorol. Soc. 2019, 100, 473–500. [Google Scholar] [CrossRef]
- Dinku, T.; Funk, C.; Peterson, P.; Maidment, R.; Tadesse, T.; Gadain, H.; Ceccato, P. Validation of the CHIRPS satellite rainfall estimates over eastern Africa. Q. J. R. Meteorol. Soc. 2018, 144, 292–312. [Google Scholar] [CrossRef]
- Sahlu, D.; Moges, S.A.; Nikolopoulos, E.I.; Anagnostou, E.N.; Hailu, D. Evaluation of high-resolution multisatellite and reanalysis rainfall products over East Africa. Adv. Meteorol. 2017, 2017, 1–14. [Google Scholar] [CrossRef]
- Huffman, G.J.; Bolvin, D.T.; Nelkin, E.J.; Wolff, D.B.; Adler, R.F.; Gu, G.; Hong, Y.; Bowman, K.P.; Stocker, E.F. The TRMM multisatellite precipitation analysis (TMPA): Quasi-global, multiyear, combined-sensor precipitation estimates at fine scales. J. Hydrometeorol. 2007, 8, 38–55. [Google Scholar] [CrossRef]
- Joyce, R.J.; Janowiak, J.E.; Arkin, P.A.; Xie, P. CMORPH: A method that produces global precipitation estimates from passive microwave and infrared data at high spatial and temporal resolution. J. Hydrometeorol. 2004, 5, 487–503. [Google Scholar] [CrossRef]
- Osczevski, R.J. Windward cooling: An overlooked factor in the calculation of wind chill. Bull. Am. Meteorol. Soc. 2000, 81, 2975–2978. [Google Scholar] [CrossRef]
- Tarnavsky, E.; Grimes, D.; Maidment, R.; Black, E.; Allan, R.P.; Stringer, M.; Chadwick, R.; Kayitakire, F. Extension of the TAMSAT satellite-based rainfall monitoring over Africa and from 1983 to present. J. Appl. Meteorol. Climatol. 2014, 53, 2805–2822. [Google Scholar] [CrossRef]
- Okamoto, K.I.; Ushio, T.; Iguchi, T.; Takahashi, N.; Iwanami, K. The global satellite mapping of precipitation (GSMaP) project. In Proceedings 2005 IEEE International Geoscience and Remote Sensing Symposium, Seoul, Korea, 29 July 2005. IGARSS’05; IEEE: New Jersey, NJ, USA, 2005; Volume 5, pp. 3414–3416. [Google Scholar]
- Betrie, G.D.; Mohamed, Y.A.; van Griensven, A.; Srinivasan, R. Sediment Management Modelling in the Blue Nile Basin Using SWAT Model; Copernicus, GmbH: Göttingen, Germany, 2011. [Google Scholar]
- Taye, M.; Simane, B.; Zaitchik, B.F.; Selassie, Y.G.; Setegn, S. Land Use Evaluation over the Jema Watershed, in the Upper Blue Nile River Basin, Northwestern Highlands of Ethiopia. Land 2019, 8, 50. [Google Scholar] [CrossRef]
- Gebremicael, T.G.; Mohamed, Y.A.; Betrie, G.D.; van der Zaag, P.; Teferi, E. Trend analysis of runoff and sediment fluxes in the Upper Blue Nile basin: A combined analysis of statistical tests, physically-based models and landuse maps. J. Hydrol. 2013, 482, 57–68. [Google Scholar] [CrossRef]
- Mellander, P.E.; Gebrehiwot, S.G.; Gärdenäs, A.I.; Bewket, W.; Bishop, K. Summer rains and dry seasons in the Upper Blue Nile Basin: The predictability of half a century of past and future spatiotemporal patterns. PLoS ONE 2013, 8, e68461. [Google Scholar] [CrossRef] [PubMed]
- McCartney, M.; Girma, M.M.; Demissie, S.S. Implications of climate change on existing and planned water resource development in the Upper Blue Nile. In International Water Management Institute Conference Papers; International Water Management Institute: Colombo, Sri Lanka, 2013. [Google Scholar]
- Beck, E.H.; van Dijk, A.I.J.M.; Levizzani, V.; Schellekens, J.; Miralles, D.G.; Martens, B.; de Roo, A. MSWEP: 3-hourly 0.25 global gridded precipitation (1979–2015) by merging gauge, satellite, and reanalysis data. Hydrol. Earth Syst. Sci. 2017, 21, 589–615. [Google Scholar] [CrossRef]
- Zhang, T.; Li, B.; Wang, J.; Hu, M.; Xu, L. Estimation of areal mean rainfall in remote areas using B-SHADE Model. Adv. Meteorol. 2016, 2016, 1–13. [Google Scholar]
- Onyutha, C. From R-squared to coefficient of model accuracy for assessing goodness-of-fits. Geosci. Model. Dev. Discuss. 2020, 1–25. [Google Scholar] [CrossRef]
- McKee, B.T.; Doesken, N.J.; Kleist, J. The Relationship of Drought Frequency and Duration to Time Scales. In Proceedings of the 8th Conference on Applied Climatology, Anaheim, CA, USA, 17–22 January 1993; pp. 179–183. [Google Scholar]
- Hayes, M.; Svoboda, M.; Wall, N.; Widhalm, M. The Lincoln declaration on drought indices: Universal meteorological drought index recommended. Bull. Am. Meteorol. Soc. 2011, 92, 485–488. [Google Scholar] [CrossRef]
- Svoboda, M.; Fuchs, B.A. Handbook of Drought Indicators and Indices. In Integrated Drought Management Programme (IDMP), Integrated Drought Management Tools and Guidelines; Series 2; World Meteorological Organization (WMO): Geneva, Switzerland; Global Water Partnership (GWP): Stockholdm, Sweden, 2016. [Google Scholar]
- Svoboda, M.; Hayes, M.; Wood, D. Standardized Precipitation Index User Guide; World Meteorological Organization: Geneva, Switzerland, 2012. [Google Scholar]
- Vicente-Serrano, M.S.; Beguería, S.; Lorenzo-Lacruz, J.; Camarero, J.J.; López-Moreno, J.I.; Azorin-Molina, C.; Revuelto, J.; Morán-Tejeda, E.; Sanchez-Lorenzo, A. Performance of drought indices for ecological, agricultural, and hydrological applications. Earth Interact. 2012, 16, 1–27. [Google Scholar] [CrossRef]
- Ntale, H.K.; Gan, T.Y. Drought indices and their application to East Africa. Int. J. Climatol. 2003, 23, 1335–1357. [Google Scholar] [CrossRef]
- Keyantash, J.; Dracup, J.A. The quantification of drought: An evaluation of drought indices. Bull. Am. Meteorol. Soc. 2002, 83, 1167–1180. [Google Scholar] [CrossRef]
- Morid, S.; Smakhtin, V.; Moghaddasi, M. Comparison of seven meteorological indices for drought monitoring in Iran. Int. J. Climatol. 2006, 26, 971–985. [Google Scholar] [CrossRef]
- Tigkas, D.; Vangelis, H.; Tsakiris, G. DrinC: A software for drought analysis based on drought indices. Earth Sci. Inform. 2015, 8, 697–709. [Google Scholar] [CrossRef]
- Svensson, C.; Hannaford, J.; Prosdocimi, I. Statistical distributions for monthly aggregations of precipitation and streamflow in drought indicator applications. Water Resour. Res. 2017, 53, 999–1018. [Google Scholar] [CrossRef]
- Lloyd-Hughes, B.; Saunders, M.A. A drought climatology for Europe. Int. J. Climatol. 2002, 22, 1571–1592. [Google Scholar] [CrossRef]
- Stagge, H.J.; Tallaksen, L.M.; Gudmundsson, L.; van Loon, A.F.; Stahl, K. Candidate distributions for climatological drought indices (SPI and SPEI). Int. J. Climatol. 2015, 35, 4027–4040. [Google Scholar]
- Bayissa, A.Y.; Moges, S.A.; Xuan, Y.; van Andel, S.J.; Maskey, S.; Solomatine, D.P.; van Griensven, A.; Tadesse, T. Spatio-temporal assessment of meteorological drought under the influence of varying record length: The case of Upper Blue Nile Basin, Ethiopia. Hydrol. Sci. J. 2015, 60, 1927–1942. [Google Scholar] [CrossRef]
- Bayissa, A.Y.; Maskey, S.; Tadesse, T.; van Andel, S.J.; Moges, S.; van Griensven, A.; Solomatine, D.P. Comparison of the performance of six drought indices in characterizing historical drought for the upper Blue Nile basin, Ethiopia. Geosciences 2018, 8, 81. [Google Scholar] [CrossRef]
- Hisdal, H.; Stahl, K.; Tallaksen, L.M.; Demuth, S. Have streamflow droughts in Europe become more severe or frequent? Int. J. Climatol. 2001, 21, 317–333. [Google Scholar] [CrossRef]
- Tallaksen, L.; Hisdal, H. Regional analysis of extreme streamflow drought duration and deficit volume. FRIEND’97 Reg. Hydrol. Concepts Models Sustain. Water Resour. Manag. 1997, 246, 141. [Google Scholar]
- Taye, M.; Simane, B.; Zaitchik, B.F.; Setegn, S.; Selassie, Y.G. Analysis of the Spatial Patterns of Rainfall across the Agro-Climatic Zones of Jema Watershed in the Northwestern Highlands of Ethiopia. Geosciences 2019, 9, 22. [Google Scholar] [CrossRef]
- Mengistu, D.; Bewket, W.; Lal, R. Recent spatiotemporal temperature and rainfall variability and trends over the Upper Blue Nile River Basin, Ethiopia. Int. J. Climatol. 2014, 34, 2278–2292. [Google Scholar] [CrossRef]
- Berhane, F.; Zaitchik, B.; Dezfuli, A. Subseasonal analysis of precipitation variability in the Blue Nile River Basin. J. Clim. 2014, 27, 325–344. [Google Scholar] [CrossRef]
- Field, C.B. Climate Change 2014–Impacts, Adaptation and Vulnerability: Regional Aspects; Cambridge University Press: Cambridge, UK, 2014. [Google Scholar]

| Satellite Rainfall Product Name | Temporal Coverage | Spatial Resolution | Temporal Resolution | Spatial Coverage | Input | Data Source | Reference |
|---|---|---|---|---|---|---|---|
| 1 MSWEPv2 | 1979–present | 0.1° | Daily | Global | Satellite estimates, reanalysis data sources, and gridded gauge | 3 G–WADI USA | [17] |
| 2 CHIRPSv2 | 1981–present | 0.05° | Pentad | Quasi-global (Spanning 50° S–50° N (and all longitudes) | TIR satellite observation and gauge Meteosat thermal infra-red (TIR) imagery) | 4 USGS 5 EROS University of California Santa Barbara | [16] |
| SPI Value | Drought Severity |
|---|---|
| −2.00 and less | Extreme |
| −1.50 to −1.99 | Severe |
| −1.00 to −1.49 | Moderate |
| 0 to −0.99 | Near normal or mild |
| Above 0 | No |
| Station | r | Bias (mm) | PBias (%) | ME (mm) | MAE (mm) | RMSE (mm) |
|---|---|---|---|---|---|---|
| Highland | ||||||
| 1. Asgori | 0.86 | 0.79 | −20.63 | −20.67 | 20.67 | 79.52 |
| 2. Debre Tabor | 0.97 | 1 | 0.15 | 0.19 | 0.19 | 123.69 |
| 3. Gebere Guracha | 0.93 | 1.3 | 29.91 | 25.91 | 25.91 | 112.52 |
| 4. Mekaneyesus | 0.85 | 0.78 | −21.92 | −24.36 | 24.36 | 86.79 |
| 5. Nefas Mewcha | 0.97 | 1 | 0.29 | 0.24 | 0.24 | 83.47 |
| Mean | 0.92 | 0.97 | −2.44 | −3.74 | 14.27 | 97.20 |
| Midland | ||||||
| 1. Atnago | 0.87 | 1.02 | 1.87 | 2.62 | 2.62 | 142.84 |
| 2. Arjo | 0.91 | 1.29 | 28.65 | 41.48 | 41.48 | 186.26 |
| 3. Bedele | 0.93 | 1.07 | 7.33 | 10.74 | 10.74 | 157.35 |
| 4. Chagni | 0.95 | 0.91 | −9.18 | −15.03 | 15.03 | 148.72 |
| 5. Deke Istifanos | 0.9 | 1.19 | 18.64 | 20.83 | 20.83 | 132.55 |
| 6. Dembecha | 0.93 | 1.02 | 2.32 | 2.54 | 2.54 | 111.71 |
| 7. Wetet Abay | 0.92 | 1.14 | 13.62 | 17.07 | 17.07 | 142.44 |
| Mean | 0.92 | 1.09 | 9.04 | 11.46 | 15.76 | 145.98 |
| Lowland | ||||||
| 1. Bullen | 0.93 | 1.02 | 2.39 | 2.85 | 2.85 | 121.95 |
| 2. Mandura | 0.9 | 1.35 | 34.9 | 44.79 | 44.79 | 173.11 |
| 3. Mankush | 0.9 | 0.87 | −13.27 | −13.28 | 13.28 | 86.79 |
| 4. Pawe | 0.95 | 1.03 | 3.48 | 4.55 | 4.55 | 135.38 |
| 5. Sherekole | 0.82 | 1.36 | 36.21 | 31.04 | 31.04 | 54.68 |
| Mean | 0.90 | 1.13 | 12.74 | 13.99 | 19.30 | 114.38 |
| Mean to the UBN | 0.91 | 1.07 | 6.75 | 7.74 | 16.36 | 122.34 |
| Station | r | Bias (mm) | PBias (%) | ME (mm) | MAE (mm) | RMSE (mm) |
|---|---|---|---|---|---|---|
| Highland | ||||||
| 6. Asgori | 0.84 | 0.99 | −0.54 | −0.43 | 0.43 | 79.61 |
| 7. Debre Tabor | 0.93 | 1.4 | 39.58 | 37.07 | 37.07 | 130.73 |
| 8. Gebere Guracha | 0.9 | 1.56 | 55.55 | 41.29 | 41.29 | 115.61 |
| 9. Mekaneyesus | 0.78 | 0.83 | −16.89 | −18.01 | 18.01 | 88.65 |
| 10. Nefas Mewcha | 0.95 | 1.19 | 19.07 | 13.68 | 13.68 | 85.41 |
| Mean | 0.88 | 1.19 | 19.35 | 14.72 | 22.10 | 100.00 |
| Midland | ||||||
| 8. Atnago | 0.8 | 1.09 | 9.5 | 13.01 | 13.01 | 150.03 |
| 9. Arjo | 0.87 | 1.6 | 59.76 | 74.12 | 74.12 | 198.14 |
| 10. Bedele | 0.91 | 1.1 | 10.35 | 15.09 | 15.09 | 160.86 |
| 11. Chagni | 0.9 | 1.09 | 8.86 | 11.96 | 11.96 | 147 |
| 12. Deke Istifanos | 0.84 | 1.23 | 23.09 | 26.8 | 26.8 | 142.89 |
| 13. Dembecha | 0.86 | 1.06 | 5.62 | 6.03 | 6.03 | 113.49 |
| 14. Wetet Abay | 0.85 | 1.25 | 25.45 | 31.61 | 31.61 | 155.8 |
| Mean | 0.86 | 1.20 | 20.38 | 25.52 | 25.52 | 152.60 |
| Lowland | ||||||
| 6. Bullen | 0.9 | 0.91 | −8.65 | −11.77 | 11.77 | 124.38 |
| 7. Mandura | 0.85 | 1.51 | 50.63 | 61.8 | 61.8 | 183.86 |
| 8. Mankush | 0.89 | 0.86 | −14.32 | −14.81 | 14.81 | 88.65 |
| 9. Pawe | 0.93 | 1.1 | 10.45 | 12.55 | 12.55 | 132.61 |
| 10. Sherekole | 0.78 | 1.38 | 38.09 | 32.21 | 32.21 | 116.77 |
| Mean | 0.87 | 1.15 | 15.24 | 16.00 | 26.63 | 129.25 |
| Mean to the UBN | 0.87 | 1.19 | 18.56 | 19.54 | 24.84 | 130.26 |
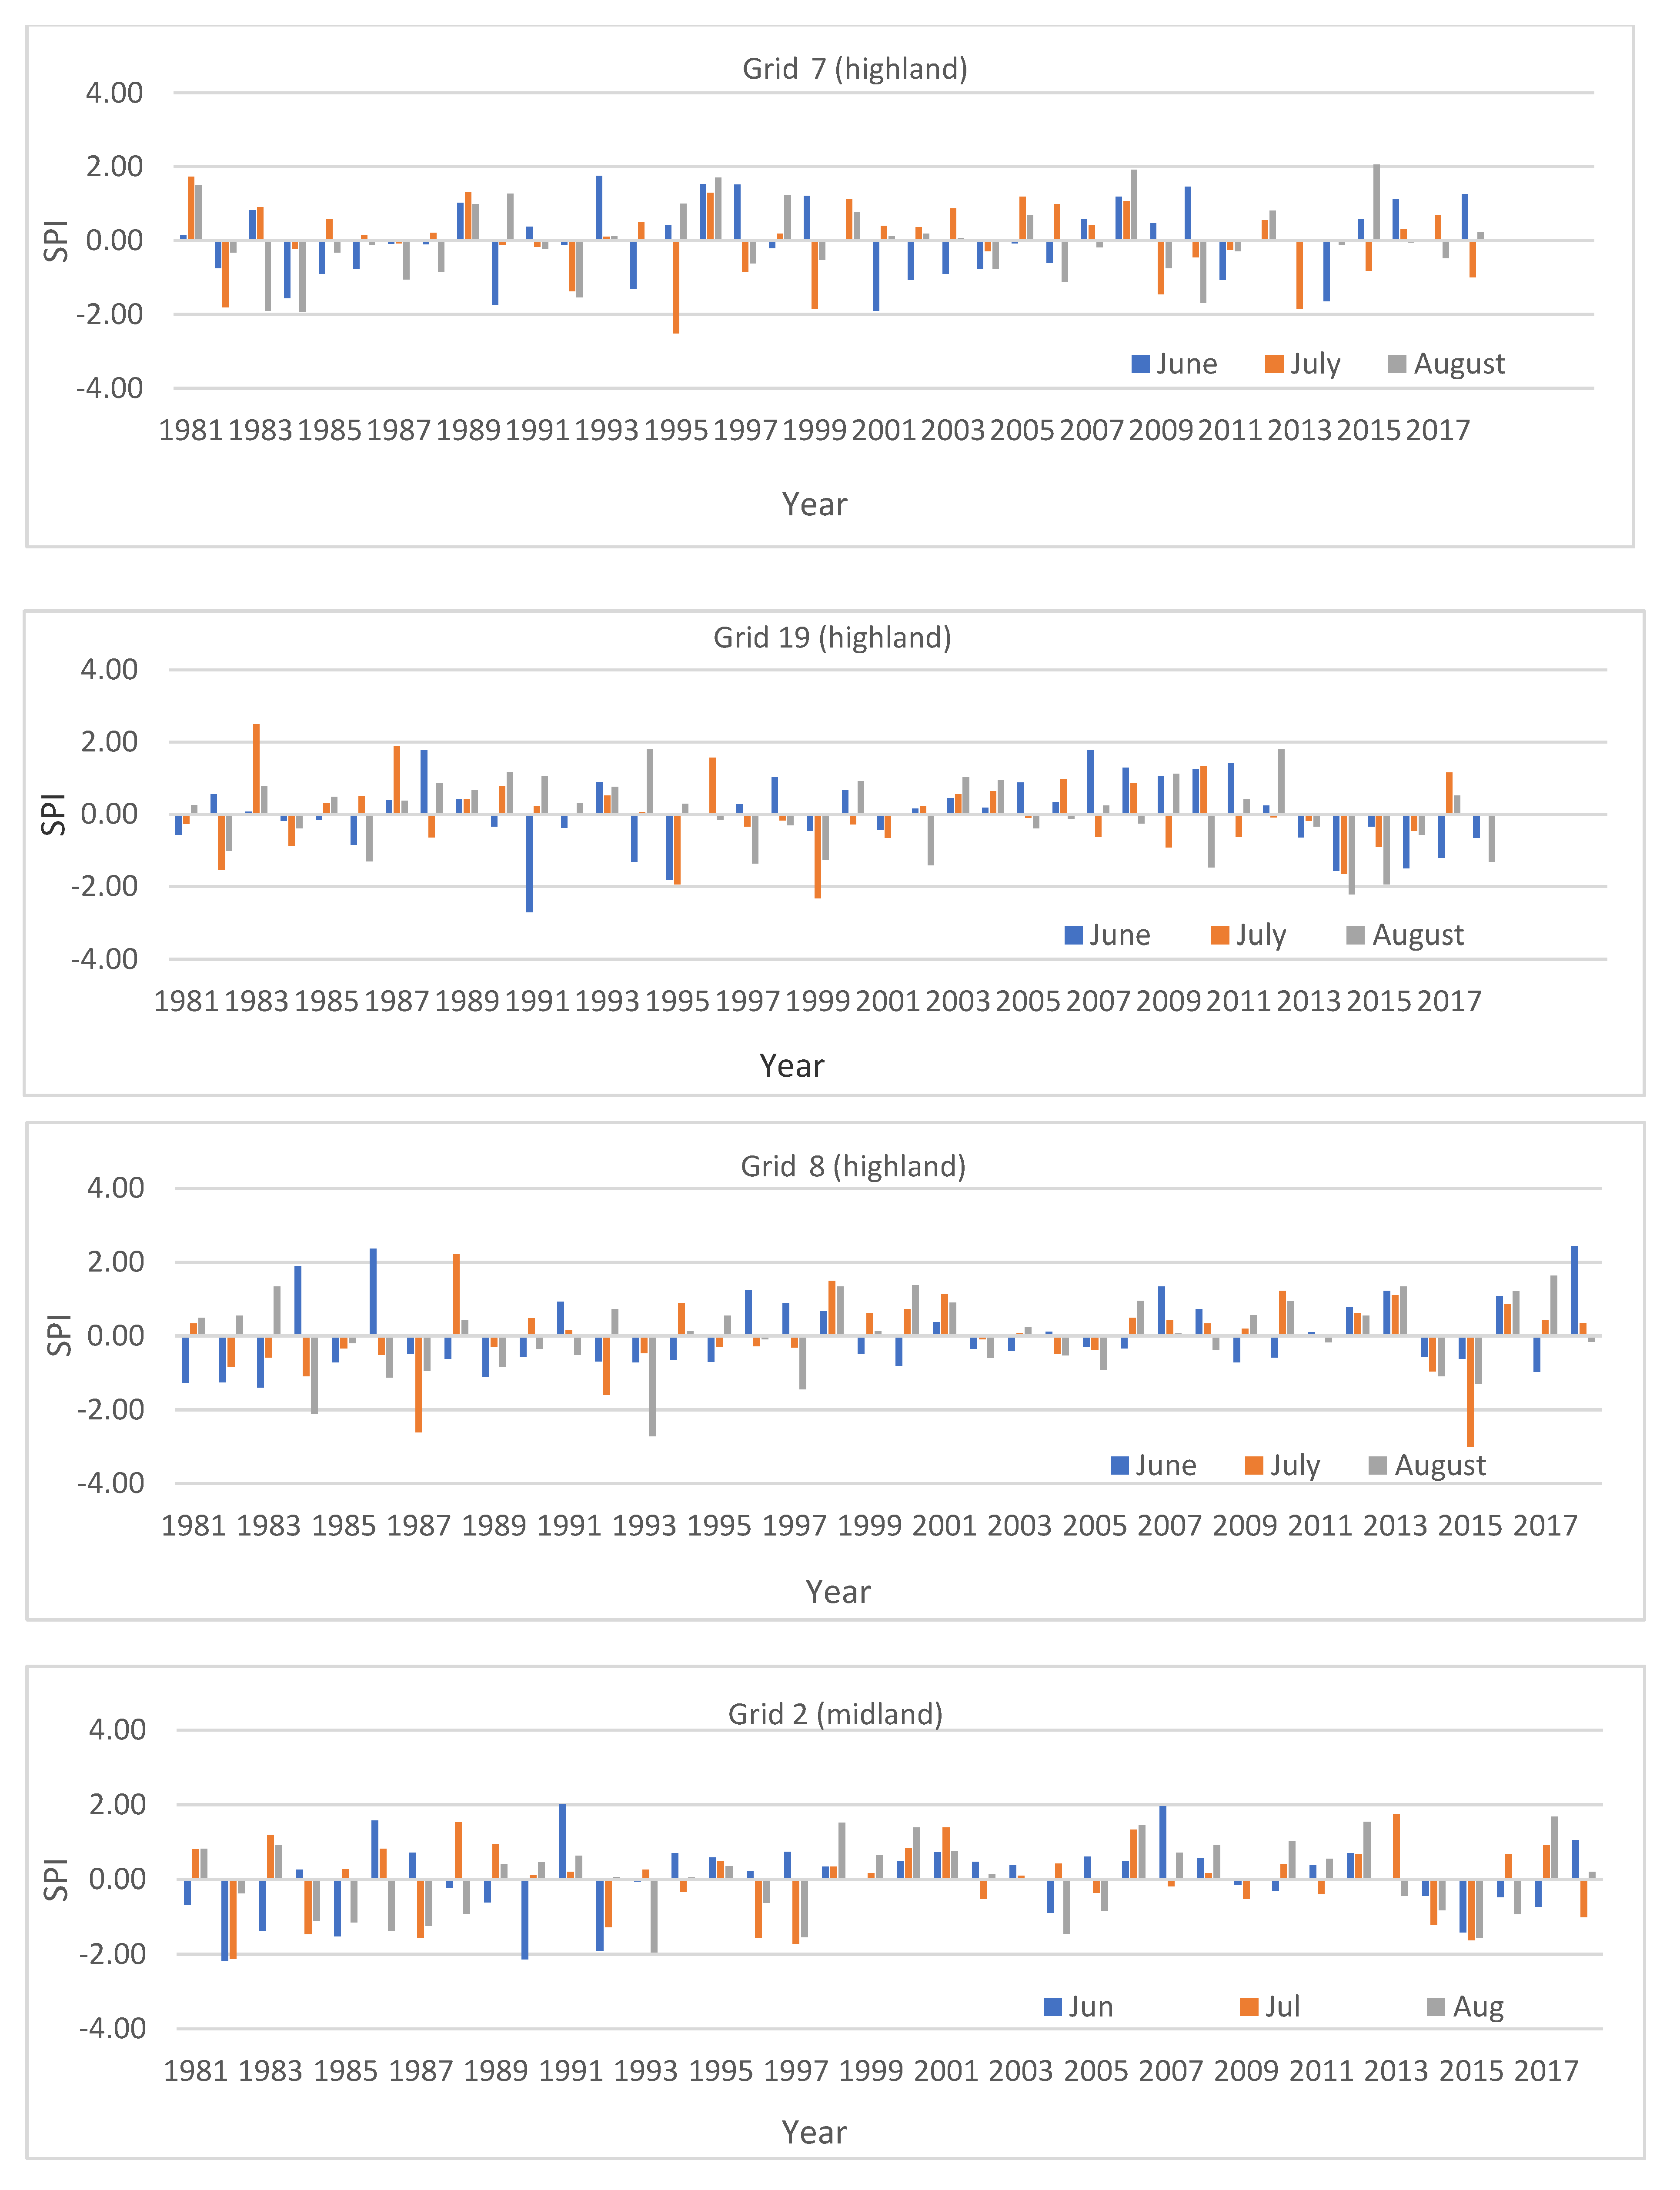
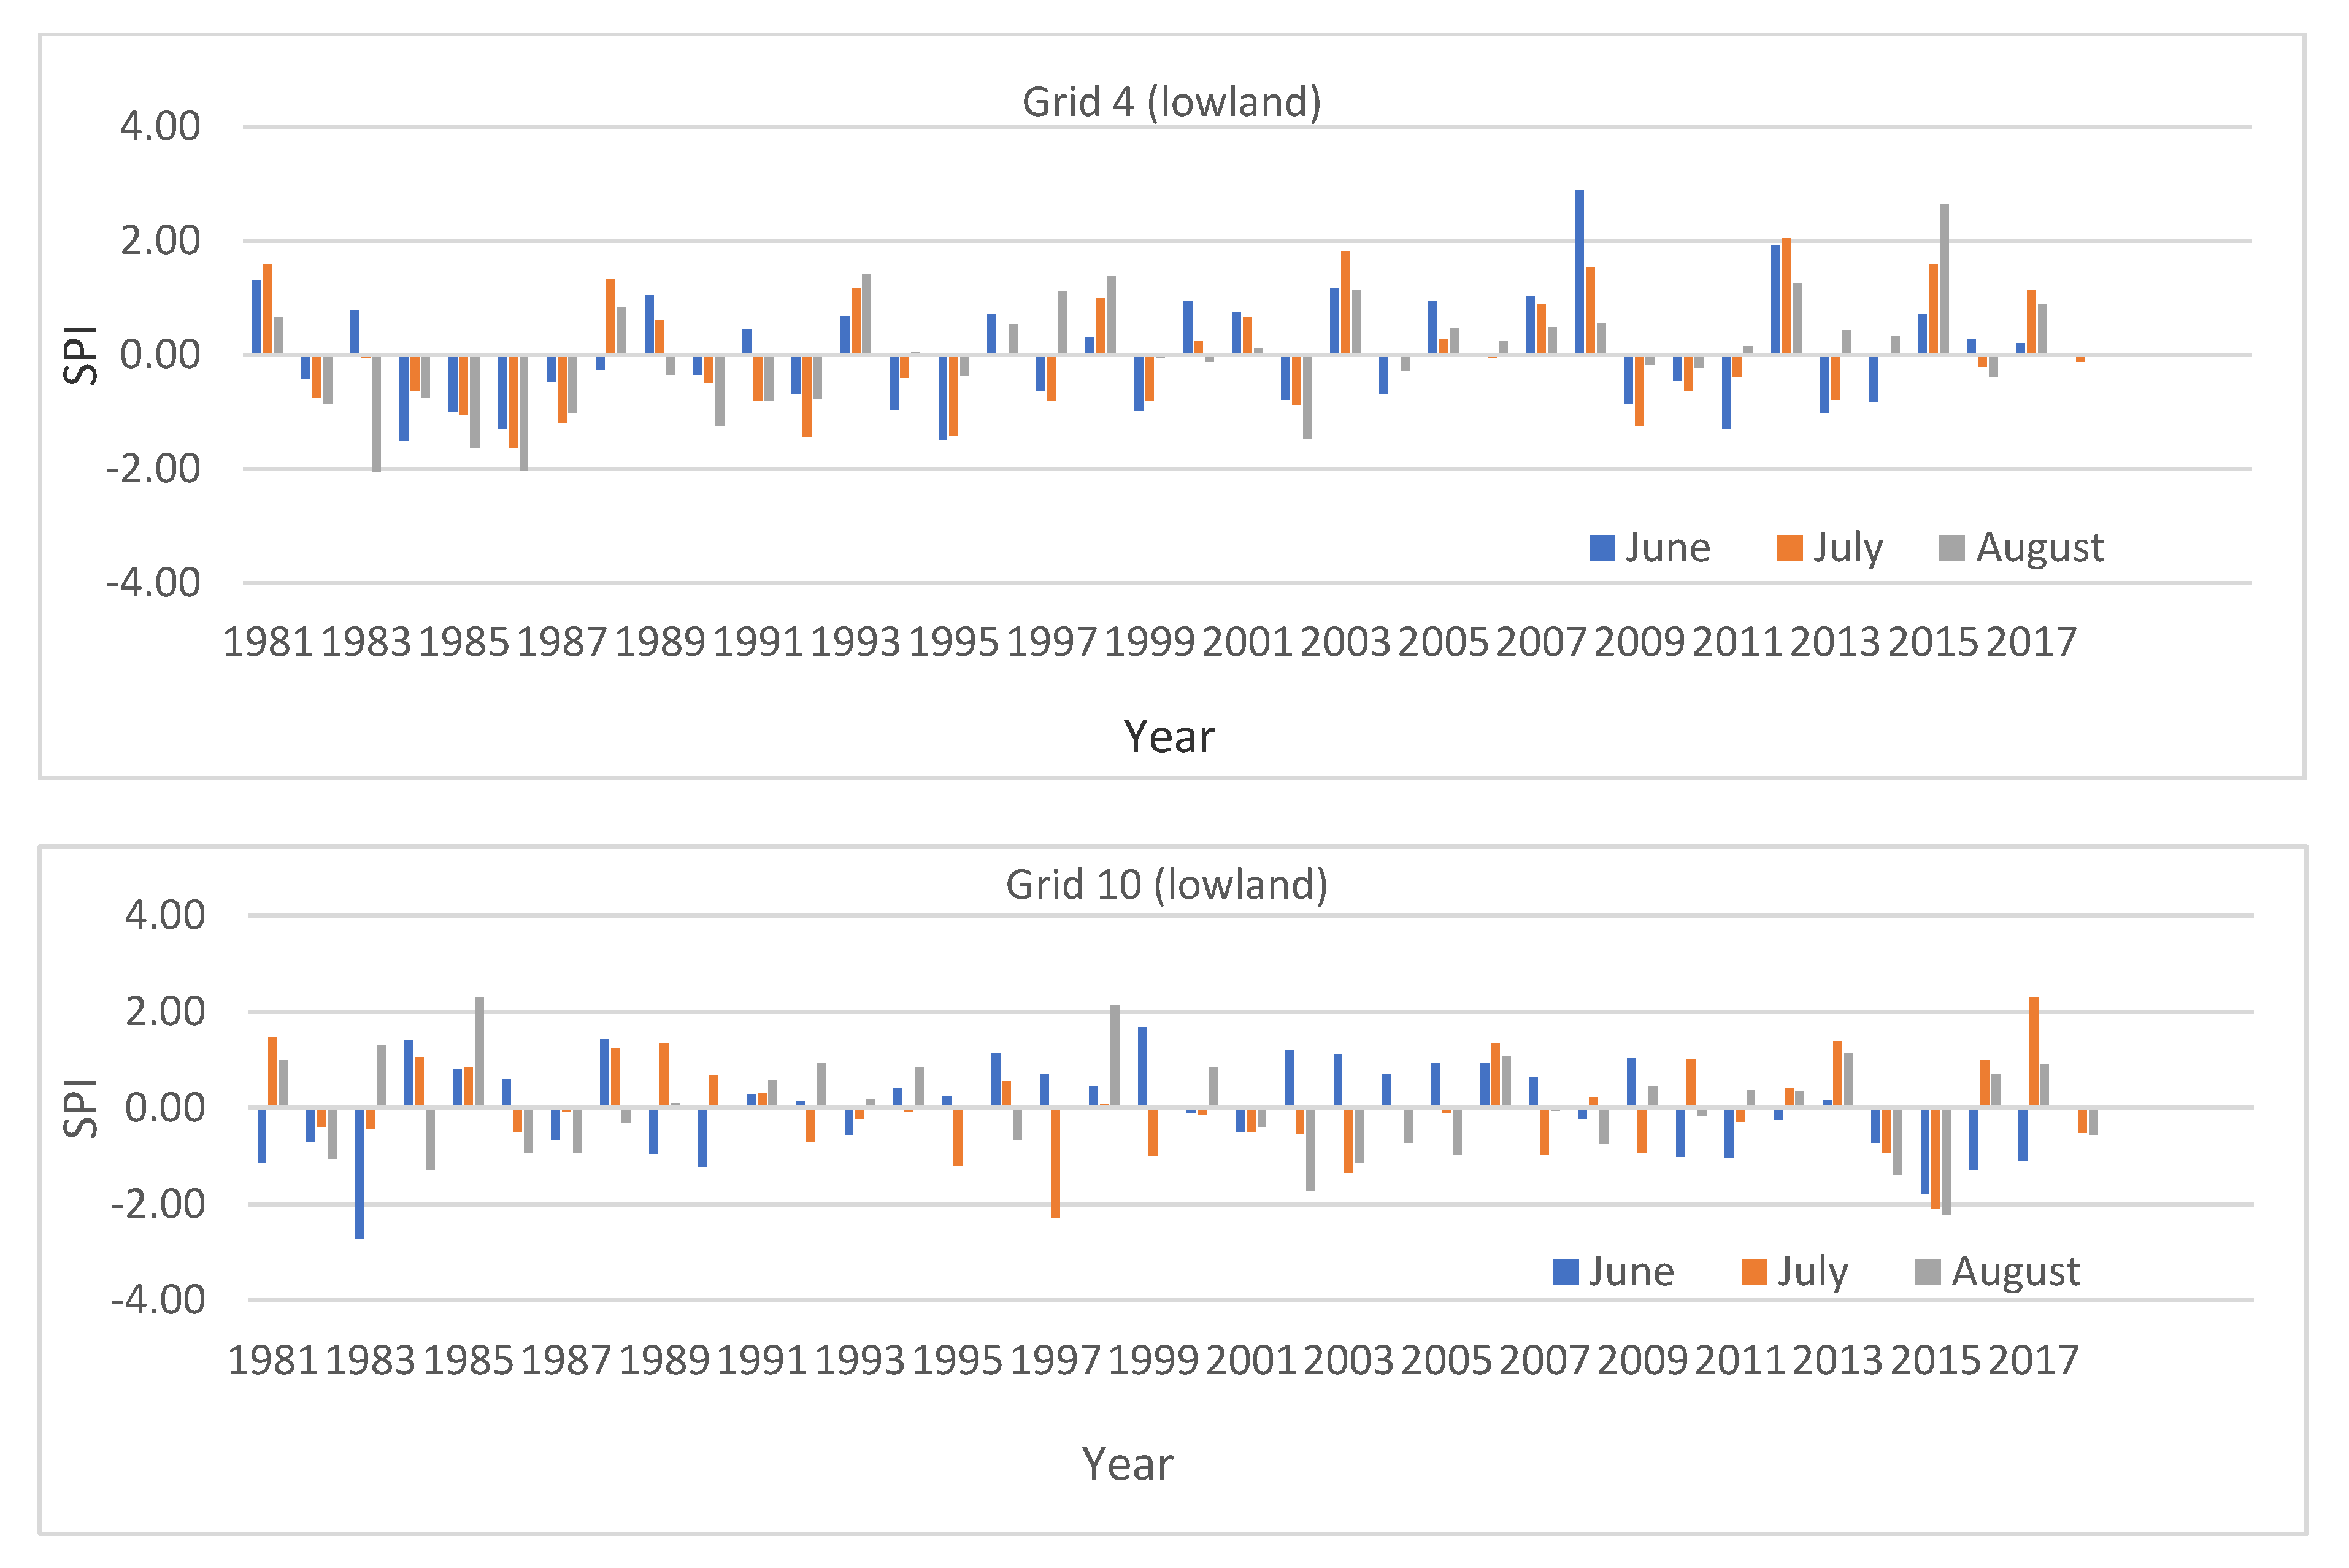
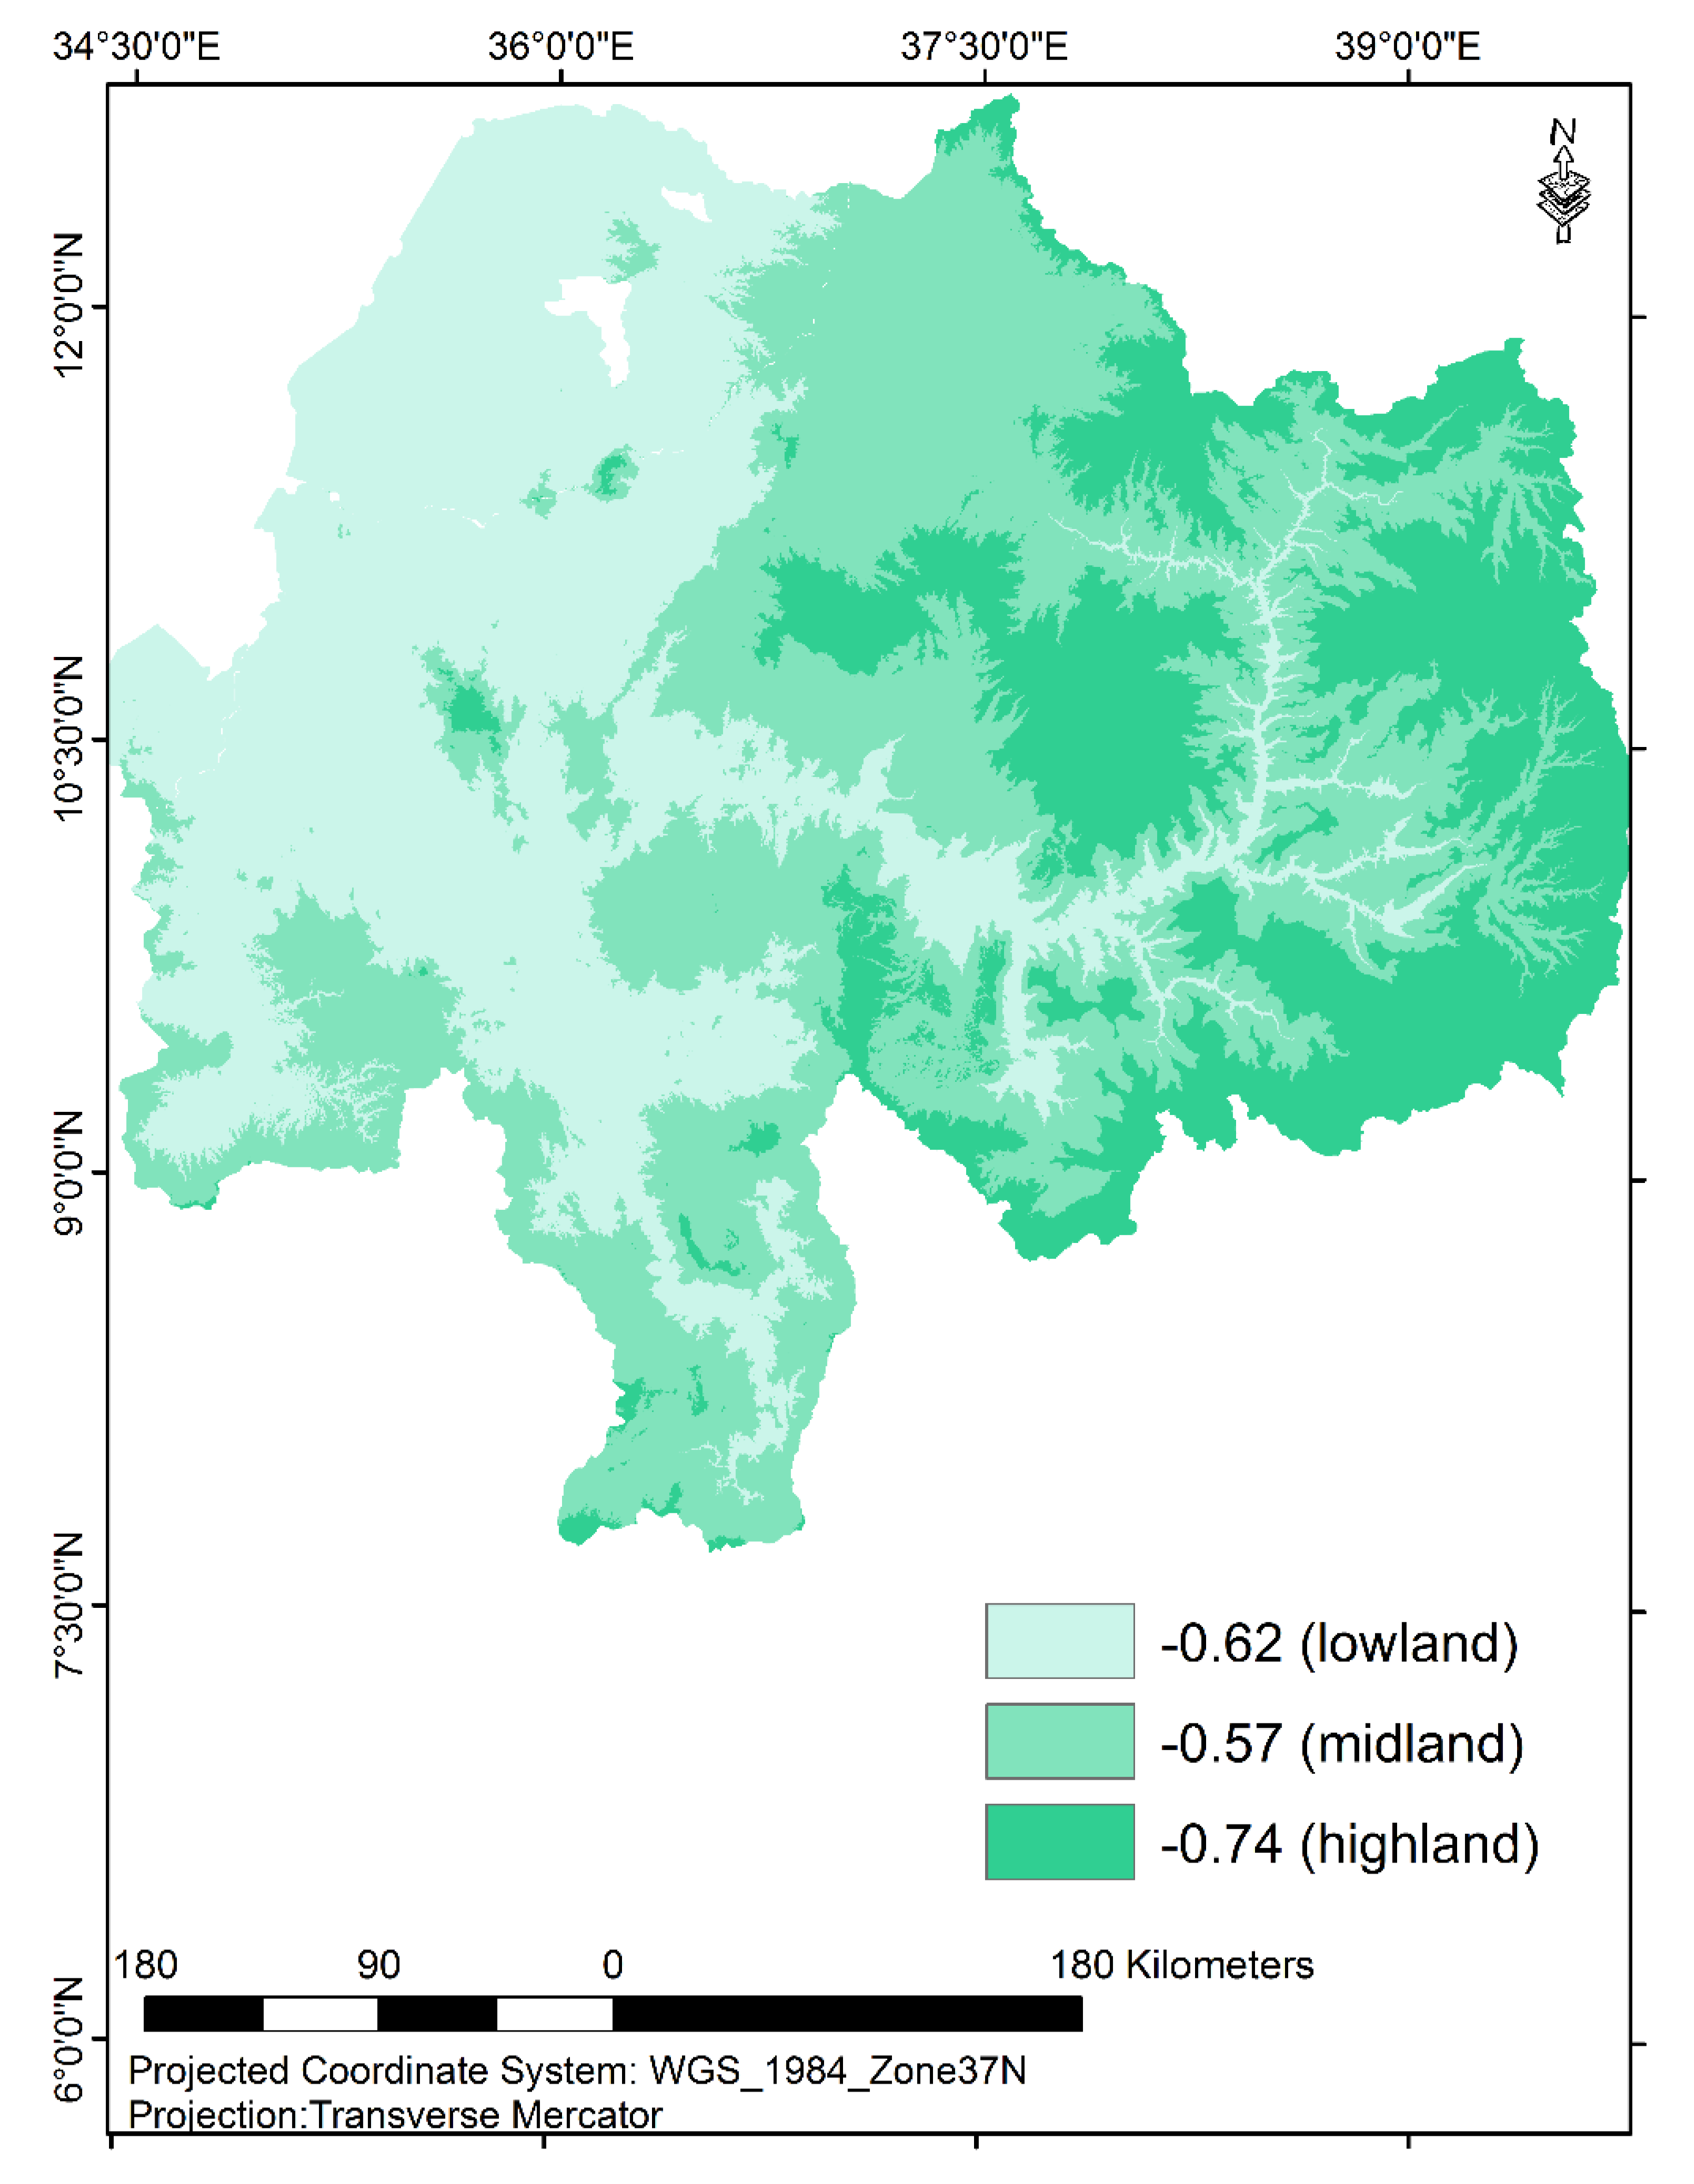
| Given ID Under Elevation Zones | SPI (June 2014) | SPI (July 2014) | SPI (June 2015) | SPI (July 2015) | SPI (June 2016) | SPI (July 2016) | SPI (June 2017) | SPI (July 2017) | Aggregated Mean |
|---|---|---|---|---|---|---|---|---|---|
| High land | |||||||||
| 3 | −0.45 | −1.23 | −1.24 | −1.67 | −0.49 | 0 | −0.87 | 0 | |
| 7 | −1.64 | −0.04 | 0 | −0.82 | 0 | 0 | −0.03 | −0.68 | |
| 8 | −0.57 | −0.96 | −0.61 | −3.0 | 0 | 0 | −0.97 | 0 | |
| 12 | −0.03 | −0.04 | −1.48 | −0.72 | −1.14 | −0.35 | −0.79 | 0 | |
| 15 | −1.47 | −1.81 | −0.18 | −2.68 | −0.17 | −0.89 | −1.09 | 0 | |
| 19 | −1.56 | −1.65 | −0.34 | −0.9 | −1.5 | −0.46 | −1.2 | 0 | |
| Mean | −0.95 | −0.96 | −0.64 | −1.63 | −0.55 | −0.28 | −0.83 | −0.11 | −0.74 |
| Mid Land | |||||||||
| 2 | −0.44 | −1.21 | −1.41 | −1.62 | −0.46 | −0.67 | −0.72 | 0 | |
| 9 | −0.46 | −0.55 | −0.59 | −2.94 | 0 | 0 | −1.28 | 0 | |
| 13 | 0 | −0.72 | −0.19 | −3.03 | 0 | 0 | −0.79 | −0.13 | |
| 14 | −1.03 | −1.09 | −0.24 | −0.93 | 0 | −0.14 | 0 | 0 | |
| 16 | −0.87 | −1.47 | −1.41 | 0 | −1.61 | −0.72 | −0.79 | 0 | |
| 17 | −1.39 | −0.69 | 0 | 0 | 0 | 0 | −0.52 | 0 | |
| 18 | −1.05 | 0 | 0 | 0 | 0 | 0 | −0.38 | 0 | |
| Mean | −0.75 | −0.82 | −0.55 | −1.22 | −0.30 | −0.22 | −0.64 | −0.02 | −0.57 |
| Low land | |||||||||
| 1 | −1.53 | −1.09 | −1.44 | −0.44 | −0.75 | −0.02 | −0.25 | 0 | |
| 4 | −0.82 | −0.02 | 0 | 0 | 0 | −0.02 | 0 | 0 | |
| 5 | −0.28 | −0.10 | −0.66 | 0 | −0.39 | 0 | −0.98 | 0 | |
| 6 | −0.66 | −0.75 | −2.27 | −1.76 | −1.35 | 0 | −1.12 | 0 | |
| 10 | −0.72 | −0.93 | −1.78 | −2.10 | −1.28 | 0 | −1.10 | 0 | |
| 11 | −1.15 | −0.27 | 0 | −0.55 | 0 | 0 | 0 | 0 | |
| 20 | −1.63 | −1.79 | −0.90 | −0.44 | −1.77 | −0.84 | −0.71 | 0 | |
| Mean | −0.97 | −0.71 | −1.01 | −0.76 | −0.79 | −0.13 | −0.59 | 0 | −0.62 |
| Given Grid ID | Count of Severe/Extreme Drought during 1981–2018 | Count of Years Considered | Frequency (%) of Severe/Extreme | ||||
|---|---|---|---|---|---|---|---|
| June | July | August | June | July | August | ||
| Highland | |||||||
| 3 | 4 | 5 | 4 | 38 | 10.8 | 13.5 | 10.8 |
| 7 | 4 | 5 | 4 | 38 | 10.8 | 13.5 | 10.8 |
| 8 | 0 | 3 | 3 | 38 | 0 | 8.1 | 8.1 |
| 12 | 3 | 2 | 1 | 38 | 8.1 | 5.4 | 2.7 |
| 15 | 4 | 4 | 4 | 38 | 10.8 | 10.8 | 10.8 |
| 19 | 4 | 4 | 3 | 38 | 10.8 | 10.8 | 8.1 |
| Mean | 3 | 4 | 3 | 38 | 9 | 10 | 9 |
| Midland | |||||||
| 2 | 3 | 6 | 4 | 38 | 8.1 | 16.2 | 10.8 |
| 9 | 1 | 3 | 2 | 38 | 2.7 | 8.1 | 5.4 |
| 13 | 3 | 3 | 2 | 38 | 8.1 | 8.1 | 5.4 |
| 14 | 2 | 3 | 2 | 38 | 5.4 | 8.1 | 5.4 |
| 16 | 2 | 6 | 5 | 38 | 5.4 | 16.2 | 13.5 |
| 17 | 2 | 4 | 3 | 38 | 5.4 | 10.8 | 8.1 |
| 18 | 4 | 3 | 3 | 38 | 10.8 | 8.1 | 8.1 |
| Mean | 2 | 4 | 3 | 38 | 7 | 11 | 8 |
| Lowland | |||||||
| 1 | 5 | 3 | 1 | 38 | 13.5 | 8.1 | 2.7 |
| 4 | 1 | 2 | 4 | 38 | 2.7 | 5.4 | 10.8 |
| 5 | 3 | 5 | 2 | 38 | 8.1 | 13.5 | 5.4 |
| 6 | 3 | 3 | 3 | 38 | 8.1 | 8.1 | 8.1 |
| 10 | 2 | 2 | 2 | 38 | 5.4 | 5.4 | 5.4 |
| 11 | 4 | 2 | 5 | 38 | 10.8 | 5.4 | 13.5 |
| 20 | 4 | 3 | 5 | 38 | 10.8 | 8.1 | 13.5 |
| Mean | 3 | 3 | 3 | 38 | 8 | 8 | 8 |
© 2020 by the authors. Licensee MDPI, Basel, Switzerland. This article is an open access article distributed under the terms and conditions of the Creative Commons Attribution (CC BY) license (http://creativecommons.org/licenses/by/4.0/).
Share and Cite
Taye, M.; Sahlu, D.; Zaitchik, B.F.; Neka, M. Evaluation of Satellite Rainfall Estimates for Meteorological Drought Analysis over the Upper Blue Nile Basin, Ethiopia. Geosciences 2020, 10, 352. https://doi.org/10.3390/geosciences10090352
Taye M, Sahlu D, Zaitchik BF, Neka M. Evaluation of Satellite Rainfall Estimates for Meteorological Drought Analysis over the Upper Blue Nile Basin, Ethiopia. Geosciences. 2020; 10(9):352. https://doi.org/10.3390/geosciences10090352
Chicago/Turabian StyleTaye, Mintesinot, Dejene Sahlu, Benjamin F. Zaitchik, and Mulugeta Neka. 2020. "Evaluation of Satellite Rainfall Estimates for Meteorological Drought Analysis over the Upper Blue Nile Basin, Ethiopia" Geosciences 10, no. 9: 352. https://doi.org/10.3390/geosciences10090352
APA StyleTaye, M., Sahlu, D., Zaitchik, B. F., & Neka, M. (2020). Evaluation of Satellite Rainfall Estimates for Meteorological Drought Analysis over the Upper Blue Nile Basin, Ethiopia. Geosciences, 10(9), 352. https://doi.org/10.3390/geosciences10090352


