Characterization of the Petrophysical Properties of the Timahdit Oil Shale Layers in Morocco

 ,
, 
Abstract
1. Introduction
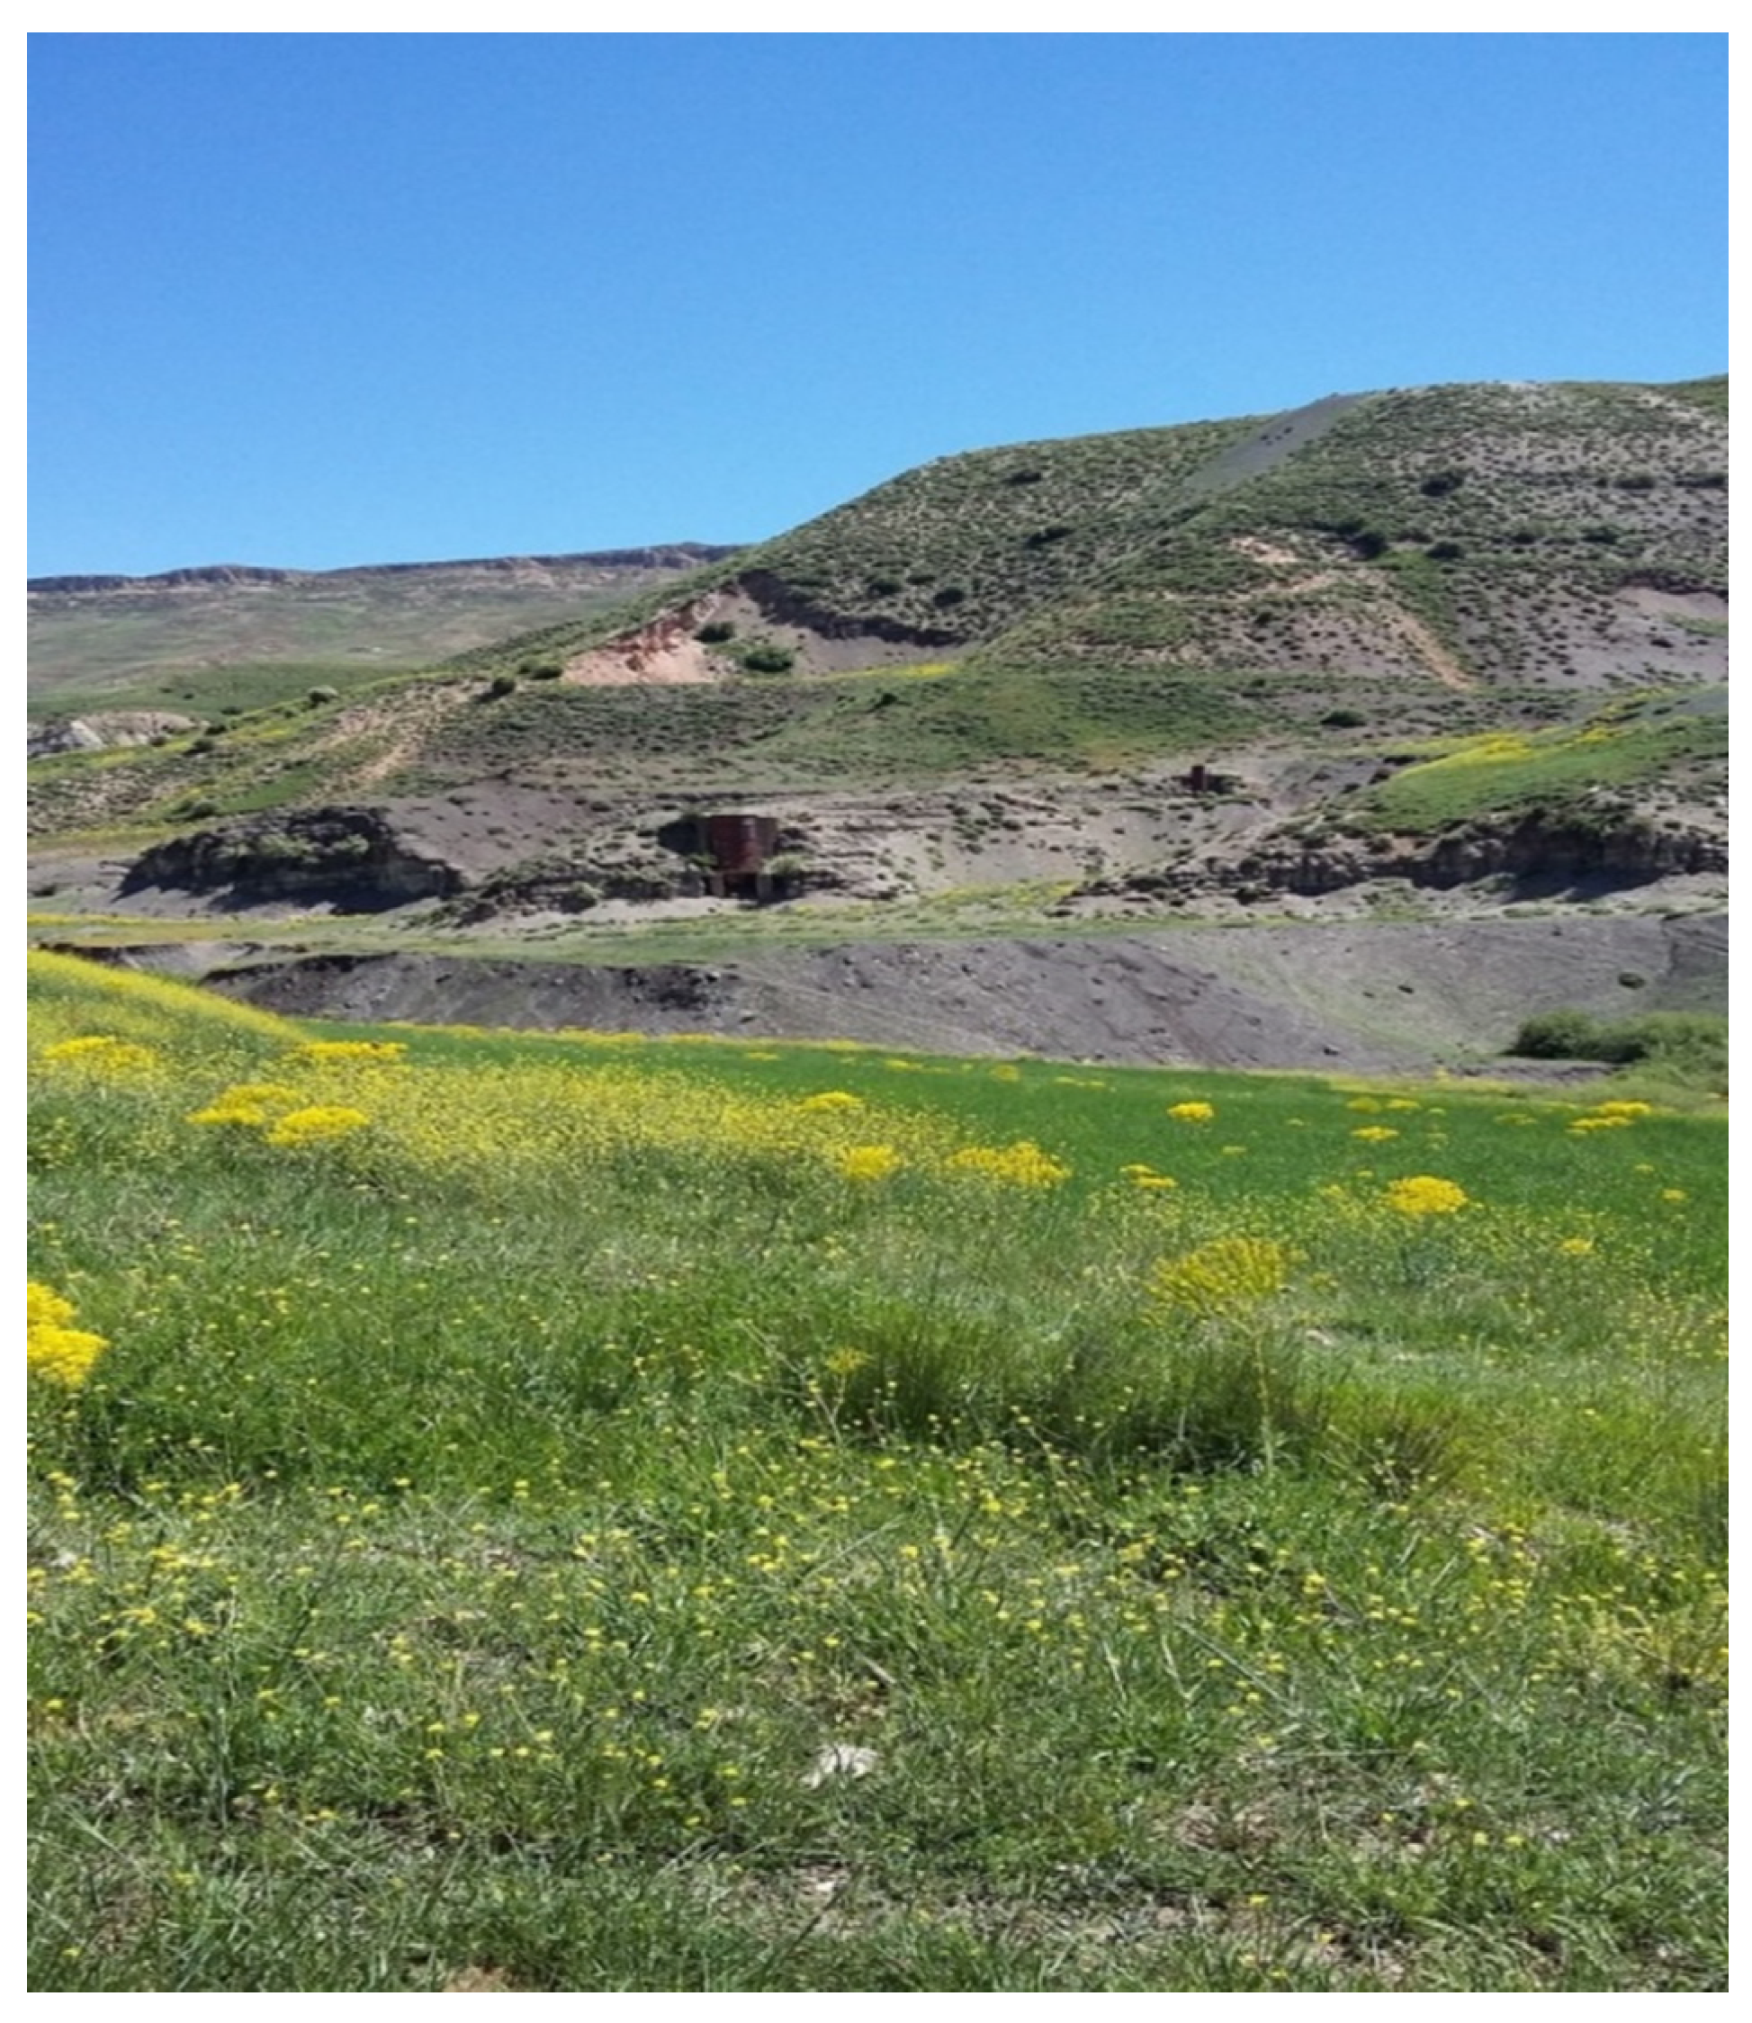
2. Study Area
2.1. Geological Description
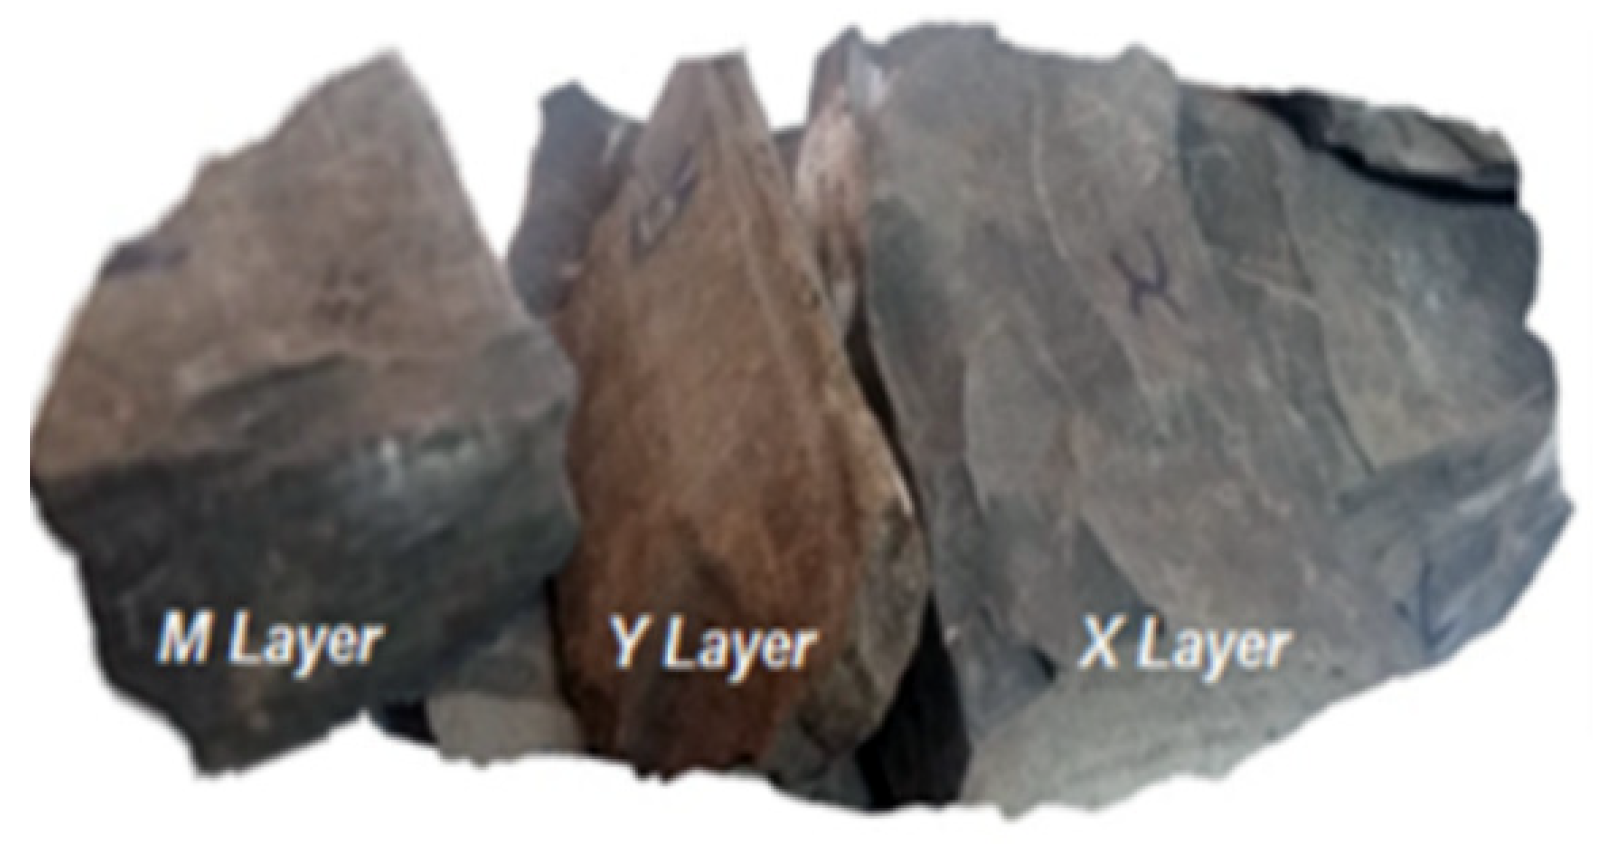
2.2. Sampling
3. Materials and Methods
3.1. Thermal Conductivity Scanner Method (TCS)
3.2. Ultrasonic Test Method (UTM)
3.3. Mercury Injection Porosity
4. Results and Discussion
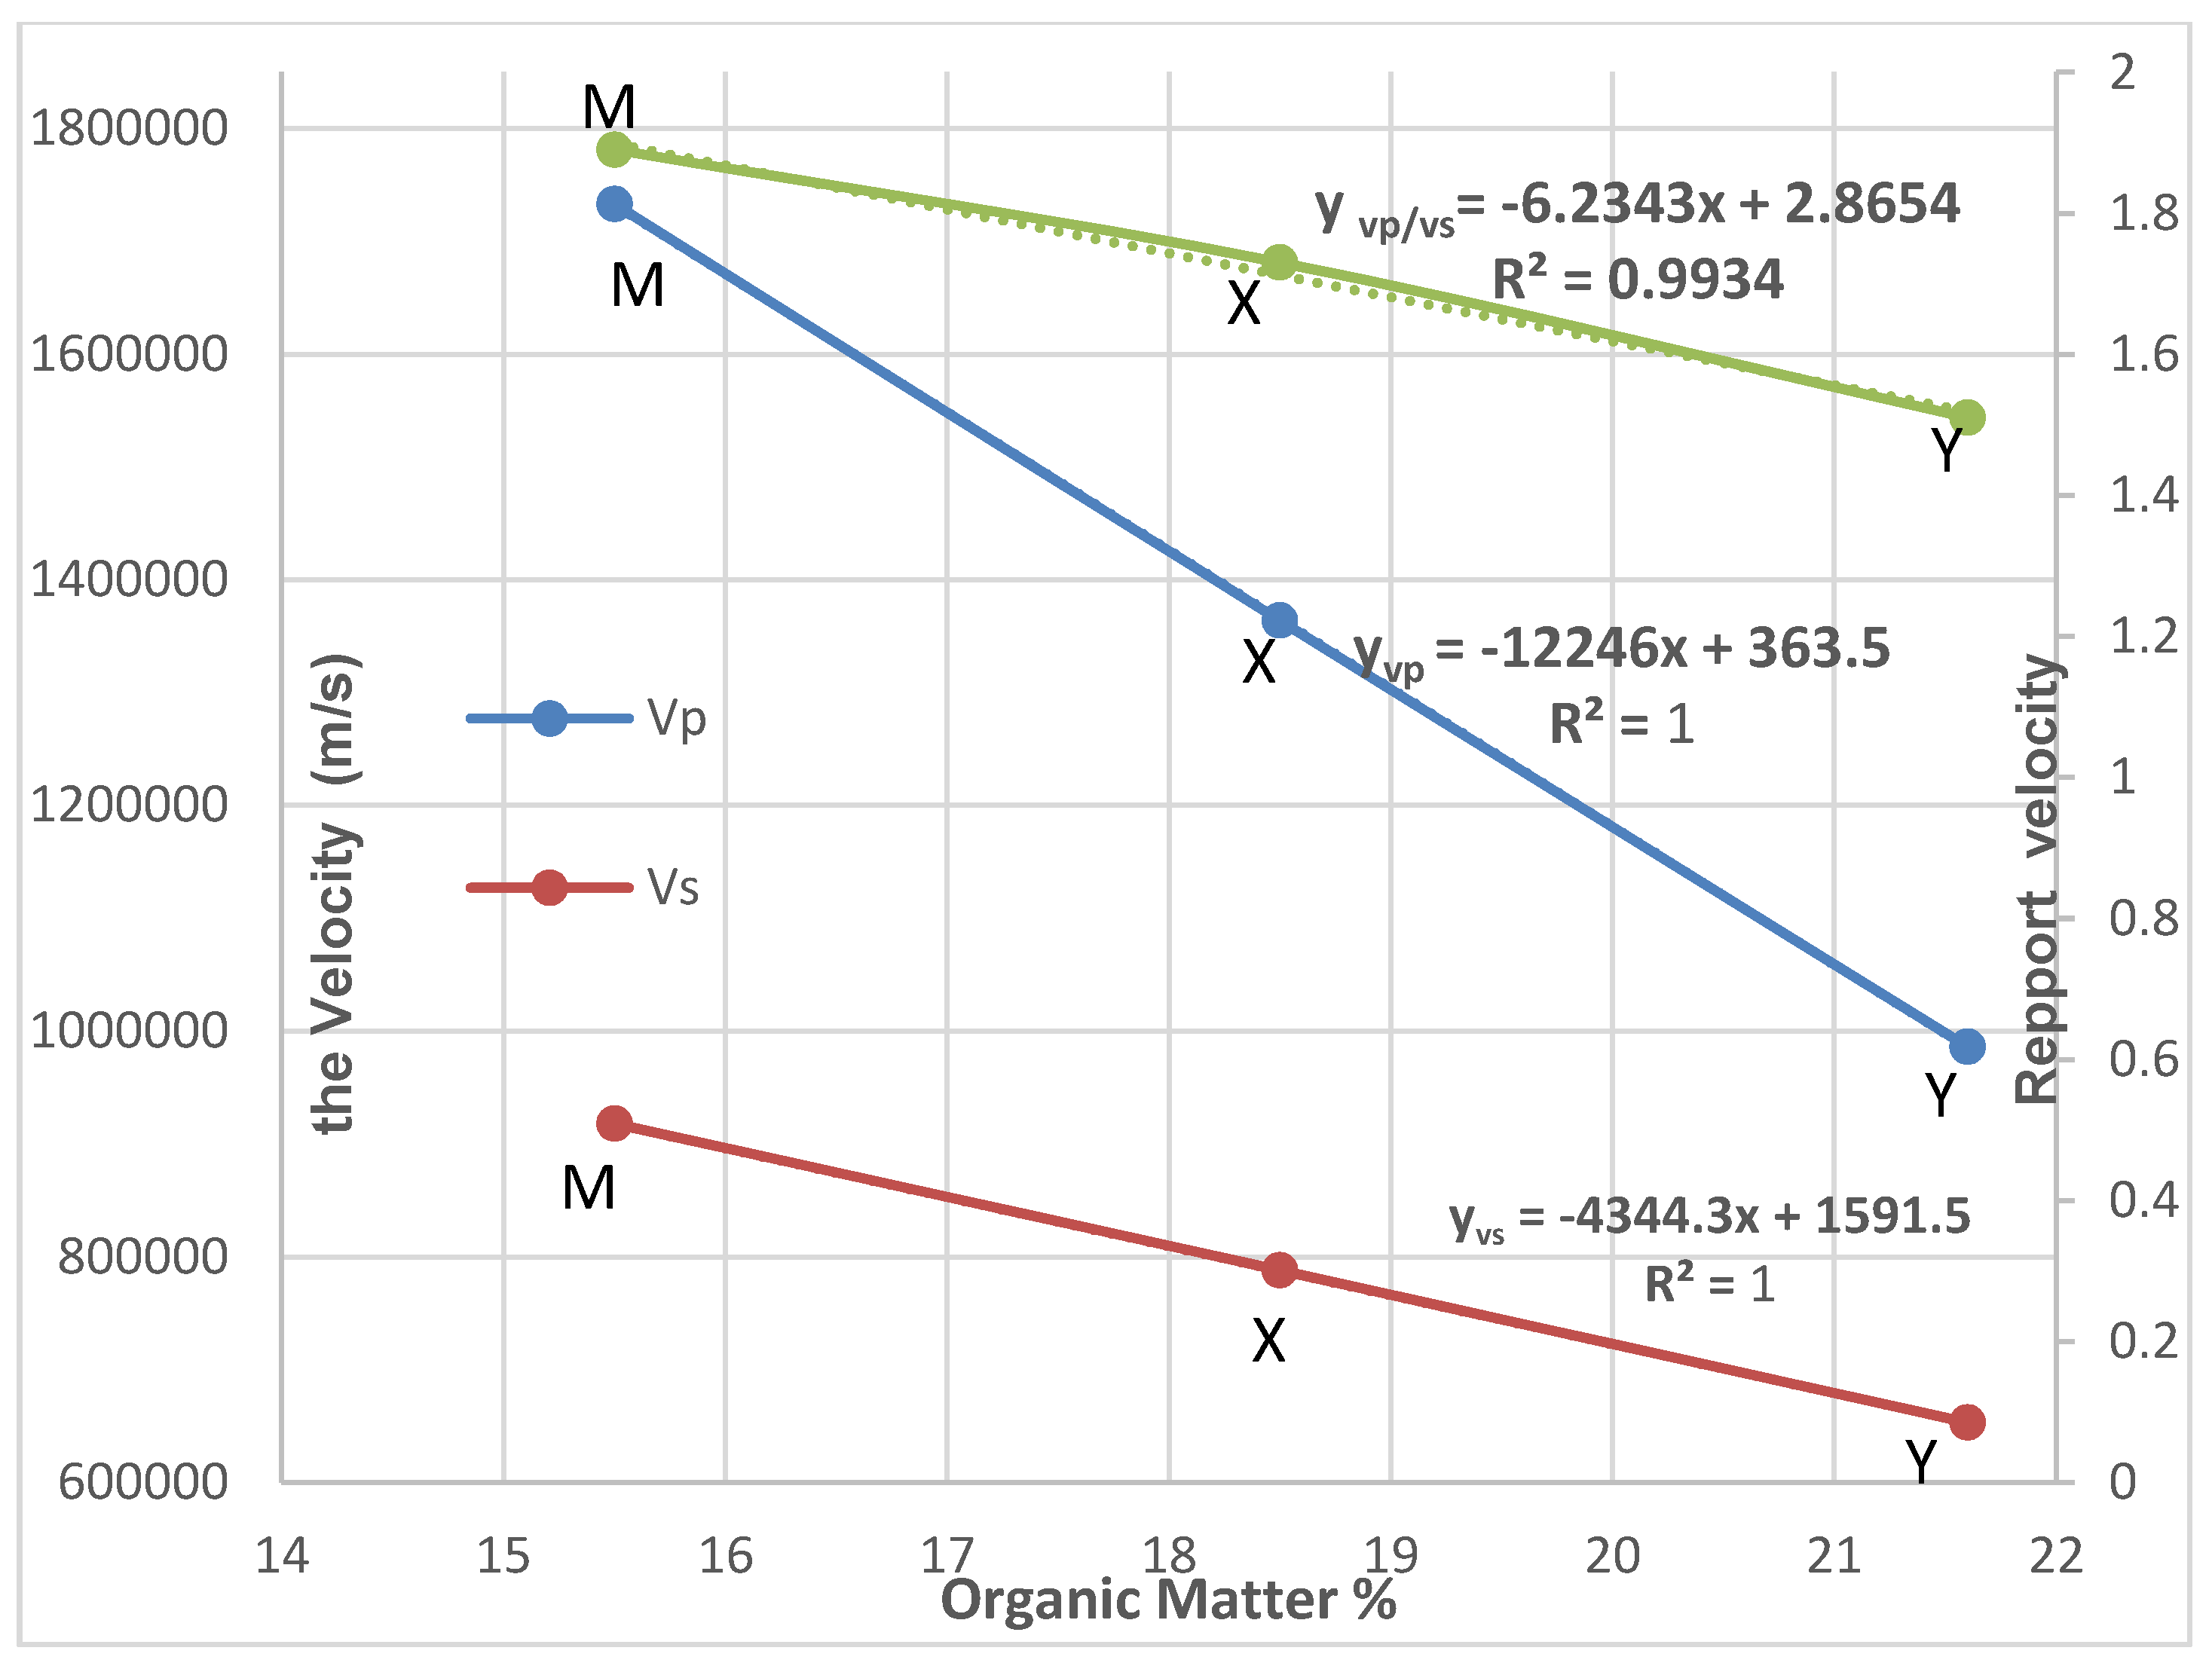
4.1. Thermal and Acoustic Properties of the M, X and Y Layers
4.2. Porosity and Gear Ratio Properties of the M, X and Y Layers
5. Conclusions
Author Contributions
Funding
Acknowledgments
Conflicts of Interest
References
- Ambles, A.; Dupas, G.; Jacquesy, J.C.; Vitorovic, D. Chemical characterization of the kerogen from Moroccan Timahdit oil shale by analysis of oxidation products. Org. Geochem. 1988, 13, 1031–1038. [Google Scholar] [CrossRef]
- Sadiki, A.; Kaminsky, W.; Halim, H.; Bekri, O. Fluidised bed pyrolysis of Moroccan oil shales using the hamburg pyrolysis process. JAAP 2003, 70, 427–435. [Google Scholar] [CrossRef]
- Yang, Y.; Lu, X.; Wang, Q. Investigation on the co-combustion of low calorific oil shale and its semi-coke by using thermogravimetric analysis. ECM 2017, 136, 99–107. [Google Scholar] [CrossRef]
- Zhou, C.; Liu, G.; Wang, X.; Qi, C. Co-combustion of bituminous coal and biomass fuel blends: Thermochemical characterization, potential utilization and environmental advantage. Bioresour. Technol. 2016, 218, 418–427. [Google Scholar] [CrossRef] [PubMed]
- Saoiabi, A. Contribution to the Physico-Chemical Study of the Oil Shales of Timahdit Morocco; Mohammed V University Faculty of Sciences: Rabat, Morocco, 1988. [Google Scholar]
- Saoiabi, A. Oil shales of Timahdit (Morocco) Composition and Physicochemical Properties. Proc. Acad. Sci. Ser. IIC Chem. 2001, 351–360. [Google Scholar] [CrossRef]
- ONHYM. Hydrocarbure Conventionnels-Timahdite (Morocco). Available online: http://www.onhym.com/pdf/Publications/Depliant%20Schistes%20Bitumineux (accessed on 13 July 2020).
- Dyni, J.R. Geology and recources of some world oil-shale deposits. USGS Sci. A Chang. World 2003, 20, 223. [Google Scholar]
- Barkia, H.; Belkbir, L.; Jayaweera, S. Non-isothermal kinetics of gasification by CO2 of residual carbon from timahdit and tarfaya oil shale kerogens. JTAC 2004, 76, 623–632. [Google Scholar]
- Carslaw, H.S. Conduction of Heat in Solids; Oxford University Press: Oxford, UK, 1986. [Google Scholar]
- Yasar, E.; Erdogan, Y. Correlating sound velocity with the density, compressive strength and Young’s modulus of carbonate rocks. IJRMMS 2004, 41, 871–875. [Google Scholar] [CrossRef]
- Rosner, M. Petrophysical Study and Modeling of the Effects of Heat Transfers between Rock and Fluid in the Geotermic Context of Soultz-Sous-Fôrets; Louis Pasteur University: Strasbourg, France, 2007. [Google Scholar]
- Zinszner, B. A Geoscientist’s Guid to Petrophysics; Technic: Paris, France, 2007. [Google Scholar]
- Brotons, V.; Tomás, R.; Ivorra, S.; Grediaga, A.; Martínez-Martínez, J.; Benavente, D.; Gómez-Heras, M. Improved correlation between the static and dynamic elastic modulus of different types of rocks. Mater. Struct. 2016, 49, 3021–3037. [Google Scholar] [CrossRef]
- Haffen, S.; Géraud, Y.; Rosener, M.; Diraison, M. Thermal conductivity and porosity maps for different materials: A combined case study of granite and sandstone. Geothermics 2017, 66, 143–150. [Google Scholar] [CrossRef]
- Popov, Y.A.; Semionov, V.G.; Korosteliov, V.M.; Berezin, V.V. Noncontact evaluation of thermal conductivity of rocks with the aid of a mobile heat source, Izvestiya. Phys. Solid Earth 1983, 19, 563–567. [Google Scholar]
- Popov, Y.A.; Berezin, V.V.; Semionov, V.G.; Korosteliov, V.M. Complex detailed investigations of the thermal properties of rocks on the basis of a moving point source, Izvestiya. Phys. Solid Earth 1985, 21, 64–70. [Google Scholar]
- Popov, Y.A.; Pribnow, D.; Sass, J.H.; Williams, C.F.; Burkhardt, H. Characterization of rock thermal conductivity by high resolution optical scanning. Geothermics 1999, 28, 253–276. [Google Scholar] [CrossRef]
- Popov, Y.; Beardsmore, G.; Clauser, C.; Roy, S. ISRM Suggested methods for determining the thermal properties of rocks from laboratory tests at atmospheric pressure. Roches Mech. Rock Eng. 2016, 49, 4179–4207. [Google Scholar] [CrossRef]
- Samaouali, A. Process of Alteration and Transfer of Fluids in Stones Chellah–Rabat Monument Limestone; Mohammed V University Faculty of Sciences: Rabat, Morocco, 2011. [Google Scholar]
- El Rhaffari, Y. Thermophysical Characterization of Building Materials: Case of the Stones of Historical Monuments of Rabat-Morocco; Mohammed V University Faculty of Sciences: Rabat, Morocco, 2016. [Google Scholar]
- Thermal Conductivity Scanning. Available online: http://www.tcscan.de/ (accessed on 13 July 2020).
- Protecting the Built World with Software, Sensors and Data. Available online: https://www.proceq.com/ (accessed on 13 July 2020).
- Mtthieu, A. Multi Sale Study of Stone de Cay by Salt Crystallization in Porous Networks; University of Cergy-Pontoise: Cergy, France, 2007. [Google Scholar]
- Ry, R.V.; Cummins, P.; Widiyantoro, S. Shallow Shear-Wave Velocity Beneath Jakarta, Indonesia Revealed by Body-Wave Polarization Analysis. Geosciences 2019, 9, 386. [Google Scholar] [CrossRef]
- AutoPore® V Series. Available online: https://www.micromeritics.com/Repository/Files/AutoPore_V_Series_Specification_Sheet.pdf (accessed on 13 July 2020).
- Rahmouni, A.; Boulanouar, A.; Boukalouch, M.; Géraud, Y.; Samaouali, A.; Harnafi, M.; Sebbani, J. Relationships between porosity and permeability of calcarenite rocks based on laboratory measurements. J. Mater. Environ. Sci. 2014, 5, 931–936. [Google Scholar]
- Moine, E.C. New Approach to the Non-Isothermal Kinetic Study of Pyrolysis and Oxidation of Oil Shal of Morocco Origin; Mohammed V University Faculty of Sciences: Rabat, Morocco, 2018. [Google Scholar]
- Ziyad, M.; Garnier, J.P.P.; Halim, M. Nonisothermal kinetics of H2S and H2 generation from Timahdit oil shale. Fuel 1986, 65, 715–720. [Google Scholar] [CrossRef]
- Kang, Y.; Morita, K. Thermal conductivity of the CaO–Al2O3–SiO2 system. ISIJ Int. 2006, 46, 420–426. [Google Scholar] [CrossRef]
- Rajeshwar, K.; Dubow, J.; Rosenvold, R. Dependence of thermal conductivity on organic content for Green River oil shales. Ind. Eng. Chem. Prod. Res. Dev. 1980, 19, 629–632. [Google Scholar] [CrossRef]
- Popov, E.; Popov, Y.; Romushkevich, R.; Spasennykh, M.; Kozlova, E. Detailed Profiling Organic Carbon Content of Oil Shales with Thermal Core Logging Technique; Sixth EAGE Shale Workshop: Bordeaux, France, 2019. [Google Scholar] [CrossRef]
- Wang, X.Q.; Schubnel, A.; Fortin, J.; David, E.C.; Guéguen, Y.; Ge, H.K. High Vp/Vs ratio: Saturated cracks or anisotropy effects? Geophys. Res. Lett. 2012, 39. [Google Scholar] [CrossRef]
- Riffaud, J. Constribution to the modelling of P and S wave propagation velocities in clay sedimentary farmations. Inter. Geophys. CR Geosci. 2008, 340, 779–790. [Google Scholar] [CrossRef]


| Diapers | M | X | Y | T |
|---|---|---|---|---|
| Organic matter (%) | 15.5 | 18.5 | 21.6 | - |
| Diapers | Conductivity λ (W × m−1 K−1) | Diffusivity D (m2 s−1) | Compression Velocity Vp (m s−1) | Shear Velocity Vs (m s−1) | The Repport Velocity Vp/Vs |
|---|---|---|---|---|---|
| M | 0.84 ± 0.08 | 0.41 ± 0.04 | 1733 ± 33 | 918 ± 29 | 1.89 ± 0.10 |
| X | 0.82 ± 0.08 | 0.45 ± 0.04 | 1364 ± 20 | 788 ± 12 | 1.73 ± 0.05 |
| Y | 0.82 ± 0.08 | 0.46 ± 0.04 | 986 ± 13 | 653 ± 6 | 1.51 ± 0.03 |
| Diapers | Porosity (%) | Velocity Ratio (Vp/Vs) |
|---|---|---|
| M | 10.29 ± 0.1 | 1.89 ± 0.10 |
| X | 11.94 ± 0.1 | 1.73 ± 0.05 |
| Y | 13.83 ± 0.1 | 1.51 ± 0.03 |
© 2020 by the authors. Licensee MDPI, Basel, Switzerland. This article is an open access article distributed under the terms and conditions of the Creative Commons Attribution (CC BY) license (http://creativecommons.org/licenses/by/4.0/).
Share and Cite
El Idrissi, H.S.; Samaouali, A.; El Rhaffari, Y.; El Alami, S.; Geraud, Y. Characterization of the Petrophysical Properties of the Timahdit Oil Shale Layers in Morocco. Geosciences 2020, 10, 337. https://doi.org/10.3390/geosciences10090337
El Idrissi HS, Samaouali A, El Rhaffari Y, El Alami S, Geraud Y. Characterization of the Petrophysical Properties of the Timahdit Oil Shale Layers in Morocco. Geosciences. 2020; 10(9):337. https://doi.org/10.3390/geosciences10090337
Chicago/Turabian StyleEl Idrissi, Hanane Sghiouri, Abderrahim Samaouali, Younes El Rhaffari, Salah El Alami, and Yves Geraud. 2020. "Characterization of the Petrophysical Properties of the Timahdit Oil Shale Layers in Morocco" Geosciences 10, no. 9: 337. https://doi.org/10.3390/geosciences10090337
APA StyleEl Idrissi, H. S., Samaouali, A., El Rhaffari, Y., El Alami, S., & Geraud, Y. (2020). Characterization of the Petrophysical Properties of the Timahdit Oil Shale Layers in Morocco. Geosciences, 10(9), 337. https://doi.org/10.3390/geosciences10090337