Article

Kinematics and Timing Constraints in a Transpressive Tectonic Regime: The Example of the Posada-Asinara Shear Zone (NE Sardinia, Italy)

by
Rodolfo Carosi
1,
Alessandro Petroccia
1,*,
Salvatore Iaccarino
1,
Matteo Simonetti
1,
Antonio Langone
2 and
Chiara Montomoli
1,3
1
Department of Earth Sciences, University of Turin, Via Valperga Caluso 35, 10125 Torino, Italy
2
IGG-CNR Pavia, Via Ferrata 1, 27100 Pavia, Italy
3
IGG-CNR Pisa, Via Moruzzi 1, 56124 Pisa, Italy
*
Author to whom correspondence should be addressed.
Geosciences 2020, 10(8), 288; https://doi.org/10.3390/geosciences10080288
Submission received: 14 July 2020 / Accepted: 27 July 2020 / Published: 29 July 2020

Abstract

:
Detailed geological field mapping, integrated with meso- and microstructural investigations, kinematic of the flow and finite strain analyses, combined with geochronology, are fundamental tools to obtain information on the temperature–deformation–timing path of crystalline rocks and shear zone. The Posada-Asinara shear zone (PASZ) in northern Sardinia (Italy) is a steeply dipping km-thick transpressive shear zone. In the study area, located in the Baronie region (NE Sardinia), the presence of mylonites within the PASZ, affecting high- and medium-grade metamorphic rocks, provides an opportunity to quantify finite strain and kinematic vorticity. The main structures of the study area are controlled by a D2 deformation phase, linked to the PASZ activity, in which the strain is partitioned into folds and shear zone domains. Applying two independent vorticity methods, we detected an important variation in the percentage of pure shear and simple shear along the deformation gradient, that increases from south to north. We constrained, for the first time in this sector, the timing of the transpressive deformation by U–(Th)–Pb analysis on monazite. Results indicate that the shear zone has been active at ~325–300 Ma in a transpressive setting, in agreement with the ages of the other dextral transpressive shear zones in the southern Variscan belt.

1. Introduction

Shear zones are characterized by strain localization at different scales and the complex behavior of the involved rocks [1,2,3,4]. The activity of shear zones controls the exhumation of crystalline complexes during the collisional and post-collisional stages of orogenic belts [5,6,7,8,9]. Their geometry and kinematics strongly affect the way by which large crustal blocks are exhumed [7,10,11]. Structural geologists have long been interested in the kinematic reconstruction of the crustal-scale shear zones, which is thought to be one of the most effective ways to constrain key aspects of the tectonic evolution of collision orogens. Deformation in shear zones is often approximated to simple shear, especially in high-strain zones [7]. However, an important component of pure shear has been detected in many regional-scale shear zones developed in different tectono-metamorphic conditions [5,6,7,12,13,14,15,16,17,18]. Several vorticity gauges have been developed and used to quantitatively assess kinematic vorticity in natural shear zones [19]. During progressive deformation, the common pattern of vorticity path along transpressive shear zones suggests a strain partitioning deformation, characterized by a steep, narrow domain of simple-shear deformation and a wider domain mostly pure-shear dominated [20]. Shear zones contain valuable information that can be extracted by the analysis of small-scale structures and with implications for larger-scale tectonics. Field-based studies, supported by further analytical tools, are still necessary when exploring shear zone evolution. We need to involve detailed microstructural work and high-resolution techniques to constrain intrinsic and extrinsic factors [21] such as temperature, pressure, mineralogy, deformation mechanisms and timing. Many works confirm the importance of a multidisciplinary approach to study shear zones [4,7,9,18,22,23,24,25,26]. In this view, field observations, geochronological data, deformation microstructures and the vorticity of the flow and finite strain measurements are necessary.
The Variscan belt is one of the best examples of orogenic belts, where it is possible to investigate the tectonic mechanisms affecting the crust during its evolution from perpendicular collision to orogen-parallel transpression. In particular, the Variscan Sardinian basement shows well preserved exposures of folded and sheared rocks, not overprinted by the Alpine age orogenesis. Transpressive deformation in the study area (Posada Valley, northern Sardinia, Italy) is linked to an about 6 km-thick high-strain zone known as Posada-Asinara shear zone (PASZ). We present a new dataset of field measurements, meso- and microstructural data, kinematics of the flow, finite strain data combined, and for the first time in this sector of the PASZ, in situ U–Th–Pb (texturally- and chemically-controlled) geochronology. This paper aims to improve the existing knowledge of this sector of the PASZ [8,17,27,28,29]. A deeper investigation of the tectonic evolution of the PASZ is fundamental to enhance the correlations between the other Variscan fragments in the Mediterranean area.

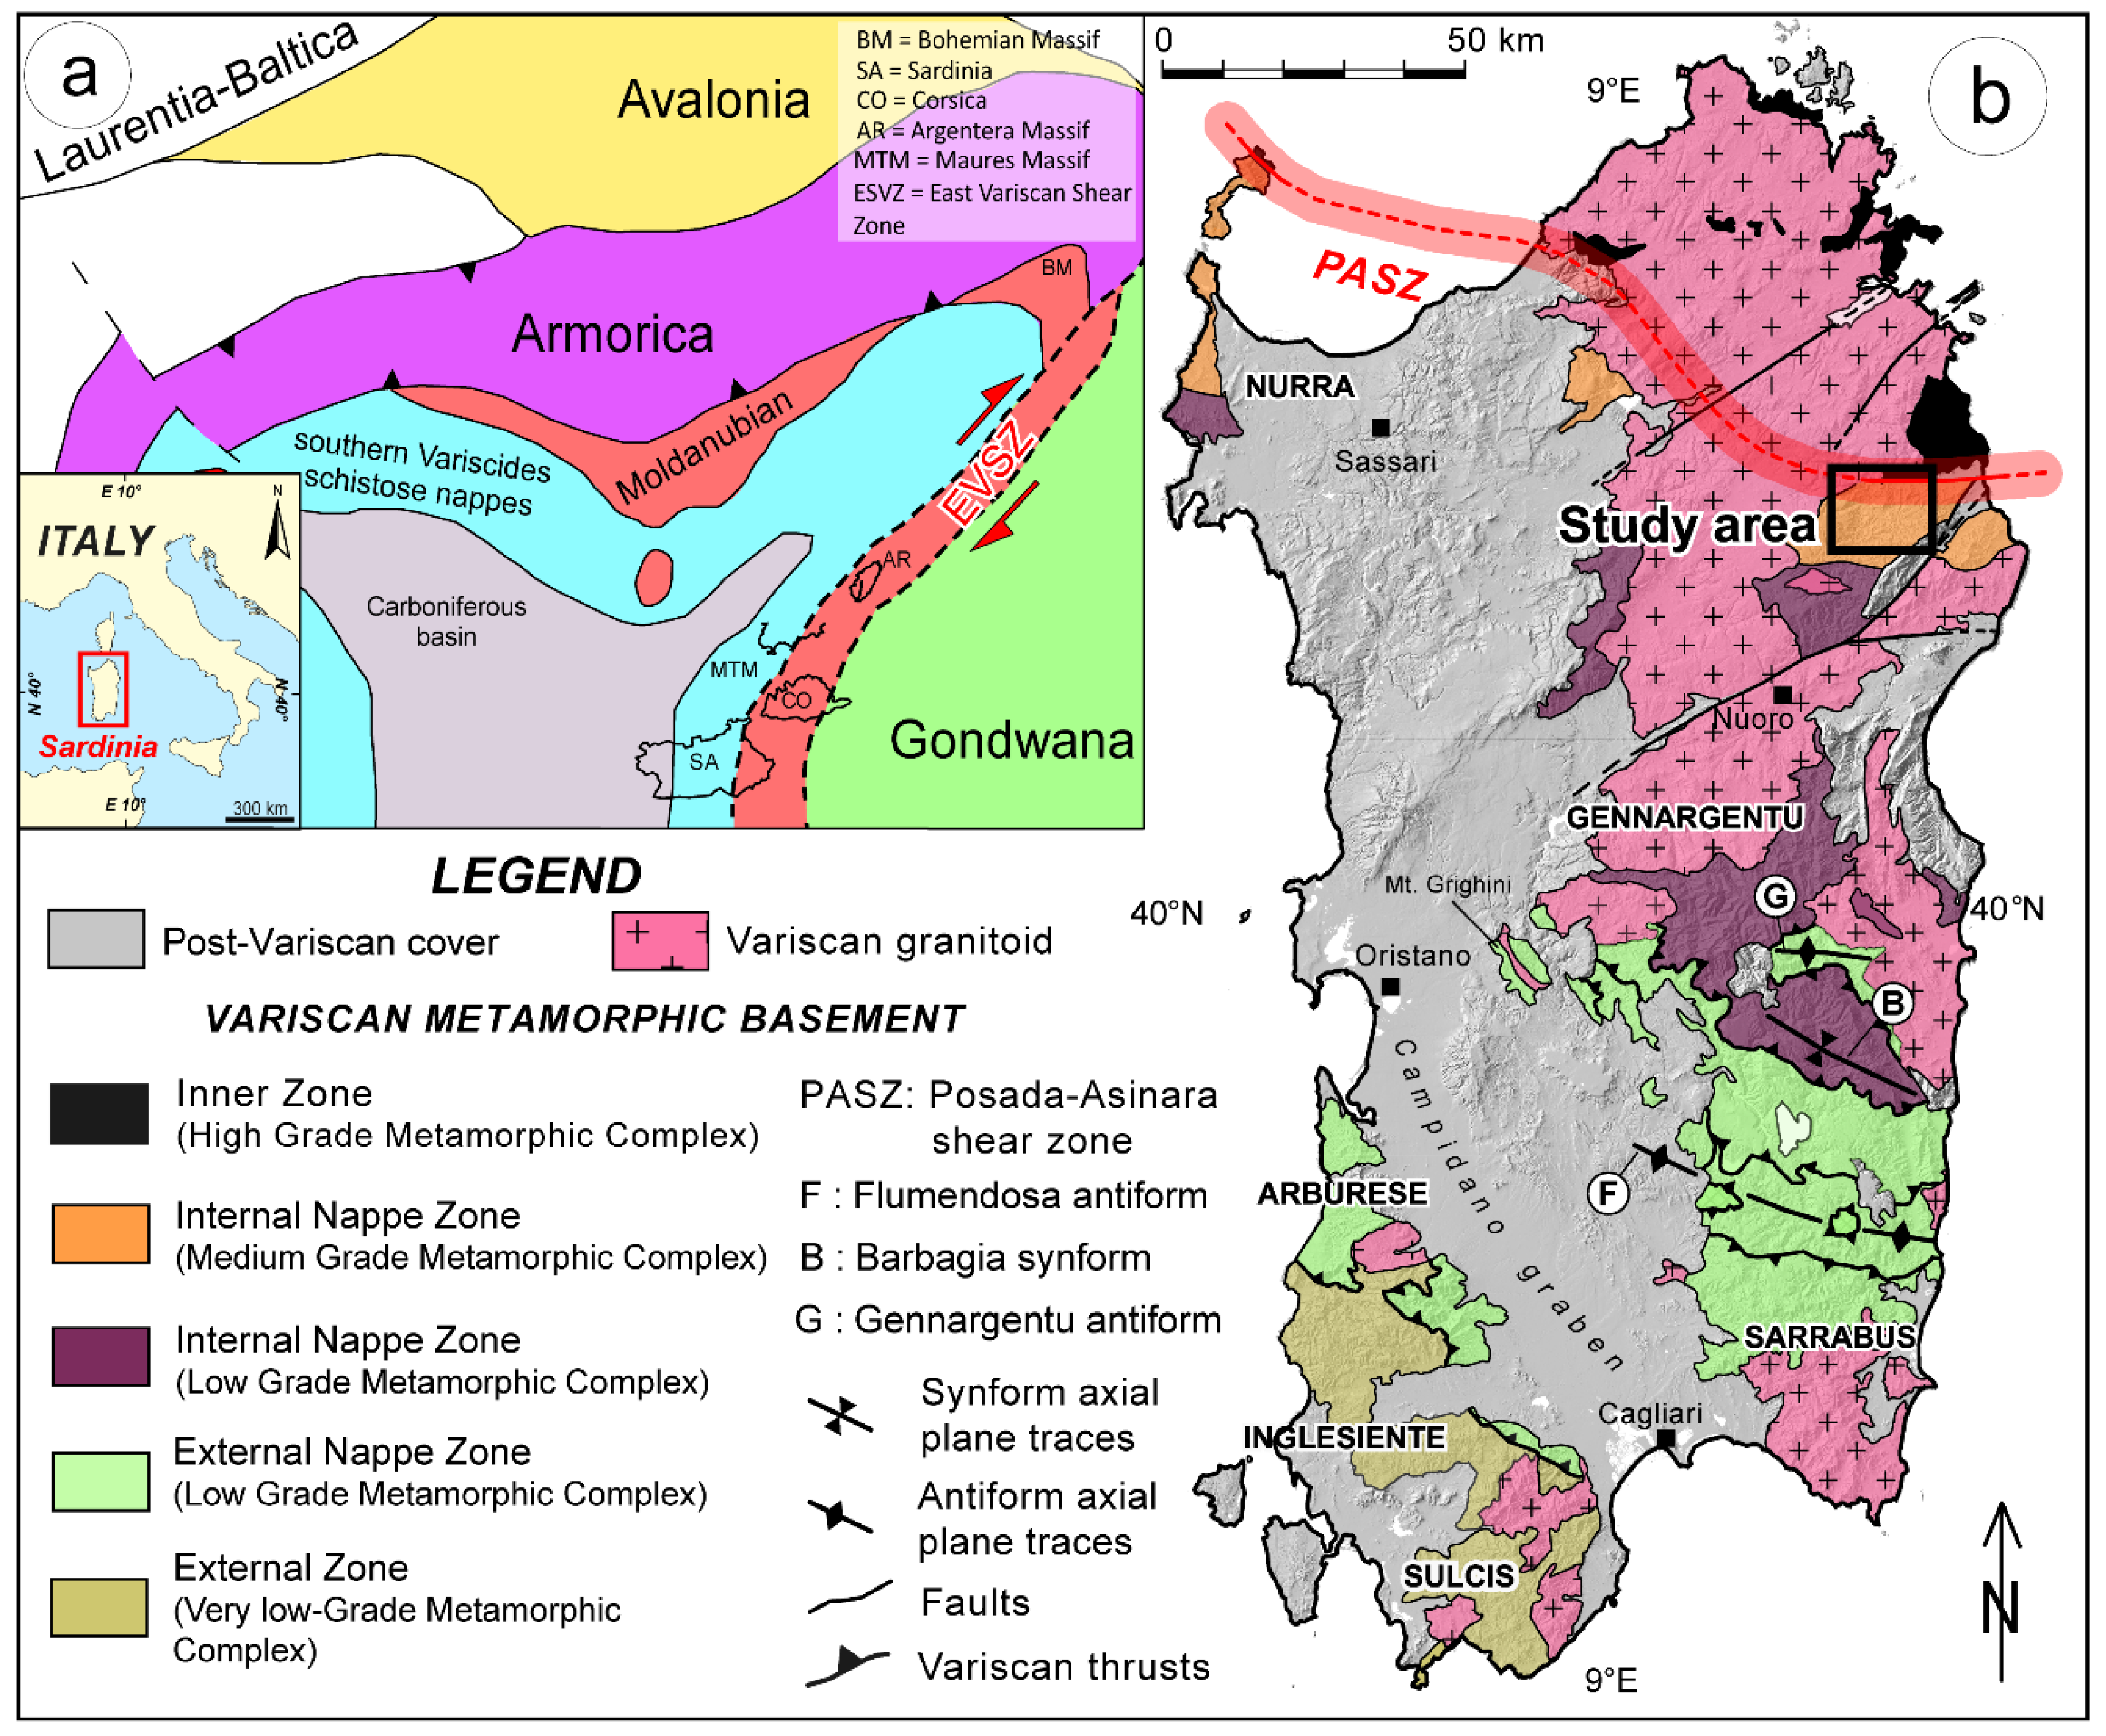
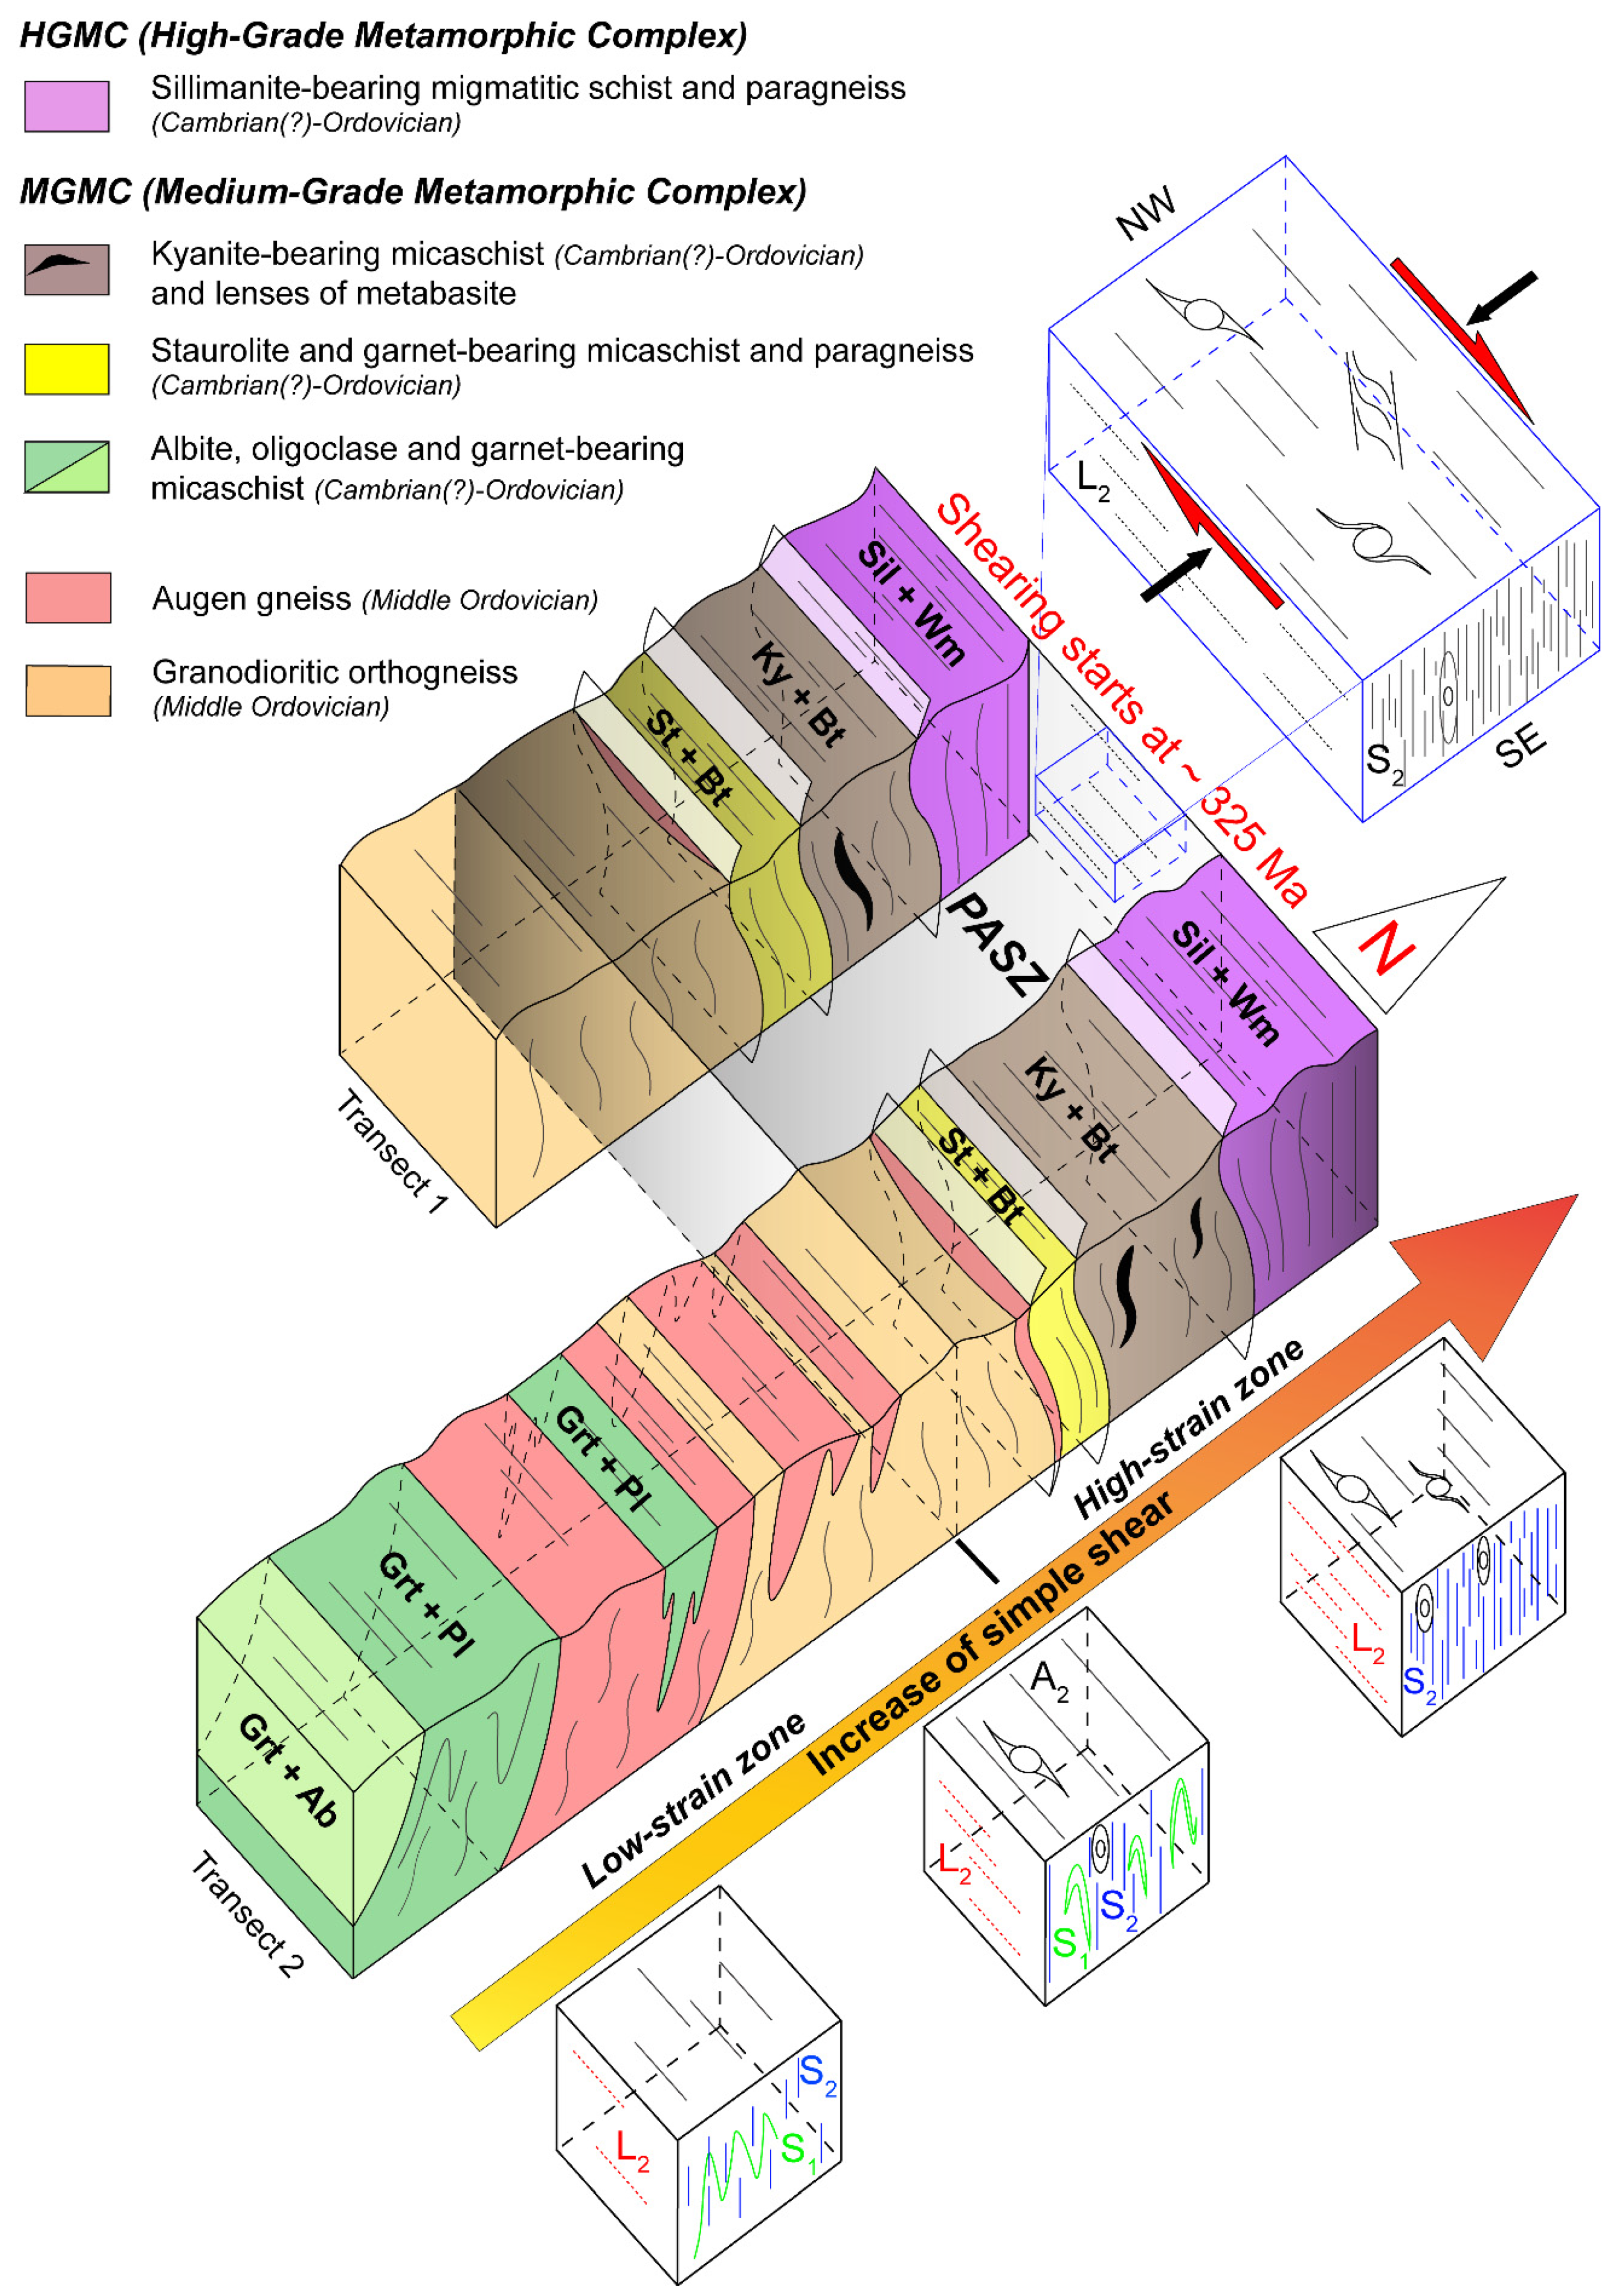
2. Geological Setting

The shape of the Variscan belt in Europe is the result of a Devonian–Carboniferous continent–continent collision between Laurentia–Baltica and Gondwana. Between these two continents, small microplates known as Avalonia and Armorica, broken away from Gondwana, existed (Figure 1a) [30,31]. The Variscan belt is characterized by a composite orocline consisting of two main branches: the western Ibero–Armorican arc [30,32,33] and a minor eastern branch, delimited, to the east, by a regional-scale shear zone, known as the East Variscan Shear Zone (EVSZ, Figure 1a) [9,18,34,35]. The Corsica–Sardinia Block is located in the southeastern part of the Variscan belt (Figure 1a).
The lack of the Alpine age overprint makes Sardinia island an important locality to investigate a sector of the Southern Variscan belt and the transpressive deformation associated with the EVSZ (Figure 1a).
The Cambrian to Lower Carboniferous rocks, affected by a prograde Barrovian metamorphism, from anchizone (SW) to amphibolite facies metamorphism (NE), are characterized by folds and thrusts indicating a SW tectonic transport [29,36,37,38,39]. Carmignani et al. (1994, 2001) [36,40] divided the Sardinian Variscan chain into three main tectono-metamorphic zones (Figure 1b). From SW to NE they are: (i) the External Zone (foreland area, southwestern Sardinia), a thrust and fold belt foreland consisting of a sedimentary sequence from pre-Cambrian(?)–Cambrian to Lower Carboniferous in age [36,40], showing very low-grade metamorphism; (ii) the Nappe Zone, subdivided into External (central to southern Sardinia) and Internal Nappes (northern to central Sardinia), results from southward thrusting with km-scale isoclinal folding and syn-tectonic metamorphism [36]. The External Nappe is made of a Paleozoic metasedimentary sequence bearing a thick continental Middle Ordovician arc-related volcanic suite [36]. This zone was deformed mainly under low-grade metamorphic conditions. The Internal Nappe is constituted by two main metamorphic complexes: the Low-Grade Metamorphic Complex (LGMC) and the Medium-Grade Metamorphic Complex (MGMC). The LGMC consists of a Cambrian meta-sedimentary sequence, Ordovician arc-related volcanic rocks, Silurian black-shale and Devonian marble [36,40]. This complex equilibrated mainly under greenschist facies conditions, except for the Monte Grighini Unit (Figure 1b) where amphibolite-facies conditions were detected [41]. The MGMC consists of a Cambrian(?) to Ordovician [36] metasedimentary and Ordovician orthogneiss reaching amphibolite-facies conditions. The orthogneiss crystallization ages are 458 ± 31 Ma and 441 ± 33 Ma [42]; 457 ± 13 Ma [43]; (iii) the Axial or Inner zone characterized by the Migmatitic Complex (High-Grade Metamorphic Complex: HGMC) is made up of Cambrian(?) micaschist, para- and Ordovician ortho-derived migmatite [44]. Migmatite contains mafic bodies preserving a complex metamorphic evolution, from eclogitic stage up to greenschist re-equilibration, related to Variscan history [45,46].
The boundary zone between the Low- to Medium Grade Metamorphic Complex (L–MGMC) and the HGMC is marked by the Posada-Asinara shear zone (PASZ) [8,17,23,47], a nearly 150 km-long transpressive Variscan shear zone affecting both complexes. The metamorphic basement is widely intruded by Late Carboniferous–Early Permian granitoids constituting the Sardinian batholith, and/or unconformably overlain by the Late Carboniferous–Early Permian sedimentary basins [48]. During the syn-collisional shortening and thickening stage, both L–MGMC and HGMC underwent high-pressure (HP) metamorphism, related to the D1 deformation phase, with metapelites reaching pressures of nearly 1.7 GPa [49]. The HP metamorphic signature [49], allows linking the prograde metamorphism to underthrusting and nappe stacking. The different portions of the metamorphic basement in northern Sardinia show different P–T trajectories, in response to the diachronous metamorphic evolution of the different areas [50,51,52], but the general trend is a clockwise P–T path, typical of subduction/collisional belts [53]. A northward increase in the Barrovian metamorphism has been recognized [39,50]. Barrovian minerals began to grow at the end of the collisional stage (D1 phase). Sometimes they grow syn-kinematically at the beginning of transpressive stage (D2 phase) [17]. In the L–MGMC, the Barrovian metamorphism has been dated at ~350–330 Ma, based on Ar–Ar on mica in meta-pelitic rocks and U–Th–Pb monazite datings on para- and ortho-derivate metamorphic rocks [9,28,54]. The D1 collision-related deformation is well recorded in the L–MGMC, where it is associated with a penetrative S1 axial plane foliation of SW-facing folds. Towards the north, the S1 foliation is progressively transposed by the D2 phase developed in an orogen-parallel dextral transpression regime [17]. This was responsible for most of the exhumation of high-grade metamorphic rocks with initial increasing temperature followed by decompression and cooling [8,23,27,29]. The onset of the transpression, giving rise to the PASZ [8,15,17,55], developed in amphibolite-facies metamorphism and it has been constrained at ~320–315 Ma (Ar–Ar on white mica and U–Th–Pb on monazite [9,28]). The transpressive activity of the PASZ continued during the D3 phase under shallower crustal conditions. D3 deformation phase is characterized mainly by metric chevron and/or asymmetric folds, associated with an S3 axial plane crenulation cleavage [56]. The post-transpressional evolution was characterized by the inversion from contractional to extensional tectonics. The end of the orogenic activity is characterized by the collapse of the belt (D4 phase), associated with open folds, brittle-ductile shear zones and locally by the emplacement of syn-tectonic granites [45,57].
The study area, located in the north-eastern Sardinia between the MGMC and the HGMC, extends for nearly 200 km2 between the Posada lake and the Montalbo Massif (Figure 2a) and comprises the south-eastern sector of the PASZ (Figure 1b). An updated geological map of the area, derived from a new detailed geological survey at the 1:10.000 scale, is shown in Figure 2.
The Paleozoic metasedimentary sequence of this sector, consisting of micaschist and paragneiss, is characterized by a metamorphic zonation showing an increase in metamorphic grade from south to north. Four metamorphic zones occur, marked by the growth of: (i) garnet; (ii) staurolite + biotite; (iii) kyanite + biotite; (vi) sillimanite + white mica. The garnet zone is further subdivided into garnet + albite and garnet + oligoclase sub-zones [39,51,58]. Granodioritic and granitic augen orthogneiss and amphibolite lenses within the kyanite-bearing micaschist are also present. From the southern (low-strain zones) to the northern sector (high-strain zones), the rocks become progressively more sheared (Figure 2a).

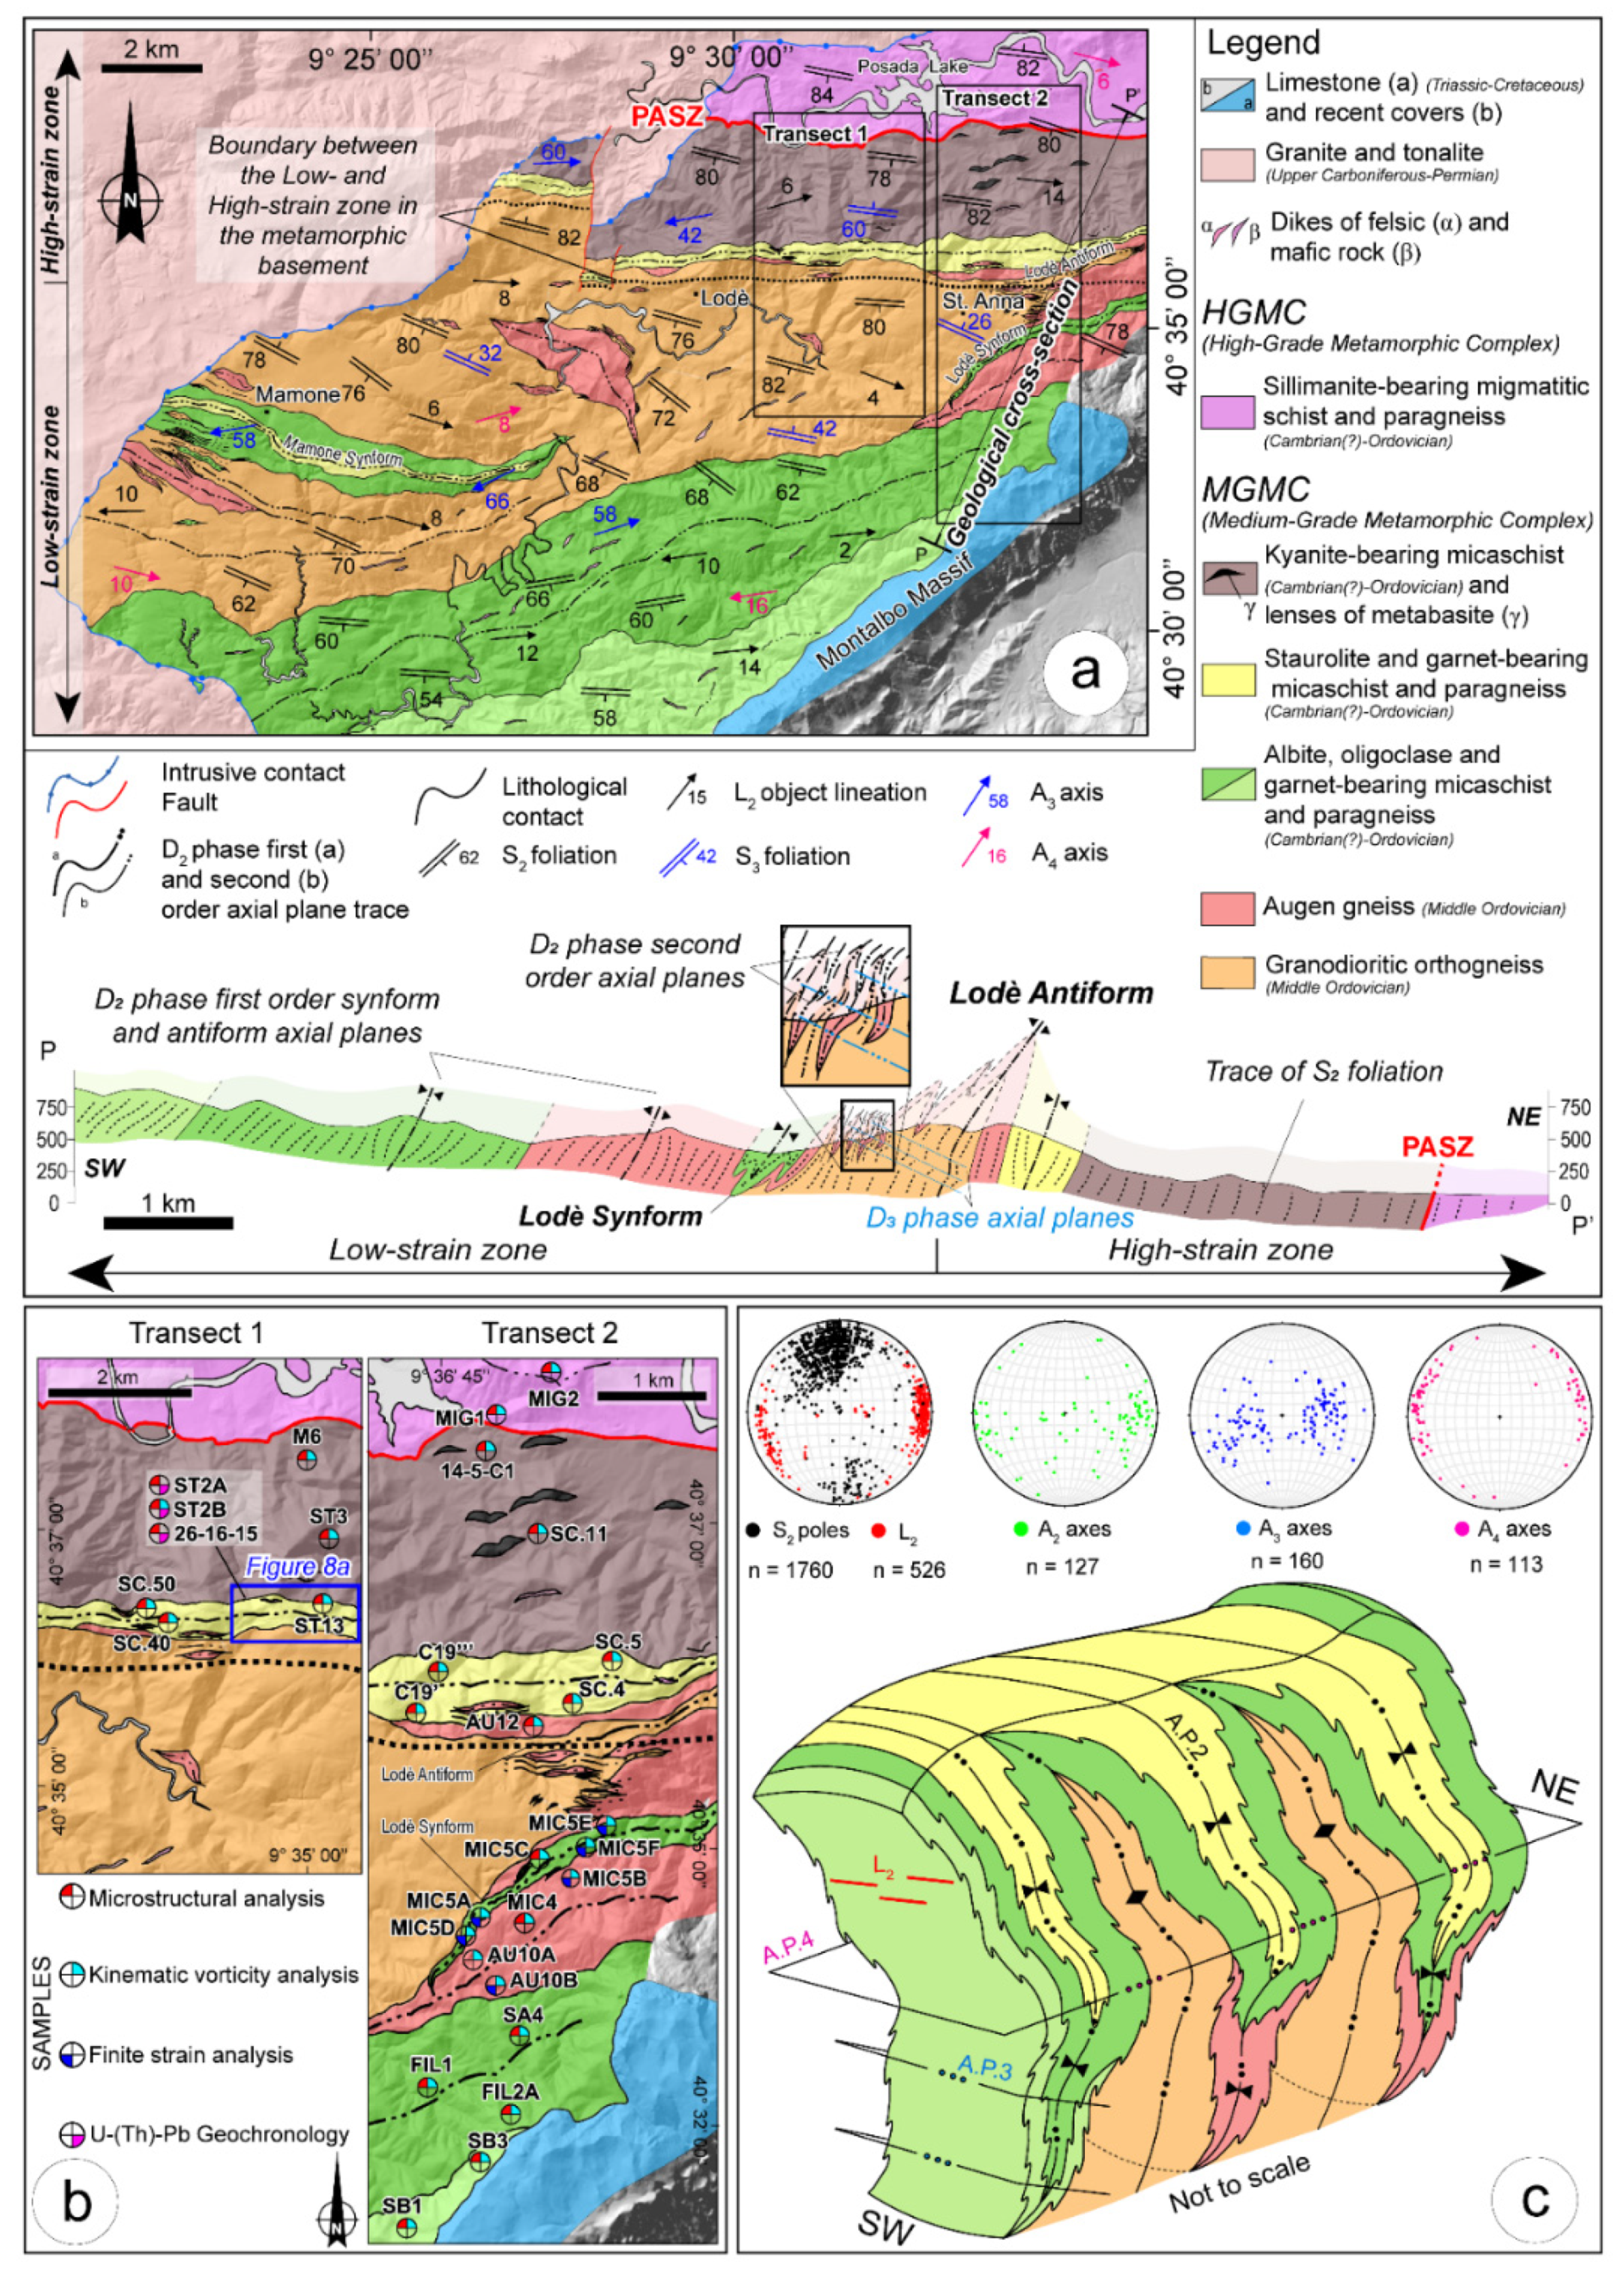
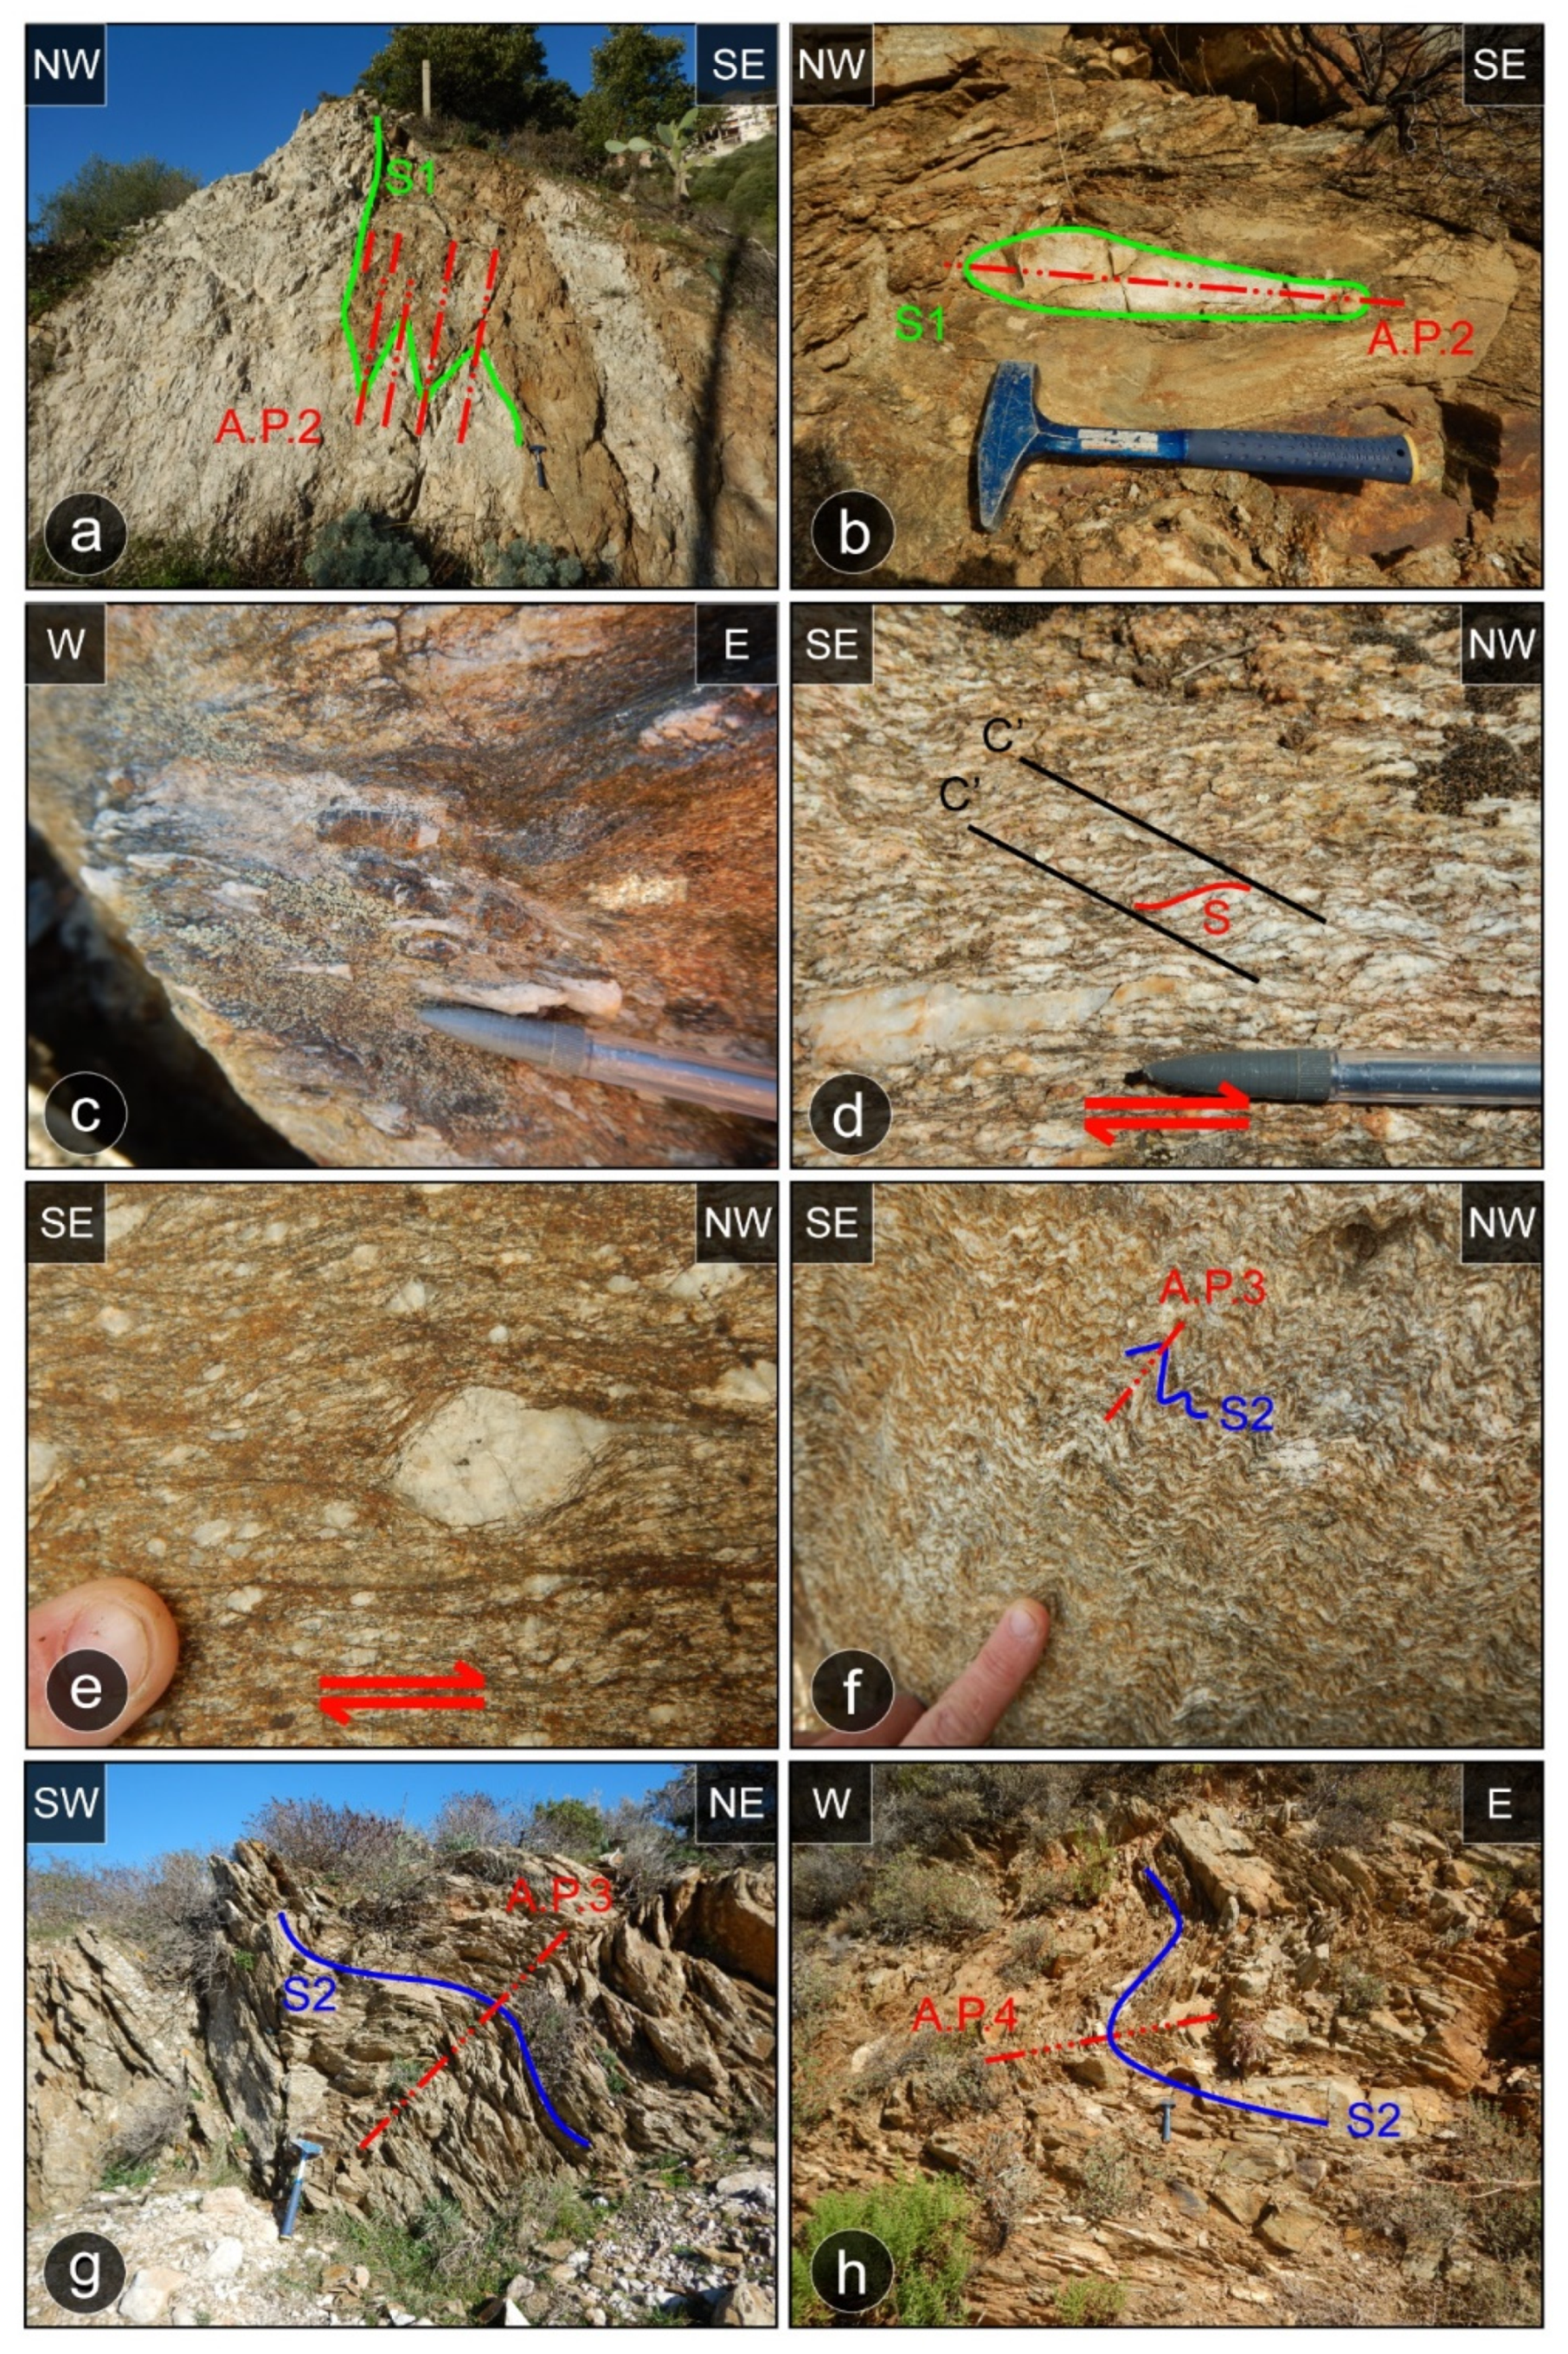
3. Field Data, Deformation History and Mesoscale Observations
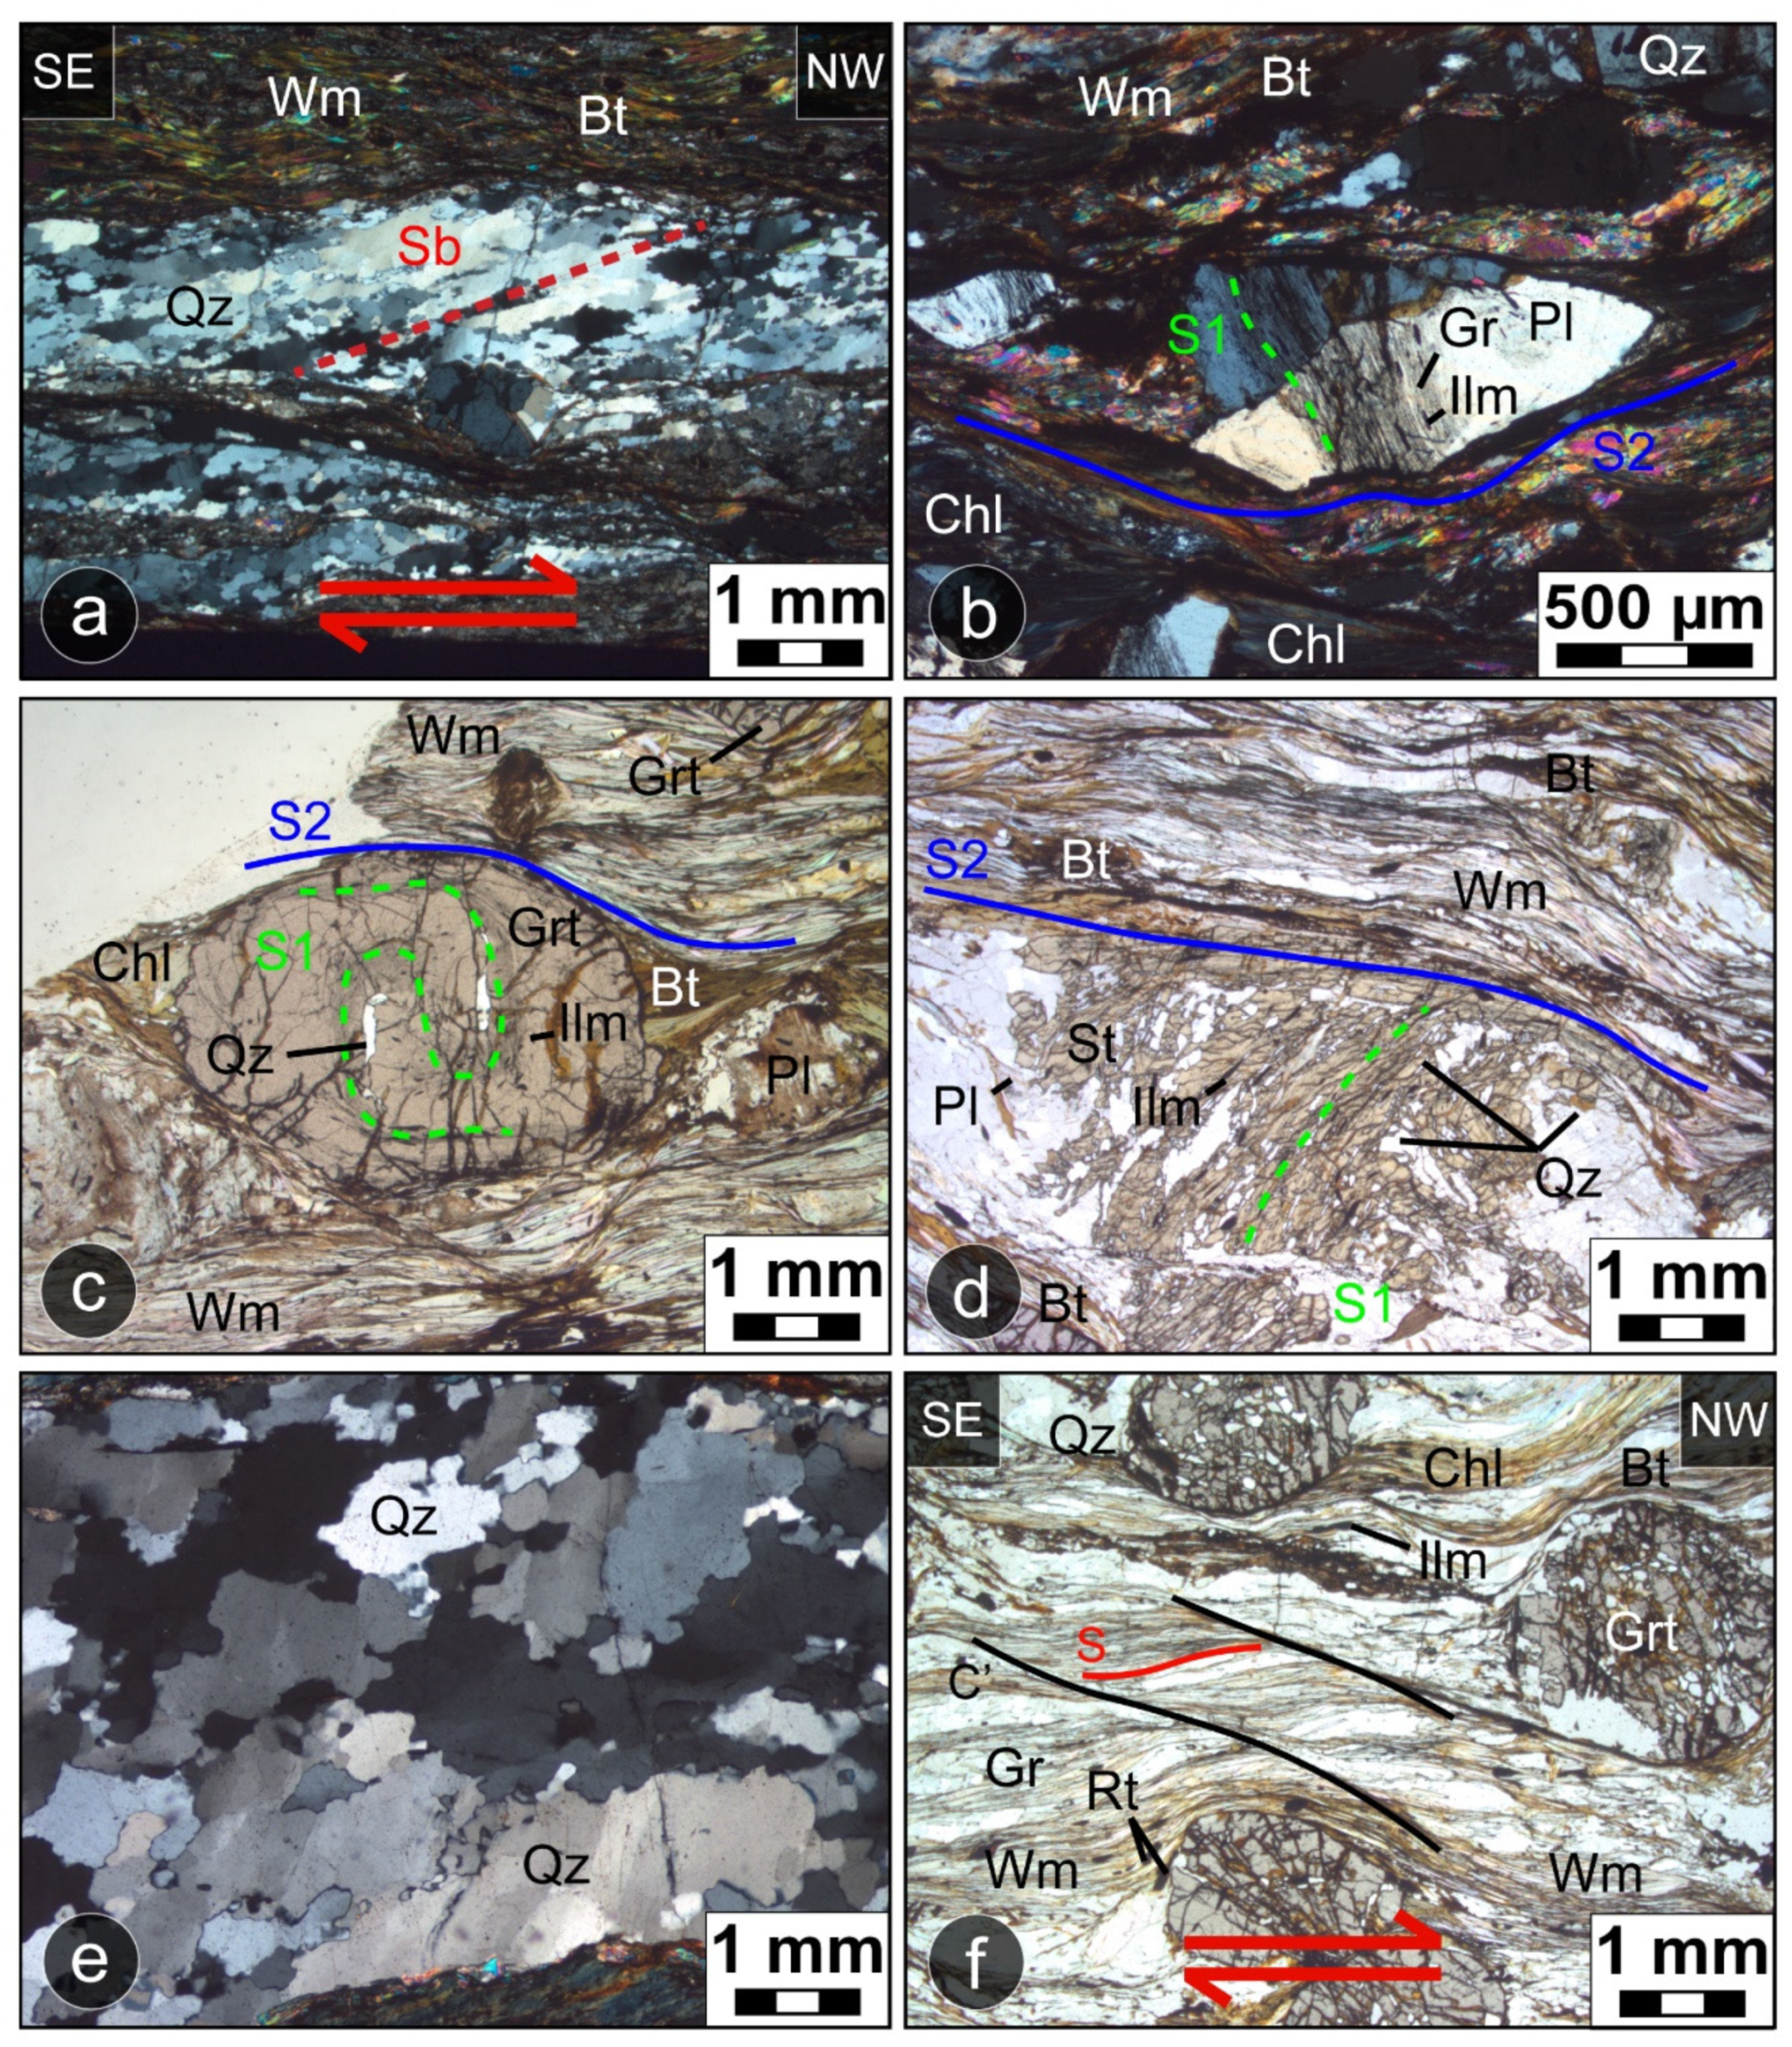
In the study area, four deformation phases were recognized (Figure 2c). The oldest deformation phase (D1) is testified by an older penetrative relict foliation (S1) mainly recognizable at the microscale, and poorly developed at the mesoscale, observed only in the hinges of D2 structures. F2 folds are tight, isoclinal to locally ptygmatic. They are both cylindrical (Figure 3a) and non-cylindrical (sheath fold; Figure 3b). They show rounded and thickened hinges with stretched limbs (class 2 [59]), that can be classified as B5 according to Hudleston (1973) [60]. F2 km-scale folds (Lodè Antiform and Mamone Synform; Figure 2a) are developed at the map scale. A2 fold axes show a main E–W to NNE–SSW trend gently plunging with quite scattered values (Figure 2c).
F2 axial planes, parallel to the S2 foliation, dip moderately toward S–SSE, with a local variation toward N–NNW (Figure 2c). A well developed and penetrative S2 foliation is the main planar structural element recognized in the study area. The S2 foliation shows a general E–W to WNW–ESE strike and dips at high angles both to the N–NE and to the S–SW (Figure 2c). S2 changes from an F2 axial plane foliation, classified as a disjunctive cleavage with sub-parallel cleavage domains, in the southern part of the area, to a mylonitic continuous foliation, toward the northern sector. In migmatitic gneiss, the S2 is defined by biotite- and sillimanite-rich layers. The L2 object lineation [61] is represented by both grain and aggregate lineation. L2 becomes prominent as the shearing increases. It is defined by elongate biotite and muscovite crystals, by millimetre to centimetre-scale quartz ribbons, elongate quartz-feldspar aggregates and elongated and boudinated staurolite (Figure 3c). The L2 shows a N80–N120 main trend and gently plunges toward both E and W (Figure 2c). The lithotypes located in the southern sector of the study area show few kinematic indicators, whereas, approaching the high-strain zone of the PASZ in the northern sector, they become more frequent. Shear sense indicators have been observed at the mesoscale on a section parallel to the XZ plane of the finite strain ellipsoid (i.e., perpendicular to the S2 foliation and parallel to the L2 lineation). The main kinematic indicators are represented by C–S and C’–S fabrics (Figure 3d), σ- and δ-type porphyroclasts (Figure 3e), asymmetric strain fringes around staurolite and garnet porphyroclasts and shear bands boudins. All kinematic indicators indicate a top-to-the-NNW sense of shear. F3 folds, affecting the S2 foliation, are the main evidence of D3 phase in the study area. The F3 folds show kink (Figure 3f), chevron and/or asymmetric geometry (Figure 3g), with rounded hinges and locally asymmetric profiles. The D3 deformation phase increases in intensity moving toward the high-strain zone. F3 fold axes, A3, generally trend parallel both to the F2 fold axes and to the L2 object lineation, with higher plunging values (Figure 2c). In some areas, an intersection lineation, between F3 axial planes and S2 foliation occurs. An axial plane foliation is generally not well developed, but a D3-related crenulation cleavage (S3) is locally present. A syn-kinematic growth of chlorite in the hinges of F3 folds was observed. The F2–F3 fold interference pattern shows parallel axes and sub-orthogonal axial planes (Type 3 [59]). During the D4 deformation phase, metric- and decimetre-scale F4 open folds developed with both sub-horizontal axes and axial planes (Figure 3h). A4 axes plunge at low angles toward E or W with very high dispersion (Figure 2c). F4 folds re-orient and deform the original attitude of both the D2 and D3 previous structural elements, causing a variation in the orientation of the S2 mylonitic foliation. D4 phase is not associated with the development of foliations and object lineations. In some sectors, folds often coupled with thin, millimetre-scale, brittle/brittle-ductile shear planes, developed along the axial plane surfaces. These observations suggest that the D4 phase developed at a shallower structural level.

4. Microstructures

Microstructural analysis was performed on samples collected along two parallel transects (Figure 2b) perpendicular to the shear zone boundaries and the deformation gradient. The summary of the microstructural and petrographic investigation is reported in Figure 4. Microstructures are described according to the different lithologies. Mineral abbreviations are after Whitney and Evans (2010) [62].
Micaschist and paragneiss are characterized by both a disjunctive cleavage, with sub-parallel cleavage domains, and a continuous schistosity mainly made of biotite + white mica and quartz (Figure 5a).
The S2 foliation wraps around albite/oligoclase (Figure 5b), garnet (Figure 5c), staurolite and kyanite porphyroclasts. Barrovian minerals show an internal foliation (S1), mainly made by quartz, white mica, ilmenite, rutile and graphite, generally not continuous concerning the external one. These observations indicate an inter-kinematic growth of Barrovian minerals (i.e., between the D1 phase and the D2 mylonitic shearing). In some staurolite crystals, two internal foliations are recognizable. In the core of the grains, an internal foliation S1 is present. The core is characterized by the presence of an internal foliation S1, discordant with respect to the external foliation. In the rims, another internal foliation, concordant with the external one, is present (Figure 5d). These observations indicate an inter- to syn-tectonic (syn-S2) growth of the staurolite (i.e., between the D1 and D2 phase and during the early D2 phase). Quartz in mylonite displays undulose extinction and tilt walls. Quartz lobate and ameboid grain boundaries suggest dynamic recrystallization by grain boundary migration (GBM, [63,64] (Figure 5e). In some samples, quartz shows new grains of smaller size surrounding larger crystals forming a “core and mantle structure” [65], with weakly bimodal grain size. This indicates an overprinting of subgrain rotation recrystallization (SRR) on GBM [66]. A top-to-the-NW sense of shear is highlighted by oblique foliation in recrystallized quartz domains, by mica-fish and S–C–C’ fabric (Figure 5f) and asymmetric strain fringes around porphyroclasts. In granodioritic and the granitic augen orthogneiss, the S2 disjunctive cleavage is marked by biotite ± white mica. The occurrence of asymmetric myrmekites and asymmetric K-feldspar porphyroclasts points to a top-to-the-NW sense of shear. In the migmatite gneiss, the mylonitic foliation is defined by biotite, white mica, ± fibrolitic sillimanite and wraps around sheared leucosomes consisting of quartz and feldspar. Sillimanite, growing parallel to the S2 foliation, is syn-kinematic with the D2 phase. However, sillimanite is frequently retrogressed to fine-grained white mica. In migmatite gneiss, the chessboard extinction of quartz is also recognizable, indicating deformation temperatures above 650 °C [64]. Feldspar shows mechanical twinning, undulose extinction and sometimes fractures. At the microscale, amphibolite lenses hosted in kyanite-bearing rocks are constituted by the alternations of plagioclase-rich and green amphibole-rich levels intercalated with quartz + plagioclase and garnet bands.

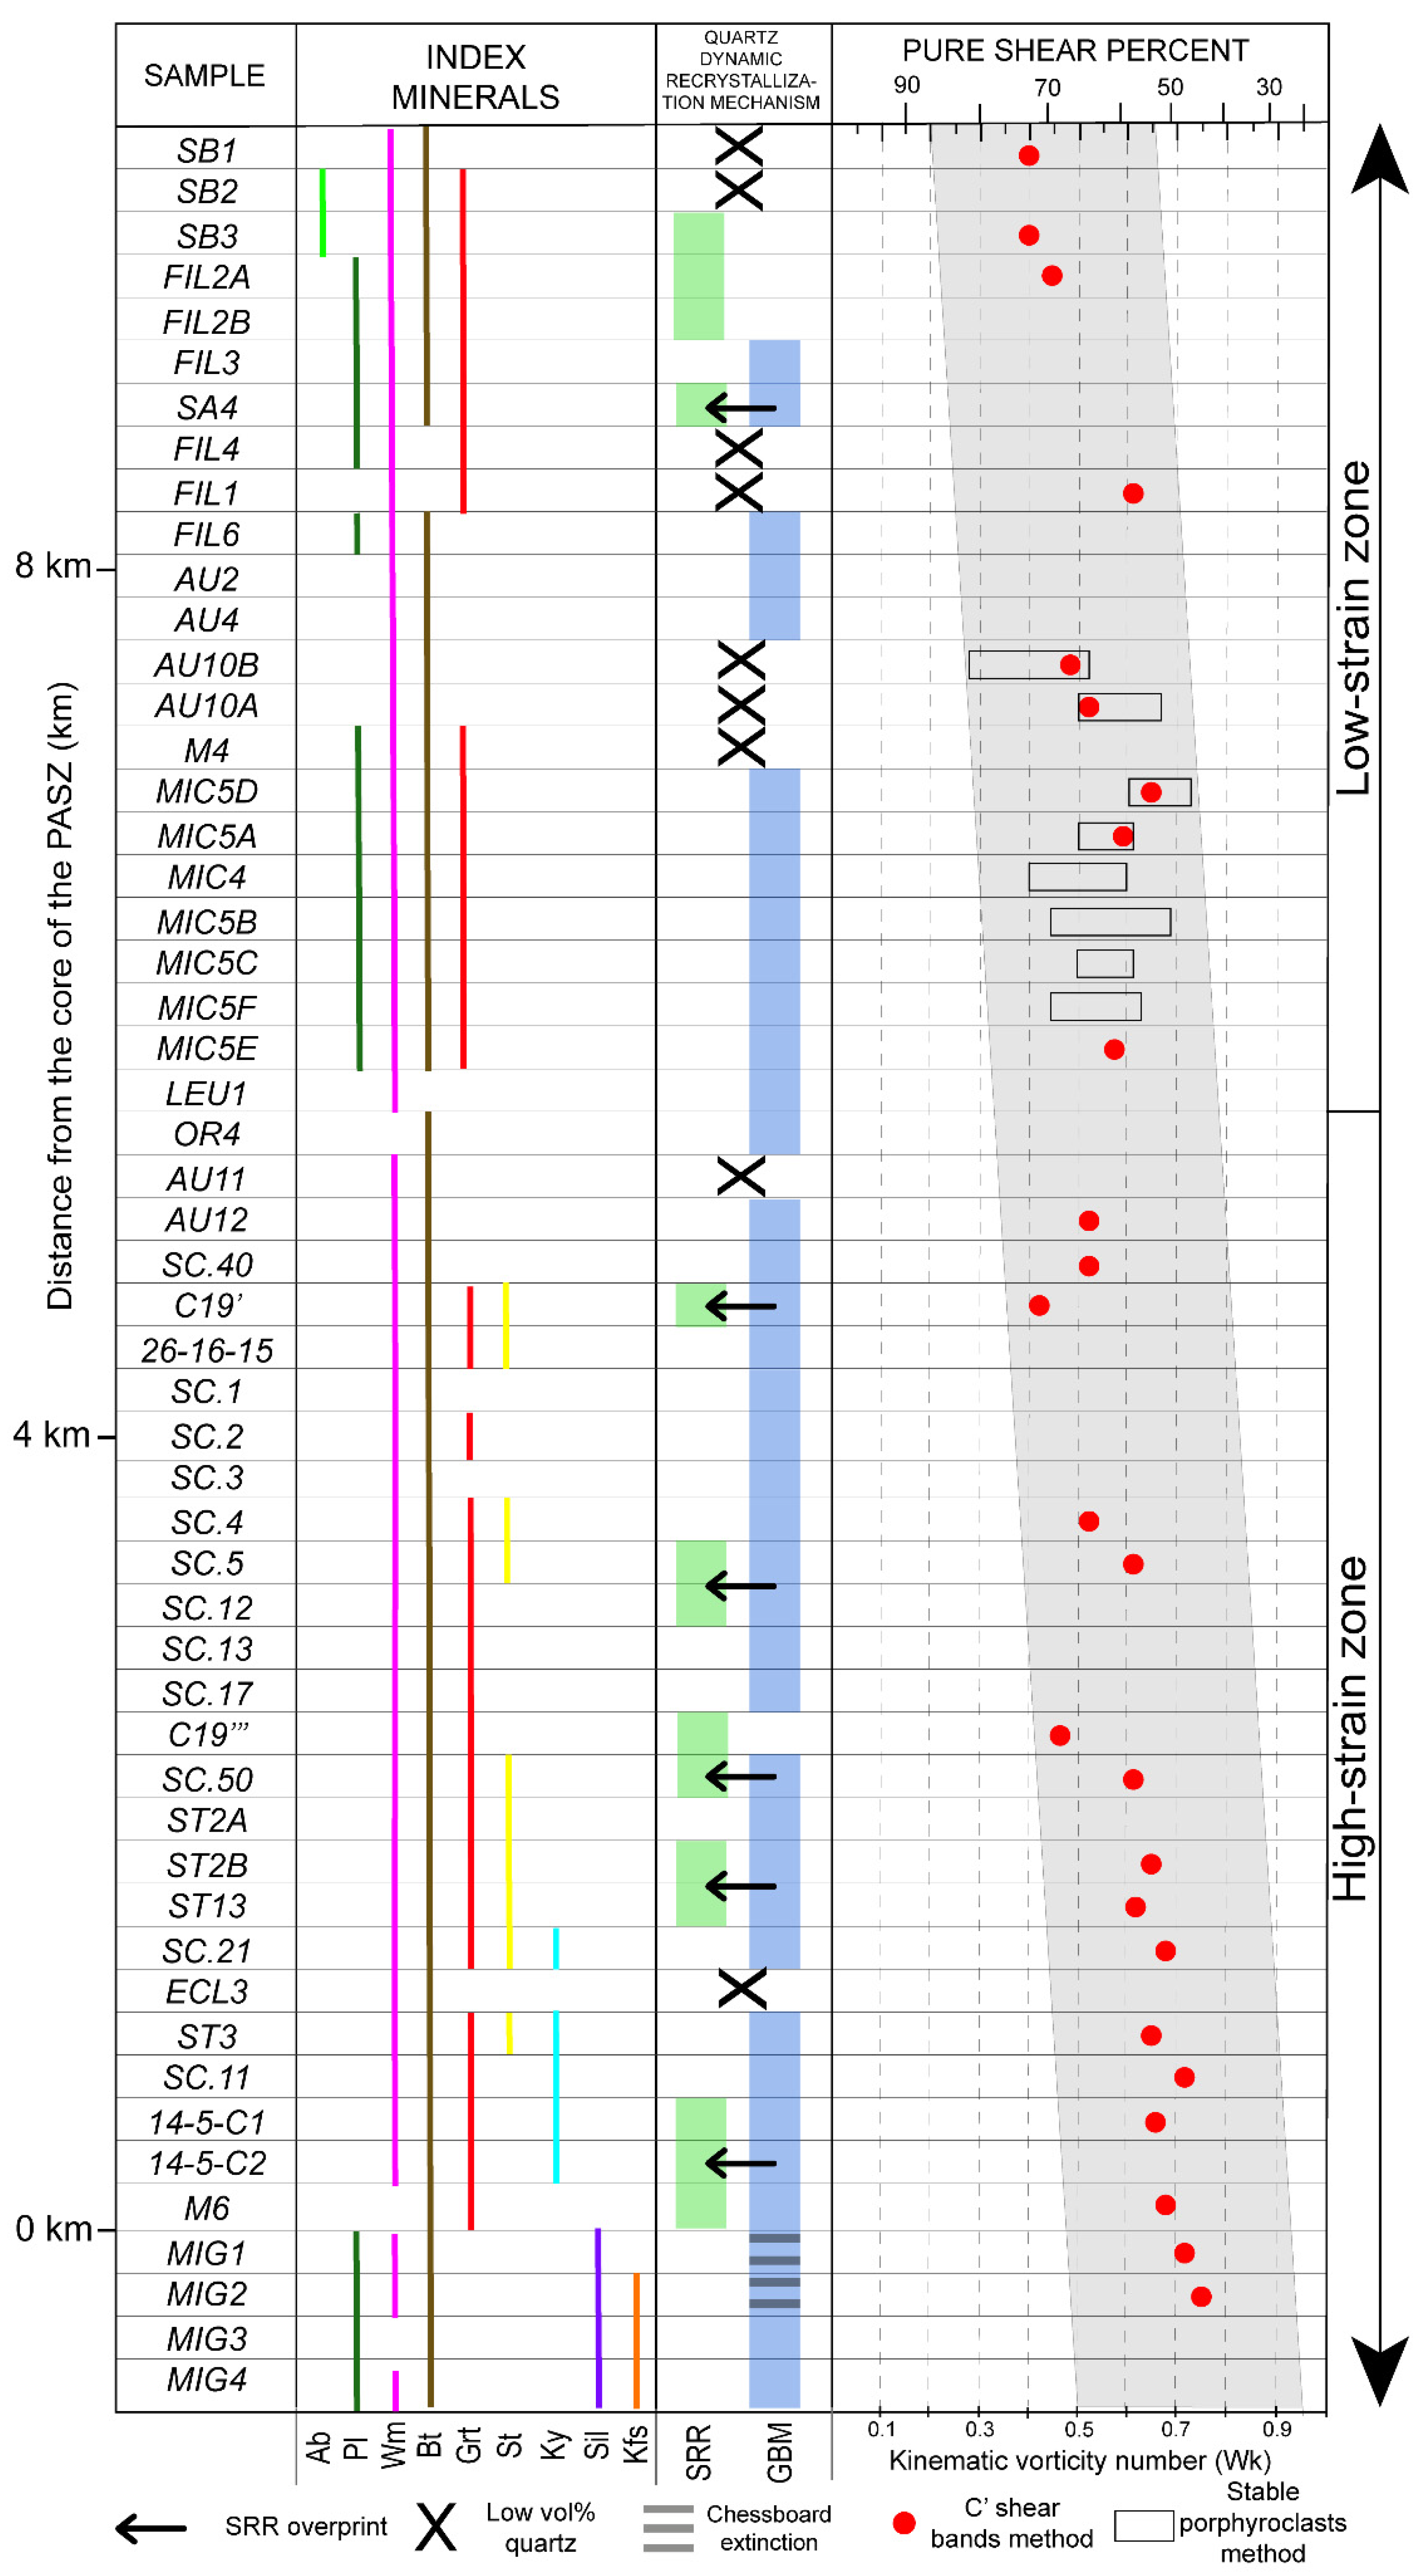
5. Vorticity and Finite Strain of the PASZ
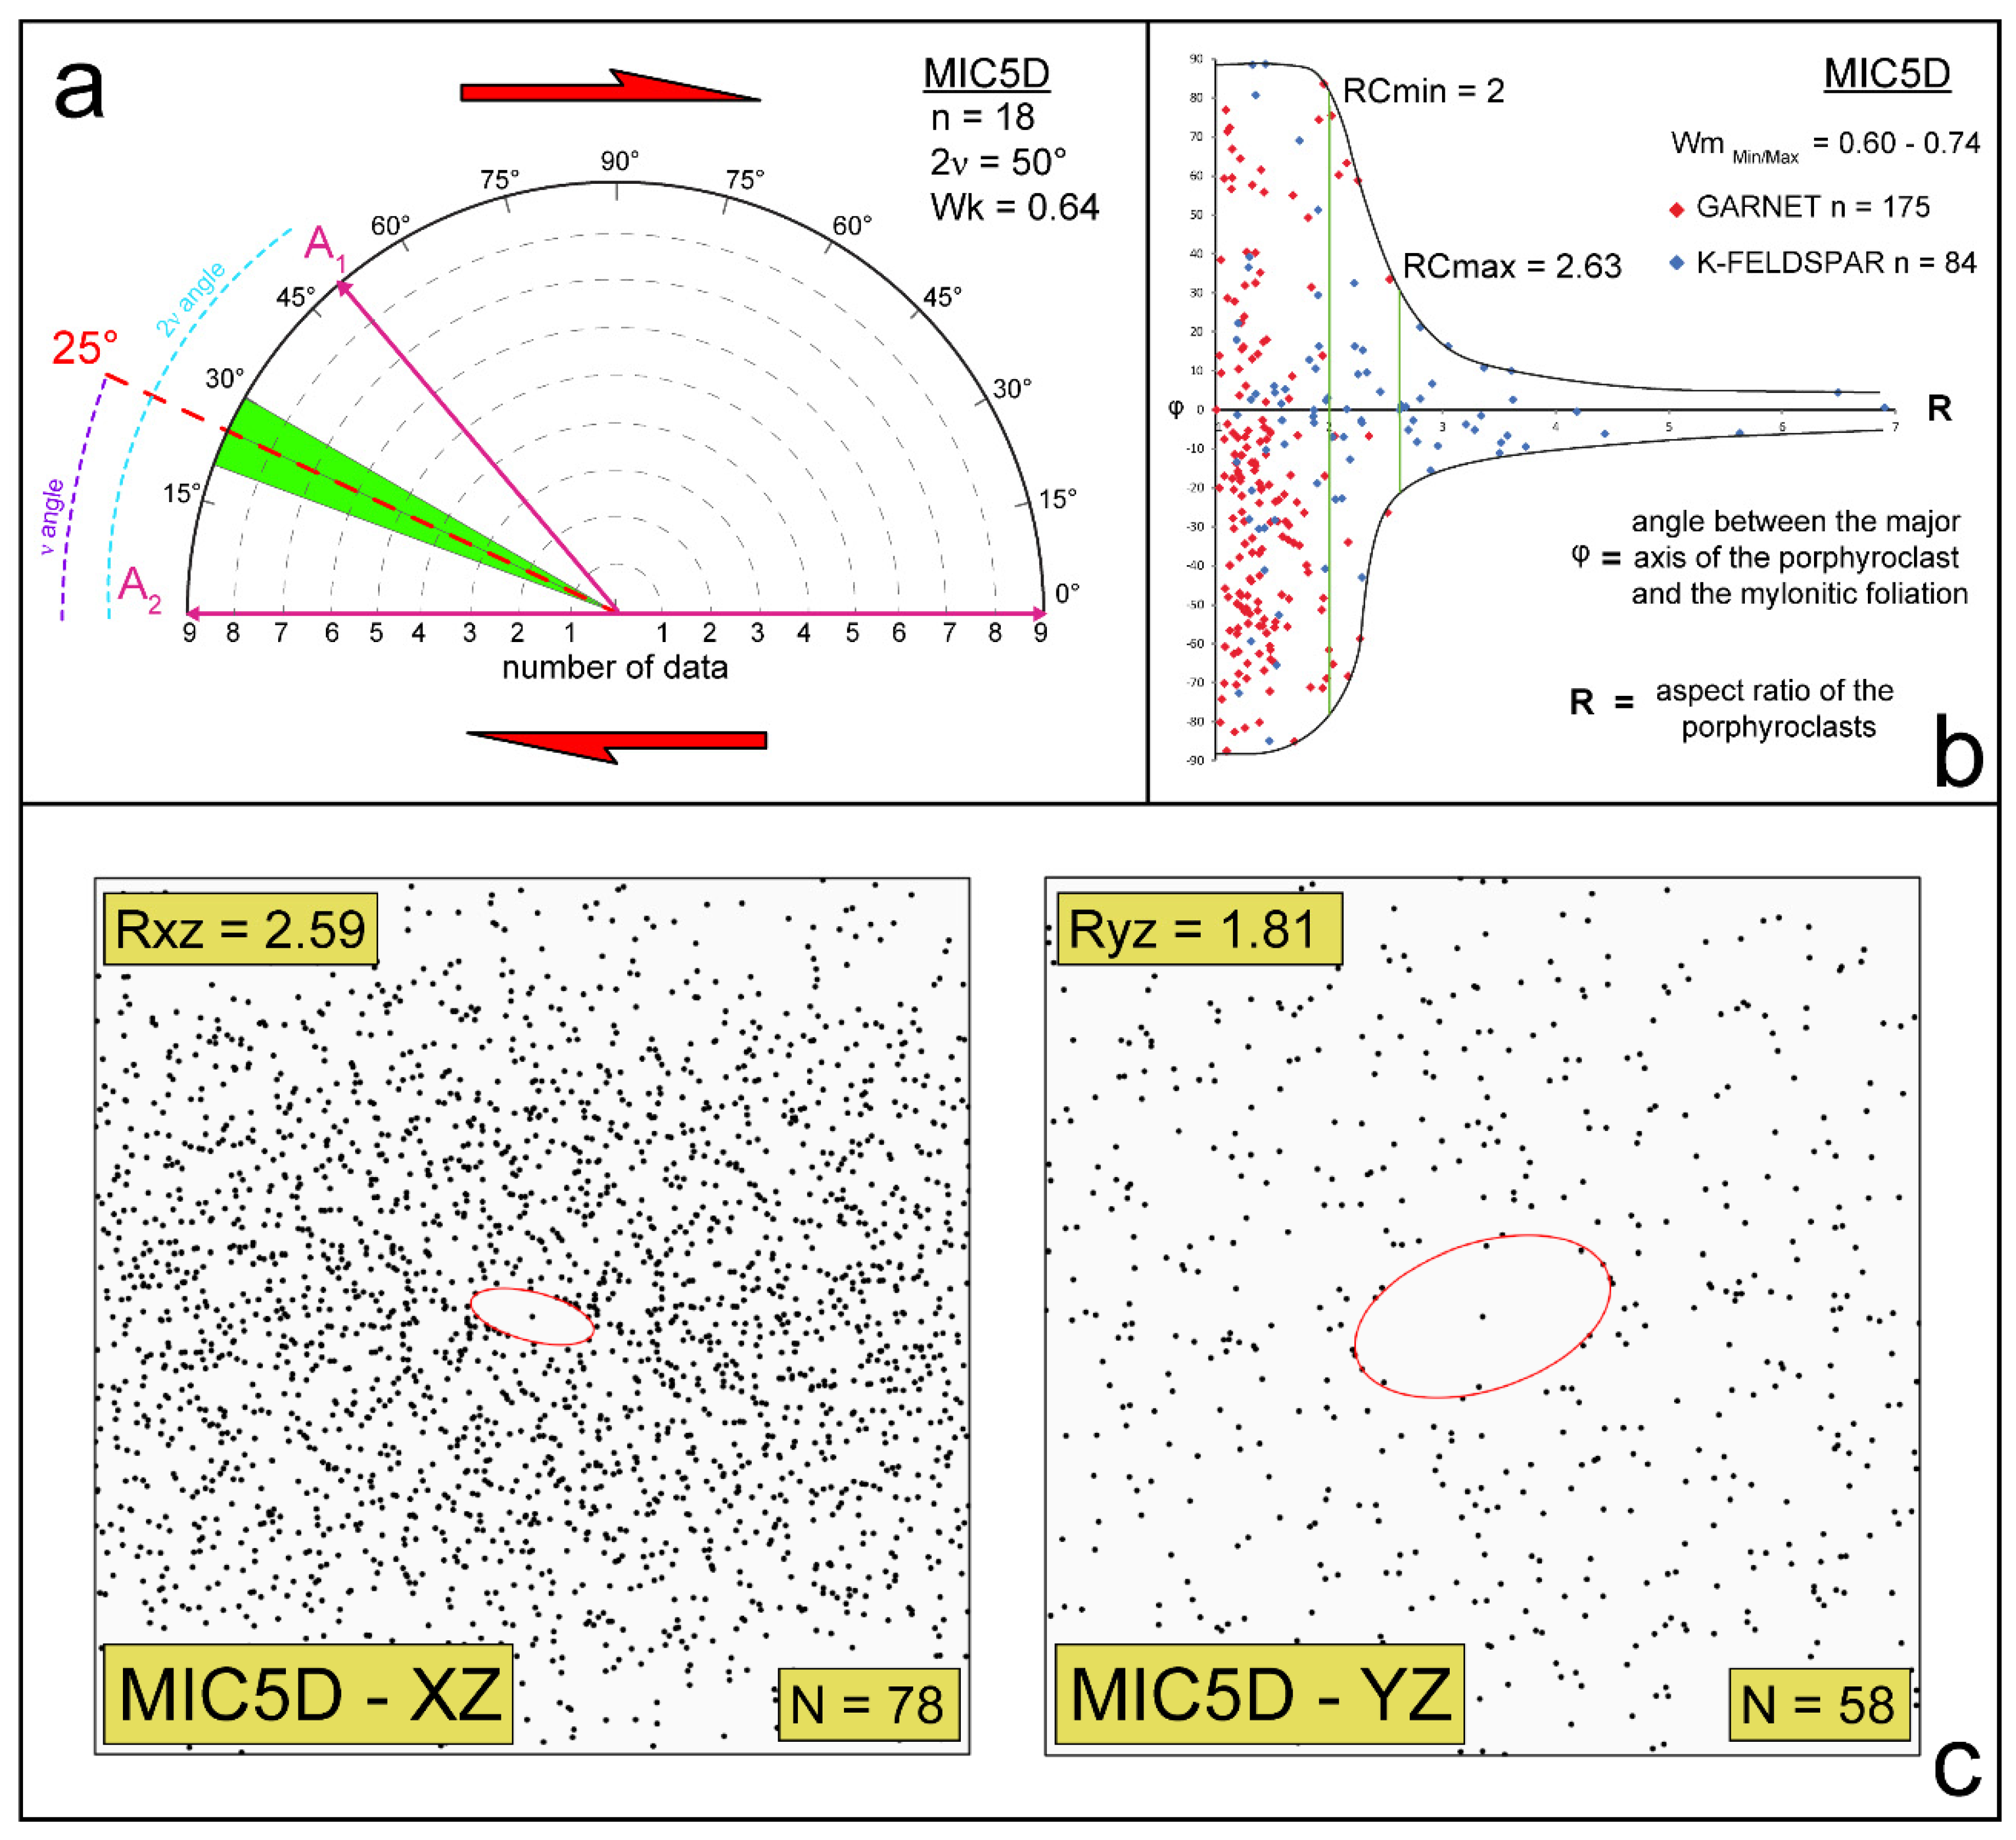
5.1. Methodology

A total of 34 samples (micaschist, para- and orthogneiss) from the PASZ were analyzed (Figure 2b, Figure 4). Vorticity analyses were performed on the samples poorly affected by post-D2 deformation, on sections parallel to the L2 lineation and perpendicular to the S2 mylonitic foliation (XZ plane of the finite strain ellipsoid). The complete list of the samples selected for vorticity and strain analyses and the corresponding results are summarized in Table 1.
The flow regime of the PASZ was investigated, applying two independent kinematic vorticity gauges: the C’ shear band method [22] for 26 samples, and the stable porphyroclasts method [12,66] on eight samples. The first method is based on the observation of whether C’ plane nucleates are parallel to the bisector of the angle between the two apophyses of the flow [67,68,69,70]. If so, the orientation of C’ planes concerning the shear zone boundaries, approximated by the C planes, is related to the kinematic vorticity (Wk) of the flow. It is, therefore, possible to measure the angle ν between the C and C’ planes and to estimate the Wk, according to the relation:
W k = cos 2 ν
The maximum value of ν is preferable as it is representative, or close to, the original angle of nucleation of C’ planes [22].
The second vorticity gauge is based on the rotational behavior of rigid objects within a flowing matrix [8,12,14,71]. The stable porphyroclasts method is based on three main assumptions ([15] and references therein): (i) porphyroclasts are considered to be rigid objects in a Newtonian viscous matrix constantly deformed; (ii) clasts and matrix should be perfectly coupled together and slips do not occur between them; and (iii) there is no interference or interaction between clasts. To prove that the first condition has been assessed, it must be verified that the porphyroclasts do not show internal deformation and they are harder to deform compared to the matrix [15]. The second condition was tested by plotting porphyroclast distribution against the theoretical curves of Mulchrone [72,73], calculated for different Wk values for a system in which the slip between porphyroclasts and matrix occurs, as suggested by Iacopini et al. (2011) [15]. The third condition is satisfied if the porphyroclasts are positioned far from each other and are free to rotate. This method consists in the identification of a critical aspect ratio (Rc) that separates the porphyroclasts that reached a stable position from the ones that experienced a continuous rotation. According to Passchier (1987) [12] and Wallis et al. (1993) [66], Rc is related to Wm according to the relation:
W m = R c 2 1 R c 2 + 1
Measurements were performed using the software EllipseFit 3.2 [74] on the samples with an adequate amount of garnet and K-feldspar porphyroclasts. Examples of the applications of the two vorticity gauges are given in Figure 6a,b.
The full dataset, related to the vorticity calculations and also containing the Mulchrone tests [72,73] is given in Figures S1–S5. To check the type of deformation of the shear zone, according to Fossen and Tikoff, (1993) [75] and Fossen et al. (1994) [76], we calculated the θ angle formed between the maximum instantaneous stretching axis (ISAmax) in the horizontal plane and the shear zone boundary. The θ angle calculation was performed using the formula [19]:
θ = sin 1 W k 2
Finite strain analysis was performed with the centre-to-centre method [77,78] on both the XZ and YZ sections of the finite strain ellipsoid. The complete finite strain results are reported in Figure S6. Selected examples are reported in Figure 6c. To quantify the amount of shortening perpendicular to the mylonitic zone, finite strain and vorticity data from the same sample were combined [7,66]. Convergence angles were estimated according to Fossen and Tikoff (1998) [79]. The proposed relation is:
α = tan 1 l n k x k y γ
where α is the convergence angle, kx and ky are the X and the Z axis of the finite strain, respectively, and γ is the shear strain.

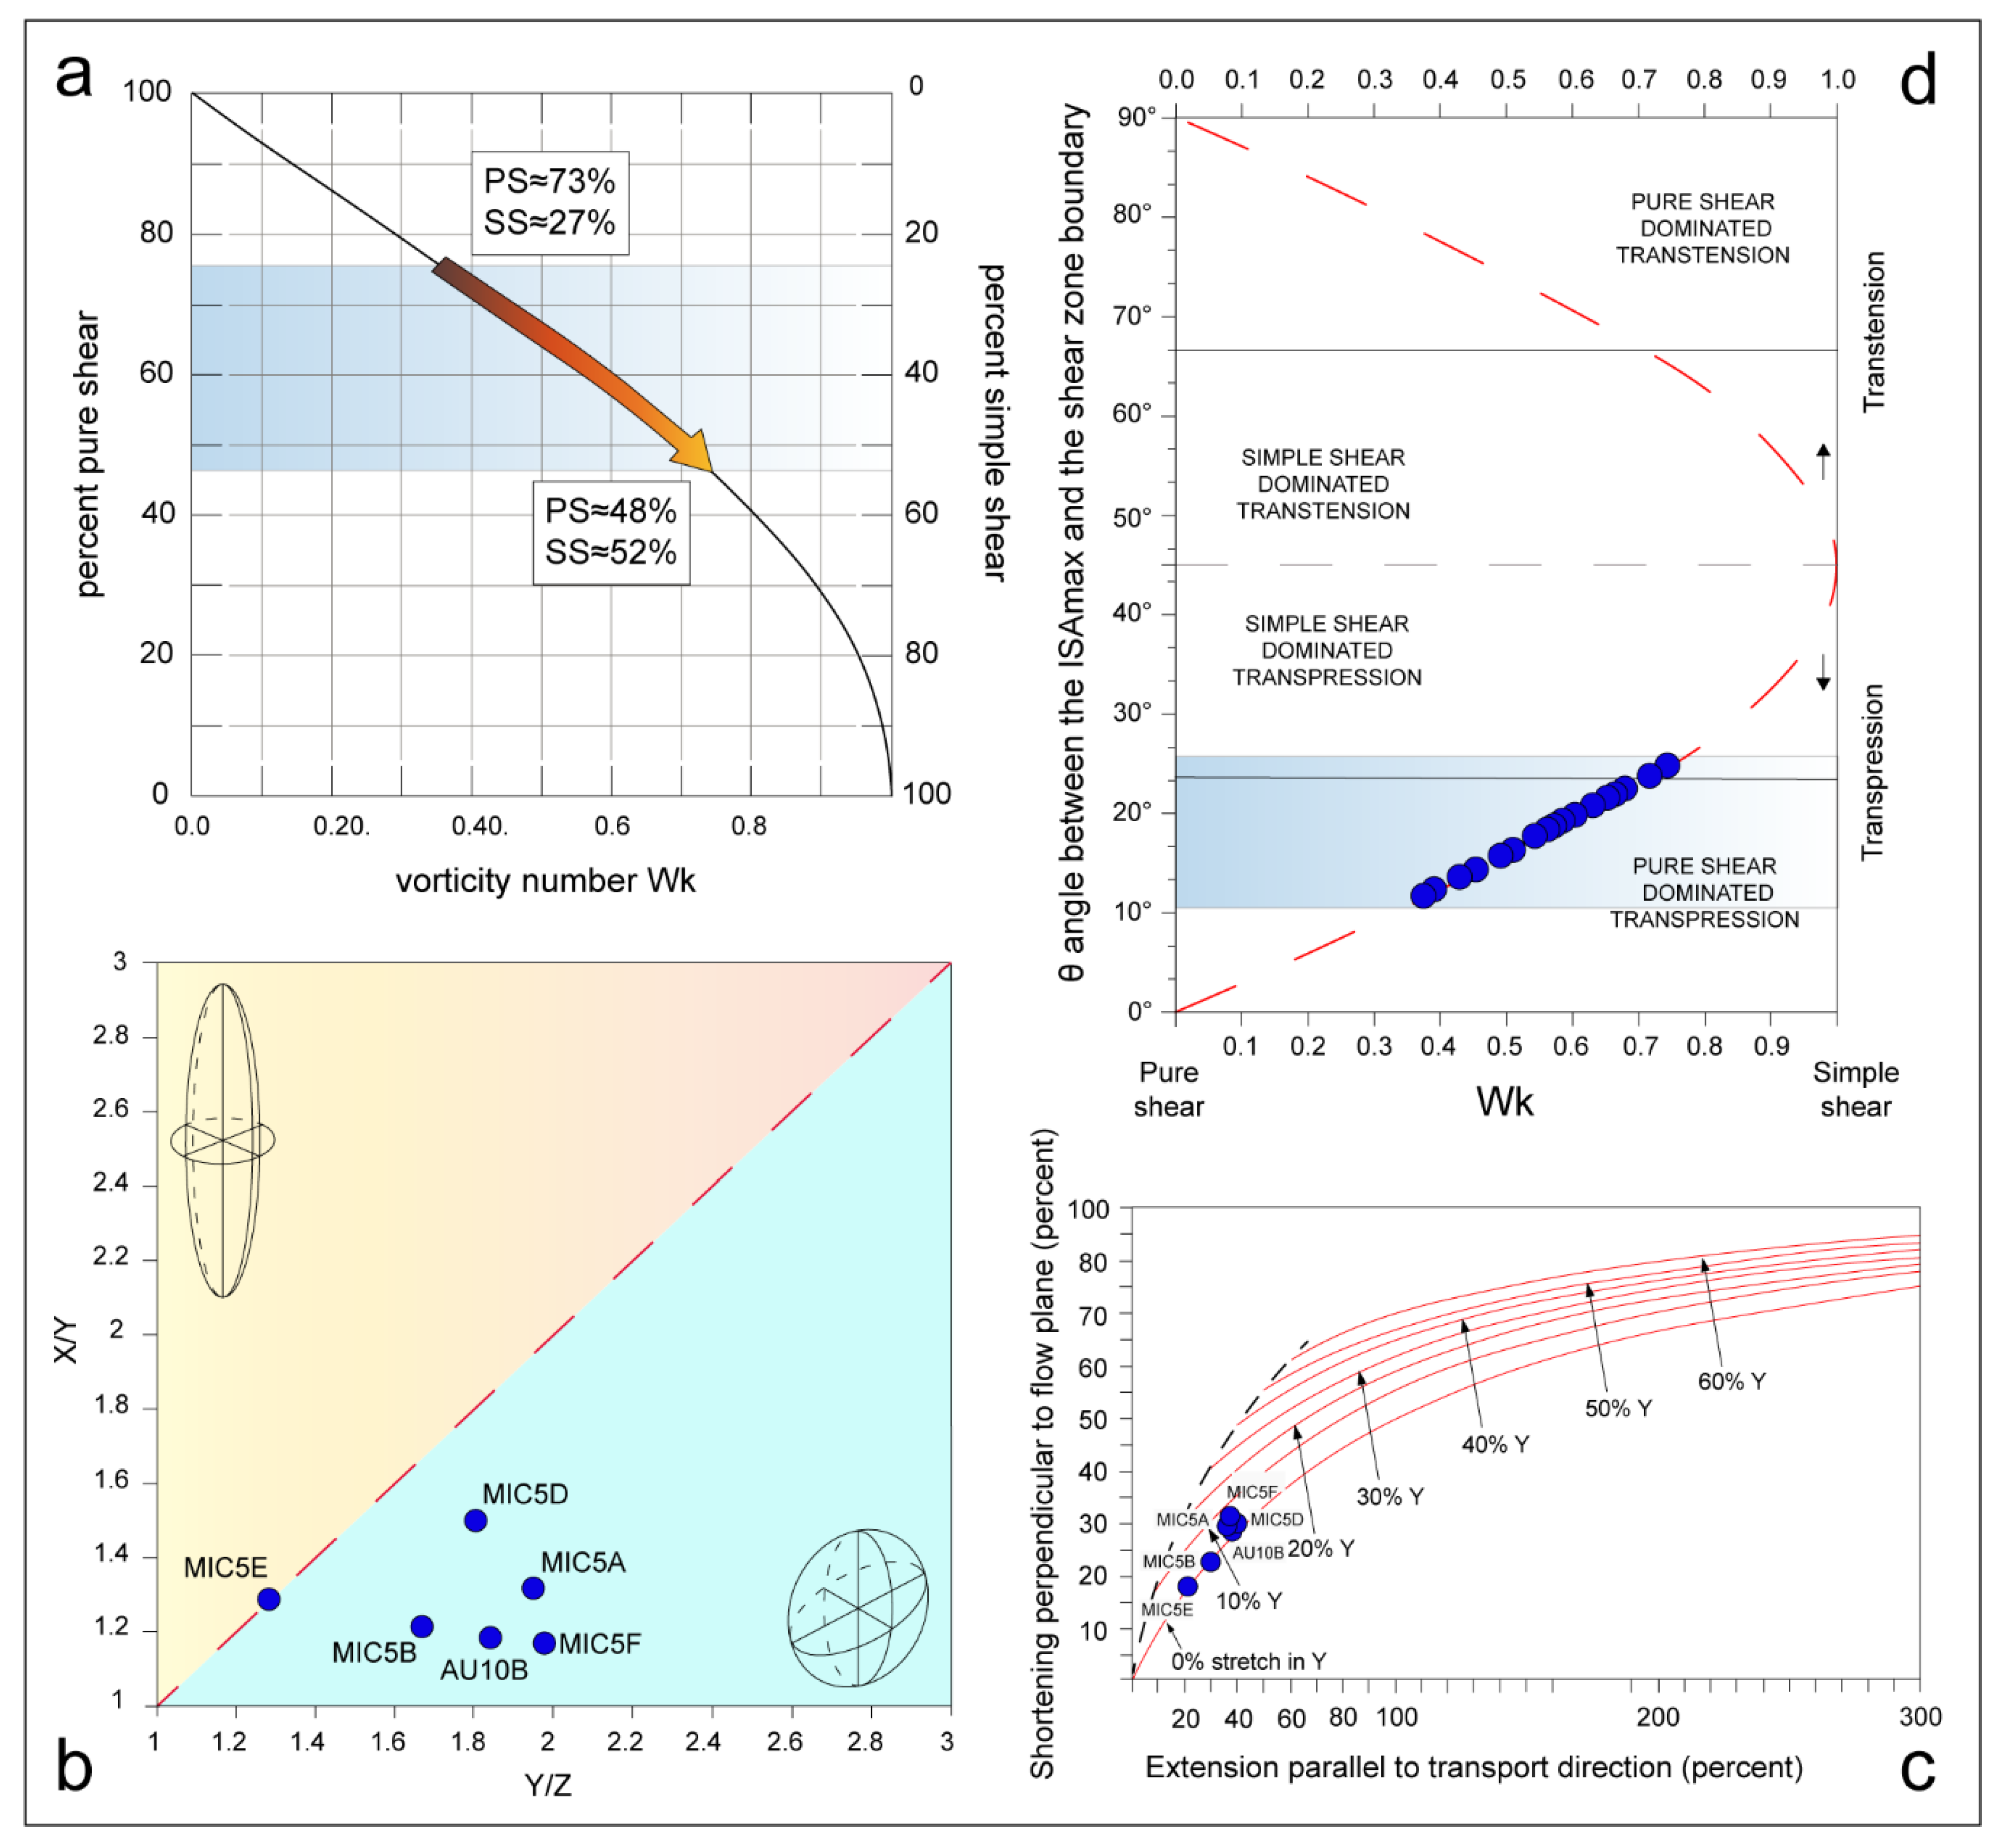
5.2. Vorticity and Finite Strain Results and Implications

Vorticity values obtained with the C’ shear band method range between 0.40 and 0.74 (mean value of 0.58 and a modal value of 0.53). These results indicate a component of pure shear between 73% and 48%. The stable porphyroclasts method gives values ranging from 0.27 to 0.74, indicative of pure shear between 82% and 48%, in good agreement with the results obtained with the previous vorticity gauge (Figure 4). Comparison between the flow regime and the structural position of the studied samples (see Figure 2b for sample location) reveal a variation of the component of simple shear along the deformation gradient from SW to NE (from 27% up to 52%; Figure 7a) approaching the high-strain zone. In the Flinn diagram, most of the strain ellipsoids have an oblate shape, except one sample (MIC5E) falling near the plane-strain conditions (Figure 7b).
Finite strain data suggest a general flattening, in agreement with pure shear-dominated transpression [75,76,81]. The scatter in strain geometry indicates that deformation in the shear zone was slightly heterogeneous. Combining Wk values and finite strain estimates from the same sample, following Wallis et al. (1993) [66] and Law et al. (2004) [7], we calculated 18–30% shortening, respectively. Since the studied samples are not deformed in the plane strain conditions, it is necessary to correct the shortening and stretching values [19,82,83]. Applying the aforementioned correction (Figure 7c), the stretching parallel to the transport direction is between 21% and 41%. According to the calculated θ angles, most of the studied samples (Figure 7d) plot in the field of pure shear-dominated transpression, and only two samples fall in the simple shear-dominated transpression area. Combining kinematic vorticity and finite strain, as stated before, a convergence angle, ranging between 51° and 60°, was estimated.

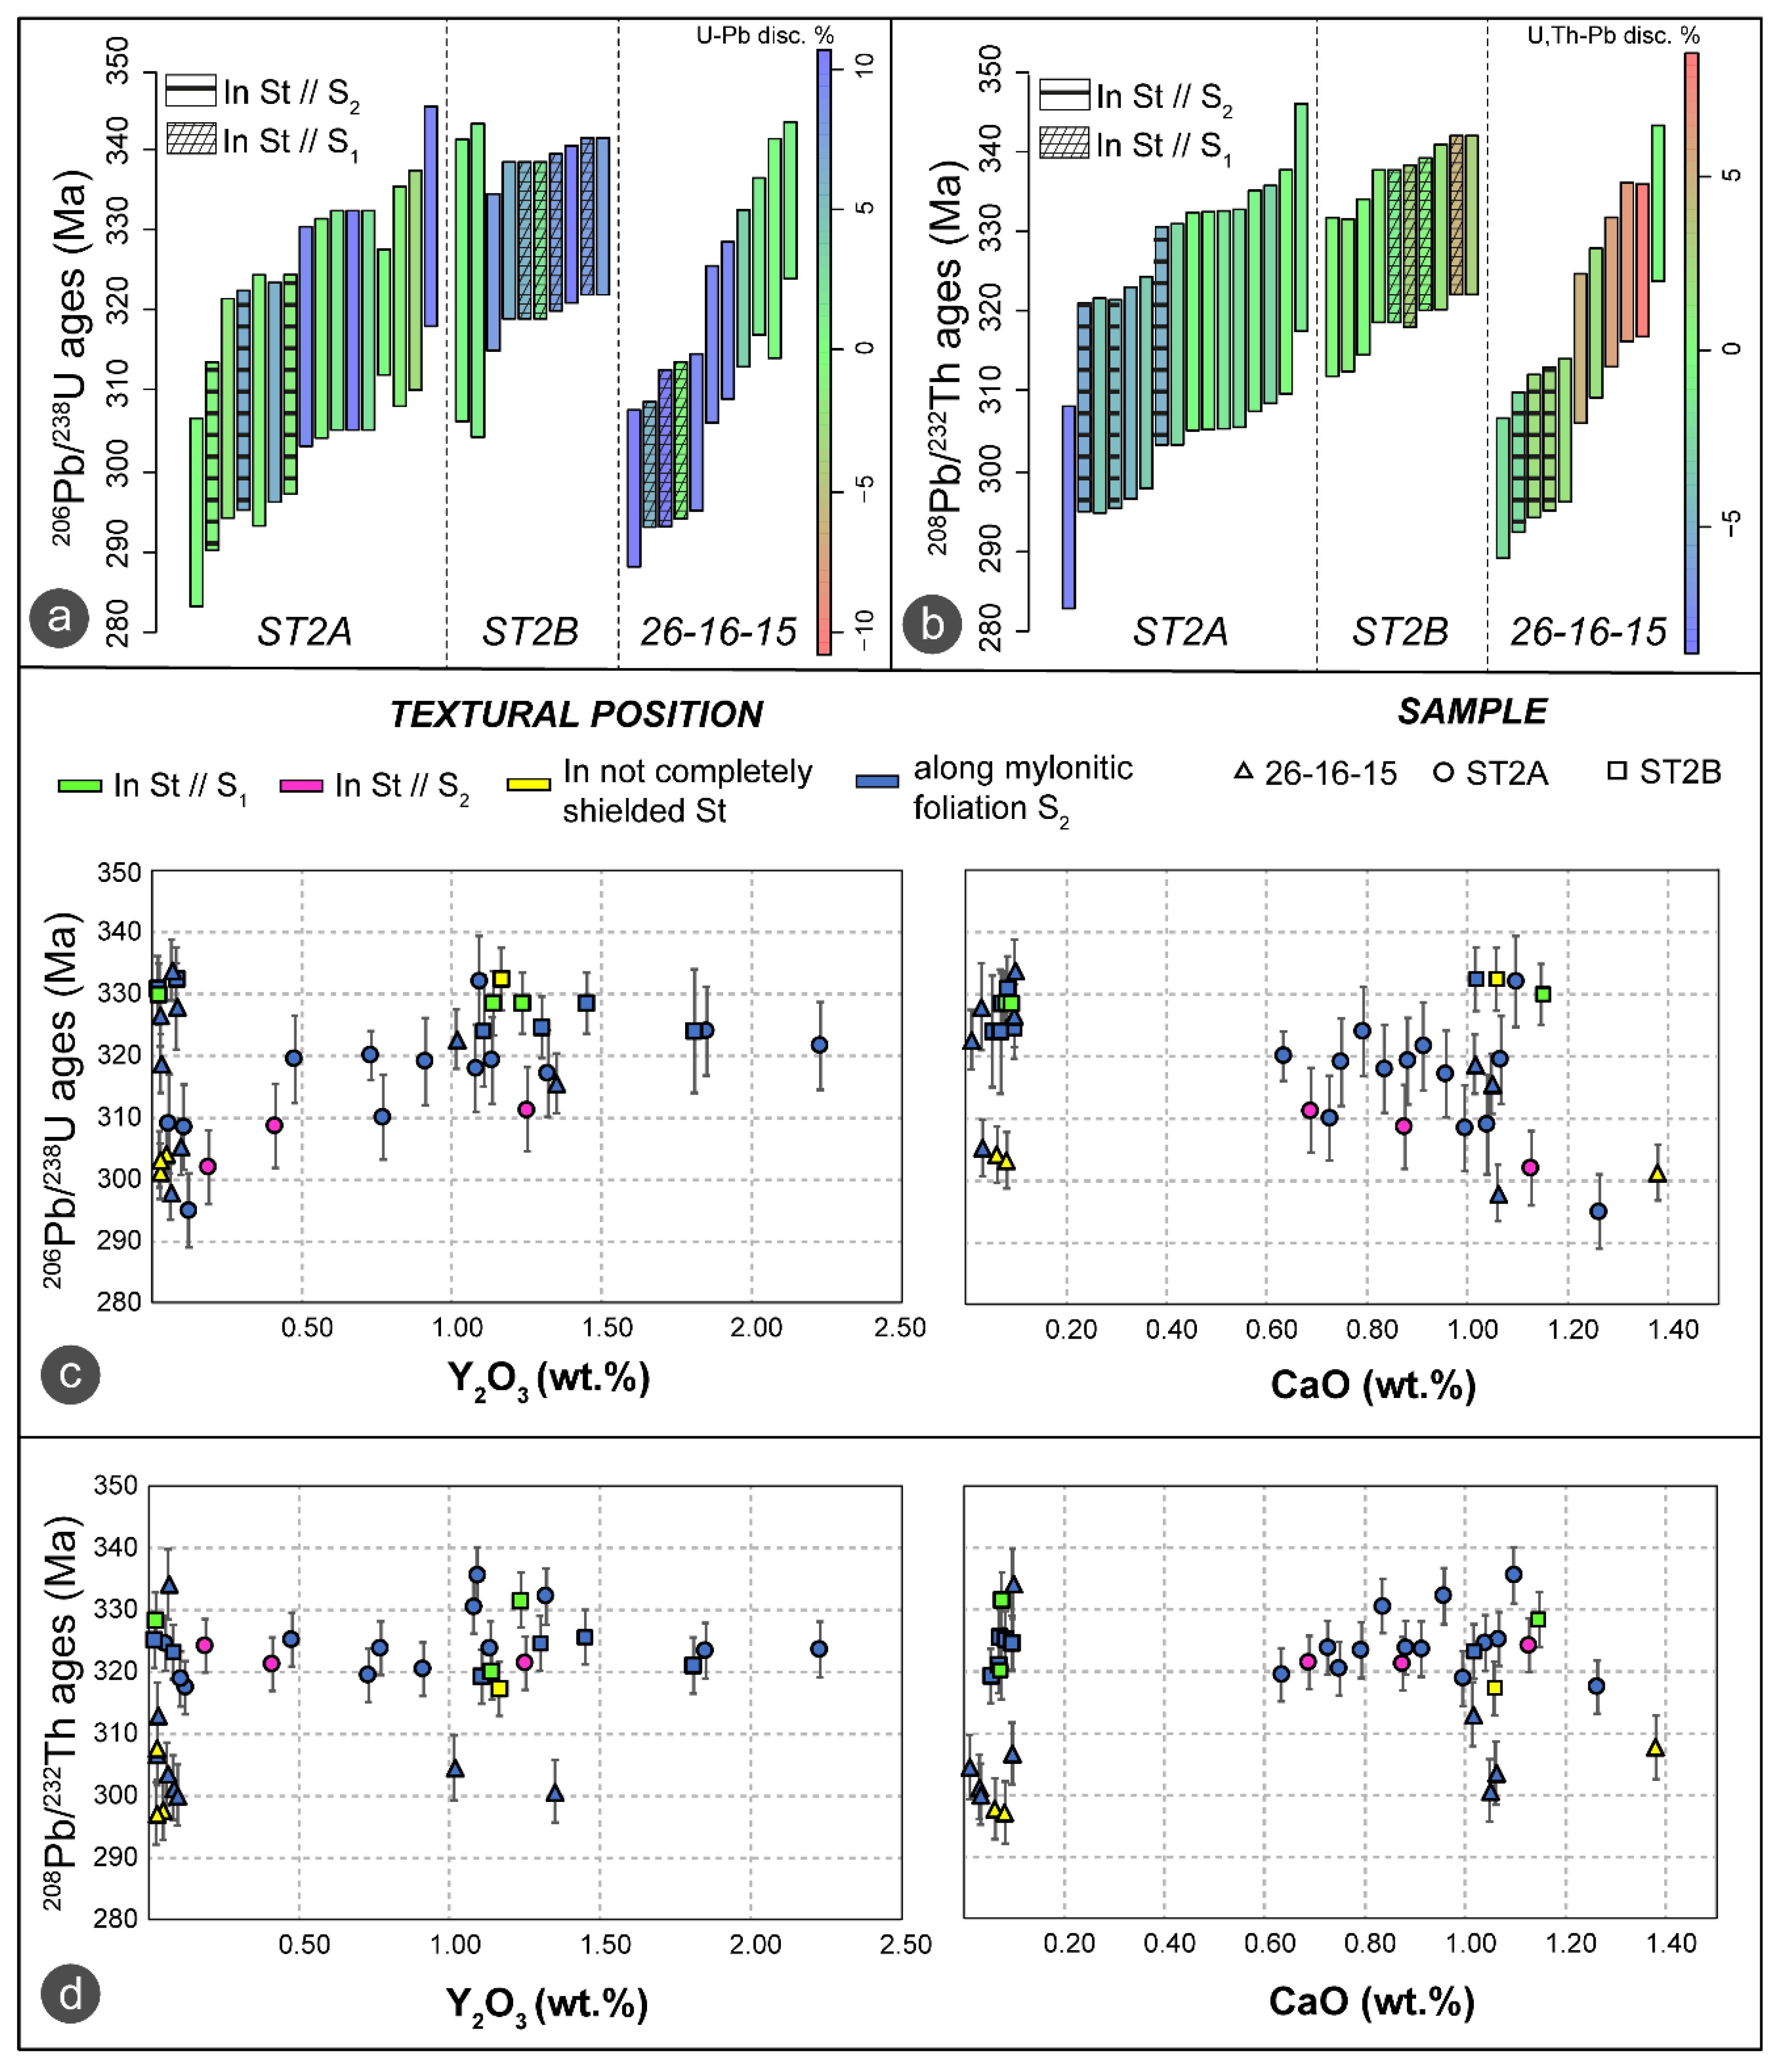
6. U–(Th)–Pb Monazite Geochronology

6.1. Methods and Analytical Techniques

To obtain time constraints on the evolution of the studied sector, monazite geochronology was performed [84,85]. Grain locations, internal features (inclusions, fractures, etc.) and Backscattered-Electron (BSE) images were obtained with the aid of a scanning electron microscope (JEOL JSM IT300LV; JEOL Ltd. Japan Electron Optics Laboratory Co. Ltd, Akishima, Tokyo, Japan) at the University of Torino (Italy). Mineral chemistry and X-ray compositional maps, to highlight the compositional zoning required for the correct interpretation of monazite grains and ages, were investigated with a JEOL 8200 Super Probe electronic microprobe hosted at the University of Milano (Italy). We followed the working conditions of Montomoli et al. (2013) [25]. Isotopic dating was performed at the CNR–Istituto di Geoscienze e Georisorse U.O. Pavia (Italy), using the laser ablation inductively coupled plasma mass spectrometry (LA-ICP-MS) directly on 30 µm-thick sections. The instrument consists of a Ar–F 193-nm excimer laser (GeolLas 102 from Micro-Las) coupled with a magnetic sector ICP-MS (Element I from Thermo-Finnigan). The full description of the analytical procedures is reported in [86,87]. Single analyses were performed by a one-minute procurement of the background signal followed by recording, for at least 30 s, the ablation signal of the masses: 238U, 232Th, 206Pb, 207Pb, 208Pb, 202Hg and 204(Hg + Pb). The analysis conditions were a spot size of 10 μm in diameter, an energy density of 8 J cm−2 and with a repetition frequency of 3 Hz. Matrix-matched external monazite standard (Moacir monazite) [88,89] was used for correcting the laser-induced elemental fractionation and mass bias. Monazite EMP analysis and isotopic results for standards and unknown are reported in Tables S1–S3. IsoplotR software [90,91] was used for the data processing and plotting.

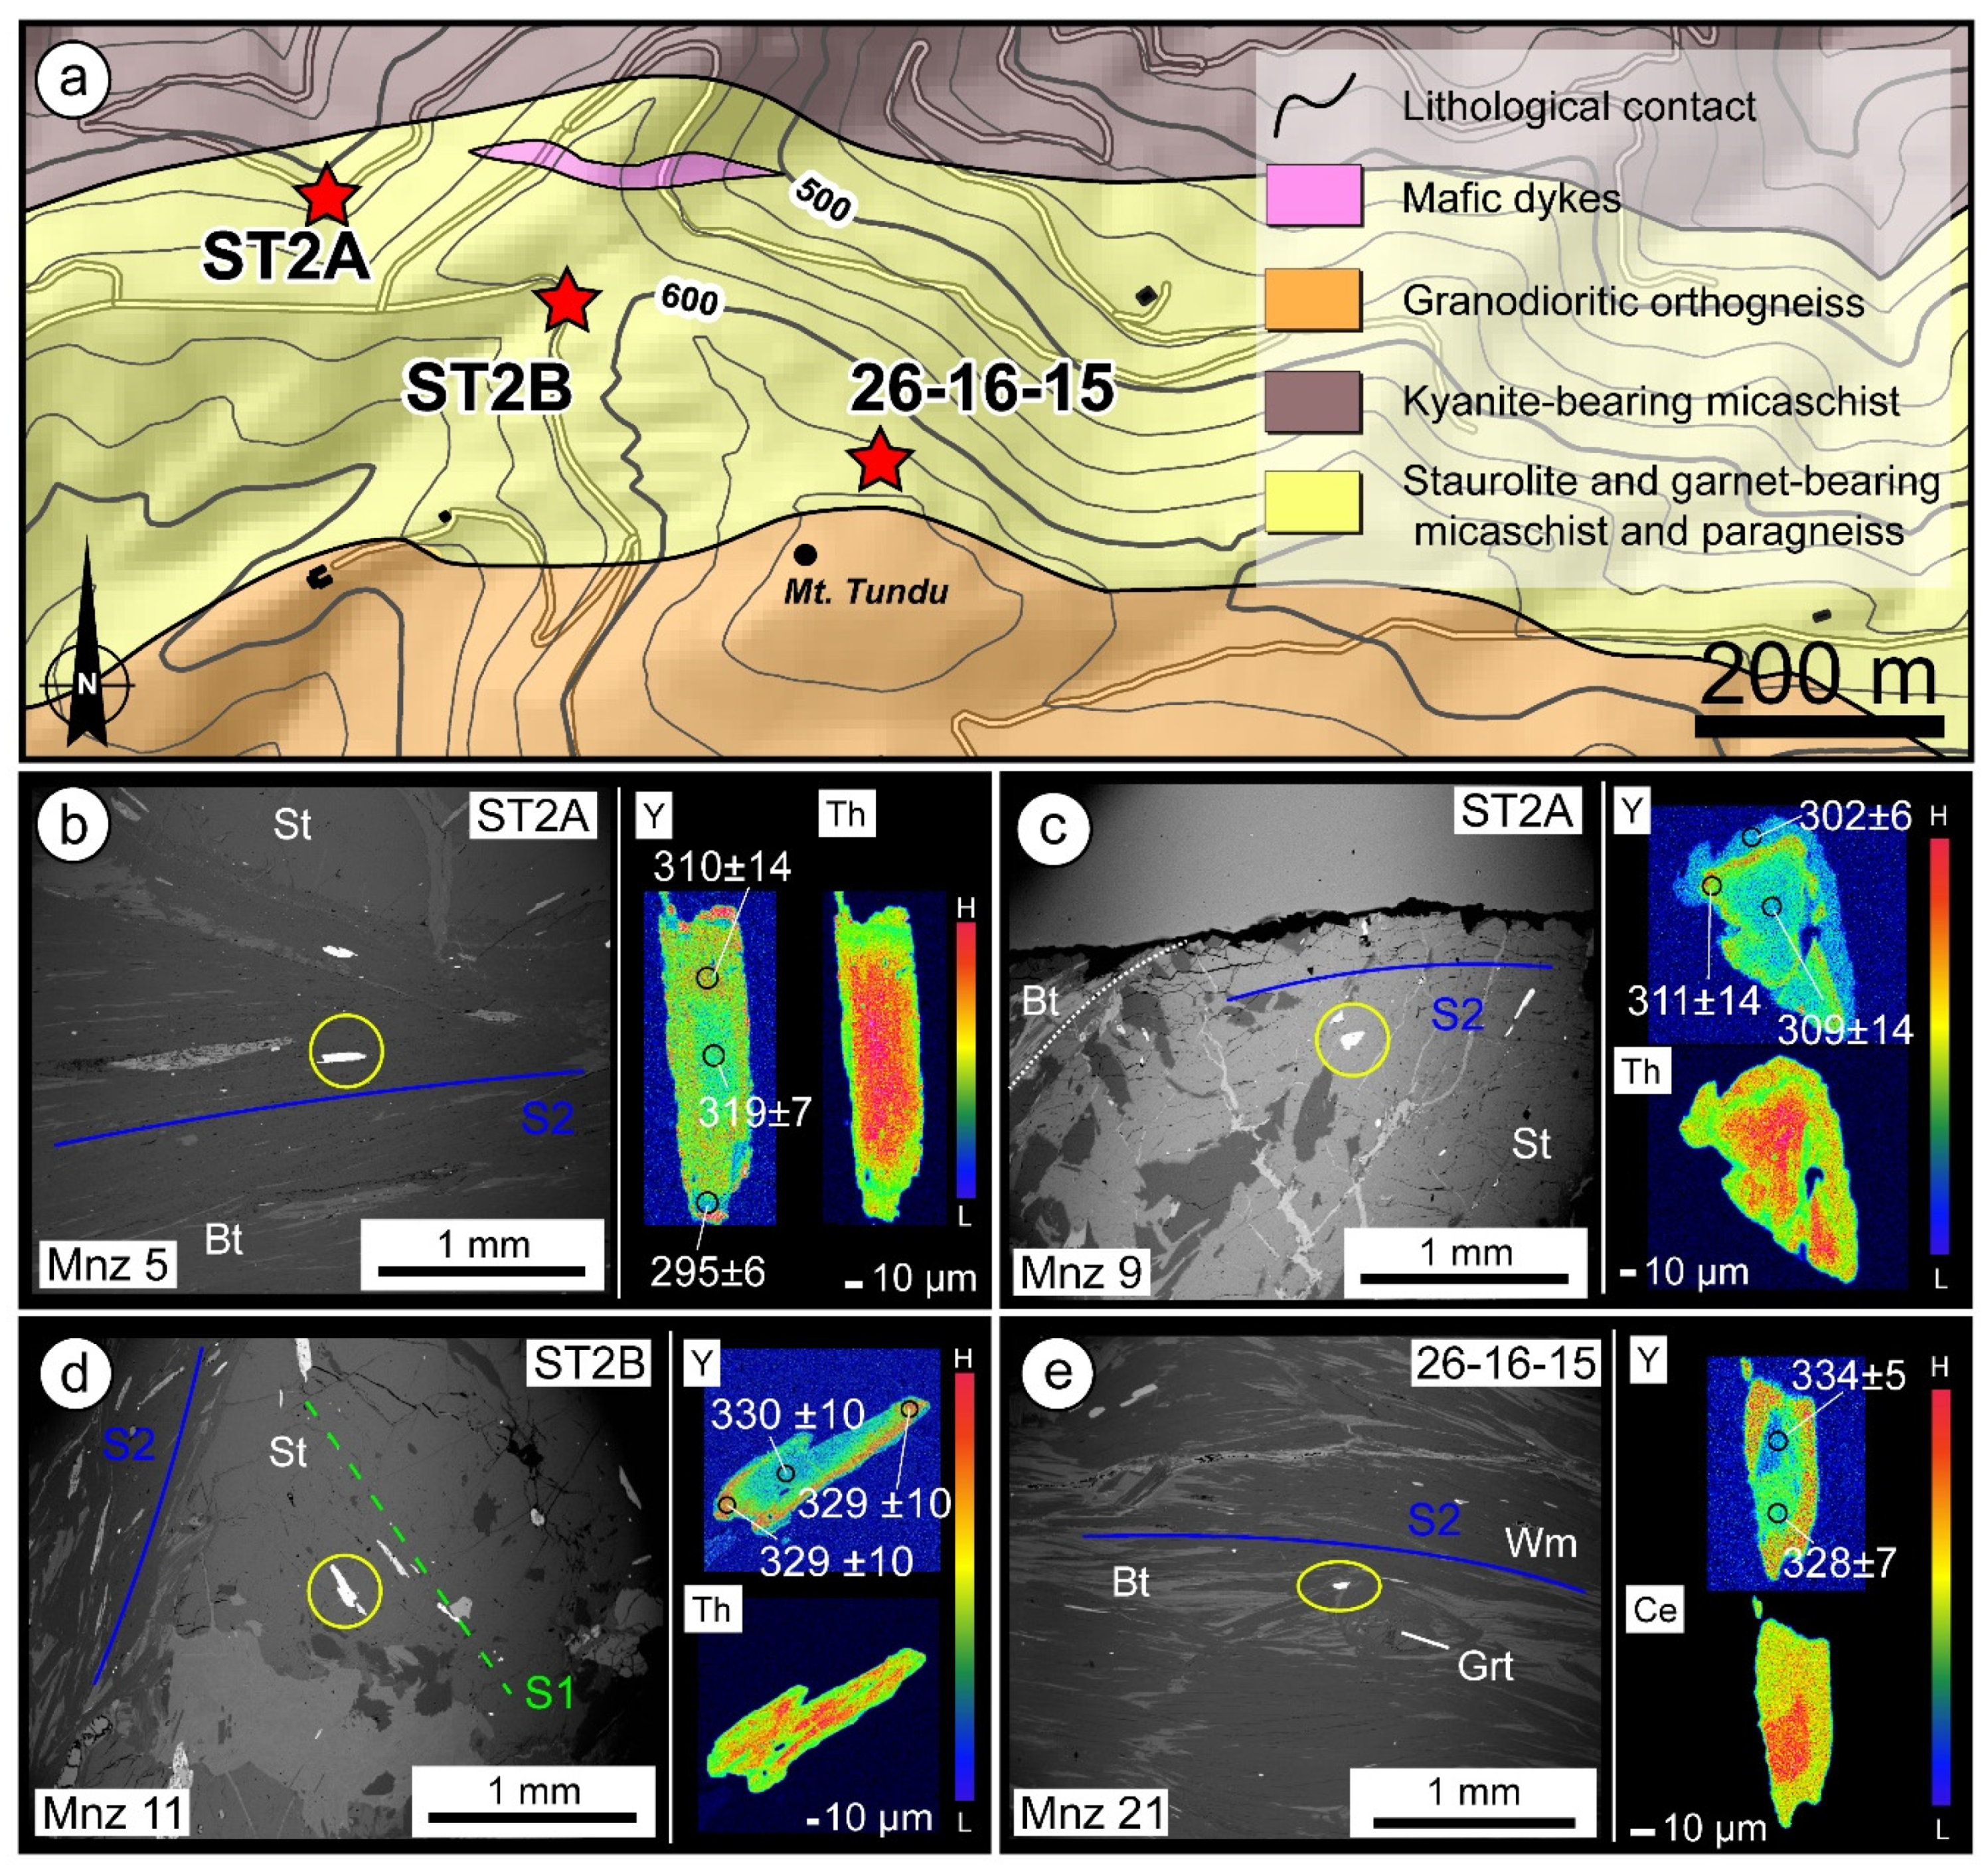
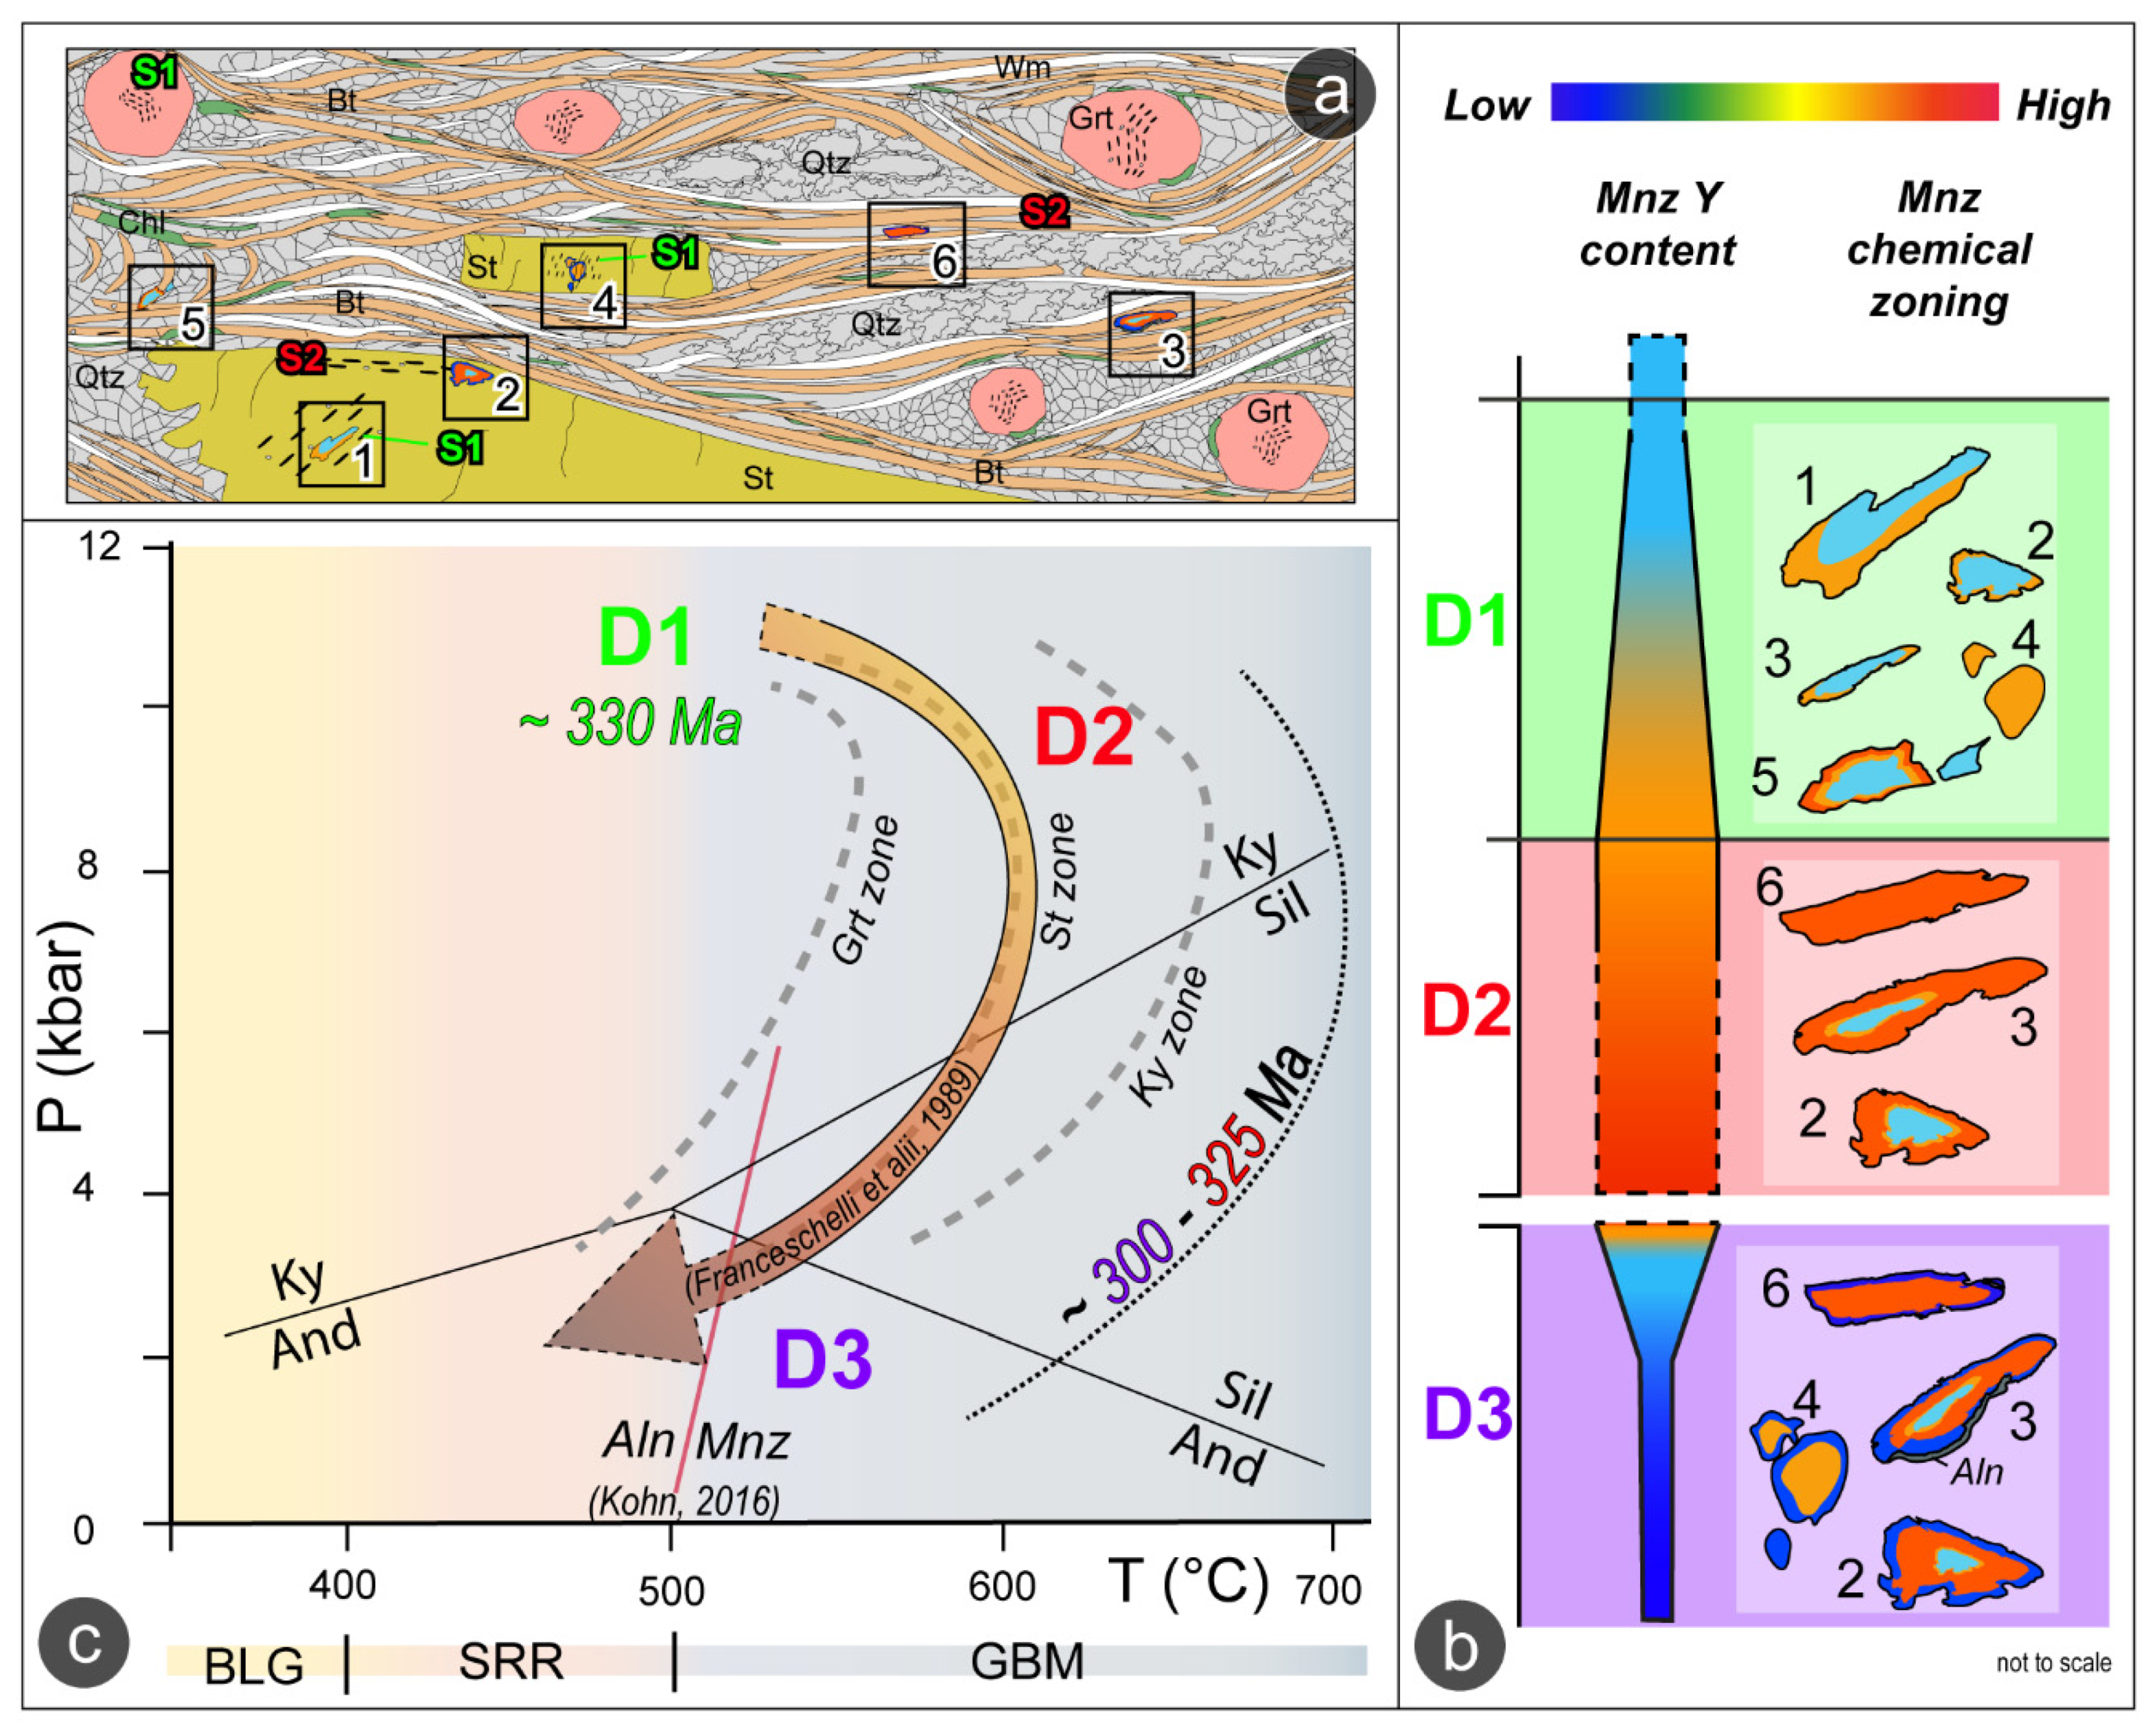
6.2. Monazite Mineral Chemistry, Zoning and Isotopic Results

A total of 17 monazites grains, collected in three samples of staurolite- and garnet-bearing micaschist (ST2A, ST2B and 26-16-15; Figure 8a), were selected for LA-ICP-MS dating. The modal amount of garnet was 3 vol.% for sample ST2A, 2 vol.% for sample ST2B and 8 vol.% for sample 26-16-15. Examples of the main features of selected monazites are reported in Figure 8b–e.
Monazite grains are mostly subhedral to anhedral with a size between 80100 μm (ST2A), 70–150 μm (ST2B), and 40–80 μm (26-16-15). In sample ST2A, five grains (Mnz5, Mnz11, Mnz13, Mnz21 and Mnz24; Figure 8b) lie along the S2 foliation; one grain (Mnz9; Figure 8c) is included in staurolite and is oriented parallel the S2 foliation. In sample ST2B, three grains (Mnz2, Mnz10 and Mnz21) are along the S2 foliation and two grains (Mnz11 and Mnz12; Figure 8d) are included in staurolite with Mnz11 parallel to the S1 internal foliation, and Mnz12 located near the intragranular fractures. In sample 26-16-15, five grains (Mnz10, Mnz20, Mnz21, Mnz22 and Mnz24; Figure 8e) lie along the S2 foliation or are included within syn-kinematic biotite and white mica; one grain (Mnz9) is included in staurolite, but near fractures connecting it with the matrix. Locally, monazite grains from sample ST2A and 26-16-15 show a partial replacement by a fine-grained allanite ± apatite aggregate. Thirteen elements were analyzed for 17 monazite grains within the three samples (Table S1). In order to get information about correlation within and among samples we applied a Principal Component Analyses (PCA) to the multivariate dataset (Figure S7). The two main components PC1 and PC2 account for 63.8% of total data variance. Eigenvectors for Ca, Ce, La and Pr drive PC1 whereas Gd, Sm and U drive PC2. Combining the information from the two main components, monazite grains within ST2A are characterized by a higher Ca and Si content and lower P, according to PC1, and higher U and Pb concentrations, according to PC2, concerning the monazite from other samples. In sample ST2A, the CaO ranges between 0.6 and 1.4 wt.%, whereas in the other two samples, it is generally lower than 0.2 wt.% with a few values ranging from 1.0 to 1.4 wt.% (Table S1). Analogously, the UO2 and PbO concentrations of monazite from ST2A are significantly higher (UO2 > 0.4 wt.%; PbO > 0.06 wt.%) than those reported for monazite within the other samples (UO2 < 0.1 wt.%; PbO < 0.01 wt.%). Monazite data from sample 26-16-15 show a major correlation according to PC2, positively correlated to light-rare-earth elements (i.e., La, Ce, Pr). Grains from the sample ST2B have an average higher Y absolute content with respect to the other two samples (Table S1). The X-ray maps of Ca, P, Y, Ce, La, Pr, Th, and U revealed a complex zoning consistent within each sample. We noted that, in both the ST2A and ST2B samples, monazite is characterized by the apparent zoning of Y and Ca that are generally inversely correlated to Th. Monazite from 26-16-15 is characterized by the marked zoning of Y, Ca, Ce, Th and U, where Y and Ca are generally inversely correlated with the other elements. In order to unravel a possible correlation between monazite and garnet, we focused on Y–Th–Ca zoning and chemistry. Combining the zoning features with quantitative chemical analyses, we observed that monazite shows concentric Y–Th–Ca zoning (Mnz5, Mnz9, Mnz21 and Mnz24 in sample ST2A; Mnz2, Mnz11 and Mnz21 in sample ST2B; Mnz21 and Mnz24 in sample 26-16-25) defining four compositional domains: (i) low-Y inner cores (between ~0.02 and ~0.08 wt.% of Y2O3) with high- to medium-Th contents (between ~5.02 and ~6.21 wt.% of ThO2) and to low-Ca concentrations (between ~0.04 and ~0.10 wt.% of CaO); (ii) medium- to high-Y and medium- to high-Ca outer cores (between ~1.06 and ~1.3 wt.% of Y2O3; ~0.62 and ~1.15 wt.% of CaO) with medium- to low-Th contents (between ~0.08 and ~2.12 wt.% of ThO2); (iii) medium- to high-Y inner rims (between ~0.45 and ~2.13 wt.% of Y2O3) corresponding to low- to very low-Th contents (between ~0.02 and ~0.07 wt.% of ThO2) and to high-Ca concentrations (between ~0.71 and ~1.38 wt.% of CaO); iv) low- to very low-Y, often discontinuous, outer rims (between ~0.01 and ~0.19 wt.% of Y2O3) characterized by medium- to high-Th values (between ~3.92 and ~5.63 wt.% of ThO2) and to low-Ca contents (between ~0.01 and ~0.10 wt.% of CaO). Monazites included in staurolite (Mnz11 and Mnz12, sample ST2B; Mnz9, sample 26-16-15) generally do not show both high-Y and low- to very low-Th inner rims. However, when monazite is near to the fracture and thus not completely shielded, both the inner- and outer rim domains are present (e.g., Figure 8b; Mnz9, sample ST2A). Most monazite along the main foliation or included in syn-kinematic minerals generally present either all the compositional domains described above or a homogeneous high-Y and high-Ca composition (chemically corresponding to the inner rim domain).
The 206Pb/238U and 207Pb/235U isotopic ratios resulted as mainly discordant up to 10% (Figure 9a,b), whereas the discordance between 206Pb/238U and 208Pb/232Th data was generally better (<6%). The 206Pb/238U ages range from 334 ± 5 Ma to 295 ± 6 Ma, whereas the 208Pb/232Th ages range from 334 ± 6 Ma to 297 ± 5 Ma. These ages were taken from the ST2A and 26-16-15 samples, whereas the sample ST2B records a smaller age range between 332 ± 5 and 322 ± 5 Ma (206Pb/238U ages) and 332 ± 4 to 317 ± 4 Ma (208Pb/232Th). Taking into account the microstructural position of the grains and the chemical composition of the dated domains, we distinguished two main 206Pb/238U and 208Pb/232Th data clusters from ~325–315 Ma and at ~330 Ma. The most common age cluster mainly comprises high-Y rims/domains along the S2 mylonitic foliation and within staurolite rims (syn-S2) from ST2A and 26-16-15 samples. The oldest 206Pb/238U and 208Pb/232Th data cluster is generally defined by monazite included both in the staurolite crystals (parallel to the S1) and within the matrix. The youngest ages (~310–300 Ma), were mainly found in discontinuous low and very low-Y outer rims, generally observed in grains where a retrograde allanite ± apatite formation is documented (several grains in the matrix and few in staurolite, where monazites are not completely shielded due to late fractures).

7. Discussion

7.1. Geometry and Strain Partitioning of the PASZ

Fieldwork and microstructural analysis allowed us to recognize four deformation phases in the study area. The only evidence of D1 structures was the S1 relict foliation both in the hinge of F2 folds or as an internal foliation in the Barrovian index minerals. A progressive increase in metamorphic grade, as suggested by the progressive occurrence of Barrovian metamorphism (Figure 4), can be recognized from SW to NE in the studied sector, in agreement with Carmignani et al. (1994) [36] and Franceschelli et al. (1989) [51]. Barrovian index minerals mainly grew between the collisional (D1) [17,92,93] and the transpressional D2 event. However, we recognized that part of the staurolite growth is syn-kinematic with the D2 shearing (Figure 4). The syn-kinematic mineral assemblage (sillimanite + biotite, biotite + white mica) parallel to the S2 mylonitic foliation, is indicative of amphibolite-facies. This metamorphic condition is also in agreement with the occurrence of grain boundary migration as the main dynamic recrystallization mechanism of quartz, indicative of temperatures ≥500 °C ([61]; Figure 4) and of feldspars [64]. The syn-kinematic chlorite in the hinges of F3 folds, grown at the expense of biotite, testifies a decreasing temperature during deformation. Furthermore, local incipient subgrain rotation recrystallization, overprinting GBM in quartz, has been recognized, supporting a decrease in the temperature down to the greenschist-facies condition, as also noted by Graziani et al. (2020) [56]. The PASZ developed under conditions of decreasing temperature, starting from the amphibolite-facies (D2) down to greenschist-facies conditions (D3).
The principal structures of the study area are controlled by the D2 progressive deformation phase, linked to the PASZ activity, in which the strain is partitioned into F2 tight and isoclinal folds (low-strain zone) and shear zone domains (high-strain zone). We highlight the development of shearing domains that gradually increase in number and dimension moving toward the PASZ. In the same direction, D2 folds become smaller and less frequent, while the mylonitic foliation becomes gradually more penetrative and continuous (strain partitioning, [94]; Figure 10).
The presence of a sub-vertical S2 foliation, parallel to the boundaries of the shear zone, and F2 fold axes, parallel to the sub-horizontal L2 object lineation, led us to assume the simultaneous development of D2 shear and F2 fold domains. Kinematic indicators, both at the meso and microscale, point to a top-to-the-NW sense of shear, in agreement with Carosi and Palmeri (2002) [17]. The geometry and kinematics of the PASZ are compatible with a transpressive regime, as a consequence of dextral shear deformation with a shortening component perpendicular to the shear zone boundaries [8]. F2 and F3 fold axes parallelism suggests that the transpressive regime was active until the end of the D3 deformation phase. Subsequent post-collision and post-transpression gravitational instability was characterized by the development of open folds (F4) and low-angle brittle-ductile shear zones.

7.2. Kinematics of the PASZ

The kinematic of the flow allowed us to characterize the deformation, in terms of the percentage of pure and simple shear components of the D2 phase, linked to the PASZ activity. Two independent methods were used. The mean kinematic vorticity number ranges from 0.27 to 0.74 (stable porphyroclasts method) and between 0.40 and 0.74 (C’ shear bands method). Taking into account uncertainties in the estimates of the vorticity number, the two methods return consistent results (Figure 4). Despite the analyzed lithotypes along the studied transects being different, i.e., gneiss and micaschist, and thus have different rheology and possibly strain memory, a progressive northward increase in the amount of simple shear component (from ~ 27% up to ~ 52%) approaching both the high-strain zone and the HGMC was observed and highlighted by both the vorticity gauges. Finite strain data suggest a general flattening, in agreement with pure shear-dominated transpression [75,76,81]. Kinematic vorticity and finite strain analysis confirm that the deformation along the PASZ occurred under a general shear condition with a major component of pure shear acting together with simple shear in a transpressive regime.
The transition from pure to simple shear dominated transpression, approaching the high-strain zone, is in agreement with the transpressional theoretical model proposed by Fossen and Tikoff (1993; [75]) and by Fossen et al. (1994; [76]). Fossen and Tikoff (1998) [79] defined a spectrum of transpressive and transtensive deformations which have in common a simple shear component and a perpendicular shortening component. In all the models of transpression [79] (types A–E) with any wrench component, there is an angular difference between the plate motion (oblique flow apophysis) and the fastest horizontal shortening direction. In type A, the strain ellipsoid has a prolate geometry, while in type B no extension or shortening along the strike of the zone was involved. Evidence of exhumation or the tectonic uplift of rocks within transpressive zones results from type C–E transpression. Despite the complex evolution, a series of observations collocate the PASZ in the type C shear zones: (i) a vertical foliation parallel to the shear zone boundary; (ii) a sub-horizontal lineation; (iii) a general flattening strain regime where the stretching along the X axis parallel to the extensional lineation matches or is greater than the vertical exhumation; (iv) the progressive increase in simple shear approaching the PASZ; (v) the convergence angle is not constant, varying from about 50 to 60°. However, heterogeneous and non-steady-state transpressive deformation and strain partitioning observed along the PASZ led us to support also a change from type B (pure shear dominated transpression) to type C (simple shear dominated transpression). This is supported by the strain partitioning observed in the field, by the progressive increase in the Wk value and by a change in the convergence angle.

7.3. Monazite Chemistry and Dating: Timing of Deformation in the PASZ

Chemical analyses and X-ray maps of monazite revealed that significant chemical differences are present among the samples and within each grain. Sample chemical variations can be related to the bulk chemistry, whereas single grain zoning depends on mineral assemblages and/or modal abundances. According to the X-ray map, monazite shows apparent zoning that is consistent within each sample. Monazite in ST2A is characterized by a higher absolute concentration of Ca, U, and Pb, whereas monazite in sample ST2B showed higher Y average concentrations. To explain the composition of monazite from ST2A richer in Ca, U and Pb, we suggest a possible bulk control or the lack or low modal abundance in the sample of Ca-, U-, and Pb-bearing mineral phases (e.g., apatite). It is noteworthy that sample ST2B is also characterized by a lower modal abundance of garnet, which is also localized in some layers, with respect to ST2A and 26-16-15 samples. This implies a reduced reactivity of monazite at the thin-section/microdomain scale during garnet-involving reactions. The absolute higher Y concentrations observed in the ST2B could be related to the lower modal abundance of garnet with respect to the other samples. The low reactivity of monazite in this sample is also documented by the lack of retrograde replacement features (i.e., allanite ± apatite aggregates).
Microstructural position, texture, zoning and chemical analysis (Figure 11a,b), integrated with the P–T path obtained by Franceschelli et al. (1989) [51] and Carosi and Palmeri (2002) [17] (Figure 11), highlight a complex history of monazite growth during the tectono-metamorphic history. The rare oldest ages (around c. 330 Ma) were detected both along the S1 foliation in staurolite and in the low-Y inner core and medium-high-Y outer core of the matrix grains (Figure 11a,b). According to the evolution of a garnet-monazite system [95], low-Y (and high- to medium-Th) inner core indicates that monazite grows coevally or just after the garnet growth [96,97]. Medium-high-Y (with a medium-low-Th) outer core can be explained by a progressive garnet breakdown [95] during staurolite growth, both together and subsequently with respect to the garnet. We did not detect any significant difference, within the resolution of the method, in the absolute ages of the two cores domains. The Barrovian index minerals grew during prograde metamorphic conditions under a near-peak amphibolite-facies condition (Figure 11c) [51]. The timing of these monazites domains, recording the D1 phase history, are in agreement with the timing of the prograde metamorphism in Northern Sardinia (~350 Ma, [55]; ~330–340 Ma, [28]; ~350–320 Ma, [98]; ~350–320 Ma [9]). The most common ages (~325–315 Ma) have been detected in high-Y and low-Th inner rims. This supported the growth of monazites during retro-metamorphism and garnet breakdown. Monazite grows as tiny rims around the previous domains, or as a new grain along the main S2 foliation with a homogeneous high-Y composition. High-Y monazites are also present in parallel to the S2 in the rim of syn-kinematic D2 phase staurolite crystals (Figure 11a,b). The presence of syn-kinematic biotite, white mica and staurolite, with the presence of GBM quartz microstructures, indicate temperatures of amphibolite-facies condition. The prograde metamorphism is associated with the collisional stage while the retro-metamorphism is related to the transpressional deformation linked to the PASZ activity (D2). In several monazite grains, along the mylonitic foliation or within staurolite crystals, but not completely shielded, we noted the presence of discontinuous outer rims with a low to very low-Y concentration with the youngest ages (~310–300 Ma; Figure 11a,b). These youngest domains document the latest stages of monazite re-crystallization slightly before (or even during) the progressive destabilization and monazite replacement by allanite [85,97] during the upper greenschist facies evolution of the transpressional deformation (D3; ~450–500 °C; Figure 11c). The subsequent cooling is also confirmed by the local occurrence of syn-kinematic chlorite and the overprinting of SRR on GBM (Figure 11a,c) [65]. All the collected data, coupled with previous P–T estimates, constrain the activity of the PASZ starting from ~325 up to ~300 Ma (Figure 11c), indicating a decrease in temperature and pressure from amphibolite-facies conditions down to the greenschist-facies condition in the time span of ~25 Ma. The upper limit of the deformation age is also constrained by the emplacement at ~300–280 Ma (U–Pb zircon dating) [99] of post-transpressional granitoids. The ages of transpression obtained in this work are in good agreement with the data collected in other areas of the PASZ (~320–300 Ma; [9,28]). Previous data of Carosi et al. (2012) [9] lack the chemical characterization of used monazite grains, because no X-ray compositional maps were produced. This makes it more difficult to link the obtained ages with the tectono-metamorphic evolution of sheared rocks. Our new data allow to better constrain the complete evolution (P–T–D–t path) of this sector of the Sardinian Variscan Basement by precisely linking age, metamorphic conditions and deformation.

7.4. PASZ in the Framework of Late Variscan Shearing

In the late Variscan framework, similar ages of transpressive tectonic were collected in the Maures–Tanneron Massif [35,100] and in the External Crystalline Massif [18,101] by applying the same methodologies. This reinforces the correlation of the different sectors of the Southern European Variscan Belt along a regional-scale shear zone, known as East Variscan Shear Zone (EVSZ; [9,34]). It is important to highlight that the EVSZ is not a unique shear zone, but it is a network of shear zones made by several branches with comparable tectono-metamorphic evolution [101], affecting the Variscan Belt during the late Carboniferous age (Figure 1a). Our new data enhance the potential correlations of the PASZ with other shear zones in the European Variscan Belt [34]. Texturally-controlled geochronological data indicate the similar ages of the transpression onset (~320 Ma) detected in different sectors of the Southern European Variscan Belt [9,18,35,100,101]. In several studied shear zones, a general flow regime was observed with the coexistence of simple and pure shear [9,18,100,101]. Moreover, the increase in the simple shear component recognized along the PASZ confirms the progressive change of orientation of the belt with respect to the regional stress field.

8. Conclusions

Our study, based on a multidisciplinary approach, highlights the following points:
  • New meso- and microstructural data, combined with the kinematics of the flow and finite strain analysis, point to an increase of the simple shear component approaching the high-strain sector of the PASZ. The principal structures of the D2 phase are controlled by a deformation in which the strain is partitioned into folds and shear zone domains.
  • The transpressive activity and non-coaxial flow, coupled with an oblate finite strain ellipsoid and a variable convergence angle, suggests that the PASZ evolved from a type B (pure shear-dominated transpression) to a type C (simple shear-dominated transpression) shear zone models (Fossen and Tikoff, 1998 [79]).
  • Texturally-controlled U–(Th)–Pb geochronology on monazite reveals that the onset and the progressive evolution of the PASZ lasted from ~325 up to ~300 Ma, in a time span of ~25 Ma, and culminated with copious granitoid magmatism at ~300 Ma. The PASZ evolved from the amphibolite-facies condition down to the greenschist-facies condition. The collisional stage, and prograde metamorphism, before the transpressive deformation, occurred at ~330 Ma.
  • The PASZ shows striking structural, kinematics and chronological similarities with nearly vertical dextral ductile shear zones occurring in other fragments of the Variscan basements in Southern Europe, such as in the Maures–Tanneron Massif, Corsica and the Western Alps [9,18,35,100,101,102].

9. Computer Code and Software

Structural data were projected with the software StereoNet©. The sketch-map and all figures were drawn using Adobe Illustrator® CC 2018. The kinematic vorticity analysis with the stable porphyroclasts method and the finite strain analysis were performed using the software EllipseFit 3.2 by Vollmer (2015) [74]. Calculation of the convergence angle was performed using the software Strain Calculator 3.2 [103]. Geochronological data were treated with Isoplot 3.70 [90].

Supplementary Materials

The following are available online at https://www.mdpi.com/2076-3263/10/8/288/s1, Figure S1–Figure S3: Polar histograms used for estimating the kinematic vorticity of transect A and B. ν = angle between the C’ planes and the shear zone boundary; A1= flow apophysis 1; A2 = flow apophysis 2; n = total number of data; Wk = kinematic vorticity number. The dashed line represents the bisector of the angle between A1 and A2 apophyses. Figure S4: Mulchrone test [71,72] on the samples selected for the stable porphyroclast method. Curves represent the expected distribution of porphyroclasts at different Wk values if the distribution of porphyroclasts does not fit these curves, revealing that no significant slip between the porphyroclasts and matrix occurred. Figure S5: Diagrams showing the porphyroclasts distribution and the related mean vorticity number Wm. RCmin = minimum critical axial ration; RCmax = maximum critical axial ratio; Wmmin = vorticity number calculated with RCmin; Wmmax = vorticity number calculated with RCmax. Figure S6: Finite strain diagrams based on the centre-to-centre method of Fry (1979) [75]. Figure S7: Principal Component Analyses (PCA) of three analyzed samples (ST2A, ST2B and 26-16-15). Table S1: Chemical analysis of the monazite selected for geochronology. Structural formula calculated on the basis of 4 oxygens. Table S2: Standards analyzed for the geochronological study. Table S3: Isotopic results and geochronological data from the monazites of selected samples (ST2A, ST2B and 26-16-15).

Author Contributions

Conceptualization, R.C. and C.M.; methodology, A.L., C.M., A.P. and M.S.; software, A.L., A.P. and M.S.; validation, R.C., S.I. and C.M.; formal analysis, C.M. and S.I.; field investigation, R.C., C.M. and A.P.; resources, C.M.; data curation, C.M., A.P. and S.I.; writing—original draft preparation, R.C., S.I. and A.P.; writing—review and editing, R.C., C.M., S.I., A.P.; visualization, A.P. and M.S.; supervision, R.C., C.M.; project administration, R.C., C.M. and S.I.; funding acquisition, R.C., C.M. and S.I. All authors have read and agreed to the published version of the manuscript.

Funding

This research was funded by PRIN 2015 (University of Torino: R. Carosi and C. Montomoli); funds Ricerca Locale University of Torino (2018, and 2019 ex-60%, R. Carosi and S. Iaccarino); PRA 20018_41 to C. Montomoli.

Acknowledgments

The three anonymous reviewers are thanked for their constructive and thorough reviews, that significantly improved the manuscript. We also thank the Valerie Wang for her very efficient work.

Conflicts of Interest

The authors declare no conflict of interest.

References

  1. Ramsay, J.G.; Graham, R.H. Strain variation in shear belts. Can. J. Earth Sci. 1970, 7, 786–813. [Google Scholar] [CrossRef]
  2. Ramsay, J.G. Shear zone geometry: A review. J. Struct. Geol. 1980, 2, 83–99. [Google Scholar] [CrossRef]
  3. Passchier, C.W.; Ten Brink, C.E.; Bons, P.D.; Sokoutis, D. δ objects as a gauge for stress sensitivity of strain rate in mylonites. Earth Planet. Sci. Lett. 1993, 120, 239–245. [Google Scholar] [CrossRef]
  4. Fossen, H.; Cavalcante, G.C.G. Shear zones—A review. Earth Sci. Rev. 2017. [Google Scholar] [CrossRef]
  5. Goscombe, B.D.; Hand, M.; Gray, D.; Mawby, J. The metamorphic architecture of a transpressional orogen: The Kaoko belt, Namibia. J. Petrol. 2003, 44, 679–711. [Google Scholar] [CrossRef] [Green Version]
  6. Goscombe, B.D.; Gray, D.; Armstrong, R.; Foster, D.A.; Vogl, J. Event geochronology of the pan-African Kaoko belt, Namibia. Precambrian Res. 2005, 140, 103.e1–103.e41. [Google Scholar] [CrossRef]
  7. Law, R.D.; Searle, M.P.; Simpson, R.L. Strain, deformation temperatures and vorticity of flow at the top of the Greater Himalayan Slab, Everest Massif, Tibet. J. Geol. Soc. 2004, 161, 305–320. [Google Scholar] [CrossRef]
  8. Iacopini, D.; Carosi, R.; Montomoli, C.; Passchier, C.W. Strain analysis and vorticity of flow in the northern sardinian variscan belt: Recognition of a partitioned oblique deformation event. Tectonophysics 2008, 446, 77–96. [Google Scholar] [CrossRef]
  9. Carosi, R.; Montomoli, C.; Tiepolo, M.; Frassi, C. Geochronological constraints on post-collisional shear zones in the Variscides of Sardinia (Italy). Terra Nov. 2012, 24, 42–51. [Google Scholar] [CrossRef]
  10. Carosi, R.; Lombardo, B.; Molli, G.; Musumeci, G.; Pertusati, P.C. The South Tibetan detachment system in the Rongbuk valley, Everest region. Deformation features and geological implications. J. Asian Earth Sci. 1998, 16, 299–311. [Google Scholar] [CrossRef]
  11. Carosi, R.; Montomoli, C.; Rubatto, D.; Visonà, D. Normal-sense shear zones in the core of the Higher Himalayan crystallines (Bhutan Himalayas): Evidence for extrusion? Geol. Soc. Spec. Publ. 2006, 268, 425–444. [Google Scholar] [CrossRef]
  12. Passchier, C.W. Stable positions of rigid objects in non-coaxial flow—A study in vorticity analysis. J. Struct. Geol. 1987, 9, 679–690. [Google Scholar] [CrossRef]
  13. Passchier, C.W. Geometric constraints on the development of shear bands in rocks. Neth. J. Geosci. 1991, 70, 203–211. [Google Scholar]
  14. Iacopini, D.; Carosi, R.; Xypolias, P. Implications of complex eigenvalues in homogeneous flow: A three-dimensional kinematic analysis. J. Struct. Geol. 2010, 32, 93–106. [Google Scholar] [CrossRef]
  15. Iacopini, D.; Frassi, C.; Carosi, R.; Montomoli, C. Biases in the three-dimensional vorticity analysis using porphyroclast system: Limits and application to natural examples. Geol. Soc. Spec. Publ. 2011, 360, 301–318. [Google Scholar] [CrossRef]
  16. Grasemann, B.; Fritz, H.; Vannay, J.C. Quantitative kinematic flow analysis from the Main Central Thrust Zone (Nw-Himalaya, India): Implications for a decelerating strain path and the extrusion of orogenic wedges. J. Struct. Geol. 1999, 21, 837–853. [Google Scholar] [CrossRef]
  17. Carosi, R.; Palmeri, R. Orogen-parallel tectonic transport in the variscan belt of northeastern Sardinia (Italy): Implications for the exhumation of medium-pressure metamorphic rocks. Geol. Mag. 2002, 139, 497–511. [Google Scholar] [CrossRef]
  18. Simonetti, M.; Carosi, R.; Montomoli, C.; Langone, A.; D’addario, E.; Mammoliti, E. Kinematic and geochronological constraints on shear deformation in the Ferriere-Mollières shear zone (Argentera-Mercantour Massif, Western Alps): Implications for the evolution of the Southern European Variscan Belt. Int. J. Earth Sci. 2018, 107, 2163–2189. [Google Scholar] [CrossRef]
  19. Xypolias, P. Vorticity analysis in shear zones: A review of methods and applications. J. Struct. Geol. 2010, 32, 2072–2092. [Google Scholar] [CrossRef]
  20. Lin, S.; Jiang, D.; Williams, P.F. Discussion on transpression and transtension zones. J. Geol. Soc. 1999, 156, 1045–1048. [Google Scholar]
  21. Hunter, J.R.; Weinberg, R.F.; Wilson, C.J.L.; Luzin, V.; Misra, S. Quartz deformation across interlayered monomineralic and polymineralic rocks: A comparative analysis. J. Struct. Geol. 2019, 119, 118–134. [Google Scholar] [CrossRef]
  22. Kurz, G.A.; Northrup, C.J. Structural analysis of mylonitic fault rocks in the Cougar Creek Complex, Oregon-Idaho using the porphyroclast hyperbolic distribution method, and potential use of sc’-type extensional shear bands as quantitative vorticity indicators. J. Struct. Geol. 2008, 30, 1005–1012. [Google Scholar] [CrossRef]
  23. Carosi, R.; Frassi, C.; Montomoli, C. Deformation during exhumation of medium- and high-grade metamorphic rocks in the Variscan chain in northern Sardinia (Italy). Geol. J. 2009, 44, 280–305. [Google Scholar] [CrossRef]
  24. Festa, V. The amount of pure shear and thinning in the Hercynian continental lower crust exposed in the Serre Massif (Calabria, southern Italy): An application of the vorticity analysis to quartz c-axis fabrics. Ital. J. Geosci. 2014, 133, 214–222. [Google Scholar] [CrossRef]
  25. Montomoli, C.; Iaccarino, S.; Carosi, R.; Langone, A.; Visonà, D. Tectonometamorphic discontinuities within the Greater Himalayan Sequence in Western Nepal (Central Himalaya): Insights on the exhumation of crystalline rocks. Tectonophysics 2013, 608, 1349–1370. [Google Scholar] [CrossRef]
  26. Fazio, E.; Punturo, R.; Cirrincione, R.; Kern, H.; Pezzino, A.; Wenk, H.R.; Goswami, S.; Mamtani, M.A. Quartz preferred orientation in naturally deformed mylonitic rocks (Montalto shear zone-Italy): A comparison of results by different techniques, their advantages and limitations. Int. J. Earth Sci. 2017, 106, 2259–2278. [Google Scholar] [CrossRef]
  27. Carosi, R.; Oggiano, G. Transpressional deformation in northwestern Sardinia (Italy): Insights on the tectonic evolution of the Variscan belt. C. R. Geosci. 2002, 334, 287–294. [Google Scholar] [CrossRef]
  28. Di Vincenzo, G.; Carosi, R.; Palmeri, R. The relationship between tectono-metamorphic evolution and argon isotope records in white mica: Constraints from in situ 40Ar-39Ar laser analysis of the Variscan basement of Sardinia. J. Petrol. 2004, 45, 1013–1043. [Google Scholar] [CrossRef]
  29. Carosi, R.; Frassi, C.; Iacopini, D.; Montomoli, C. Post-collisional transpressive tectonic in northern Sardinia (Italy). J. Virtual Explor. 2005, 19, 1441–8142. [Google Scholar] [CrossRef]
  30. Matte, P. Tectonics and plate tectonics model for the Variscan belt of Europe. Tectonophysics 1986, 126, 329–374. [Google Scholar] [CrossRef]
  31. Franke, W. Tectonostratigraphic units in the Variscan belt of central Europe. Geol. Soc. Am. 1989, 30, 67–90. [Google Scholar]
  32. Dias, R.; Ribeiro, A. The Ibero-Armorican Arc. A collision effect against an irregular continent? Tectonophysics 1995, 246, 113–128. [Google Scholar] [CrossRef]
  33. Fernández-Lozano, J.; Pastor-Galán, D.; Gutiérrez-Alonso, G.; Franco, P. New kinematic constraints on the Cantabrian orocline: A paleomagnetic study from the Peñalba and Truchas synclines, NW Spain. Tectonophysics 2016, 681, 195–208. [Google Scholar] [CrossRef]
  34. Matte, P. The Variscan collage and orogeny (480–290 ma) and the tectonic definition of the Armorica microplate: A review. Terra Nov. 2001, 13, 117–121. [Google Scholar] [CrossRef]
  35. Corsini, M.; Rolland, Y. Late evolution of the southern European Variscan Belt: Exhumation of the lower crust in a context of oblique convergence. C. R. Geosci. 2009, 341, 214–223. [Google Scholar] [CrossRef]
  36. Carmignani, L.; Carosi, R.; Di Pisa, A.; Gattiglio, M.; Musumeci, G.; Oggiano, G.; Pertusati, P.C. The Hercynian Chain in Sardinia (Italy). Geodin. Acta 1994, 7, 31–47. [Google Scholar] [CrossRef]
  37. Montomoli, C. Zone di taglio fragili-duttili nel basamento varisico metamorfico di basso grado della Nurra meridionale (Sardegna nord-occidentale). Atti della Soc. Toscana di Sci. Nat. Mem Ser. A 2003, 108, 23–29. [Google Scholar]
  38. Montomoli, C.; Iaccarino, S.; Simonetti, M.; Lezzerini, M.; Carosi, R. Structural setting, kinematics and metamorphism in a km-scale shear zone in the inner nappes of Sardinia (Italy). Ital. J. Geosci. 2018, 137, 294–310. [Google Scholar] [CrossRef]
  39. Franceschelli, M.; Memmi, I.; Ricci, C.A. Ca distribution between garnet and plagioclase in pelitic and psammitic schists from the metamorphic basement of north eastern Sardinia. Contrib. Miner. Petr. 1982, 80, 285–295. [Google Scholar] [CrossRef]
  40. Carmignani, L.; Oggiano, G.; Barca, S.; Cont, I.P.; Salvadori, I.; Eltrudis, A.; Funedda, A.; Pasci, S. Geologia della Sardegna; Note Illustrative della Carta Geologica della Sardegna in scala 1:200.000. Mem. Descr. Carta Geol. d’Italiana 2001, 60, 283. [Google Scholar]
  41. Musumeci, G. Displacement calculation in a ductile shear zone: Monte Grighini shear zone (Central-Western Sardinia). Bull. Soc. Geol. Italiana 1991, 110, 771–777. [Google Scholar]
  42. Ferrara, G.; Ricci, C.A.; Rita, F. Isotopic ages and tectonometamorphic history of the metamorphic basement of north-eastern Sardinia. Contrib. Miner. Petr. 1978, 68, 99–106. [Google Scholar] [CrossRef]
  43. Helbing, H.; Tiepolo, M. Age determination of Ordovician magmatism in Ne Sardinia and its bearing on Variscan basement evolution. J. Geol. Soc. 2005, 162, 689–700. [Google Scholar] [CrossRef]
  44. Massonne, H.J.; Cruciani, G.; Franceschelli, M. Geothermobarometry on anatectic melts- a high-pressure Variscan migmatite from NE Sardinia. Int. Geol. Rev. 2013, 55, 1490–1505. [Google Scholar] [CrossRef]
  45. Franceschelli, M.; Carcangiu, G.; Caredda, A.M.; Cruciani, G.; Memmi, I.; Zucca, M. Transformation of cumulate mafic rocks to granulite and re-equilibration in amphibolite and greenschist facies in NE Sardinia, Italy. Lithos 2007, 63, 1–18. [Google Scholar] [CrossRef]
  46. Ghezzo, C.; Memmi, I.; Ricci, C.A. Un evento granulitico nella Sardegna nord-orientale. Mem. della Soc. Geol. Italiana 1979, 20, 23–38. [Google Scholar]
  47. Elter, F.M.; Musumeci, G.; Pertusati, P.C. Late Hercynian shear zones in Sardinia. Tectonophysics 1990, 176, 387–404. [Google Scholar] [CrossRef]
  48. Barca, S.; Corradini, C.; Ferretti, A.; Olivieri, R.; Serpagli, E. Conodont biostratigraphy of the “Ockerkalk” (Silurian) from southeastern Sardinia. Riv. Ital. Paleontol. Sardinia 1995, 100, 459–476. [Google Scholar]
  49. Cruciani, G.; Franceschelli, M.; Massonne, H.-J.; Carosi, R.; Montomoli, C. Pressure–temperature and deformational evolution of high-pressure metapelites from Variscan Ne Sardinia, Italy. Lithos 2013, 175–176, 272–284. [Google Scholar] [CrossRef]
  50. Ricci, C.A.; Carosi, R.; Di Vincenzo, G.; Franceschelli, M.; Palmeri, R. Unravelling the tectono-metamorphic evolution of medium-pressure rocks from collision to exhumation of the Variscan basement of NE Sardinia: A review. Period Miner. 2004, 73, 73–83. [Google Scholar]
  51. Franceschelli, M.; Memmi, I.; Pannuti, F.; Ricci, C.A. Diachronous metamorphic equilibria in the Hercynian basement of northern Sardinia, Italy. Geol. Soc. Spec. Publ. 1989, 43, 371–375. [Google Scholar] [CrossRef]
  52. Ricci, C.A. From crustal thickening to exhumation: Petrological, structural and geochronological records. IGCP 1992, 276, 187–197. [Google Scholar]
  53. England, P.C.; Thompson, A.B. Pressure–temperature–time paths of regional metamorphism. I. Heat transfer during the evolution of regions of thickened continental crust. J. Petrol. 1984, 25, 894–928. [Google Scholar] [CrossRef]
  54. Del Moro, A.; Di Pisa, A.; Oggiano, G.; Villa, I.M. Isotopic ages of two contrasting tectonomorphic episodes in the Variscan Chain in N Sardinia. In Geologia Del Basamento Italiano; Lazzarotto, A., Morten, L., Ricci, C.A., Sassi, F.P., Vai, G.B., Eds.; A congress dedicated to Tommaso Cocozza, Dipartimento di Scienze della Terra & Centro Offset: Siena, Italy, 1991; pp. 33–35. [Google Scholar]
  55. Frassi, C.; Carosi, R.; Montomoli, C.; Law, R.D. Kinematics and vorticity of flow associated with post-collisional oblique transpression in the Variscan Axial Zone of northern Sardinia (Italy). J. Struct. Geol. 2009, 31, 1458–1471. [Google Scholar] [CrossRef]
  56. Graziani, R.; Montomoli, C.; Iaccarino, S.; Menegon, L.; Nania, L.; Carosi, R. Structural setting of a transpressive shear zone: Insights from geological mapping, quartz petrofabric and kinematic vorticity analysis in NE Sardinia (Italy). Geol. Mag. 2020, 1–19. [Google Scholar] [CrossRef]
  57. Del Moro, A.; Di Simplicio, P.; Ghezzo, C.; Guasparri, G.; Rita, F.; Sabatini, G. Radiometric data and intrusive sequence in the Sardinian batholith. Neues Jahrb. für Mineral. Abh. 1975, 126, 28–44. [Google Scholar]
  58. Elter, F.M.; Franceschelli, M.; Ghezzo, C.; Memmi, I.; Ricci, C.A. The Geology of Northern Sardinia. In Guide-Book to the Excursion on the Paleozoic Basement of Sardinia; IGCP no. 5, Newsletter, Special Issue; Carmignani, L., Cocozza, T., Ghezzo, C., Pertusati, P.C., Ricci, C.A., Eds.; Tipogragia Pacini: Pisa, Italy, 1986; pp. 87–102. [Google Scholar]
  59. Ramsay, J.G. Folding and Fracturing of Rocks; Mcgraw-Hill: New York, NY, USA, 1967; pp. 1–568. [Google Scholar]
  60. Hudleston, P. Fold morphology and some geometrical implications of theories of fold development. Tectonophysics 1973, 16, 1–46. [Google Scholar] [CrossRef]
  61. Piazolo, S.; Passchier, C.W. Control on lineation development in low to medium grade shear zones: A study from the Cap de Creus Penisula, Ne Spain. J. Struct. Geol. 2002, 24, 25–44. [Google Scholar] [CrossRef]
  62. Whitney, D.; Evans, B. Abbreviations for names of rock-forming minerals. Am. Min. 2010, 95, 185–187. [Google Scholar] [CrossRef]
  63. Stipp, M.; Stünitz, H.; Heilbron, M.; Schmid, D.W. The eastern tonale fault zone: A natural laboratory for crystal plastic deformation of quartz over a temperature range from 250 to 700 °C. J. Struct. Geol. 2002, 24, 1861–1884. [Google Scholar] [CrossRef]
  64. Passchier, C.W.; Trouw, R.A.J. Microtectonics, 2nd ed.; Springer: Berlin/Heidelberg, Germany, 2005; pp. 1–366. [Google Scholar] [CrossRef]
  65. White, S.H. The role of dislocation process during tectonic deformation with special reference to quartz. In The Physics and Chemistry of Mineral and Rocks; Strens, R.G.J., Ed.; John Wiley & Sons: London, UK, 1976; pp. 75–91. [Google Scholar]
  66. Wallis, S.R.; Platt, J.P.; Knott, S.D. Recognition of synconvergence extension in accretionary wedges with examples from the Caiabrian Arc and the Eastern Alps. Am. J. Sci. 1993, 293, 463–495. [Google Scholar] [CrossRef]
  67. Bobyarchick, A.R. The eigenvalues of steady flow in Mohr space. Tectonophysics 1986, 122, 35–51. [Google Scholar] [CrossRef]
  68. Passchier, C.W. Analysis of deformation paths in shear zones. Geol. Rundsh. 1988, 77, 309–318. [Google Scholar] [CrossRef]
  69. Platt, J.P.; Vissers, R.L.M. Extensional structures in anisotropic rocks. J. Struct. Geol. 1980, 2, 397–410. [Google Scholar] [CrossRef]
  70. Simpson, C.; De Paor, D.G. Strain and kinematic analysis in general shear zones. J. Struct. Geol. 1993, 15, 1–20. [Google Scholar] [CrossRef]
  71. Jeffery, G.B. The motion of ellipsoidal particles immersed in a viscous fluid. Proc. R. Soc. A-Math. Phys. 1922, 102, 161–179. [Google Scholar] [CrossRef] [Green Version]
  72. Mulchrone, K. An analytical solution in 2D for the motion of rigid elliptical particles with a slipping interface under a general deformation. J. Struct. Geol. 2007, 29, 950–960. [Google Scholar] [CrossRef]
  73. Mulchrone, K. Shape fabrics in populations of rigid object in 2D: Estimating finite strain and vorticity. J. Struct. Geol. 2007, 29, 1558–1570. [Google Scholar] [CrossRef]
  74. Vollmer, F.W. Ellipsefit 3 User Manual; 2015; p. 72. Available online: https://www.frederickvollmer.com/ellipsefit/ (accessed on 10 July 2020).
  75. Fossen, H.; Tikoff, B. The deformation matrix for simultaneous simple shearing, pure shearing and volume change, and its application to transpression-transtension tectonics. J. Struct. Geol. 1993, 15, 413–422. [Google Scholar] [CrossRef]
  76. Fossen, H.; Tikoff, B.; Teyssier, C. Strain modeling of transpressional and transtensional deformation. Norsk Geologisk Tidsskrift 1994, 74, 134–145. [Google Scholar]
  77. Fry, N. Random point distribution and strain measurement in rocks. Tectonophysics 1979, 60, 89–105. [Google Scholar] [CrossRef]
  78. Ramsay, J.G.; Huber, M.I. The Techniques of Modern Structural Geology. Volume 1: Strain Analysis; Academic Press: London, UK, 1983; p. 307. [Google Scholar] [CrossRef]
  79. Fossen, H.; Tikoff, B. Extended models of transpression and transtension, and applications to tectonic settings. Geol. Soc. Spec. Publ. 1998, 135, 15–33. [Google Scholar] [CrossRef]
  80. Law, R.D. Moine Thrust zone mylonites at the Stack of Glencoul: II—Results of vorticity analyses and their tectonic significance. Geol. Soc. Spec. Publ. 2010, 335, 579–602. [Google Scholar] [CrossRef]
  81. Fossen, H. Structural Geology; Cambridge University Press: Cambridge, UK, 2010; p. 463. [Google Scholar]
  82. Vannay, J.C.; Grasemann, B. Himalayan inverted metamorphism and syn-convergence extension as a consequence of a general shear extrusion. Geol. Mag. 2001, 138, 253–276. [Google Scholar] [CrossRef]
  83. Thigpen, J.R.; Law, R.D.; Lloyd, G.E.; Brown, S.J.; Cook, B. Deformation temperatures, vorticity of flow and strain symmetry in the Loch Eriboll mylonites, NW Scotland: Implications for kinematic and structural evolution of the northernmost Moine thrust zone. Geol. Soc. Spec. Publ. 2010, 335, 623–662. [Google Scholar] [CrossRef]
  84. Bosse, V.; Villa, I. Petrochronology, hygrochronology of tectono-metamorphic events. Gondwana Res. 2019, 71, 76–90. [Google Scholar] [CrossRef] [Green Version]
  85. Williams, M.L.; Jercinovic, M.J.; Hetherington, C.J. Microprobe monazite geochronology: Understanding geologic processes by integrating composition and chronology. Annu. Rev. Earth Planet. Sci. 2007, 35, 137–175. [Google Scholar] [CrossRef] [Green Version]
  86. Tiepolo, M. In situ Pb geochronology of zircon with laser ablation-inductively coupled plasma-sector field mass spectrometry. Chem. Geol. 2003, 199, 159–177. [Google Scholar] [CrossRef]
  87. Paquette, J.L.; Tiepolo, M. High resolution (5 µm) U–Th–Pb isotope dating of monazite with excimer laser ablation (ELA)-ICPMS. Chem. Geol. 2007, 240, 222–237. [Google Scholar] [CrossRef]
  88. Seydoux-Guillaume, A.M.; Paquette, J.L.; Wiedenbeck, M.; Montel, J.M.; Heinrich, W. Experimental resetting of the U-Th-Pb systems in monazite. Chem. Geol. 2002, 191, 165–181. [Google Scholar] [CrossRef]
  89. Seydoux-Guillaume, A.M.; Wirth, R.; Nasdala, L.; Gottschalk, M.; Montel, J.M.; Heinrich, W. An XRD, TEM and Raman study of experimentally annealed natural monazite. Phys. Chem. Miner. 2002, 29, 240–253. [Google Scholar] [CrossRef]
  90. Ludwig, K.R. Isoplot/Ex Version 3.00: A Geochronological Toolkit for Microsoft Excel; Berkeley Geochronology Center: Berkeley, CA, USA, 2003. [Google Scholar]
  91. Vermeesch, P. IsoplotR: A free and open toolbox for geochronology. Geosci. Front. 2018, 9, 1479–1493. [Google Scholar] [CrossRef]
  92. Carosi, R.; Di Pisa, A.; Iacopini, D.; Montomoli, C.; Oggiano, G. The structural evolution of the Asinara Island (NW Sardinia, Italy). Geodin. Acta 2004, 17, 309–329. [Google Scholar] [CrossRef] [Green Version]
  93. Giacomini, F.; Bomparola, R.M.; Ghezzo, C. Petrology and geochronology of metabasites with eclogite facies relics from NE Sardinia: Constraints for the Palaeozoic evolution of Southern Europe. Lithos 2005, 82, 221–248. [Google Scholar] [CrossRef]
  94. Jones, R.R.; Tanner, P.W. Strain partitioning in transpression zones. J. Struct. Geol. 1995, 17, 793–802. [Google Scholar] [CrossRef]
  95. Pyle, J.M.; Spear, F.S. Yttrium zoning in garnet: Coupling of major and accessory phases during metamorphic reactions. Geol. Mat. Res. 1999, 1, 1–49. [Google Scholar]
  96. Kohn, M.J. Metamorphic chronology comes of age: Past achievements and future prospects. Am. Min. 2016, 101, 25–42. [Google Scholar] [CrossRef]
  97. Spear, F.S. Monazite–allanite phase relations in metapelites. Chem. Geol. 2010, 279, 55–62. [Google Scholar] [CrossRef]
  98. Giacomini, F.; Bomparola, R.M.; Ghezzo, C.; Guldbransen, H. The geodynamic evolution of the Southern European Variscides: Constraints from the U/Pb geochronology and geochemistry of the lower Paleozoic magmatic-sedimentary sequences of Sardinia (Italy). Contrib. Miner. Petrol. 2006, 152, 19–42. [Google Scholar] [CrossRef]
  99. Casini, L.; Cuccuru, S.; Maino, M.; Oggiano, G.; Tiepolo, M. Emplacement of the Arzachena Pluton (Corsica–Sardinia Batholith) and the geodynamics of incoming Pangaea. Tectonophysics 2012, 544–545, 31–49. [Google Scholar] [CrossRef]
  100. Simonetti, M.; Carosi, R.; Montomoli, C.; Corsini, M.; Petroccia, A.; Cottle, J.M.; Iaccarino, S. Timing and kinematics of the flow in a transpressive dextral shear zone, Maures Massif (Southern France). Int. J. Earth Sci. 2020, 1437–3262. [Google Scholar] [CrossRef]
  101. Simonetti, M.; Carosi, R.; Montomoli, C.; Cottle, J.M.; Law, R.D. Transpressive deformation in the Southern Europe Variscan Belt: New insights from the Aiguilles Rouges Massif (Western Alps). Tectonics 2020, 39, e2020TC006153. [Google Scholar]
  102. Giacomini, F.; Dallai, L.; Carminati, E.; Tiepolo, M.; Ghezzo, G. Exhumation of a Variscan orogenic complex: Insights into the composite granulitic–amphibolitic metamorphic basement of South-East Corsica (France). J. Metamorph. Geol. 2008, 26, 403–436. [Google Scholar] [CrossRef]
  103. Holcombe, R. Straincalculator 3.2.; 2009. Available online: https://www.holcombe.net.au/software/straincalculator.html (accessed on 10 July 2020).
Figure 1. (a) Reconstruction of the Variscan Belt during the late Carboniferous age (modified from Carosi et al. 2012 [9] and Simonetti et al. 2018 [18]). The geographic location of the Sardinian island is shown; (b) the simplified geological map of the Variscan basement in Sardinia showing the distribution of the different tectono-metamorphic zones (modified after Carmignani et al. 1994 [36]). The PASZ high-strain zone is showed by the red shadow.
Geosciences 10 00288 g001
Figure 2. (a) Geological sketch map of the study area (Baronie area, see Figure 1). The two sampling transects (1 and 2) and the low- and high-strain zone are indicated. The Posada-Asinara shear zone (PASZ) is also displayed. A geological cross-section, not in the same scale of the map, is present below; (b) the details of the two studied areas. Labels of the selected study samples and the corresponding types of analysis are reported; (c) 3D simplified block diagram showing the final structural architecture related to the superposition of different deformation phases. Stereoplot (equal angle, lower hemisphere projections) of the main structural elements are given.
Geosciences 10 00288 g002
Figure 3. (a) F2 cylindrical folds, in the granodioritic orthogneiss and leucogneiss, deforming an older relict foliation (S1) (40°35′30.9″ N–9°31′52.5″ E); (b) F2 non-cylindrical folds (sheath fold) deforming the older foliation (S1) in the garnet-bearing micaschist (40°38′39″ N–9°38′23″ E); (c) L2 sub-horizontal object lineation, defined by staurolite crystals, in staurolite-garnet-bearing micaschist (40°36′6″ N–9°34′57″ E); (d) mesoscopic aspect of D2 deformation. C’–S fabric in granodioritic orthogneiss, pointing to a top-to-the NW sense of shear (40°35′45″ N–9°35′29″ E); (e) sheared augen gneiss with C–S fabric showing a dextral sense of shear (top-to-the NW). σ-type porphyroclast pointing a top-to-the NW sense of shear is also present (40°35′58″ N–9°33′50″ E); (f) kink folds (F3 fold) in granodioritic orthogneiss affecting the S2 mylonitic foliation (40°35′29″ N–9°29′56″ E); (g) asymmetric F3 folds in garnet-bearing micaschist that affect the S2 mylonitic foliation (40°34′58″ N–9°37′44″ E); (h) late open folds (F4) with sub-horizontal axes and axial planes deforming the main foliation in staurolite-garnet-bearing micaschist (40°36′6″ N–9°35′2″ E).
Geosciences 10 00288 g003
Figure 4. Summary diagram where metamorphic paragenesis, quartz recrystallization mechanism, vorticity number and the related percentage of pure shear are shown and are plotted against the distance from the core of the PASZ. SRR = subgrain rotation recrystallization, GBM = grain boundary migration. The distribution of the samples shows increasing Wk values (i.e., increase in the simple shear component) toward the shear zone (trend: grey area).
Geosciences 10 00288 g004
Figure 5. (a) Dynamically recrystallized quartz in staurolite-bearing micaschist showing lobed and irregular boundaries indicative of grain boundary migration (GBM). Subgrain rotation recrystallization (SRR) overprinting is highlighted by the presence of “core and mantle” structure. An oblique foliation, Sb, defined by elongated quartz, is present (XPL); (b) oligoclase porphyroclast, in oligoclase-bearing micaschist, showing an internal foliation S1 (green line), defined by ilmenite + graphite. Oligoclase is wrapped by the main foliation S2 (blue line) defined by quartz + white mica + biotite (XPL); (c) garnet porphyroclast, in garnet-bearing mylonitic micaschist, showing an internal foliation S1 (green line) defined by ilmenite + elongated quartz. Garnet is wrapped by the main foliation S2 (blue line) defined by white mica + biotite (PPL); (d) staurolite in staurolite-bearing micaschist, showing an internal foliation S1 (green line), discordant with respect to the foliation in the rim which is in continuity with the external foliation S2 (blue line). This observation point to an inter- to early-syn tectonic growth of staurolite (PPL); (e) dynamically recrystallized quartz in staurolite-bearing micaschist showing lobate and irregular grain boundaries indicative of GBM (XPL); (f) C’–S fabric (S plane = red dashed line, C’ plane = black line) in garnet-bearing micaschist, indicating a top-to-the NW sense of shear (PPL).
Geosciences 10 00288 g005
Figure 6. Example of vorticity and finite strain results in a garnet-bearing micaschist: (a) polar histogram used to derive the angle ν, between the C’ and C planes, and the corresponding kinematic vorticity number, Wk. A1 = flow apophysis 1; A2 = flow apophysis 2; n = total number of data; (b) example of the plot compiled to determine the minimum (Rcmin) and maximum critical (Rcmax) axial ratio and the resulting Wk values; (c) example of a Fry diagram for the XZ and YZ sections of the finite strain ellipsoid (MIC5D sample). N = number of centres considered in the analysis.
Geosciences 10 00288 g006
Figure 7. (a) Percentage of pure shear (PS) and simple shear (SS) in relation to the calculated maximum and minimum Wk values; (b) Flinn diagram showing how the analyzed samples (blue dots) fall mostly in the apparent flattening field; (c) curves representing the shortening perpendicular to flow plane versus the extension in the transport direction for general flattening with 0–60% stretch along the Y axis of the finite strain ellipsoid (modified from Law, 2010 [80]); (d) diagram showing the relationship between the orientation of the maximum instantaneous stretching axis (ISAmax) with respect to the shear zone boundary (angle θ) related to the kinematic vorticity number Wk (modified after Fossen and Tifoff, 1993 [75]). Samples mostly fall in the field of pure shear-dominated transpression.
Geosciences 10 00288 g007
Figure 8. (a) Location of the three selected samples for geochronological analysis on the geological sketch map displayed in Figure 2b. (be) Representative textural position and zoning of monazite grains selected for in situ dating. Color bar scale qualitatively points lower (L) to higher (H) Y-Th concentration, for sample ST2A and ST2B and Y–Ce concentration for sample 26-16-15. U–Pb concordant date with 2σ uncertainties has been displayed. (b) Mnz5 in sample ST2A, located along the main S2 foliation; (c) Mnz9 in sample ST2A, included in staurolite porphyroclast parallel the S2 foliation; (d) Mnz11 in sample ST2B, included in staurolite porphyroclast, laying along the S1 foliation; (e) Mnz21 in sample 26-16-15, located along the main S2 foliation near a garnet porphyroclast.
Geosciences 10 00288 g008
Figure 9. (a,b) Distribution of the 206Pb/238U and 208Pb/232Th ages of the three analyzed samples. Different textural position of the monazite grains included within the staurolite parallel (//) to the S1 and the S2 are indicated; (c,d) Dispersion diagrams showing the relations between Y2O3–CaO (wt.%) with respect to the 206Pb/238U–208Pb/232Th ages with the relative error. Symbols and colors indicate different samples and textural positions, respectively.
Geosciences 10 00288 g009
Figure 10. Simplified (not to scale) 3D cross-sections of the transects A and B of Figure 2. The progressive strain partitioning from fold structures (to the S) to a mylonitic foliation (towards the PASZ high-strain zone) is highlighted. Mineral assemblages recording Barrovian metamorphism with a northward increase in temperature are displayed.
Geosciences 10 00288 g010
Figure 11. (a) Schematic drawing of a thin section where the six possible monazite microstructural positions found in the three analyzed samples were indicated (1–6); (b) interpretation of monazite growth-stages along the prograde and retrograde segments of the P–T path. Monazite Y content and chemical zoning are qualitatively indicated; (c) P–T–D–t path (based on Franceschelli et al. 1989 [51]) of the three studied samples from staurolite- and garnet-bearing micaschist. BLG = bulging; SRR = subgrain rotation recrystallization; GBM = grain boundary migration.
Geosciences 10 00288 g011
Table 1. Results of the kinematic vorticity and the finite strain calculations collected along the two study transects (see Figure 2 for samples location).
C’ Shear Bands MethodPorphyroclasts MethodFinite Strain AnalysisConvergence Angle
SAMPLE NAMENν ANGLE (°)2ν Angle (°)Wkθ Angle (°)NRc minRc maxRc mWk minWk maxWmRxzRyzKStretching %Shortening %Shear StrainConvergence Angle
SB13933660.4012--------------
SB32133660.4012--------------
FIL11726520.6119--------------
FIL2A2432640.4413--------------
SA41827540.5918--------------
MIC5A1627540.59181541.732.001.860.500.600.552.401.910.2937290.5554°
MIC5B-----2191.642.372.000.450.690.571.961.690.2431240.3857°
MIC5C-----2311.752.101.920.510.630.57-------
MIC5D1825500.64202592.002.632.310.600.740.672.591.810.5341300.5851°
MIC5E2228560.5717-------1.671.300.9721180.2759°
MIC5F-----671.632.121.870.450.630.542.251.960.1639290.4257°
MIC4-----491.372.001.680.410.600.50-------
SC.44429580.5316--------------
SC.52626520.6119--------------
C19’6132640.4413--------------
C19’’’6731620.4714--------------
SC.506126520.6119--------------
ST131726520.6119--------------
SC.405929580.5316--------------
ST2B3225500.6420--------------
AU10A2929580.53161831.712.201.950.500.660.58-------
AU10B4131620.47141261.301.751.520.270.510.392.051.840.1438280.3460°
AU121729580.5316--------------
SC.217723460.6921--------------
ST32625500.6420--------------
M.65623460.6921--------------
SC.114022440.7222--------------
14-5-C13624480.6720--------------
MIG12322440.7222--------------
MIG23021420.7424--------------

