Article

Mainshock Anticipated by Intra-Sequence Ground Deformations: Insights from Multiscale Field and SAR Interferometric Measurements

by
Francesco Brozzetti
1,2,
Alessandro Cesare Mondini
3,
Cristina Pauselli
2,4,
Paolo Mancinelli
4,5,
Daniele Cirillo
1,2,*,
Fausto Guzzetti
3 and
Giusy Lavecchia
1,2
1
Dipartimento di Scienze Psicologiche, della Salute e del Territorio, Università G. d’Annunzio, via dei Vestini 31, 66100 Chieti, Italy
2
Centro InteRUniversitario per l’Analisi SismoTettonica Tridimensionale (CRUST), Italy
3
Consiglio Nazionale delle Ricerche-Istituto di Ricerca per la Protezione Idrogeologica (CNR-IRPI), 06128 Perugia, Italy
4
Dipartimento di Fisica e Geologia, Università degli Studi di Perugia, Piazza dell’Università 1, 06123 Perugia, Italy
5
Dipartimento di Ingegneria e Geologia, Università G. d’Annunzio, via dei Vestini 31, 66100 Chieti, Italy
*
Author to whom correspondence should be addressed.
Geosciences 2020, 10(5), 186; https://doi.org/10.3390/geosciences10050186
Submission received: 20 April 2020 / Revised: 7 May 2020 / Accepted: 13 May 2020 / Published: 15 May 2020
(This article belongs to the Special Issue Seismic Sequence in Mediterranean Region)

Abstract

:
The 2016 Central Italy seismic sequence was characterized by two main events: 24 August, Mw 6, and 30 October, Mw 6.5. We carried out high-resolution field sampling and DInSAR analysis of the coseismic and intra-sequence ground deformations along the Mt Vettore-Mt Bove causative fault (VBF). We found that during the intra-sequence period (24 August–30 October), the ground experienced some deformations whose final patterns seemed to be retraced and amplified by the following mainshock. We interpreted that (i) immediately after the 24 August earthquake, the deformation observed in the southern VBF expanded northwards and westwards over a Length of Deforming Ground (LDG) ranging between 28.7 and 36.3 km, and (ii) it extended to the whole portion of the hanging wall that was later affected by mainshock coseismic deformation. Assuming the LDG to be an indicator for an expected (=coseismic) surface rupture length and using known scaling functions, we obtained 6.4 ≤ Mw ≤ 6.7 for a possible incoming earthquake, which is consistent with the mainshock magnitude. We suggest that the evolution of the ground deformations after a significant seismic event might provide insights on the occurrence of new earthquakes with magnitudes comparable to or larger than the former.

1. Introduction

On 24 August 2016, at 01:36:32 UTC, a Mw 6.0 earthquake originated at a depth of approximately 8 km underneath the relay zone between the overlapping Mt Vettore-Mt Bove normal fault (VBF) and the Mt Gorzano Fault (GF) in the Central Apennines of Italy (Figure 1). The severe earthquake destroyed the town of Amatrice and many other villages, killing 299 people [1,2,3]. The inversion of waveforms from strong motion accelerometers [2] and numerical modeling of Differential Interferometry Synthetic Aperture Radar (DInSAR) measurements, which were integrated with structural geological data, suggest a seismogenic scenario characterized by a bilateral rupture propagating on the VBF and GF planes, conjoined at the base [1,2].
Field surveys performed in the weeks following the earthquake allowed the primary ruptures, caused by surface faulting, along an ~5.8 km section of the southern part of the VBF to be mapped (Mt Vettore-Castelluccio di Norcia area, Figure 1a); coseismic throws were found to range from 10 to 27 cm (an integral average of 12 cm) [1,4]. Remarkably, no clear evidence of surface faulting was observed along the GF or along the northern part of the VBF, i.e., in the Mt Bove-Ussita area (Figure 1a) highlighting that the coseismic rupture preferentially propagated from the hypocenter to the north along the southern VBF.
The VBF is a well-known active fault in the Central Apennines extensional belt with a 6.5 ≤ Mw ≤ 6.8 maximum expected magnitude [5,6,7,8]. The 24 August earthquake was characterized by a NNW-SSE-striking focal mechanism that had normal kinematics (Figure 1a) and was followed by a sequence of aftershocks with epicenters that were chiefly distributed in the southern part of the VBF hanging wall and northern part of the GF hanging wall [2,9] (blue dots in Figure 1a).
Independent geological and seismological data confirm that the August 24 earthquake ruptured the VBF along a length of ~12 km [1,4,9]. The coseismic deformation in the hanging wall of the ruptured fault section is inferred from DInSAR interferograms (Figure 1a) [1,10] that show two NNW-SSE-striking coalescent depressions with a maximum displacement along the satellite’s ascending Line of Sight (LoS) of nearly 20 cm (blue lines in Figure 1a). We confirmed the evidence by preparing a new coseismic interferogram using a pair of European Space Agency (ESA) Sentinel-1 images taken on 21 and 27 August 2016 (Figure S1). The independent coseismic interferograms demonstrate that the northern boundary of the surface deformational pattern caused by the Mw 6.0 earthquake coincided with the northern tip of the coseismic rupture mapped in the field along the VBF (Figure 1a).
On 26 October 2016, at 19:18:05 UTC, a Mw 5.9 earthquake struck along the VBF, 25 km NNW of the epicenter of the 24 August event (Figure 1a). On 28 and 29 October, we executed new field surveys along the VBF, and we found evidence of primary ruptures caused by surface faulting near the northern tip of the VBF, E of Ussita (Figure 1a), with throws ranging from 8 to 15 cm [4]. In the field, we did not observe evidence of new surface ruptures along the southern section of the VBF. The surface evidence of the earthquake was confirmed by a COMET interferogram [11] that showed a subsiding synform striking NW-SE nearly parallel to the VBF and an associated 14 km-long surface faulting with a maximum displacement of ~18 cm (green lines in Figure 1a).
Four days later, on 30 October 2017, at 06:40:17 UTC, a Mw 6.5 earthquake (hereafter, mainshock) occurred along the VBF, with the epicenter between the two previous major earthquakes (Figure 1b). As shown by DInSAR interferograms [10] (black lines in Figure 1b) and confirmed by field data [4,12], the strong earthquake re-activated and ruptured nearly the entire surface trace of the VBF, for a total length 32 > L > 22 km, with local coseismic surface displacements reaching 222 cm and a maximum slip on the same segment of the VBF that ruptured on August 24 [1,4,12].
To document the combined coseismic deformation produced by the Mw 5.9 and Mw 6.5 earthquakes, we prepared a coseismic interferogram using a pair of ESA Sentinel-1 images taken on 26 October and 1 November 2016 (Figure S2). The interferogram showed a complex, ~30 km long and ~8-to-12 km wide, NW-SE-striking area of deformation W of the VBF. The interferograms (Figure 1b and Figure S2) showed a widespread offset of the fringes along the western slope of Mt Vettore, with surface deformational gradients up to 30 cm·km−1. We estimate that the coseismic deformation exceeded 90 cm on the Castelluccio di Norcia plain (Figure 1b), a value which is also confirmed by the analysis of local GNNS data [13]. We emphasize, as the seismological and geological data confirm, that the three major earthquakes originated by ruptures nucleated on different sections of the VBF [1,4,14] and that the 24 August Mw 6.0 and 26 October Mw 5.9 events can be considered to be the major foreshocks of the 30 October mainshock, so we refer to them as such throughout the manuscript.

2. Materials and Methods

2.1. Fault-Slip Data Collection and Strain Markers

We performed a high-resolution sampling of the coseismic and intra-sequence ground deformations along the VBF (Figure 2) using a digital mapping method based on GPS-integrated Fieldmove software (Move™, produced by Midland Valley Exploration Ltd 2018 Glasgow, Scotland UK, and Petroleum Expert Edinburgh, Scotland UK) installed on an Apple IPad-Pro. At each survey site, we collected data on the following: (i) the type of ground deformation, including ruptures of the main fault plane within the fault rock, ruptures at the contact between the fault plane and the soil/debris covering the slope, and subsidiary ruptures displacing the local Quaternary cover; (ii) the rupture attitude and associated displacement (i.e., the net slip or throw values); and (iii) any other kinematic indicator providing a true displacement vector.
During the fieldwork, at multiple sites along the VBF, we drew permanent strain-markers on the fault plane to record the position of the topography cut-off line in the hanging wall—at a given known date (Figure 2d, Figure S3a,e). We revisited the sites and used the different positions of the strain-markers to obtain temporal constraints to the bands characterizing the composite free faces recognized along the fault scarp. In several outcrops, the free faces typically showed three adjacent bands produced by different periods of exposure of unearthed rocks (Figure 2b,d, Figure S3).
We note that lithology played a role in strict control of the preservation of the composite free faces. In fact, the three bands described above were observed only on well cemented and polished fault mirrors set in unstratified Jurassic limestones of the Calcare Massiccio Fm. On the contrary, they were not detectable where the coseismic scarp originated in not cohesive slope debris or in the poorly cemented fault breccia derived from the basinal limestones of the Umbria-Marche stratigraphic succession.
Anyhow, in all the survey sites shown in Figure 2a, the three bands referable to (a) 24 August coseismic slip, (b) 24 August to 29 October slip, and (c) 30 October coseismic slip were clearly recognizable and mapped with continuity of tens of meters, along the fault strike.
The field evidence allowed the Intra-sequence Ground Deformation (IGD) to be estimated, i.e., the deformation occurred after the 24 August foreshock and before the 30 October mainshock, along the southern portion of the VBF. Unfortunately, no data for this time span are available for the other fault segments because, during the intra-sequence period, our fieldwork was focused along the 24 August coseismic rupture and we were not aware that ground deformations were affecting a much wider portion of the hanging wall.

2.2. DInSAR Processing

Using DInSAR analysis [15,16], we inferred the surface deformation patterns along the VBF for different periods. Here, we focused on the IGD detected between the 24 August Mw 6.0 and the 26 October Mw 5.9 foreshocks. According to data availability, we divided this timespan into two ~1 month-long periods—i.e., T1 and T2 (Table 1).
To study IGD, we generated individual interferograms using the flow chart available in Sar Scape [17,18]. We also elaborated coseismic interferograms and compared them with published interferograms prepared by the ESA’s SEOM Programme InSARap project [10] for the 24 August and the 30 October earthquakes and by the COMET [11], for the 26 October earthquake. Our new coseismic interferograms for the Mw 6.0 foreshock (Figure S1) and the cumulated effects produced by the Mw 5.9 foreshock and Mw 6.5 mainshock (Figure S2) confirm the results published by the InSARap project for the 24 August foreshock and 30 October mainshock [10] and by COMET for the 26 October foreshock [10] (Figure 1). An independent interferogram prepared using the DIAPASON processing chain (https://terradue.github.io/doc-tep-geohazards/tutorials/diapason-iw.html), a DInSAR suite developed by the French Space Agency (CNES) and maintained by TRE-Altamira, confirmed our T1+T2 intra-sequence interferogram. Interferograms covering periods of shorter lengths between June and August 2016 did not show any significant surface deformation in the study area before the onset of the seismic sequence. Similarly, surface deformations were not detected in the area from February to April 2017, i.e., after the melting of snow cover that had mantled part of the area since mid-November 2016, preventing DInSAR measurements from mid-November 2016 to February 2017 in most of the study area.
The various steps of the DInSAR processing are reported in detail in the Supplementary Methods 1.

2.3. Measurements of Length of the Deforming Ground

We visually inferred the northernmost and southernmost points of ground deformation within the VBF hanging wall, in the T1, T2 and T1+T2 interferograms (Figure 3 and Figure 4, black dots with white bars).
Adopting a conservative approach, we identified points where deformation was detectable, provided that these were included in areas of high coherence (Figure S4).
This latter condition was also confirmed by the displacement fields produced on high-coherence areas located south and north of the VBF. Figure 5 and Figure 6 shows parts of the LoS displacement field where the coherence is high in the northernmost (Figure 5b and Figure 6b) and southernmost (Figure 5c and Figure 6c) portions of the VBF (compare to Figure S4).
In these reconstructions, there are some uncertainties in the quantitative estimate of the deformation for a few reasons, including some possible local contributions from the atmosphere, which cannot be exactly estimated with the available data.
Some differences between the patterns shown in Figure 5 and Figure 6 could also be due to the different LoS. In fact, Figure 5 was obtained from a satellite in ascending mode, with a shot direction from west to east, which is almost perpendicular to the VBF, while Figure 6 was obtained from a satellite in descending mode and a SE-NW shot direction, at an angle with respect to the VBF. The two acquisitions can intercept different components of the whole displacement.
Moreover, it must be borne in mind that, as demonstrated in [4], the 24 August and 30 October coseismic displacement vectors (which are also coherent with the long-term kinematics) vary sensibly, along the VBF trace, as regards the slip direction and the amount of net slip.
This observation can contribute to explaining the differences in the values of motions observed along the fault during the intra-sequence phase (compare the graphs of Figure 5 and Figure 6). In fact, the along-strike variable kinematics (dip-slip to oblique-dextral and locally oblique-sinistral) could significantly affect the length of the displacement components detected along the LoS, in the different orbits.
Anyhow, we carried out the interpretation of the interferograms only where the change of phase seems to be atypical in shape for atmospheric disturbances and topographic effects.
The crossing profiles represent deformation measurements that, although they could be influenced by local effects, including gravitational movements, show that qualitatively the behavior is the same along all the traces.
It is noteworthy that in both sample areas (Figure 5b,c and Figure 6b,c), the LoS displacement field pattern shows a step or a slope between the footwall and hanging wall across the mapped fault traces (Figure 5 and Figure 6 lower graphs) also at great distances from the points where we measured slips in the field (survey sites shown in Figure 2a).
We used the distance between the northernmost and southernmost point with detectable deformation to infer the Length of the Deforming Ground (LDG) during the T1+T2 period, i.e., the fault parallel length of the surface deformation that occurred after the 24 August Mw 6.0 foreshock and before the combined effects of the 26 October Mw 5.9 foreshock and the 30 October Mw 6.5 mainshock.

2.4. Procedure for Estimating the Fault Rupture Area

Comparing the along-fault extent of the IDG with the distribution of the coseismic ruptures observed after the 30 October mainshock [4,12], we suggest the intra-sequence LDG is a good proxy for the expected coseismic Surface Rupture Length (i.e., LDG ≈ SRL), which is known to correlate with the maximum expected earthquake magnitude.
The seismological data in the literature based on relocated hypocenters [1,3,9], and our own field data (Figure 2, Figure S3), agree in showing a dip-angle of the VBF in a range between α = 50° and α = 60°. We, therefore, used the LDG and the above dip-angle values (considered as end-members) to estimate the expected coseismic fault Rupture Area (RA, in km2). We also hypothesized two possible depths for the coseismic fault rupture, D = 8 km, corresponding to the hypocentral depth of the 24 August 2016, Mw 6.0 earthquake—assuming the hypocenter coincides with the deepest part of the seismogenic source—and D = 11 km—the depth above which most of the seismicity occurred after the Mw 6.0 event [9]—corresponding to the inferred base of the seismogenic layer. The two alternative depths can be considered on the basis of the recent literature concerning the major instrumental earthquakes that have affected the Central Apennines extensional belt, such as the 1997 Umbria-Marche and the 2009 L’Aquila earthquakes, and associated sequences [19,20,21,22]. In both these cases, in fact, the fault-slip patterns, obtained by inverting GPS, DInSAR and strong motion data [23,24,25], show that the hypocenters of the mainshocks lay on the lower part of the coseismic rupture, or near its deeper boundary, which nearly corresponds to the base of the seismogenic layer below this part of the Apennine chain.

2.5. Evaluation of the Expected Earthquake Magnitude

To estimate the expected magnitude of a possible earthquake originated on the VBF after the 24 August foreshock, we used two empirical relationships linking the (expected, in our case) fault rupture area (RA, in km2) to the expected earthquake magnitude, including M = 0.47 + 0.98 log(RA) [26] and M = 0.40 + log(RA) [27]. Both relationships are suited for extensional tectonic domains characterized by “slow” faults that have a slip rate < 1 cm·yr−1 [28], which is the case of the Central Apennines extensional belt.

3. Results

3.1. Intra-Sequence Ground Deformation Measured in the Field

The intra-sequence slip, occurring during the period between the 24 August foreshock and 30 October mainshock (T1+T2), directly measured on the composite free faces located along the fault scarp of the southern VBF (Figure 2a,b, Figure S3a,e) ranges between 2.5 and 6.2 cm, over a length of at least 4 km (Figure 2a). An additional measurement of the intra-sequence after-slip was made where the VBF crosses Forca di Presta road SP34 (the blue dot in Figure 2a), near the southern tip of the VBF. At this site, immediately following the Mw 6.0 foreshock, the surface deformation was nearly null (0.1 ± 0.1 cm) and rapidly increased to exceed ~2.5 cm in just over one month (inset in Figure 2a), when the road was paved preventing any further observation. The northernmost 1.8 km long section of the 24 August rupture broke poorly consolidated slope deposits that were unsuitable for recording the low-amplitude intra-sequence deformation.
The deformation that occurred during the T1+T2 period was significant. In fact, based on field evidence from this work, the maximum displacement observed over the VBF is 6.2 cm (band B in Figure 2b,c and Figure S3), while the average displacement value is 4.8 cm. For comparison, the coseismic slip caused by the Mw 6.0 foreshock was ~12 cm.

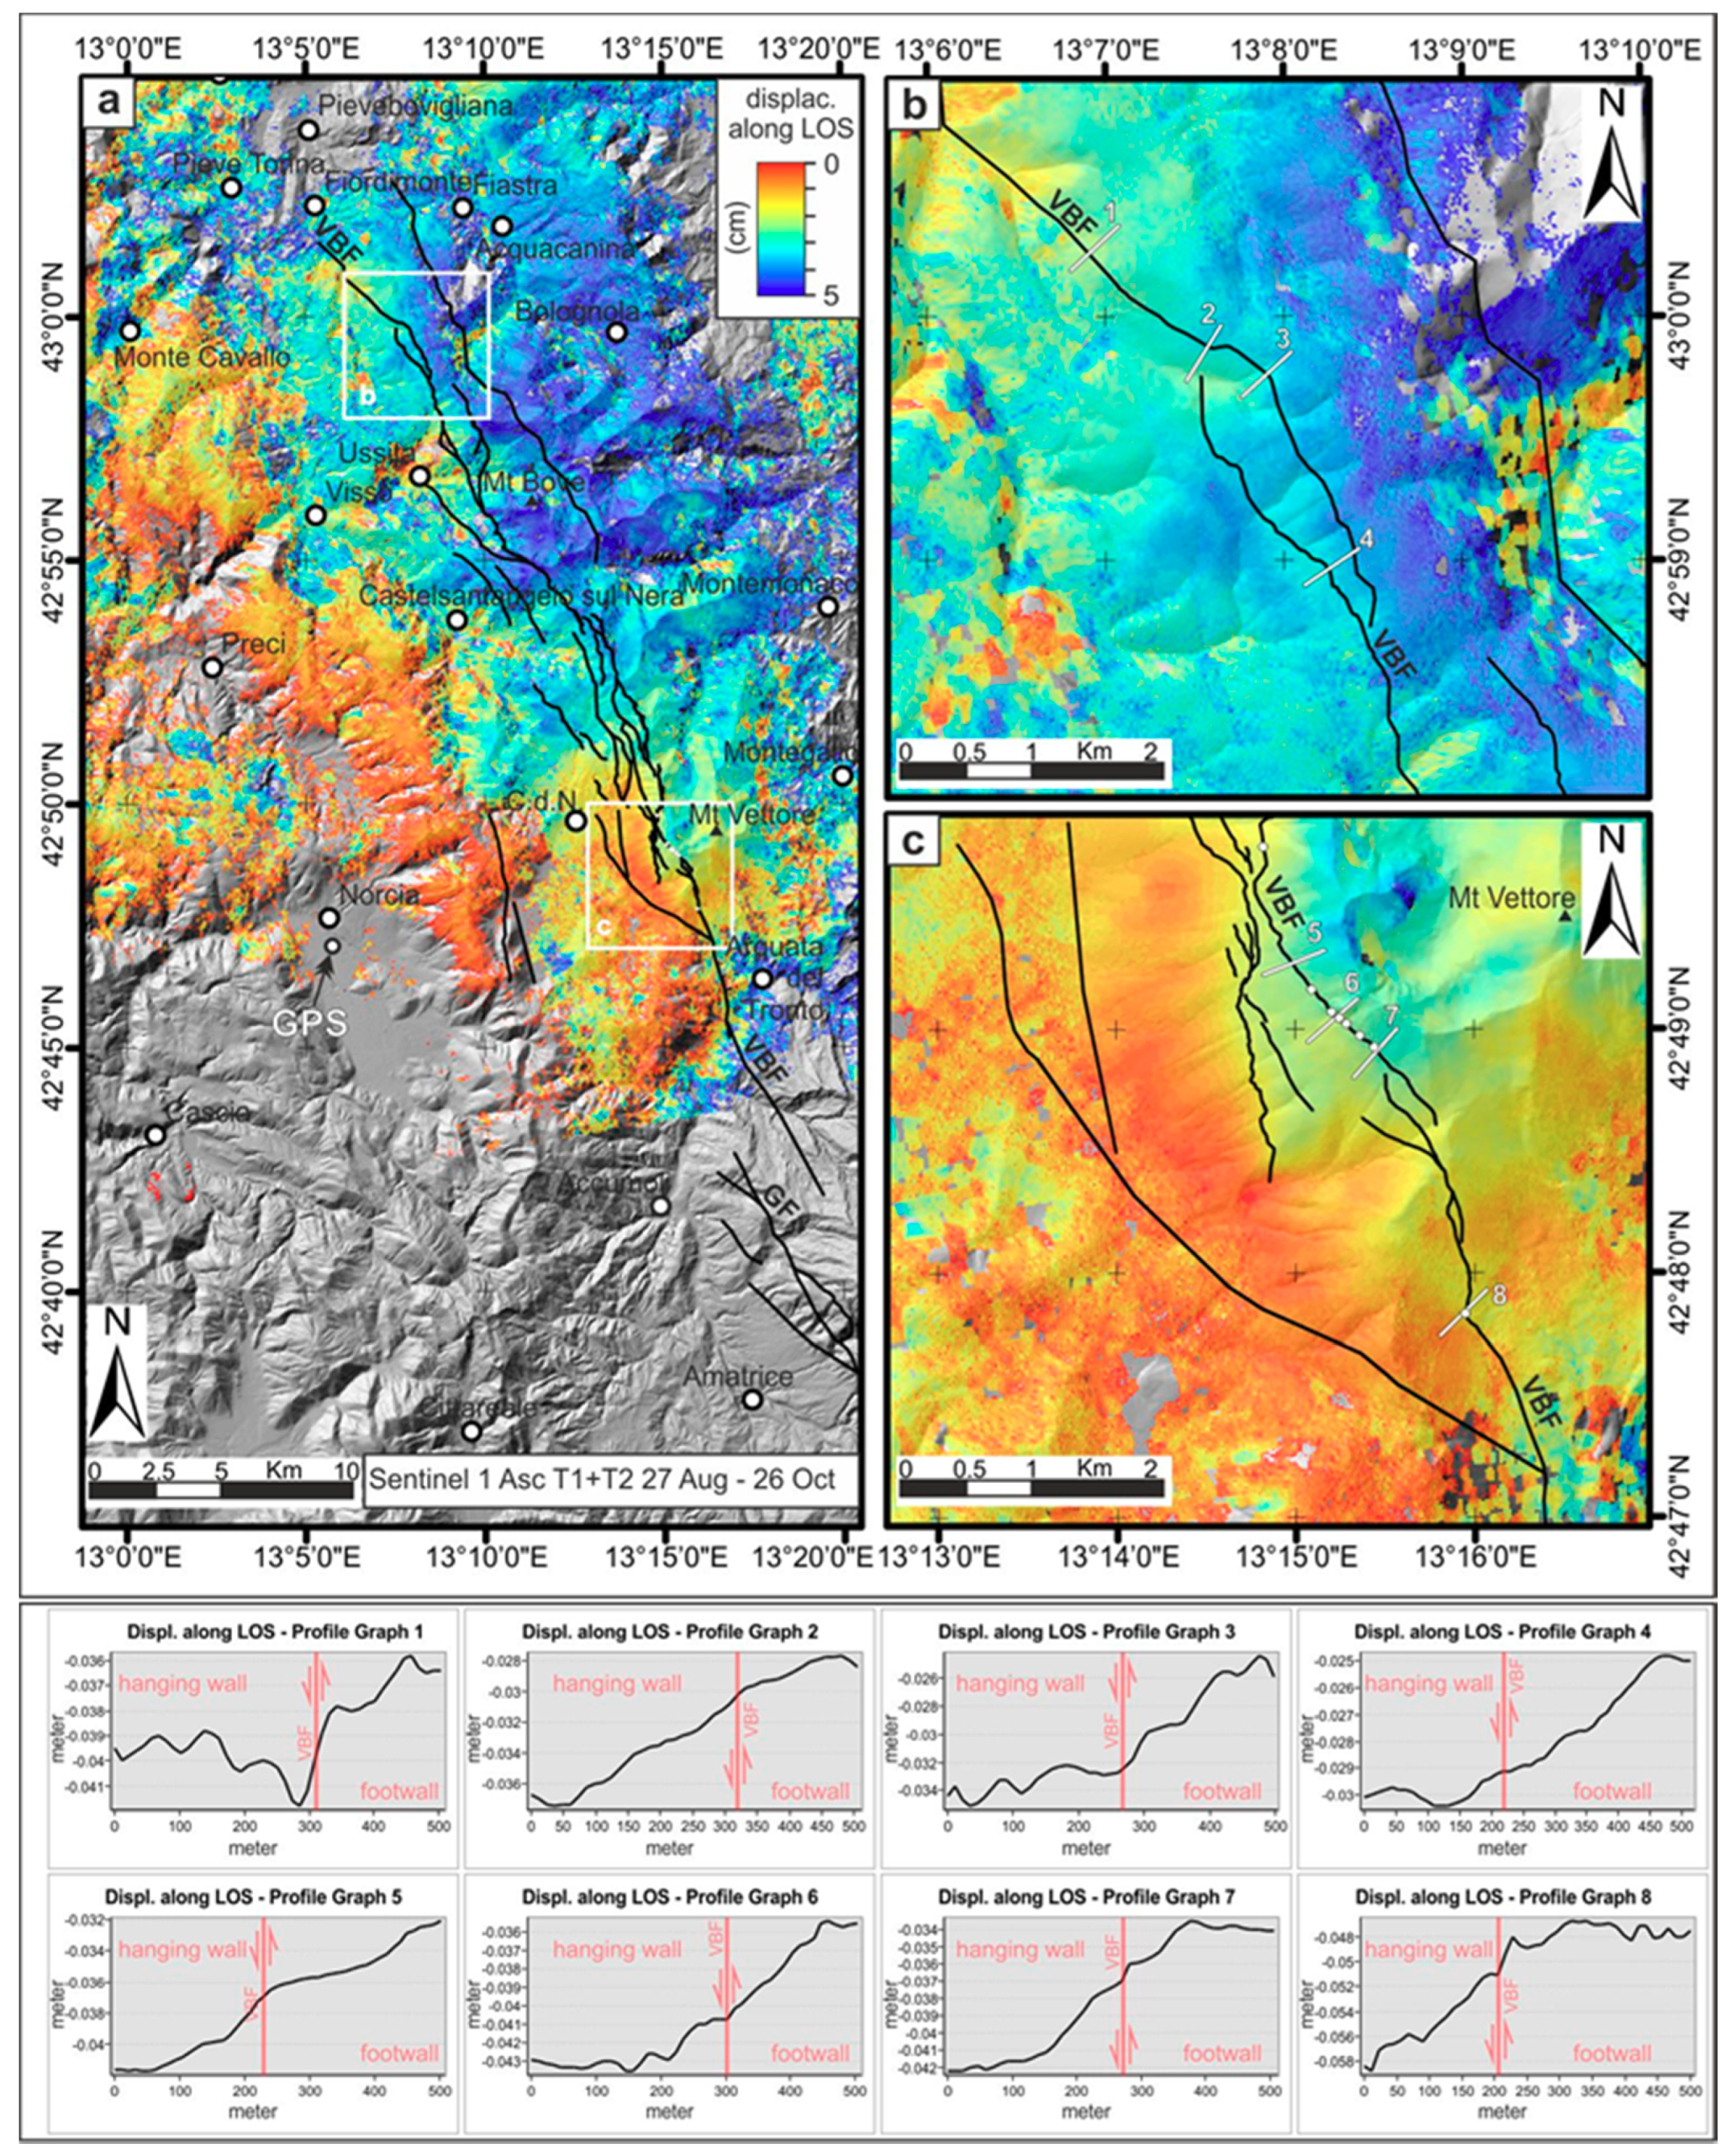
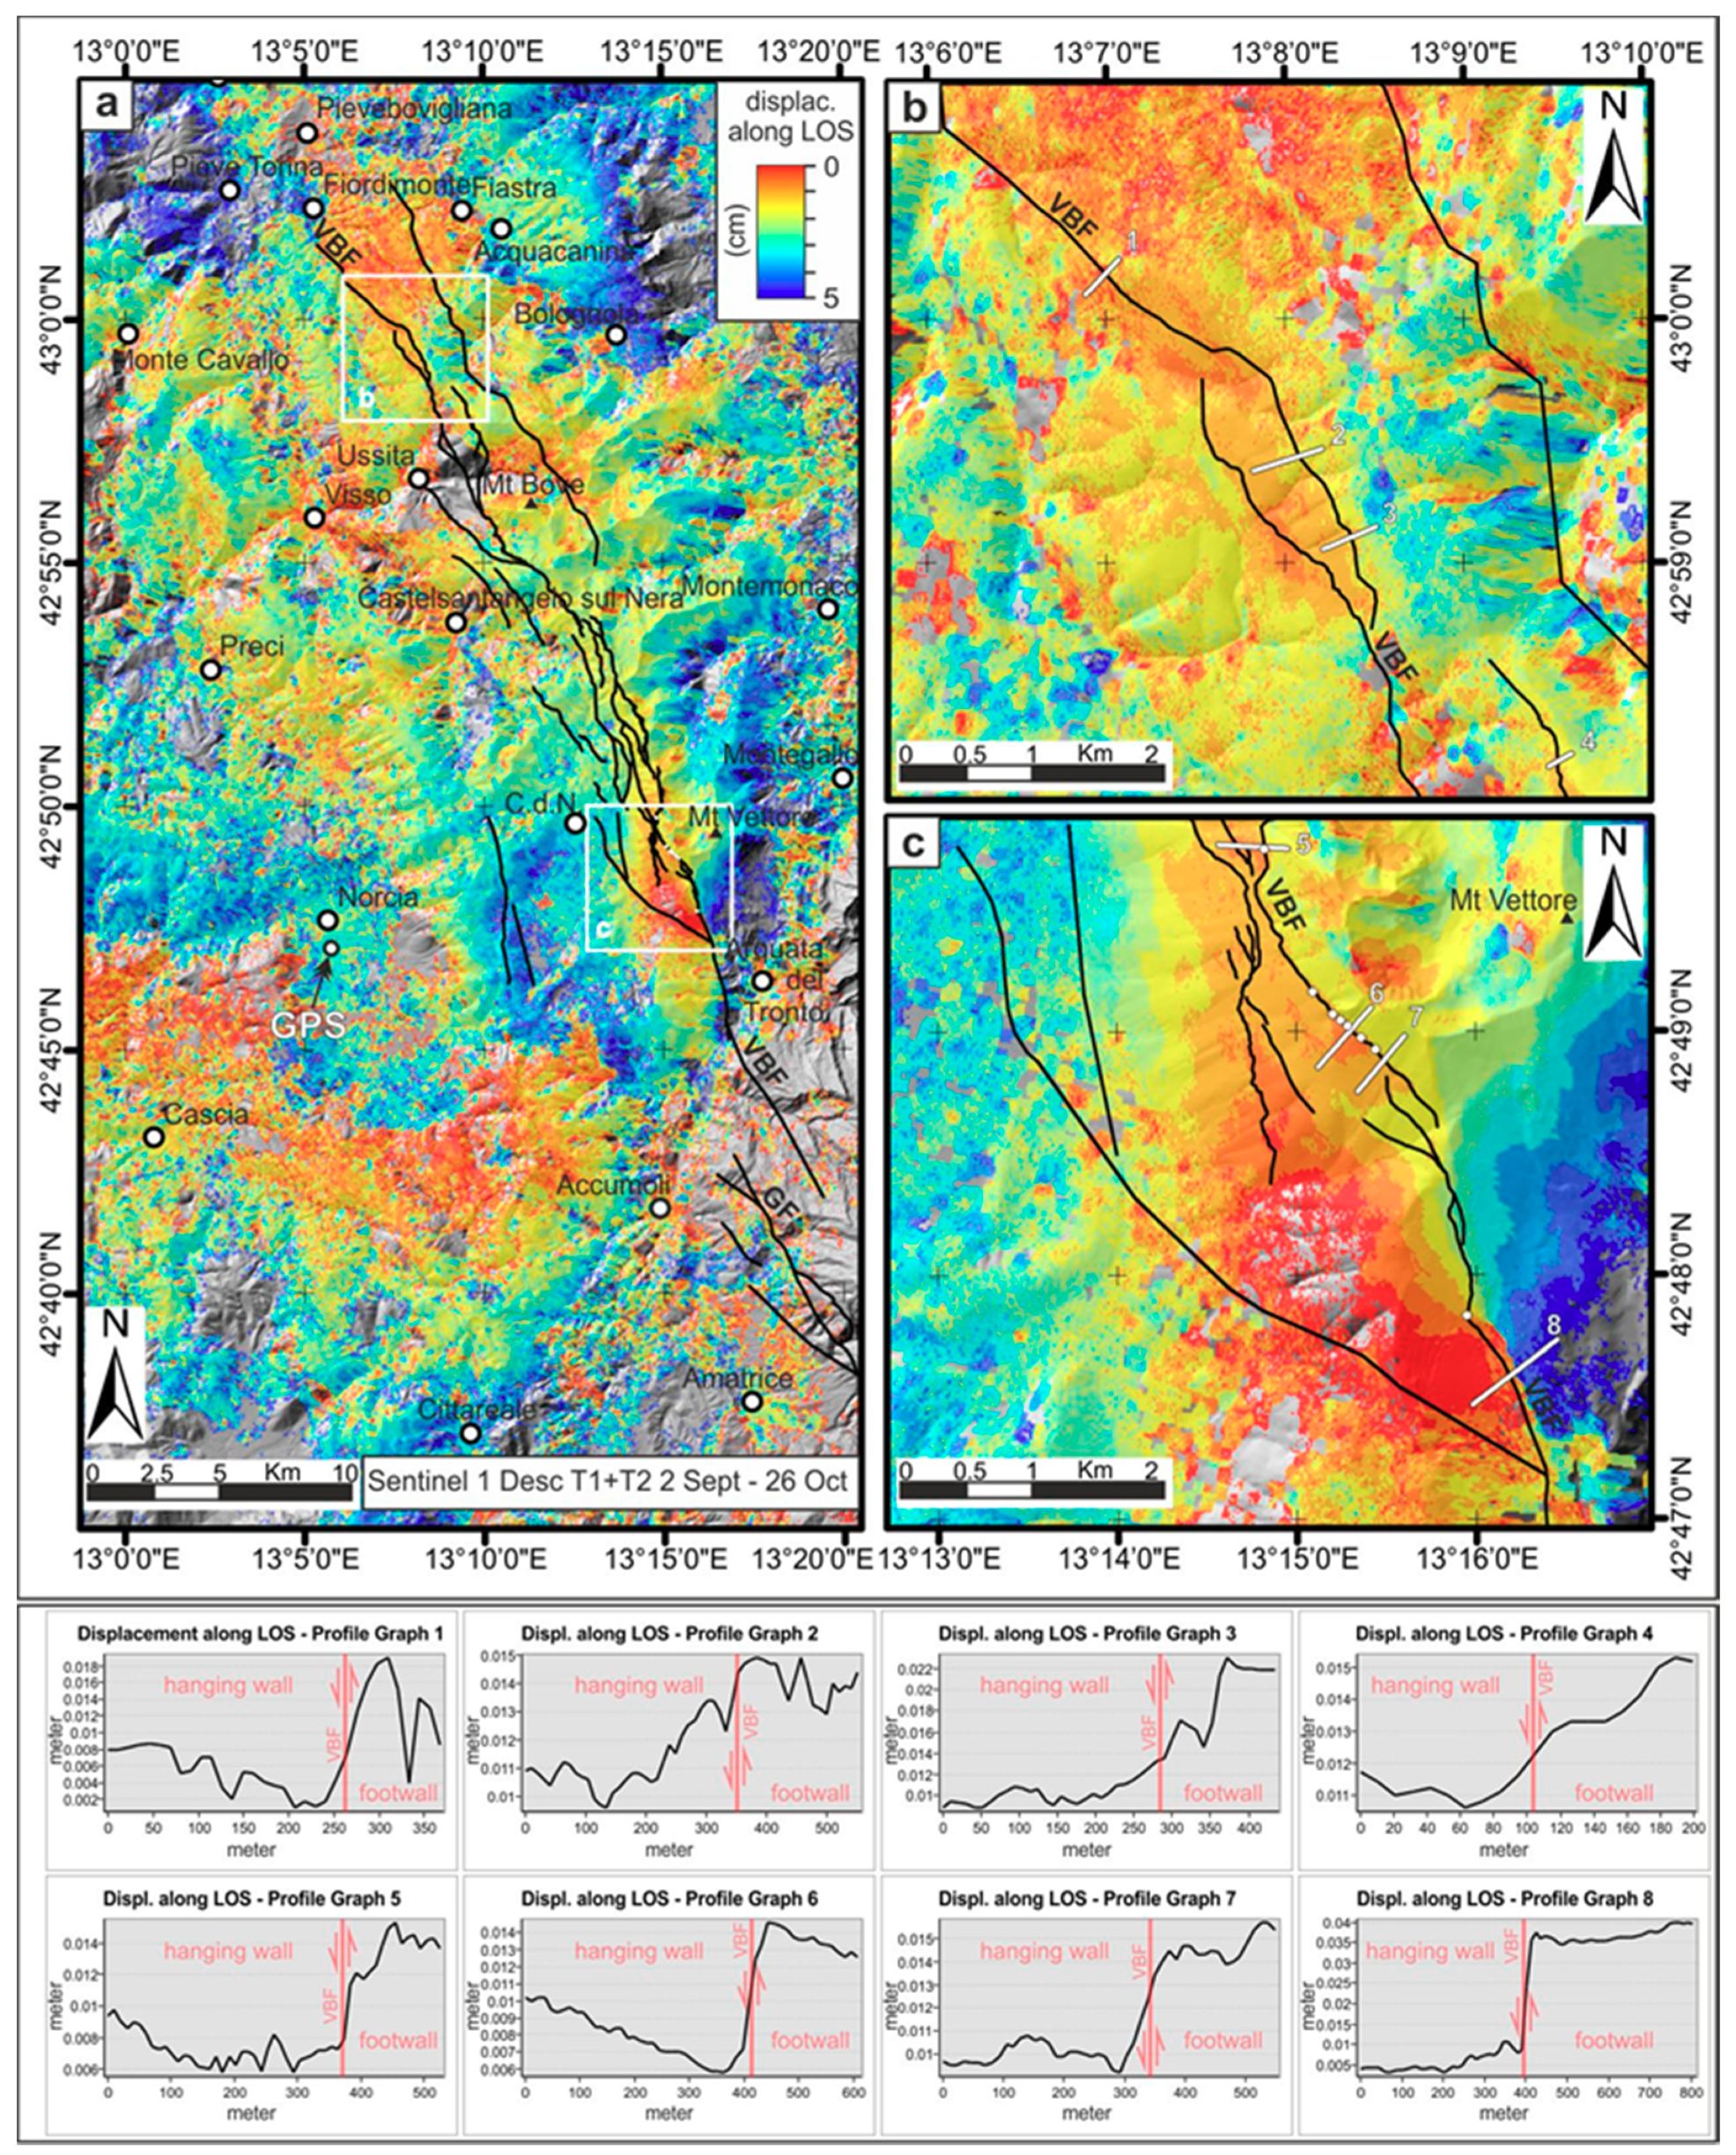
3.2. IGD from DInSAR Analysis

A visual analysis of the interferograms showed some phase changes compatible with a surface deformation pattern during the T1 period.
These changes were more intense (potentially up to 2.8 cm) in the SSW part of the VBF hanging wall, chiefly in the Castelluccio di Norcia basin and less intense in the NNW sector of the VBF hanging wall, N of Visso and Ussita (Figure 3a,c). We noticed that during the T1 period the IGD spatial pattern was larger than that of coseismic deformation caused by the 24 August foreshock (Figure 1a). The IGD in fact extended outside (e.g., to the NNW) of the area adjacent to the segment of the VBF that was ruptured by the Mw 6.0 foreshock. During the second intra-sequence period, T2, the IGD further extended towards the northern part of the VBF hanging wall, expanding up to a distance of 6–8 km W of the fault trace (Figure 3b,d). Considering the entire intra-sequence period T1+T2, near the Mt Vettore-Castelluccio di Norcia basin, we noticed at least 1.5 phase cycles in the interferograms, potentially corresponding to a relative surface deformation exceeding 3.5 cm along the satellite LoS (Figure 3 and Figure 7).
We noted that the coseismic deformation produced by the joint effect of the 26 October, Mw 5.9 foreshock and the 30 October, Mw 6.5 mainshock was included remarkably well within the area in the VBF hanging wall where the IGD was active during T1 and T2 (compare the interferograms of Figure 3 to those of Figures S1 and S2).

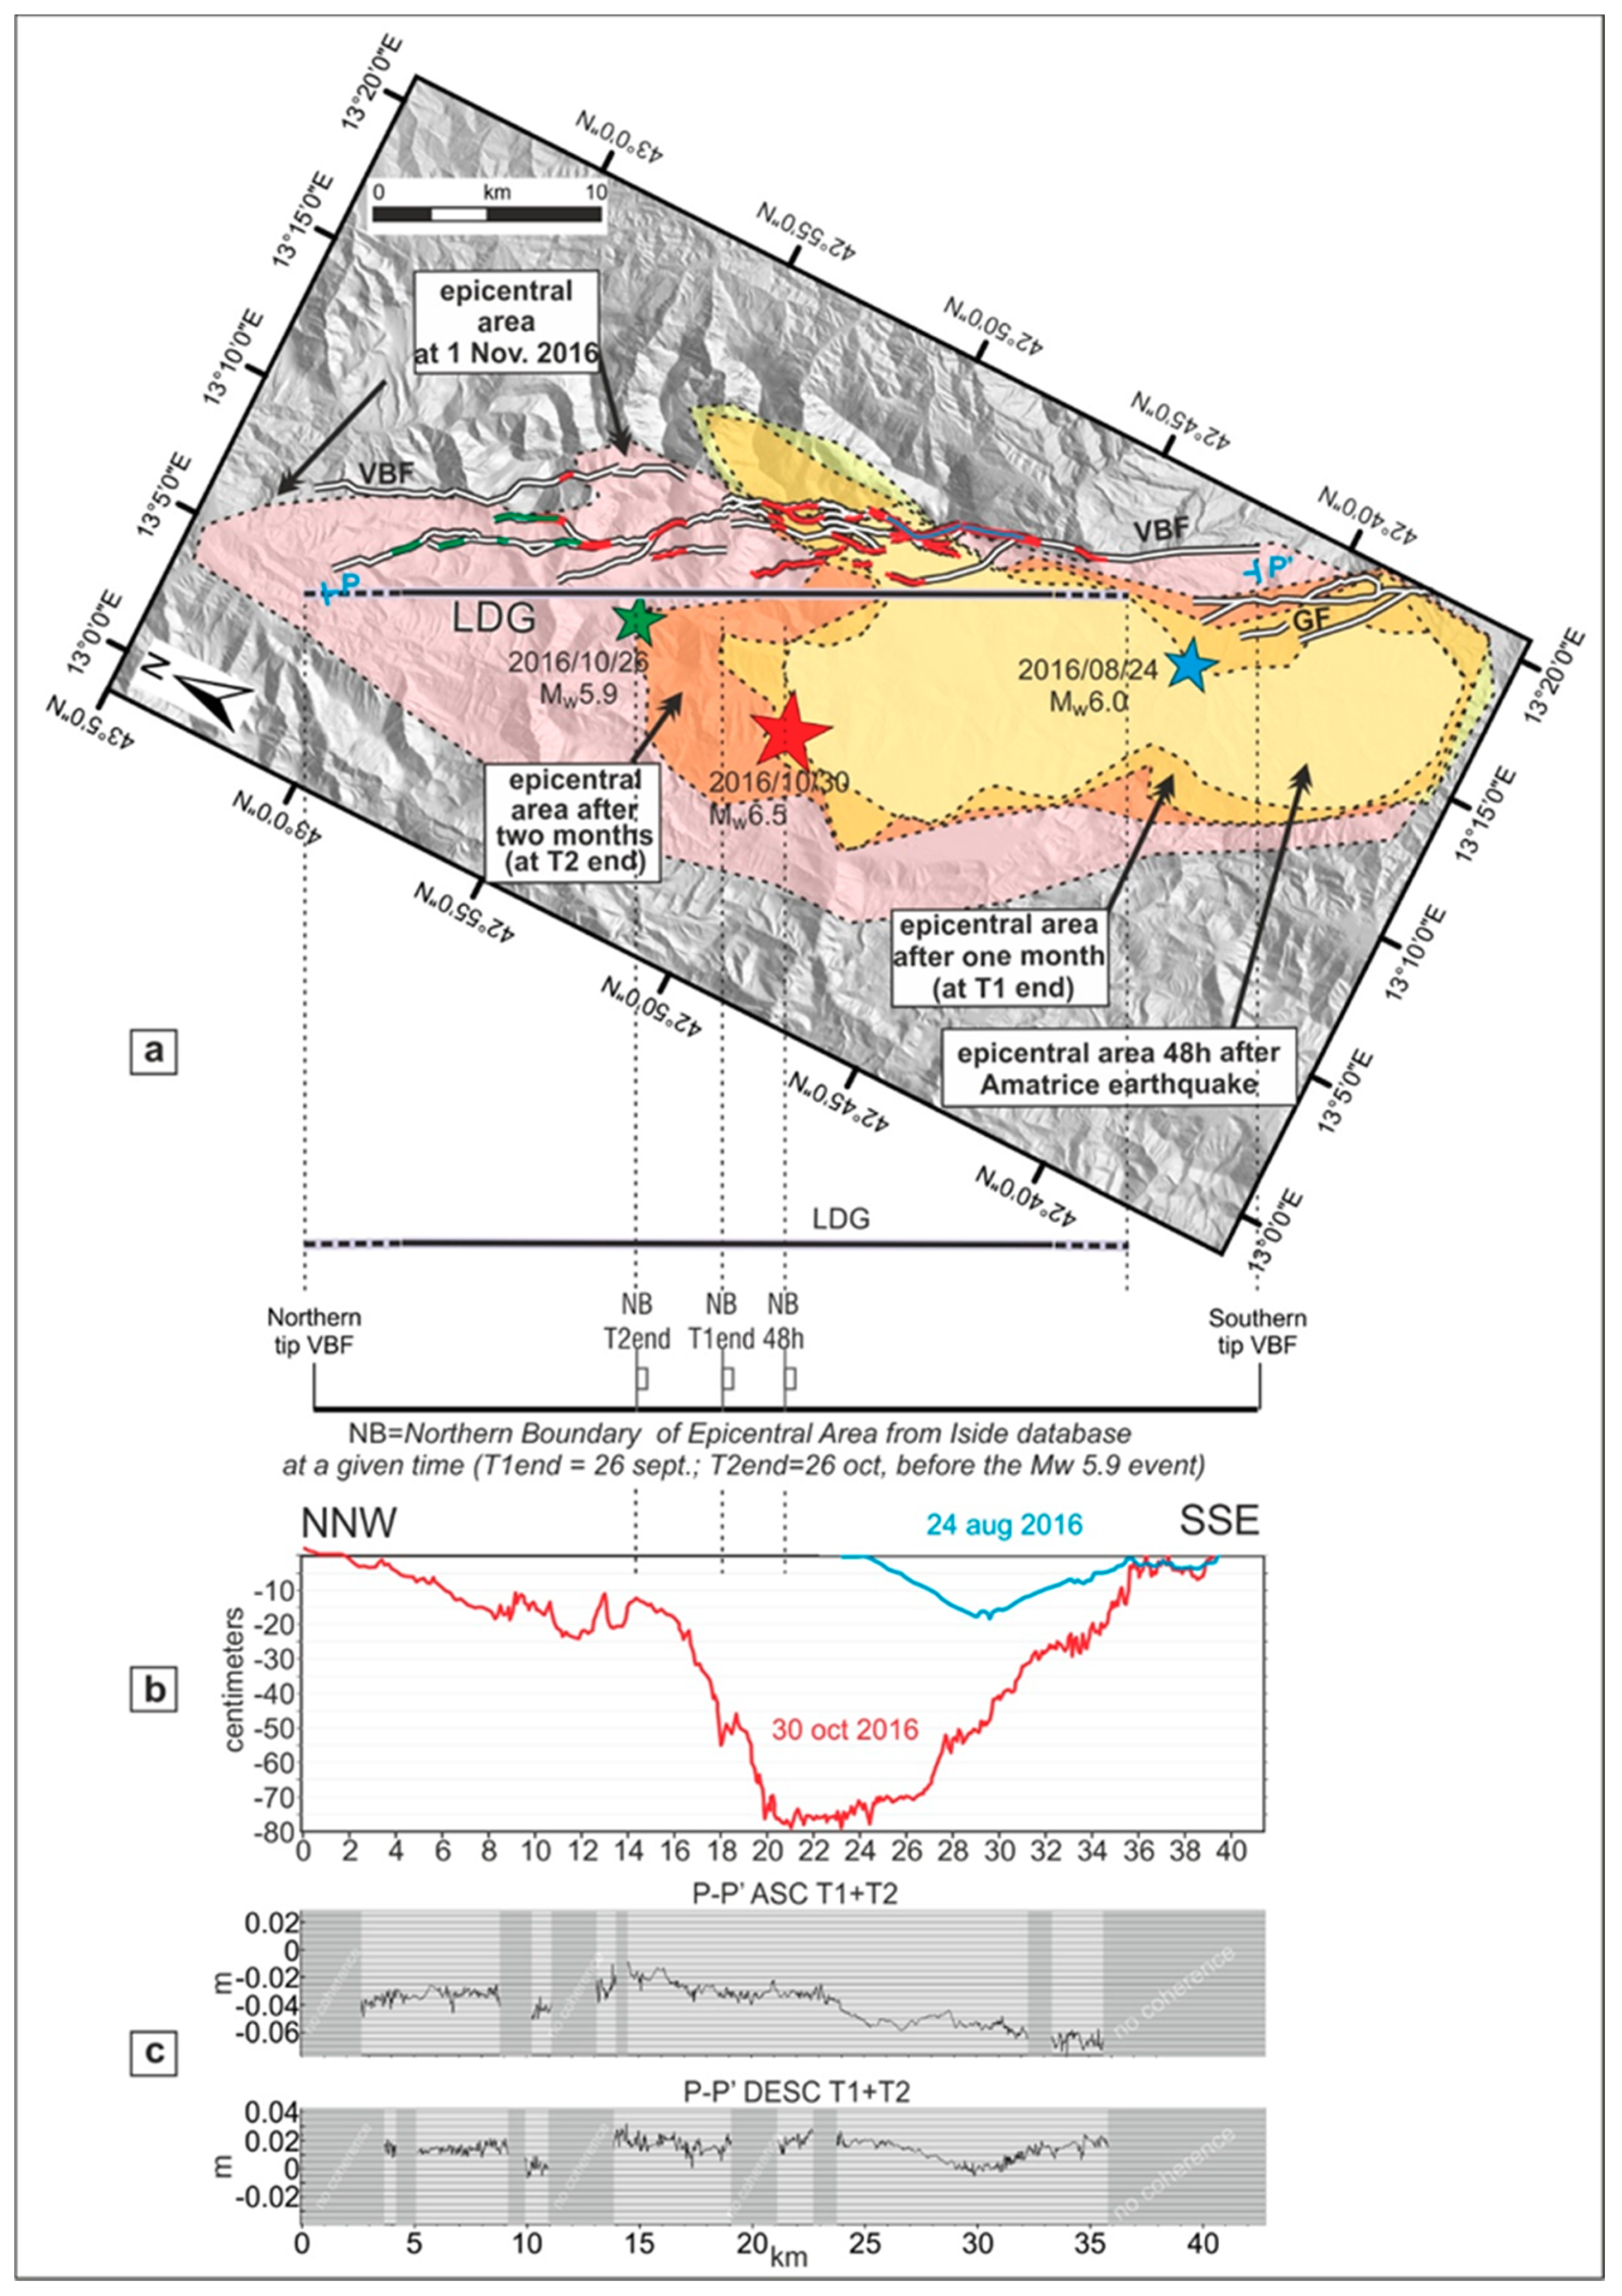
3.3. Estimates of LDG

The Length of the Deforming Ground (LDG) measured along the VBF in the intra-sequence interval T1+T2 (Section 2.3, Figure 3) approximates the total length of the surface ruptures generated along the same fault by the collective effect of the 26 and 30 October earthquakes. Inspection of Figure 7 shows that after the 24 August foreshock, seismicity continued to affect the epicentral area of the Mw 6.0 foreshock, including the southern area in the hanging wall of the Mt Gorzano fault [1]. Nevertheless, the LDG progressively extended northwards in the area not affected by seismicity. This observation highlights that, during the intra-sequence period, the northern part of the VBF was aseismically slipping. The initial activation, through aseismic elastic deformation or creep, of the intermediate VBF segment—where the mainshock rupture would subsequently be nucleated—is sound, also considering the positive Vp/Vs anomalies observed in its footwall [29,30] during the intra-sequence period. These anomalies are related to a sensible increase of pore pressure induced by fluid migration within the fault zone, triggered and conveyed by the rupture of the 24 August foreshock.
We obtained different measurements for the LDG (Figure 6 and Figure S5b,d) in the range from 31.8 ± 1.3 km to 33.7 ± 1.7 km for the interferograms shown in Figure 3 and from 33.2 ± 1.6 km to 33.3 ± 1.5 km for the interferograms covering the T1+T2 period shown in Figure 4. These differences can relate to multiple causes, including the different LoS, possible tropospheric effects, and lack of coherence in densely vegetated areas. These factors collectively hampered the accurate geographical location of the LDG endpoints (black dots with white bars in Figure 3a–d and Figure 4).
To reduce the uncertainty, in addition to measuring LDG on individual interferograms, we overlaid all of the interferograms obtained from the ascending and descending orbits and identified the northernmost and southernmost points where evidence of IGD was visible for the different considered periods (T1, T2, and T1+T2). We measured their distance parallel to the average direction of the VBF to obtain a “maximum LGD” (LDGM = 36.3 km), as shown by the black-violet line in Figure 7, including the dotted segments. We further considered a “minimum LDG” (LDGm = 28.7 km) as the distance affected by IGD in all the considered interferograms, as shown by the black-violet line in Figure 7, without the dotted segments. The complete set of LDG measurements is listed in the third column of Figure S5b,d.
Finally, in Figure 8 we compare the LDGM with surface projections of coseismic slip estimates of the major events [3,31]. We notice a good matching between the spatial distribution of the assessed coseismic slip with the maximum spatial distribution of the deforming ground estimated after the interferograms (LDGM). In particular, a good fit is found in the area north of the 24 August 2016 epicenter, where the estimated LDGM closely matches the coseismic slip surface distribution of the 26 October 2016, Mw 5.9, and 30 October 2016, Mw 6.5 events.

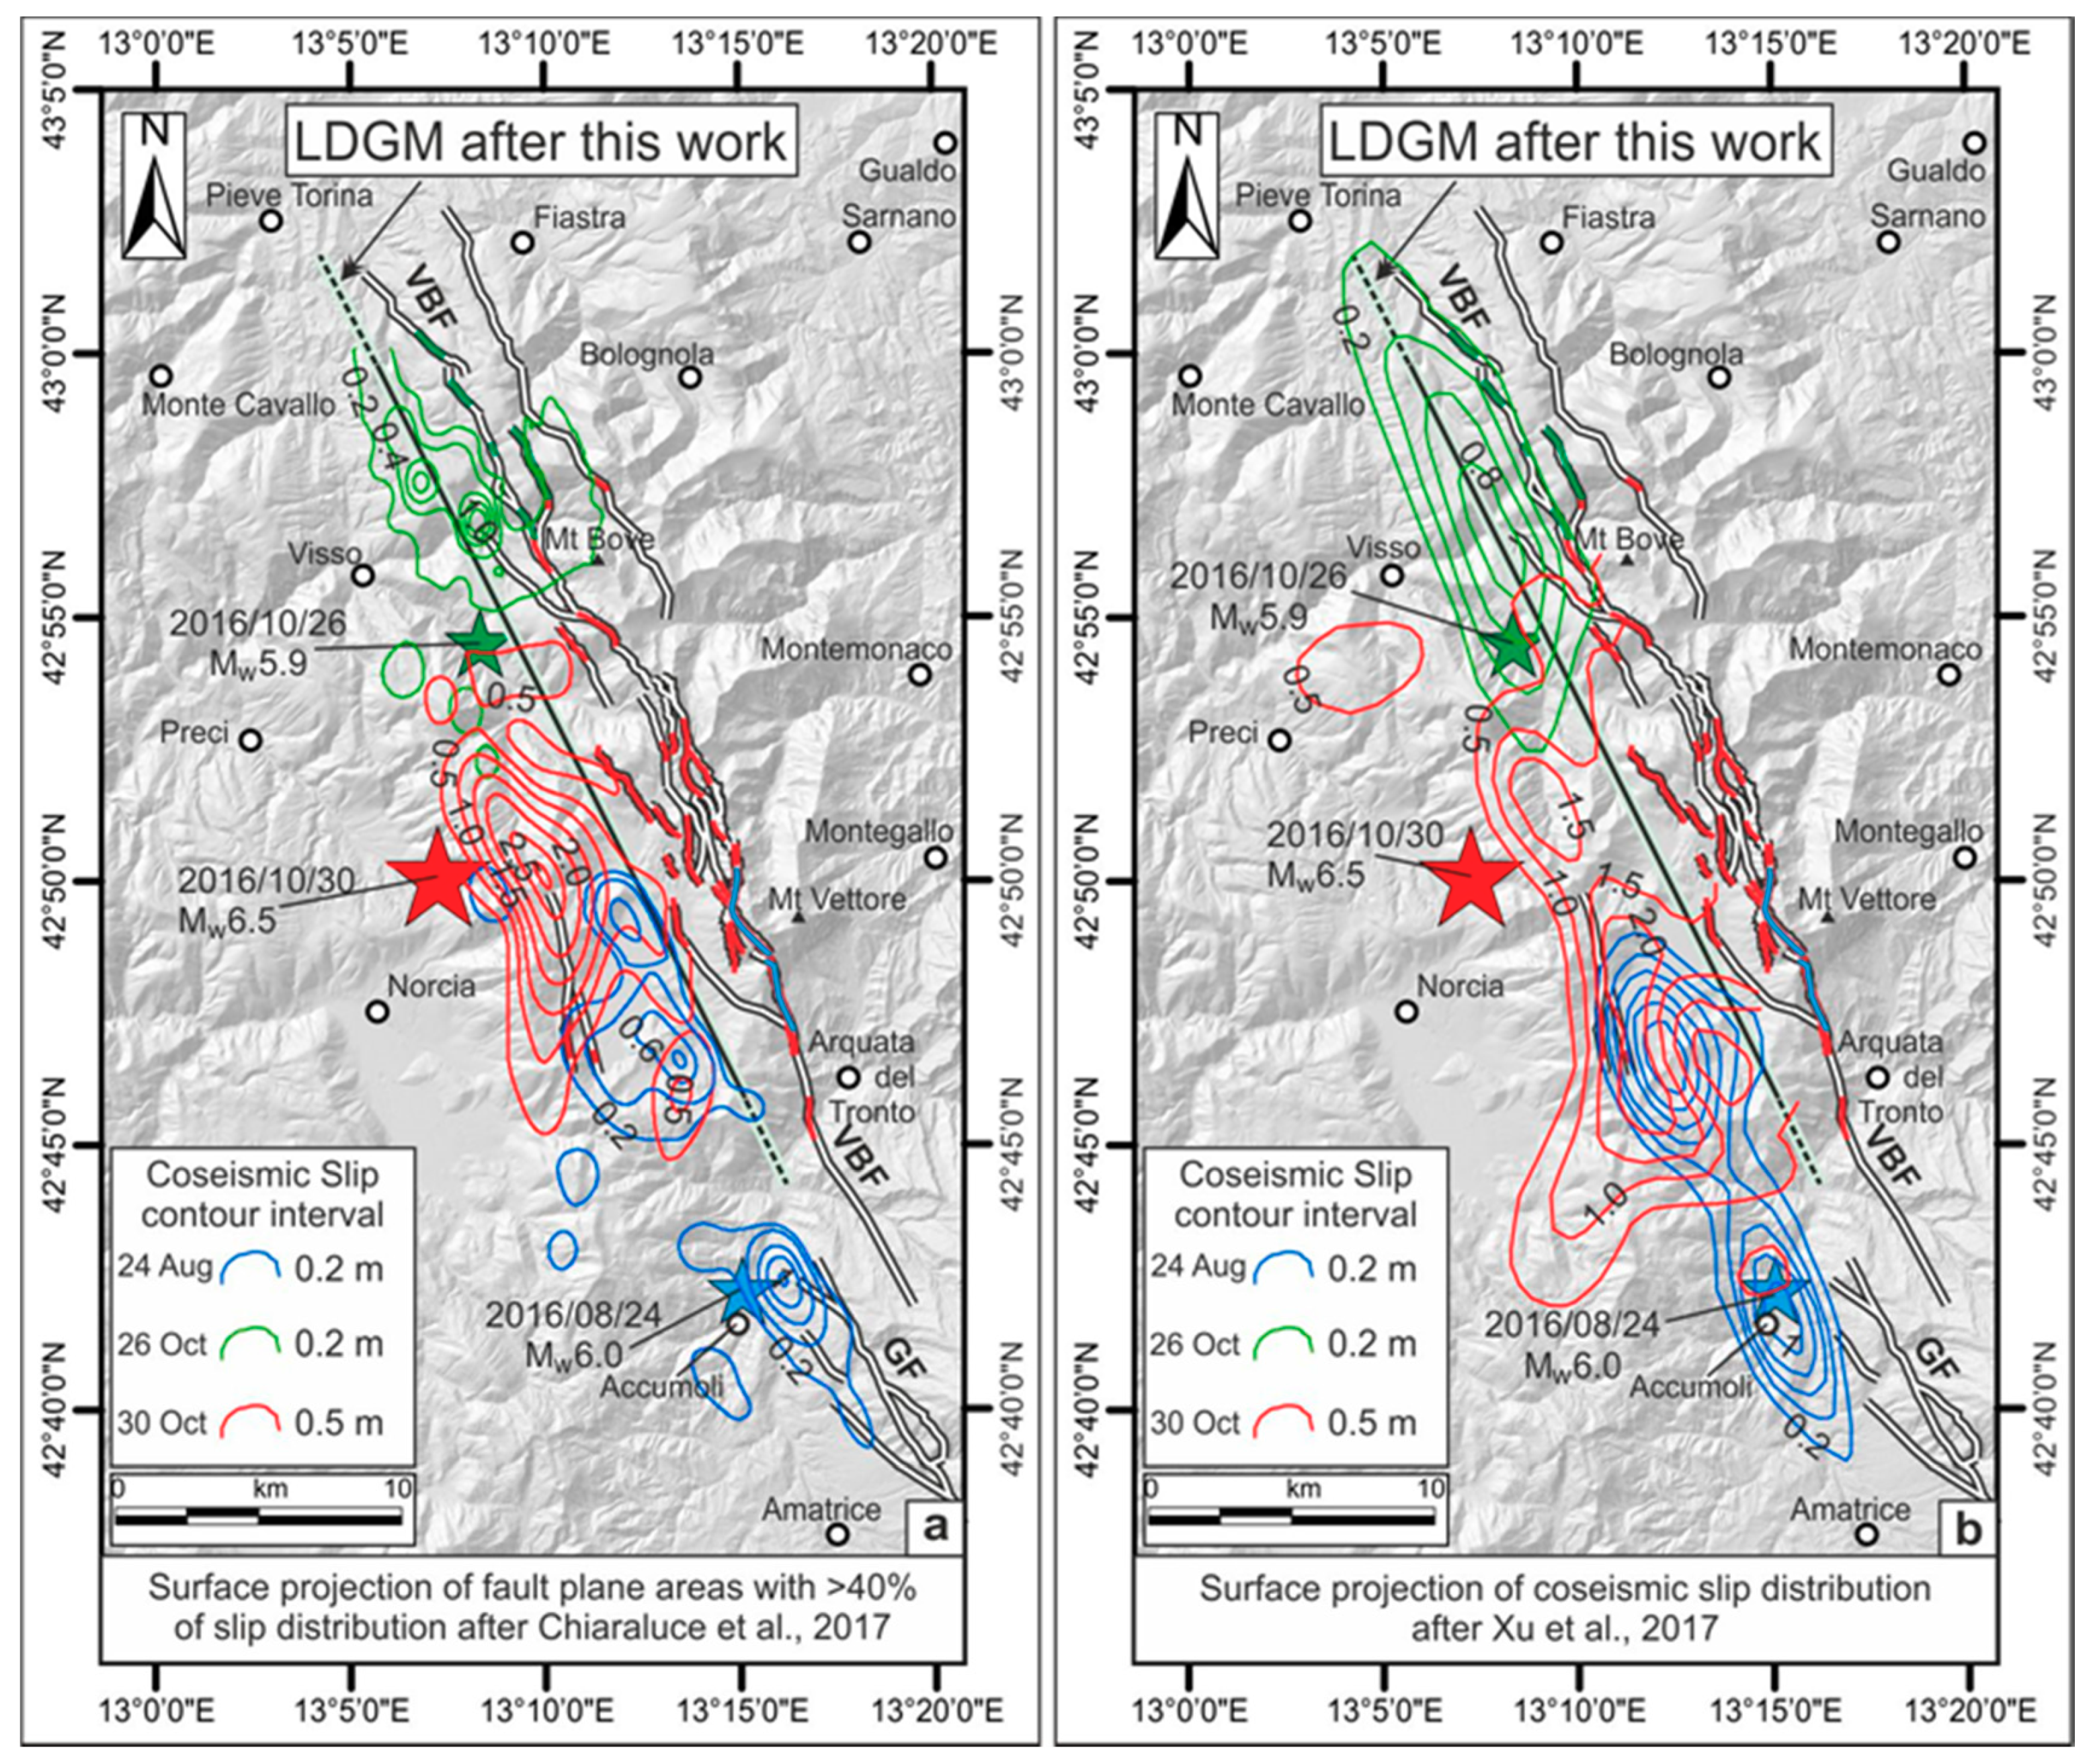
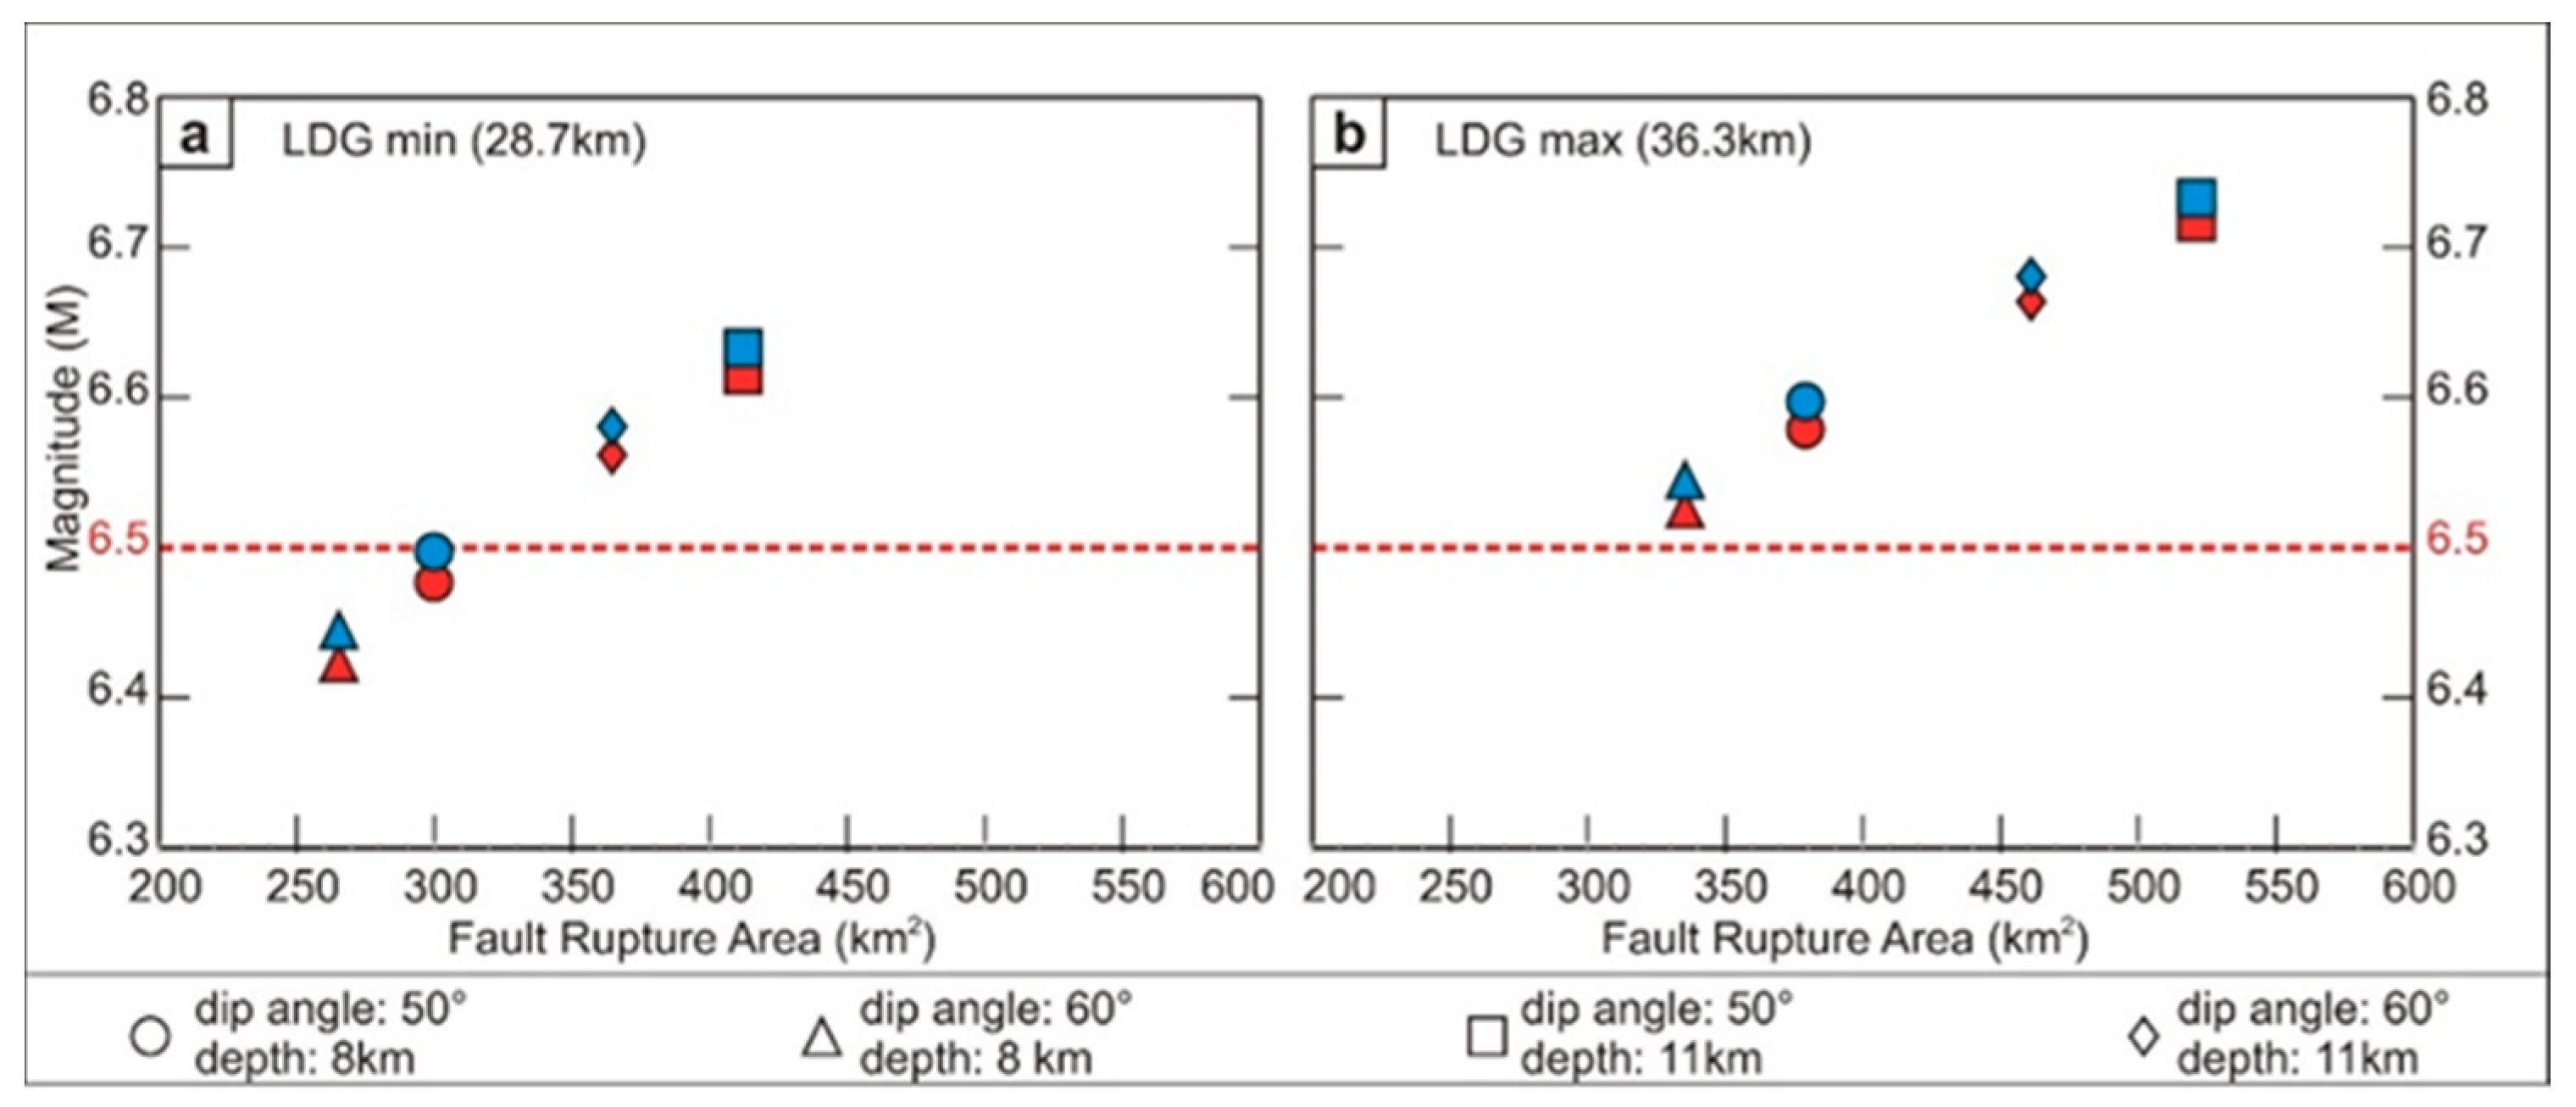
3.4. Assessments of Coseismic Rupture Area and Associate Magnitude

Taking the observed Length of the Deforming Ground (LDG) as equivalent to the expected coseismic SRL and considering, from the field (Figure 2), literature [5,6] and seismological [3,9] data, dip-angles for the VBF of 50° or 60°, a rupture depth of (i) 8 km or (ii) 11 km (based on the considerations explained in Section 2.4), a range which also agrees with the subsurface VBF reconstruction proposed by [32] and modeled by [33], we obtained estimates for the size of the expected coseismic fault rupture area in the range from 265 to 521 km2 (Figure 9, Figure S5).
Then, using the earthquake-scaling relationships, linking the size of the rupture area to the expected earthquake magnitude, proposed by [26] (blue symbols) and [27] (red symbols), we obtained an expected earthquake magnitude of 6.4 ≤ Mw ≤ 6.6, considering a focal depth of 8 km, and 6.5 ≤ Mw ≤ 6.7, considering a focal depth of 11 km (Figure 9, Figure S5). Independent calculations made considering the LDG obtained from all of the single interferograms shown in Figure 3 and Figure 4 resulted in expected earthquake magnitudes of 6.4 ≤ Mw ≤ 6.7 (Figure 9, Figure S5).
Plots showing the magnitude of an anticipated earthquake based on the minimum (LDGm = 28.7 km) and maximum (LDGM = 36.3 km) estimated LDG, taken as a proxy for the expected coseismic Surface Rupture Length (SRL). Magnitude estimates are obtained using two empirical scaling relationships. Different symbols show estimates for different values of the coseismic fault rupture area that depend on the depth of the coseismic rupture (D = 8 and at 11 km) and the fault dip-angle (50° or 60°) chosen according to the criteria provided in Section 2.4.

4. Discussion

Over the last 20 years, two seismic sequences comparable to the 2016 sequence shook the Central Apennines active extensional belt: (i) the 1997 Umbria-Marche sequence [19,20,34,35] and (ii) the 2009 L’Aquila sequence [21,22,36,37,38,39,40]. Both sequences originated on sets of NNW-SSE striking normal faults and were characterized by mainshocks with focal depths in the range of 8–11 km. For the Umbria-Marche sequence, culminating in the 26 September 1997 Mw 6.1 Colfiorito earthquake, field data [34,35] and DInSAR analyses [23] are insufficient to accurately document the post-seismic surface deformation. For the L’Aquila sequence, climaxing at the 6 April 2009 Mw 6.3 earthquake [24,37,38,39], two terrestrial laser scanner measurements performed along and near the fault surface rupture documented a post-seismic surface deformation of ~2.7 cm during the ~4-month period from 8 to 124 days after the Mw 6.3 earthquake [41]. Advanced DInSAR analyses confirmed a cumulative surface deformation of up to −4 cm with a temporal evolution showing a clear exponential decay within about 102 days [42].
To study and analyze the deformations that occurred during the 2016 Central Italy sequence, we preferred DInSAR [15,16] (i.e., construction of single interferograms from pairs of SAR images) to advanced DInSAR [42,43,44] (i.e., construction of time series of the deformation using a large set of images) because of the limited number (eight or nine) of ESA Sentinel-1 images available between the 24 August Mw 6.0 and 26 October Mw 5.9 foreshocks and for the short time period we investigated [45].
Intra-sequence interferograms are more difficult to interpret than coseismic because the magnitude of the deformation is smaller [16,29] and the noise eventually introduced by the atmosphere is difficult to quantify. In fact, our interpretation is based on the deformation patterns, while the quantitative values of deformations obtained after the phase unwrapping are to be considered as deformation scenarios in the case of no disturbances. We produced all the possible interferograms coupling all the available images acquired in T1+T2 along the two orbits and decided to interpret only those that apparently showed a less evident atmospheric contribution [16]. We did not interpret those parts in which disturbances are present and clearly detectable, e.g., the central part of Figure 3c. Furthermore, the asynchronous acquisition (either in sensing day or timing) of the images in ascending and descending mode (Table 1) strengthens the assumption that the similar patterns observed on both orbits are not significantly affected by atmospheric disturbances but can represent phase changes related to surface deformations.
Figure 5 and Figure 6 show some differences, and this could be due to the different LoS. In Figure 5, the satellite is in ascending mode, with a west-east direction shot almost perpendicular to the Mt Vettore fault, while in Figure 6 the satellite is in descending mode and the shot is east-west directed and at an angle with respect to the Mt Vettore fault. As a matter of fact, the two acquisitions are consistently able to intercept different components of the whole displacement.
Compared to the deformation rates measured along the fault that ruptured during the 2009 L’Aquila earthquake (Paganica—Mt Stabiata fault [36,37]), the slip along the VBF during the 2016 intra-sequence period (T1 + T2)—estimated to be up to 6.2 cm during a 2-month period—appears too large to be considered only a post-seismic after-slip of the Mw 6.0 foreshock, even if, theoretically, a contribution to the deformation by this latter process cannot be excluded [46]. It is noteworthy that the only currently available estimates of the 24 August after-slip [47] suggest that it was close to zero in the VBF section along which we collected our displacement data in the field (compare Figure 2a to Figure 9b in [47]).
Additionally, our DInSAR analyses do not show a progressive reduction in the surface deformational rate in the T1+T2 period along the VBF (Figure 3 and Figure 4), which is known to occur during the post-seismic phase of large earthquakes [48,49] and was documented following the 2009 L’Aquila earthquake [41]. Conversely, in the Mt Vettore-Castelluccio di Norcia area, where the surface deformation was greater, the temporal evolution of the IGD exhibited an area increase, and during the T2 period (before the Mw 5.9 and Mw 6.5 events), it continued to expand northward along the VBF, towards the Visso-Ussita area (Figure 3b,d and Figure 7).
Note that the VBF and Paganica-Mt. Stabiata faults show similar geometrical features (strike, average dip-angle, depth of detachment, and thickness of the seismogenic layer inferred by the hypocenter distributions [3,9,21,37]) and displace at the surface, with comparable lithologies. In particular, in their northern trace, they both offset the Umbria-Marche Meso-Cenozoic carbonates, whereas in their southern sections, they displace softer sediments (Late Miocene turbidites and Pleistocene alluvial deposits).
We conclude that the different spatial-temporal patterns of the evolution of the post-seismic deformations show the different behaviors of the two sequences, with the 2009 L’Aquila post-seismic deformation rapidly decreasing and the 2016 Mw 6.0 foreshock post-seismic deformation increasing and widening northward up to the mainshock.
The observation that since the T1 period, and even more during the T2 period, the IGD was largely independent of the coseismic deformation caused by the 24 August foreshock suggests that it cannot be merely attributed to after-slip following the earthquake and that, conversely, it is a consequence of the increasing and spreading strain along the VBF and in the adjacent rock volume. The aforementioned observation fits the estimates of the coseismic stress change induced along the VBF by the 24 August foreshock. In fact, according to [14,47], during the intra-sequence period, a region of highly positive Coulomb stress existed along the full length at the base of the VBF and this stress pattern appears to have contributed to the preparation of the Mw 6.5 earthquake. Ultimately, we interpret the displacements of the IGD in the VBF hanging wall block as an indicator of the forthcoming re-activation of the VBF that happened during the Mw 5.9 and Mw 6.5 earthquakes.

5. Conclusions

Based on the observations and interpretations presented in this work, we suggest that during a seismic sequence with a large, early “foreshock” that produces significant surface deformation (earthquakes with Mw ≥ 5.5 and focal depth <15 km, satisfying the condition in the Central Apennines of Italy), measurement of the deformation around the active fault that generated the earthquake can be used to evaluate the potential occurrence along the fault of new earthquakes of a comparable or larger magnitude than that of the foreshock. Our analysis of the 2016 seismic sequence in the Central Apennines sets the conditions for the application of this interpretive framework.
First, an earthquake E1 of magnitude M1 has to occur along an active fault, producing a surface deformation that is sufficiently large to be detected, e.g., through DInSAR analyses. Second, the maximum expected magnitude Mmax of an earthquake along the active fault has to be greater than M1, indicating that E1 released only part of the fault seismogenic potential. Third, during a short period after E1 (e.g., a few days to several weeks for the Central Apennines extensional belt) the post-seismic surface deformation along and around the active fault has to expand to affect larger volumes of rock (and a larger surface area) around the fault.
Where these conditions are met, we maintain that the possibility of a new earthquake with Mw up to ~Mmax along the active fault is high. The magnitude of the expected earthquake can be estimated from appropriate scaling dependencies linking the earthquake magnitude to the fault rupture area [26,27]. The latter can be determined considering the length of the deforming ground (LDG), a proxy for the expected coseismic surface rupture length, and by obtaining the geometry (i.e., slope, depth) of the active fault from geological and seismological data. In the case of the Central Italy seismic sequence, the 30 October mainshock was Mw 6.5, well in the range (± 0.2) of 6.4 ≤ Mw ≤ 6.7 estimated by applying the aforementioned reasoning (Section 3.4). We conclude that using LDG measurements obtained from intra-sequence interferometric data, confirmed by field evidence, the magnitude of the 30 October earthquake could have been anticipated with a narrow error range.
We conclude that our proposed interpretative framework to aid in making inferences regarding the evolution of active seismic sequences suggests that the ongoing seismicity and the associated progressing surface deformation could lead to stronger earthquakes. If confirmed by other earthquake sequences in the Central Apennines extensional belt, or in other similar extensional seismotectonic environments, the proposed framework could represent a significant step towards the prediction of some destructive earthquakes.

Supplementary Materials

The following are available online at https://www.mdpi.com/2076-3263/10/5/186/s1. Figure S1: Coseismic interferograms for the 24 August, Mw 6.0 foreshock, Figure S2: Coseismic interferograms cumulating the effects of the 26 October Mw 5.9 foreshock and 30 October Mw 6.5 mainshock, Figure S3: Additional field evidence of the intra-sequence (from 24 August to 29 October, 2016) slip deformations along the Mt Vettore-Mt Bove Fault (VBF), Figure S4: Coherence map across the areas shown in Figure 5 and Figure 6, Figure S5: Earthquake magnitude estimates from Length of the Deforming Ground (LDG), plots and Tables. Supplementary Methods 1: DInSAR processing steps.

Author Contributions

F.B. conceived the work. A.C.M. and P.M. performed the DInSAR analyses. F.B., A.C.M., C.P., P.M., and D.C. performed the fieldwork. D.C. prepared the GIS geological database and the figures. G.L. worked on the relationships between LDG and the magnitude of the mainshock. F.B., F.G., A.C.M., and C.P. wrote the manuscript. All authors participated in the interpretation of the DInSAR and field data. All authors have read and agreed to the published version of the manuscript.

Funding

This work was funded by DiSPUTer Departmental Research grants 2018 (Resp. F. Brozzetti and G. Lavecchia).

Acknowledgments

We thank Pablo Blanco (TRE-Altamira) for preparing an interferogram covering the T1+T2 period using the DIAPASON processing chain. We are grateful to Midland Valley-Academic Software Initiative (ASI) and Petroleum Experts who provided us the Move suite software license. Finally, we thank two anonymous referees for the constructive comments that have been useful for improving the manuscript.

Conflicts of Interest

The authors declare no conflict of interest.

Software Used in This Work

Field survey of the coseismic and intra-sequence ground deformations was performed through Fieldmove software (Move™, produced by Midland Valley Exploration Ltd 2018 Glasgow, Scotland UK, and Petroleum Expert Edinburgh, Scotland UK) installed on an Apple IPad-Pro. Figure 1, Figure 2, Figure 3, Figure 4, Figure 5, Figure 6, Figure 7 and Figure 8 and Figures S1–S4 were created using ArcGIS version 10.1 (http://desktop.arcgis.com) and CorelDRAW X4 (https://www.coreldraw.com). Interferograms in Figure 3 and Figure 4 and Figures S1 and S2 were created using the SNAP 5.0 software (http://step.esa.int/main/download/) and the SNAPHU 1.4.2 software (https://web.stanford.edu/group/radar/softwareandlinks/sw/snaphu/). Plots in Figure 7 were created using Microsoft Excel version 2016 (https://products.office.com) for mathematical equations and the area calculation and CorelDRAW X4 (https://www.coreldraw.com). Images of displacement fields in Figure 5 and Figure 6 and Figure S4 were created using the SARscape 5.4 software (https://www.harrisgeospatial.com/SoftwareTechnology/ENVISARscape.aspx).

References

  1. Lavecchia, G.; Castaldo, R.; Nardis, R.; De Novellis, V.; Ferrarini, F.; Pepe, S.; Brozzetti, F.; Solaro, G.; Cirillo, D.; Bonano, M.; et al. Ground deformation and source geometry of the 24 August 2016 Amatrice earthquake (Central Italy) investigated through analytical and numerical modeling of DInSAR measurements and structural-geological data. Geophys. Res. Lett. 2016, 43, 12389–12398. [Google Scholar] [CrossRef]
  2. Tinti, E.; Scognamiglio, L.; Michelini, A.; Cocco, M. Slip heterogeneity and directivity of the ML 6.0, 2016, Amatrice earthquake estimated with rapid finite-fault inversion. Geophys. Res. Lett. 2016, 43, 10745–10752. [Google Scholar] [CrossRef]
  3. Chiaraluce, L.; Di Stefano, R.; Tinti, E.; Scognamiglio, L.; Michele, M.; Casarotti, E.; Cattaneo, M.; De Gori, P.; Chiarabba, C.; Monachesi, G.; et al. The 2016 Central Italy Seismic Sequence: A First Look at the Mainshocks, Aftershocks, and Source Models. Seismol. Res. Lett. 2017, 88, 757–771. [Google Scholar] [CrossRef]
  4. Brozzetti, F.; Boncio, P.; Cirillo, D.; Ferrarini, F.; De Nardis, R.; Testa, A.; Liberi, F.; Lavecchia, G. High-resolution field mapping and analysis of the August–October 2016 coseismic surface faulting (central Italy earthquakes): Slip distribution, parameterization, and comparison with global earthquakes. Tectonics 2019, 38, 417–439. [Google Scholar] [CrossRef] [Green Version]
  5. Calamita, F.; Pizzi, A.; Roscioni, M. I fasci di faglie recenti ed attive di M. Vettore–M. Bove e di M. Castello–M. Cardosa (Appennino Umbro-Marchigiano). In Studi Geologici Camerti; Università di Camerino: Camerino, Italy, 1992; pp. 81–95. Available online: http://193.204.8.201:8080/jspui/handle/1336/552 (accessed on 14 May 2020).
  6. Brozzetti, F.; Lavecchia, G. Seismicity and related extensional stress field: The case of the Norcia seismic zone (Central Italy). Ann. Tecton. 1994, 8, 36–57. [Google Scholar]
  7. Galadini, F.; Galli, P. Paleoseismology of silent faults in the Central Apennines (Italy): The Mt Vettore and Laga Mts. Faults. Ann. Geophys. 2003, 46, 815–836. [Google Scholar]
  8. Boncio, P.; Lavecchia, G.; Pace, B. Defining a model of 3D seismogenic sources for seismic hazard assessment applications: The case of central Apennines (Italy). J. Seismol. 2004, 8, 407–425. [Google Scholar] [CrossRef]
  9. Michele, M.; Di Stefano, R.; Chiaraluce, L.; Cattaneo, M.; De Gori, P.; Monachesi, G.; Latorre, D.; Marzorati, S.; Valoroso, L.; Ladina, C.; et al. The Amatrice 2016 seismic sequence: A preliminary look at the mainshock and aftershocks distribution. Ann. Geophys. 2016, 59. [Google Scholar] [CrossRef]
  10. Sentinel-1 INSAR Performance Study with TOPS Data. Available online: http://insarap.org/ (accessed on 14 May 2020).
  11. COMET Interferograms of the 2016 Apennines Earthquakes and Aftershocks, Italy. Available online: http://comet.nerc.ac.uk/latest-earthquakes-and-eruptions/apennines-earthquakes-aftershocks-italy/ (accessed on 14 May 2020).
  12. Villani, F.; Open EMERGEO Working Group. A database of the coseismic effects following the 30 October 2016 Norcia earthquake in Central Italy. Sci. Data 2018, 5, 180049. [Google Scholar] [CrossRef] [Green Version]
  13. De Guidi, G.; Vecchio, A.; Brighenti, F.; Caputo, R.; Carnemolla, F.; Di Pietro, A.; Lupo, M.; Maggini, M.; Marchese, S.; Messina, D.; et al. Co-seismic displacement on 26 and 30 October 2016 (Mw D 5:9 and 6.5)—Earthquakes in central Italy from the analysis of a local GNSS network. Nat. Hazards Earth Syst. Sci. 2017, 17, 1885–1892. [Google Scholar] [CrossRef] [Green Version]
  14. Mildon, Z.K.; Roberts, G.P.; Faure Walker, J.P.; Iezzi, F. Coulomb stress transfer and fault interaction over millennia on non-planar active normal faults: The Mw 6.5-5.0 seismic sequence of 2016–2017, central Italy. Geophys. J. Int. 2017, 210, 1206–1218. [Google Scholar] [CrossRef]
  15. Salvi, S.; Stramondo, S.; Funning, G.J.; Ferretti, A.; Sarti, F.; Mouratidis, A. The Sentinel-1 mission for the improvement of the scientific understanding and the operational monitoring of the seismic cycle. Remote Sens. Environ. 2012, 120, 164–174. [Google Scholar] [CrossRef]
  16. Massonnet, D.; Feigl, K.; Rossi, M.; Adragna, F. Radar interferometric mapping of deformation in the year after the Landers earthquake. Nature 1994, 369, 227–230. [Google Scholar] [CrossRef]
  17. Goldstein, R.M.; Werner, C.L. Radar interferogram filtering for geophysical application. Geophys. Res. Lett. 1998, 25, 4035–4038. [Google Scholar] [CrossRef] [Green Version]
  18. SNAPHU: Statistical-Cost, Network-Flow Algorithm for Phase Unwrapping. Available online: https://web.stanford.edu/group/radar/softwareandlinks/sw/snaphu/ (accessed on 14 May 2020).
  19. Chiaraluce, L.; Ellsworth, W.L.; Chiarabba, C.; Cocco, M. Imaging the complexity of an active normal fault system: The 1997 Colfiorito (central Italy) case study. J. Geophys. Res. 2003, 108, 1–19. [Google Scholar] [CrossRef]
  20. Chiaraluce, L.; Barchi, M.; Collettini, C.; Mirabella, F.; Pucci, S. Connecting seismically active normal faults with Quaternary geological structures in a complex extensional environment: The Colfiorito 1997 case history (northern Apennines, Italy). Tectonics 2005, 24, TC1002. [Google Scholar] [CrossRef]
  21. Chiaraluce, L.; Valoroso, L.; Piccinini, D.; Di Stefano, R.; De Gori, P. The anatomy of the 2009 L’Aquila normal fault system (central Italy) imaged by high resolution foreshock and aftershock locations. J. Geophys. Res. 2011, 116, B12311. [Google Scholar] [CrossRef]
  22. Lavecchia, G.; Boncio, P.; Brozzetti, F.; De Nardis, R.; Di Naccio, D.; Ferrarini, F.; Pizzi, A.; Pomposo, G. The April 2009 Aquila (Central Italy) Seismic Sequence (Mw6.3): A Preliminary Seismotectonic Picture. In Recent Progress on Earthquake Geology; Guarnieri, P., Ed.; Special Publ.; Nova Sciences Publishers Inc.: New York, NY, USA, 2011. [Google Scholar]
  23. Stramondo, S.; Tesauro, M.; Briole, P.; Sansosti, E.; Salvi, S.; Lanari, R.; Anzidei, M.; Baldi, P.; Fornaro, G.; Avallone, A.; et al. The September 26, 1997 Colfiorito, Italy, earthquakes: Modeled coseismic surface displacement from SAR interferometry and GPS. Geophys. Res. Lett. 1999, 26, 883–886. [Google Scholar] [CrossRef]
  24. De Natale, G.; Crippa, B.; Troise, C.; Pingue, F. Abruzzo, Italy, Earthquakes of April 2009: Heterogeneous Fault-Slip Models and Stress Transfer from Accurate Inversion of ENVISAT-InSAR Data. Bull. Seismol. Soc. Am. 2011, 101, 2340–2354. [Google Scholar] [CrossRef]
  25. Cirella, A.; Piatanesi, A.; Cocco, M.; Tinti, E.; Scognamiglio, L.; Michelini, A.; Lomax, A.; Boschi, E. Rupture history of the 2009 L’Aquila (Italy) earthquake from non-linear joint inversion of strong motion and GPS data. Geophys. Res. Lett. 2009, 36, L19304. [Google Scholar] [CrossRef]
  26. Wells, D.L.; Coppersmith, J. New empirical relationships among magnitude, rupture length, rupture width, rupture area, and surface displacement. Bull. Seismol. Soc. Am. 1994, 84, 974–1002. [Google Scholar]
  27. Leonard, M. Earthquake fault scaling: Selfconsistent relating of rupture length, width, average displacement and moment release. Bull. Seismol. Soc. Am. 2010, 100, 1971–1988. [Google Scholar] [CrossRef]
  28. Stirling, M.; Goded, T.; Berryman, K.; Litchfield, N. Selection of earthquake scaling relationships for seismic hazard analysis. Bull. Seismol. Soc. Am. 2013, 103, 1–19. [Google Scholar] [CrossRef]
  29. Tolomei, C.; Salvi, S.; Merryman Boncori, J.P.; Pezzo, G. InSAR measurement of crustal deformation transients during the earthquake preparation processes: A review. Boll. Geofis. Teor. Appl. 2015, 56, 151–166. [Google Scholar] [CrossRef]
  30. Chiarabba, C.; De Gori, P.; Cattaneo, M.; Spallarossa, D.; Segou, M. Faults geometry and the role of fluids in the 2016–2017 Central Italy seismic sequence. Geophys. Res. Lett. 2018, 45, 6963–6971. [Google Scholar] [CrossRef] [Green Version]
  31. Xu, G.; Xu, C.; Wen, Y.; Jiang, G. Source parameters of the 2016-2017 Central Italy Earthquake Sequence from the Sentinel-1, ALOS-2 and GPS data. Remote Sens. 2017, 9, 1182. [Google Scholar] [CrossRef] [Green Version]
  32. Porreca, M.; Minelli, G.; Ercoli, M.; Brobia, A.; Mancinelli, P.; Cruciani, F.; Giorgetti, C.; Carboni, F.; Mirabella, F.; Cavinato, G.; et al. Seismic reflection profiles and subsurface geology of the area interested by the 2016–2017 earthquake sequence (Central Italy). Tectonics 2018, 37, 1116–1137. [Google Scholar] [CrossRef]
  33. Mancinelli, P.; Porreca, M.; Pauselli, C.; Minelli, G.; Barchi, M.R.; Speranza, F. Gravity and Magnetic Modeling of Central Italy: Insights into the Depth Extent of the Seismogenic Layer. Geochem. Geophys. Geosyst. 2019, 20, 2157–2172. [Google Scholar] [CrossRef]
  34. Vittori, E.; Deiana, G.; Esposito, E.; Ferreli, L.; Marchegiani, L.; Mastrolorenzo, G.; Michetti, A.M.; Porfido, S.; Serva, L.; Simonelli, A.L.; et al. Ground effects and surface faulting in the September-October 1997 Umbria-Marche (Central Italy) seismic sequence. J. Geodyn. 2000, 29, 535–564. [Google Scholar] [CrossRef]
  35. Cello, G.; Deiana, G.; Ferelli, L.; Marchegiani, L.; Maschio, L.; Mazzoli, S.; Michetti, A.; Serva, L.; Tondi, E.; Vittori, T. Geological constraints for earthquake faulting studies in the Colfiorito area (Central Italy). J. Seismol. 2000, 4, 357–364. [Google Scholar] [CrossRef]
  36. Boncio, P.; Pizzi, A.; Brozzetti, F.; Pomposo, G.; Lavecchia, G.; Di Naccio, D.; Ferrarini, F. Coseismic ground deformation of the 6 April 2009 L’Aquila earthquake (Central Italy, Mw 6.3). Geophys. Res. Lett. 2010, 37, L06308. [Google Scholar] [CrossRef]
  37. Lavecchia, G.; Ferrarini, F.; Brozzetti, F.; De Nardis, R.; Boncio, P.; Chiaraluce, L. From surface geology to aftershock analysis: Constraints on the geometry of the L’Aquila 2009 seismogenic fault system. Ital. J. Geosci. 2012, 131, 330–347. [Google Scholar] [CrossRef]
  38. Lavecchia, G.; Adinolfi GM de Nardis, R.; Ferrarini, F.; Cirillo DBrozzetti De Matteis, R.; Festa, G.; Zollo, A. Multidisciplinary inferences on a newly recognized active east-dipping extensional system in Central Italy. Terra Nova 2017, 29, 77–89. [Google Scholar] [CrossRef] [Green Version]
  39. Ferrarini, F.; Lavecchia, G.; de Nardis, R.; Brozzetti, F. Fault geometry and active stress from earthquakes and field geology data analysis: The Colfiorito 1997 and L’Aquila 2009 cases (Central Italy). Pure Appl. Geophys. 2015, 172, 1079–1103. [Google Scholar] [CrossRef]
  40. Castaldo, R.; de Nardis, R.; DeNovellis, V.; Ferrarini, F.; Lanari, R.; Lavecchia, G.; Pepe, S.; Solaro, G.; Tizzani, P. Coseismic stress and strain field changes investigation through 3-D Finite Element modeling of DInSAR and GPS measurements and geological/seismological data: The L’Aquila (Italy) 2009 earthquake case study. J. Geophys. Res. Solid Earth 2018, 123, 4193–4222. [Google Scholar] [CrossRef]
  41. Wilkinson, M.; McCaffrey KJ, W.; Roberts, G.; Cowie, P.A.; Phillips, R.J.; Michetti, A.M.; Vittori, E.; Guerrieri, L.; Blumetti, A.M.; Bubeck, A.; et al. Partitioned post seismic deformation associated with the 2009 Mw 6.3 L’Aquila earthquake surface rupture measured using a terrestrial laser scanner. Geophys. Res. Lett. 2010, 37, L10309. [Google Scholar] [CrossRef] [Green Version]
  42. Lanari, R.; Berardino, P.; Bonano, M.; Casu, F.; Manconi, A.; Manunta, M.; Manzo, M.; Pepe, A.; Pepe, S.; Sansosti, E.; et al. Surface displacements associated with the L’Aquila 2009 Mw 6.3 earthquake (central Italy): New evidence from SBAS-DInSAR time series analysis. Geophys. Res. Lett. 2010, 37, L20309. [Google Scholar] [CrossRef]
  43. Chen, C.W.; Zebker, H.A. Phase unwrapping for large SAR interferograms: Statistical segmentation and generalized network models. IEEE Trans. Geosci. Remote Sens. 2002, 40, 1709–1719. [Google Scholar] [CrossRef] [Green Version]
  44. Scheiber, R.; Moreira, A. Coregistration of Interferometric SAR Images Using Spectral Diversity. IEEE Trans. Geosci. Remote Sens. 2000, 38, 2179–2191. [Google Scholar] [CrossRef]
  45. Barra, A.; Monserrat, O.; Mazzanti, P.; Esposito, C.; Crosetto, M.; Scarascia Mugnozza, G. First insights on the potential of Sentinel-1 for landslides detection. Geomat. Nat. Hazards Risk 2016, 7, 1874–1883. [Google Scholar] [CrossRef] [Green Version]
  46. Albano, M.; Saroli, M.; Moro, M.; Falcucci, E.; Gori, S.; Stramondo, S.; Galadini, F.; Barba, S. Minor shallow gravitational component on the Mt. Vettore surface ruptures related to MW 6, 2016 Amatrice earthquake. Ann. Geophys. 2016, 59. [Google Scholar] [CrossRef]
  47. Walters, R.J.; Gregory, L.C.; Wedmore, L.N.; Craig, T.J.; McCaffrey, K.; Wilkinson, M.; Chen, J.; Li, Z.; Elliott, J.R.; Goodall, H.; et al. Dual control of fault intersections on stop-start rupture in the 2016 Central Italy seismic sequence. Earth Planet. Sci. Lett. 2018, 500, 1–14. [Google Scholar] [CrossRef]
  48. Bucknam, R.C.; Plafker, G.; Sharp, R.V. Fault movement (afterslip) following the Guatemala earthquake of February 4, 1976. Geology 1978, 6, 170–173. [Google Scholar] [CrossRef]
  49. Marone, C.J.; Scholz, C.H.; Bilham, R. On the mechanics of earthquake afterslip. J. Geophys. Res. 1991, 96, 8441–8452. [Google Scholar] [CrossRef]
Figure 1. Seismicity along the Mt Vettore-Mt Bove Fault (VBF) and the associated coseismic deformation caused by the 2016 Central Italy seismic sequence. The inset shows the location of the study area in the Central Apennines of Italy. In the maps, the thick black lines show the trace of the VBF, with coseismic surface ruptures caused by (a) the 24 August Mw 6.0 (thick blue lines) and 26 October, Mw 5.9 (thick green lines) foreshocks and (b) 30 October Mw 6.5 mainshock (thick red lines). Stars locate the epicenters of the Mw 6.0 and Mw 5.9 foreshocks (blue and green star in a respectively) and the Mw 6.5 mainshock (the red star in b); the corresponding focal solutions are also shown. Small dots in (a) represent the relocated epicenters 0.7 < Mw < 4.8 during the 3-day period after the 24 August (blue dots) and 26 October (green dots) foreshocks and the 30 October Mw 6.5 mainshock, red dots in (b). The source of the seismological data is [3]. Thin contour lines in (a) show interferometric fringes redrawn from the European Space Agency’s (ESA) SEOM Programme InSARap project [10] coseismic interferogram obtained from ESA Sentinel-1 images taken on 21 and 27 August 2016 along ascending relative orbit 117 (blue lines), the Centre for Observation & Modelling of Earthquakes, Volcanoes & Tectonics (COMET) [11] interferogram obtained from ESA Sentinel-1 images taken on 21 and 27 October 2016, along an ascending orbit (green lines) and in (b) the InSARap project [10] coseismic interferogram obtained from ESA Sentinel-1 images taken on 27 October and 2 November 2016 along ascending relative orbit 44 (thin black lines).
Geosciences 10 00186 g001
Figure 2. Field evidence of intra-sequence slip deformations along the Mt Vettore-Mt Vettoretto segment of the Mt Vettore-Mt Bove Fault (VBF), from 24 August to 29 October 2016. This fault segment was not reactivated during the Mw 5.9, 26 October event. (a) Location of survey sites where the total displacement due to Intra-sequence Ground Deformation (IGD, in mm) was measured on composite free faces. The inset shows the temporal trend of deformation where the VBF crosses Forca di Presta Provincial road SP34 (site #29). (b) Panoramic view of the free face exhumed along the VBF fault scarp (sites from #35 to #60). (c,d) Details of composite free faces documenting the 24 August‒30 October slip-history along the VBF: (A) Upper band showing the coseismic slip caused by the 24 August Mw 6.0 foreshock; (B) Intermediate band showing the intra-sequence slip, between 24 August and 29 October 2016; (C) Lower (and thicker) band showing the coseismic deformation caused by the Mw 6.5 mainshock.
Geosciences 10 00186 g002
Figure 3. Phase changes detected before the occurrence of the Mw 5.9 foreshock during periods T1 (left) and T2 (right) as defined in text and Table 1. Interferograms were prepared using ESA Sentinel-1 images taken along relative ascending orbit 117 (a,b) and relative descending orbit 22 (c,d). We traced the interferometric fringes (white dotted lines) whose continuity is interrupted by low-coherence areas. The black dots mark endpoints of the segment delimiting the Length of Deforming Ground (LDG), and the corresponding white tapes show estimates of the endpoint location errors. One cycle of colors corresponds to one interferometric fringe (thicker white dotted lines) ~2.8 cm along the satellite Line of Sight (LoS). The thick black lines show the traces of the VBF. The colors show the patterns of phase changes around the VBF during the two intra-sequence periods, T1 and T2. C. d. N. = Castelluccio di Norcia.
Geosciences 10 00186 g003
Figure 4. Same as Figure 3but covering the entire period before the Mw 5.9 foreshock: T1+T2 period. (a) interferogram prepared from ascending orbit data between 27 August and 26 October, (b) interferogram prepared from descending orbit data between 2 September and 26 October.
Geosciences 10 00186 g004
Figure 5. Displacement field obtained for the study area during the T1+T2 period along the ascending orbit. (a) Relative displacement field computed over high-coherence areas. The traces of the Vettore-Bove (VBF) and northern Gorzano (GF) fault are shown as black lines. (b,c) high-coherence sample areas selected to test the reliability of the observed displacement compared to the IGD detected in the interferograms of Figure 3 in the northern (b) and southern (c) sector of the VBF hanging wall and used to determine the Length of Deforming Ground (LDG). A coherence map of the area is provided in Figure S4a–c. The profiles (traces in b and c) show the displacements observed across the VBF whose intersection and sense of slip are indicated by the red vertical line.
Geosciences 10 00186 g005
Figure 6. Same as Figure 5 but computed along the descending orbit. (a) Relative displacement field computed over high-coherence areas. The traces of the Vettore-Bove (VBF) and northern Gorzano (GF) fault are shown as black lines. (b,c) same high-coherence sample areas shown in Figure 5 showing results from the descending orbit. A coherence map of the area is provided in Figure S4d–f.
Geosciences 10 00186 g006
Figure 7. Coseismic and intra-sequence deformations compared to the spatial evolution of seismicity and major earthquake epicenters. (a) Map showing Length of Deforming Ground (LDG) (black-violet line) in the hanging wall of the Mt Vettore-Mt Bove Fault (VBF) as interpreted from the Intra-sequence Ground Deformation (IGD) pattern shown in the interferograms in Figure 3 and Figure 4. The continuous black-violet line shows the minimum extent of the LDG (LDGm), whereas the continuous black-violet line plus dotted segments shows the maximum extent of LDG (LDGM) (Section 2.3). A comparison to Figure 3a,c shows that during the first intra-sequence period (T1, from 27 August to 26 September), the IGD was already affecting a large part of the VBF hanging wall. The LDG anticipated the extent of the (future) surface rupture caused by the Mw 5.9 foreshock and Mw 6.5 mainshock (red and green lines along the VBF trace). The colored areas show envelopes of seismicity for different periods. The black line beneath the map shows the true length of the section, delimited by the two VBF tip points. The vertical bars with rectangles mark the position along this section of the northern boundary of the epicentral area 48 hours after the Mw 6.0 foreshock (NB48h) at the end of the T1 period (NBT1end) and at the end of the T2 period (NBT2end). (b) Coseismic displacements caused by the 24 August, Mw 6.0 foreshock (light-blue line) and 30 October, Mw 6.5 mainshock (red line) obtained from the displacement fields reported in [1]. These displacements are computed along the same section where we measured LDG. (c) Intra-sequence displacements for the T1+T2 period computed from the ascending interferogram in Figure 5 (upper plot) and the descending interferogram in Figure 6 (lower plot) along the profile P-P’. The profile P-P’ was traced in order to cross high coherence areas (a detailed trace in Figure S4), and for this reason, it is very close to, but not exactly coincident with, the section along which the graphs of the b panel have been calculated.
Geosciences 10 00186 g007
Figure 8. Maximum extent of LDG (LDGM) compared with surface projections of coseismic slip distribution of major events occurring on the VBF fault plane after [3] (a) and [31] (b). Blue contour lines locate the slip estimates for the 24 August 2016 event, green contour lines locate slip estimates for the 26 October 2016 event, red contour lines locate slip estimates for the 30 October 2016 event. Black rimmed white lines locate VBF fault segments. Colored strips along VBF show the coseismic surface ruptures according to Figure 1. Stars: epicenters of the mainshock.
Geosciences 10 00186 g008
Figure 9. Earthquake magnitude estimates from Length of the Deforming Ground (LDG). (a) earthquake magnitude is estimated using LDG minimum, (b) earthquake magnitude is estimated using LDG maximum.
Geosciences 10 00186 g009
Table 1. Data used in this work and time periods corresponding to the T1 and T2 intervals for each orbit.
OrbitSensing Date and Time (UTC)Reference Period
22 Descending02 September 2016, 05:11:44T1 start
22 Descending26 September 2016, 05:11:18T1 end, T2 start
22 Descending26 October 2016, 05:10:43T2 end
117 Ascending27 August 2016, 17:05:43T1 start
117 Ascending26 September 2016, 17:05:11T1 end, T2 start
117 Ascending26 October 2016, 17:05:53T2 end

