What Pulsating H2 Emissions Suggest about the H2 Resource in the Sao Francisco Basin of Brazil
Abstract
1. Introduction
2. Analysis
2.1. Site Characterisics
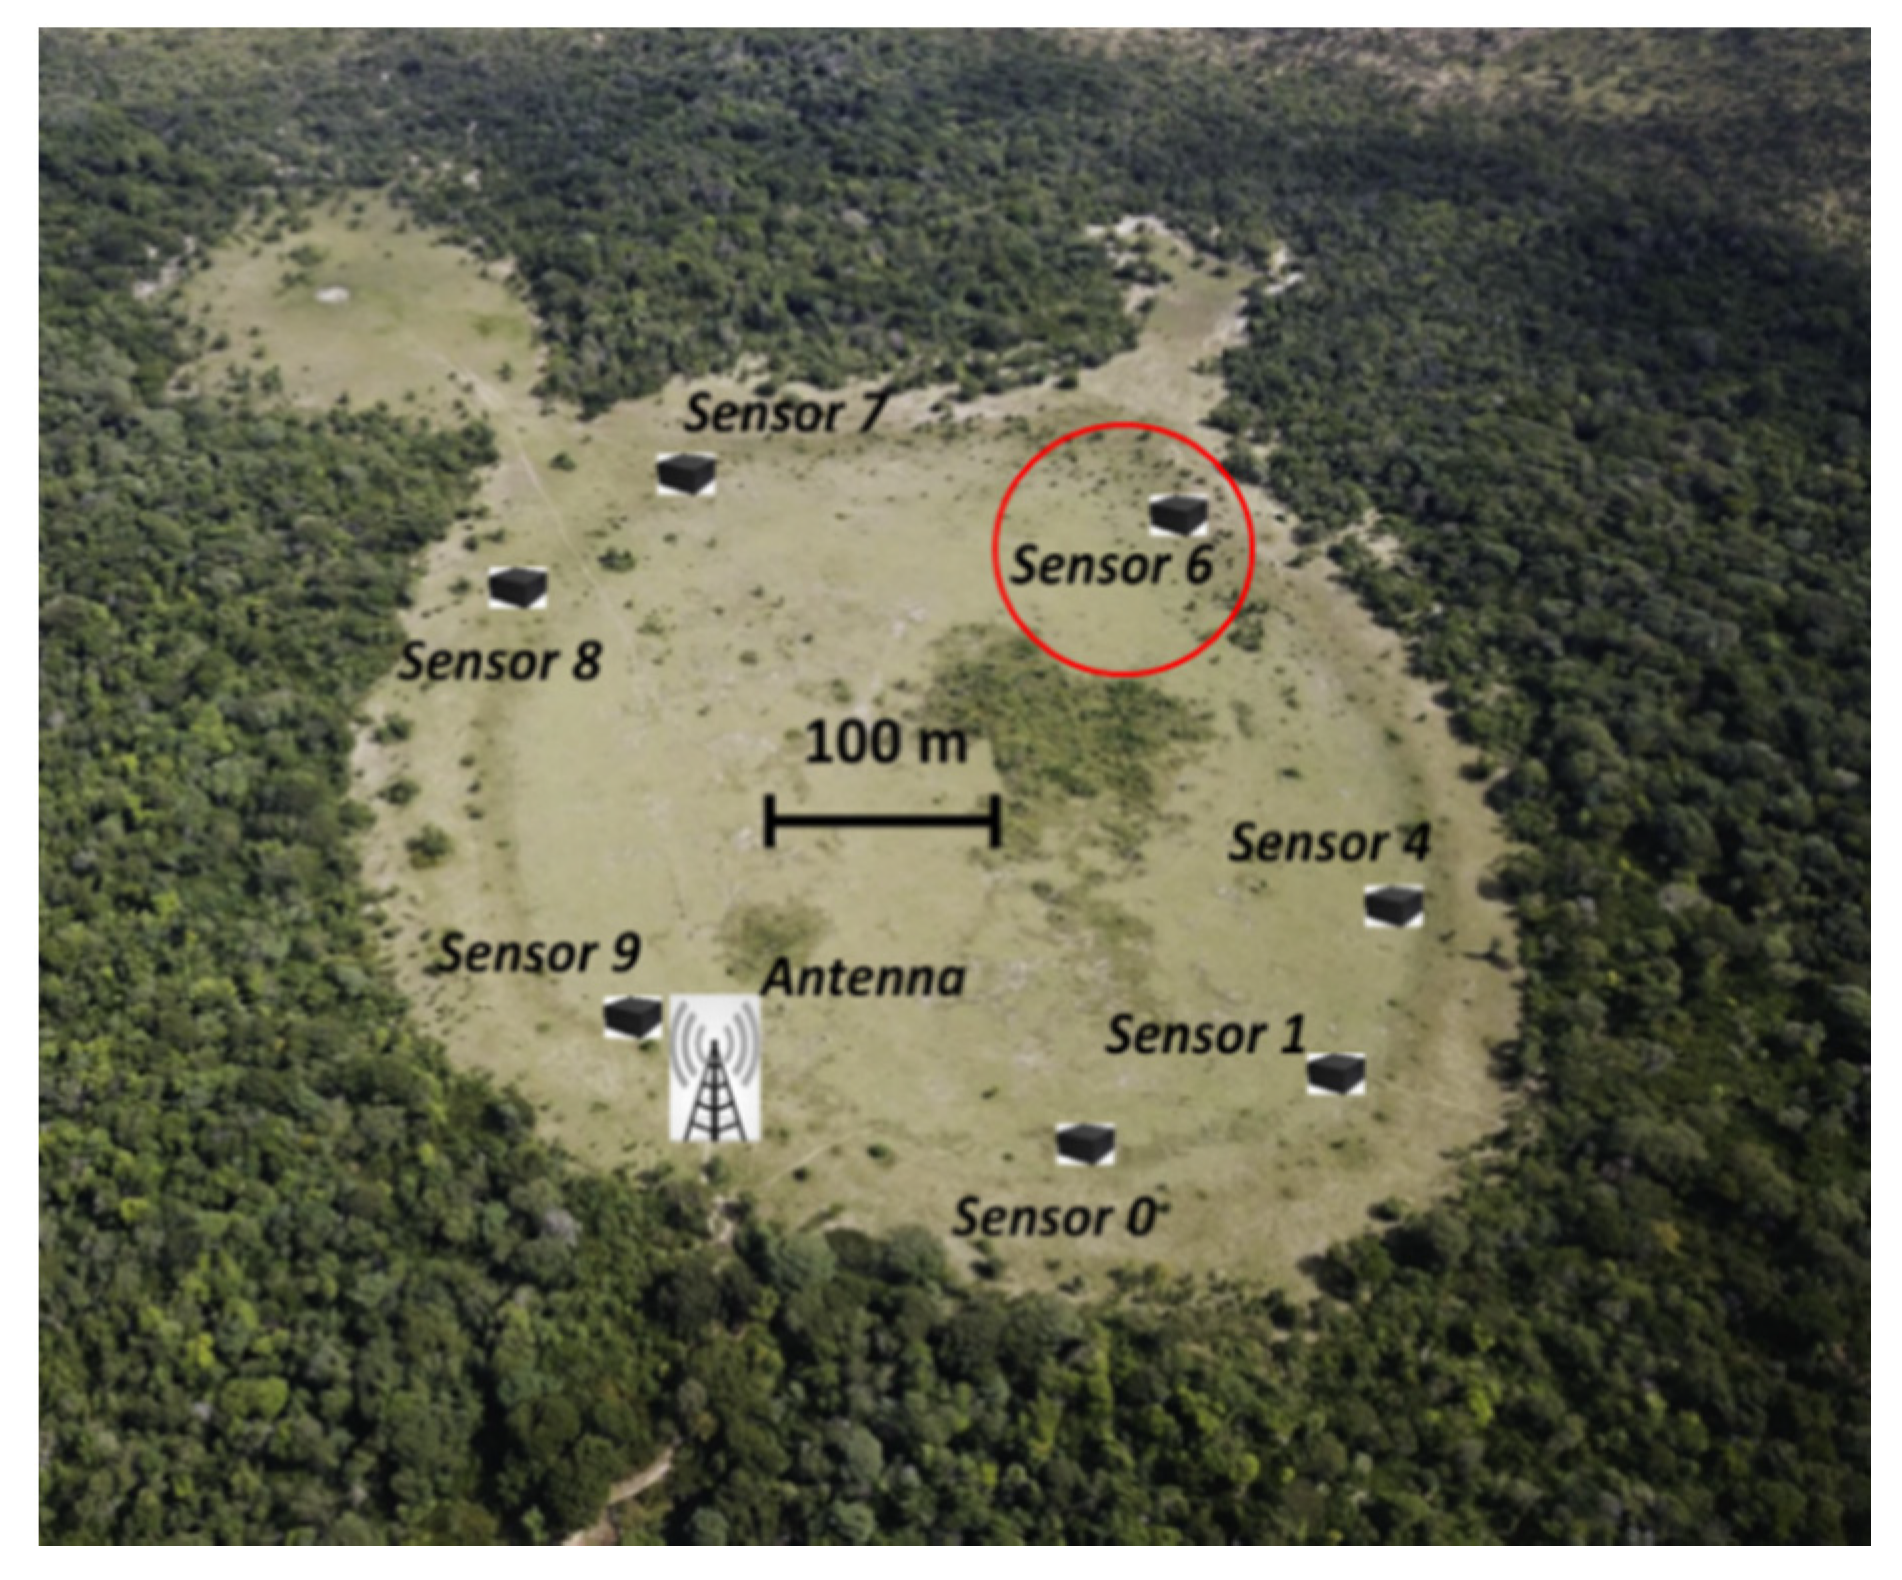
2.1.1. The Study Site
2.1.2. Daily Variations in T
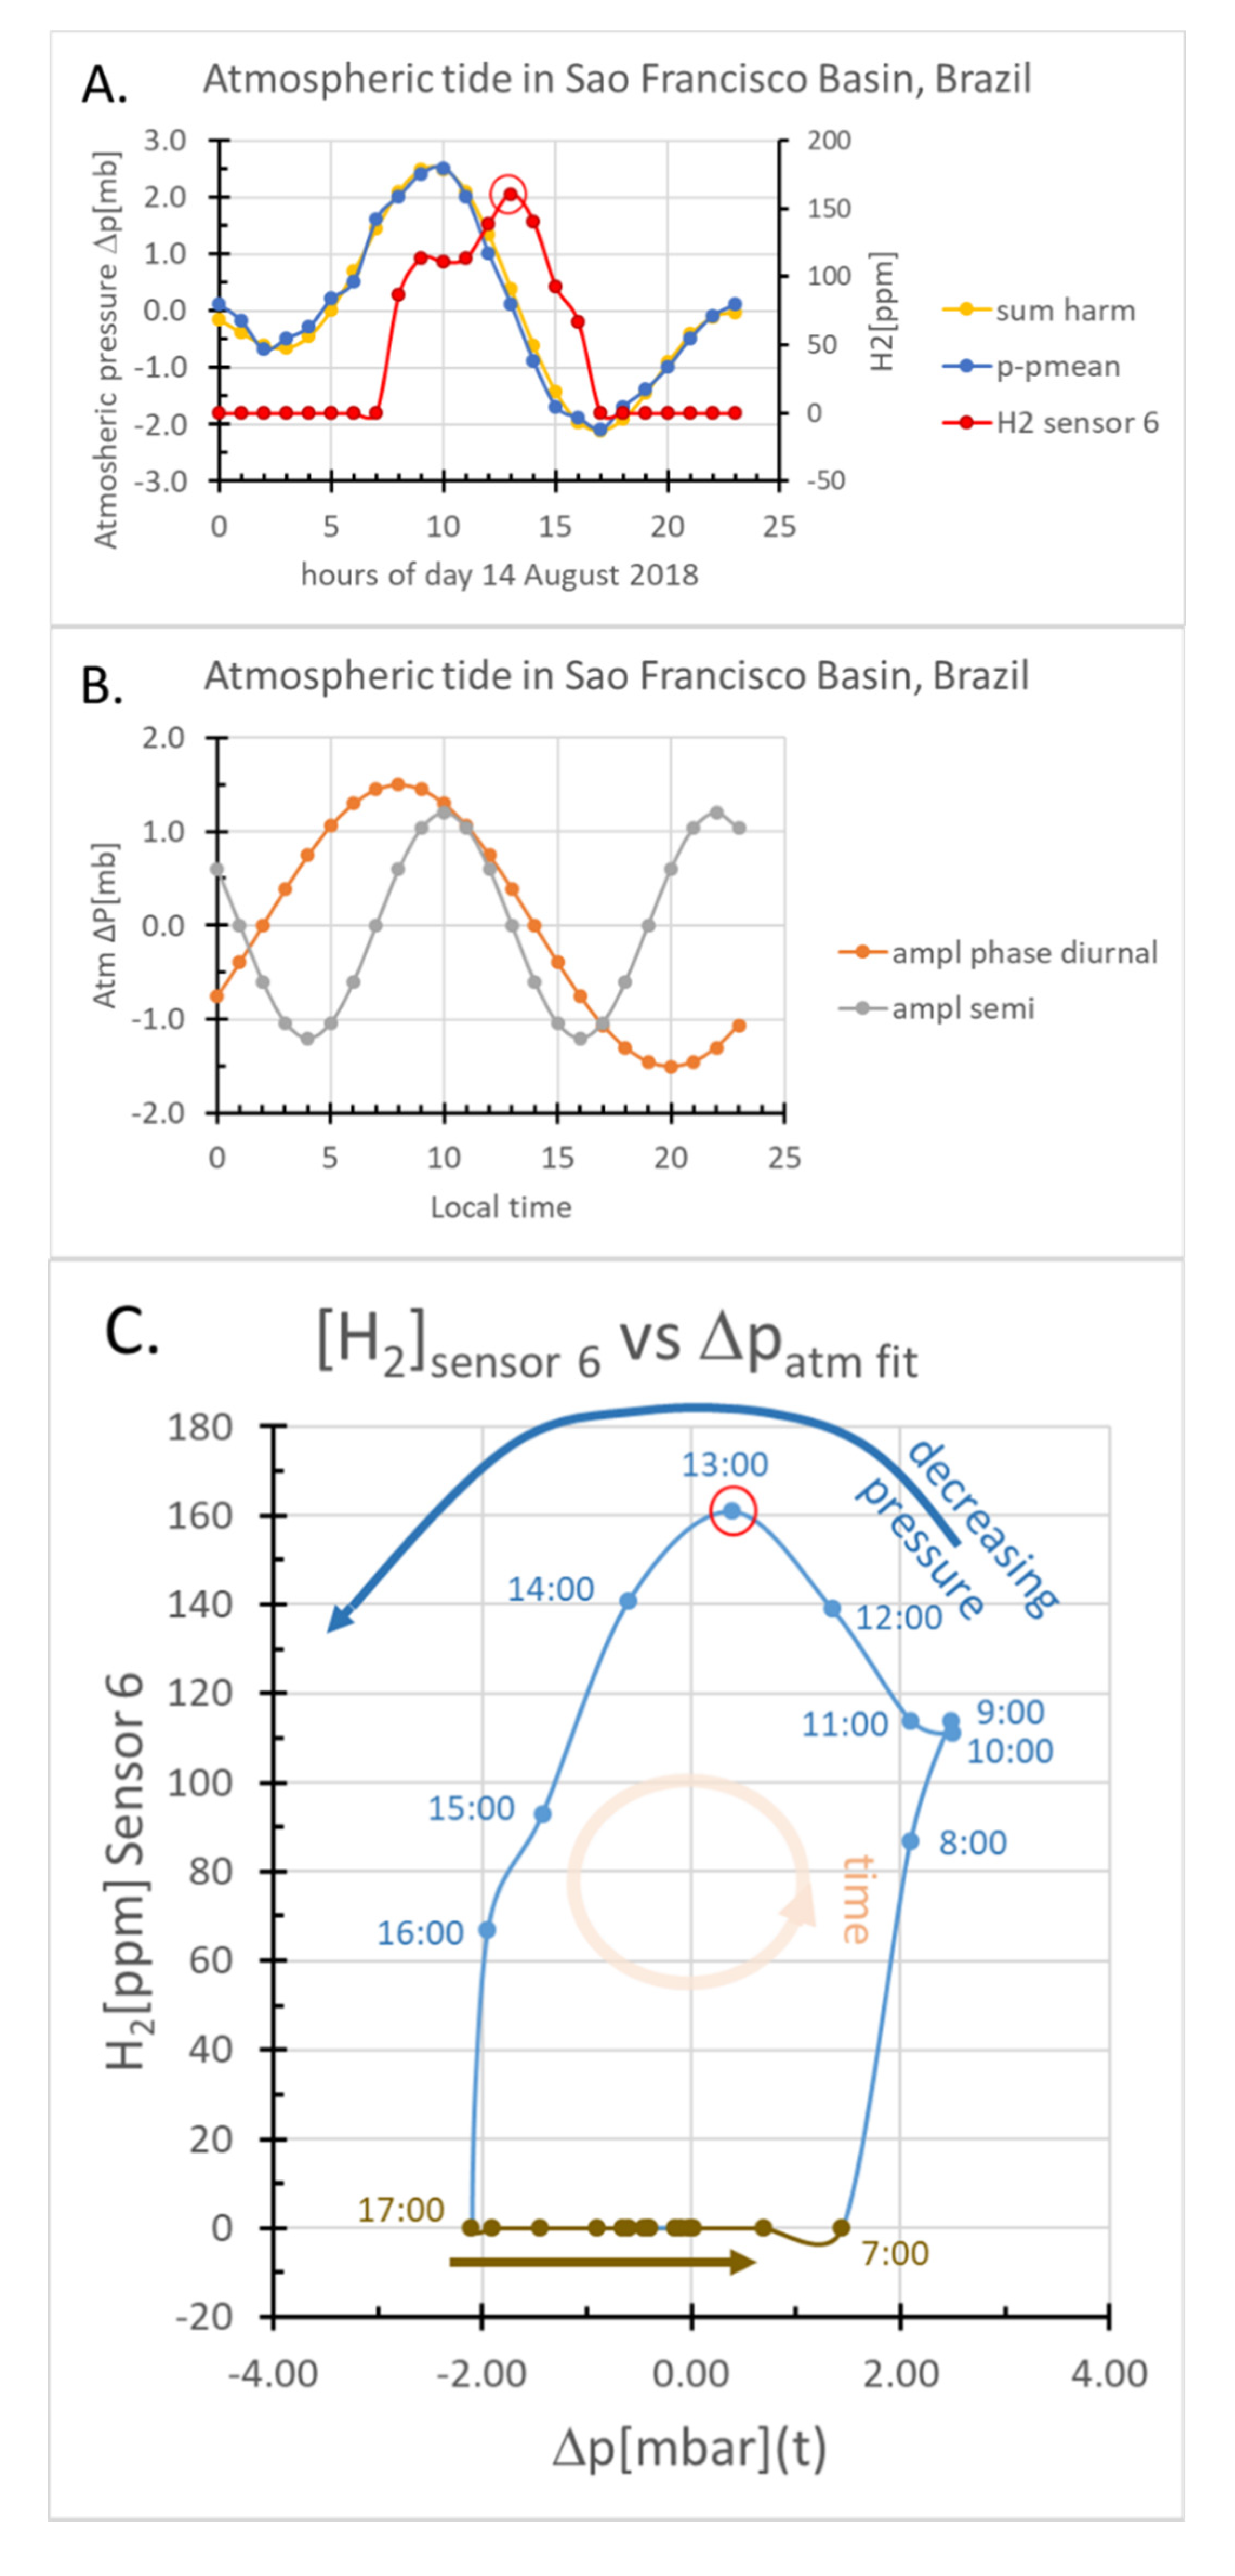
2.1.3. Daily Variations in Atmospheric Pressure
2.2. Theoretical Analysis
Thermal and Pressure Wave Propagation into the Subsurface
2.3. Site Analysis
2.3.1. The Minimum Criterion for [H2]Station-6 Modulation
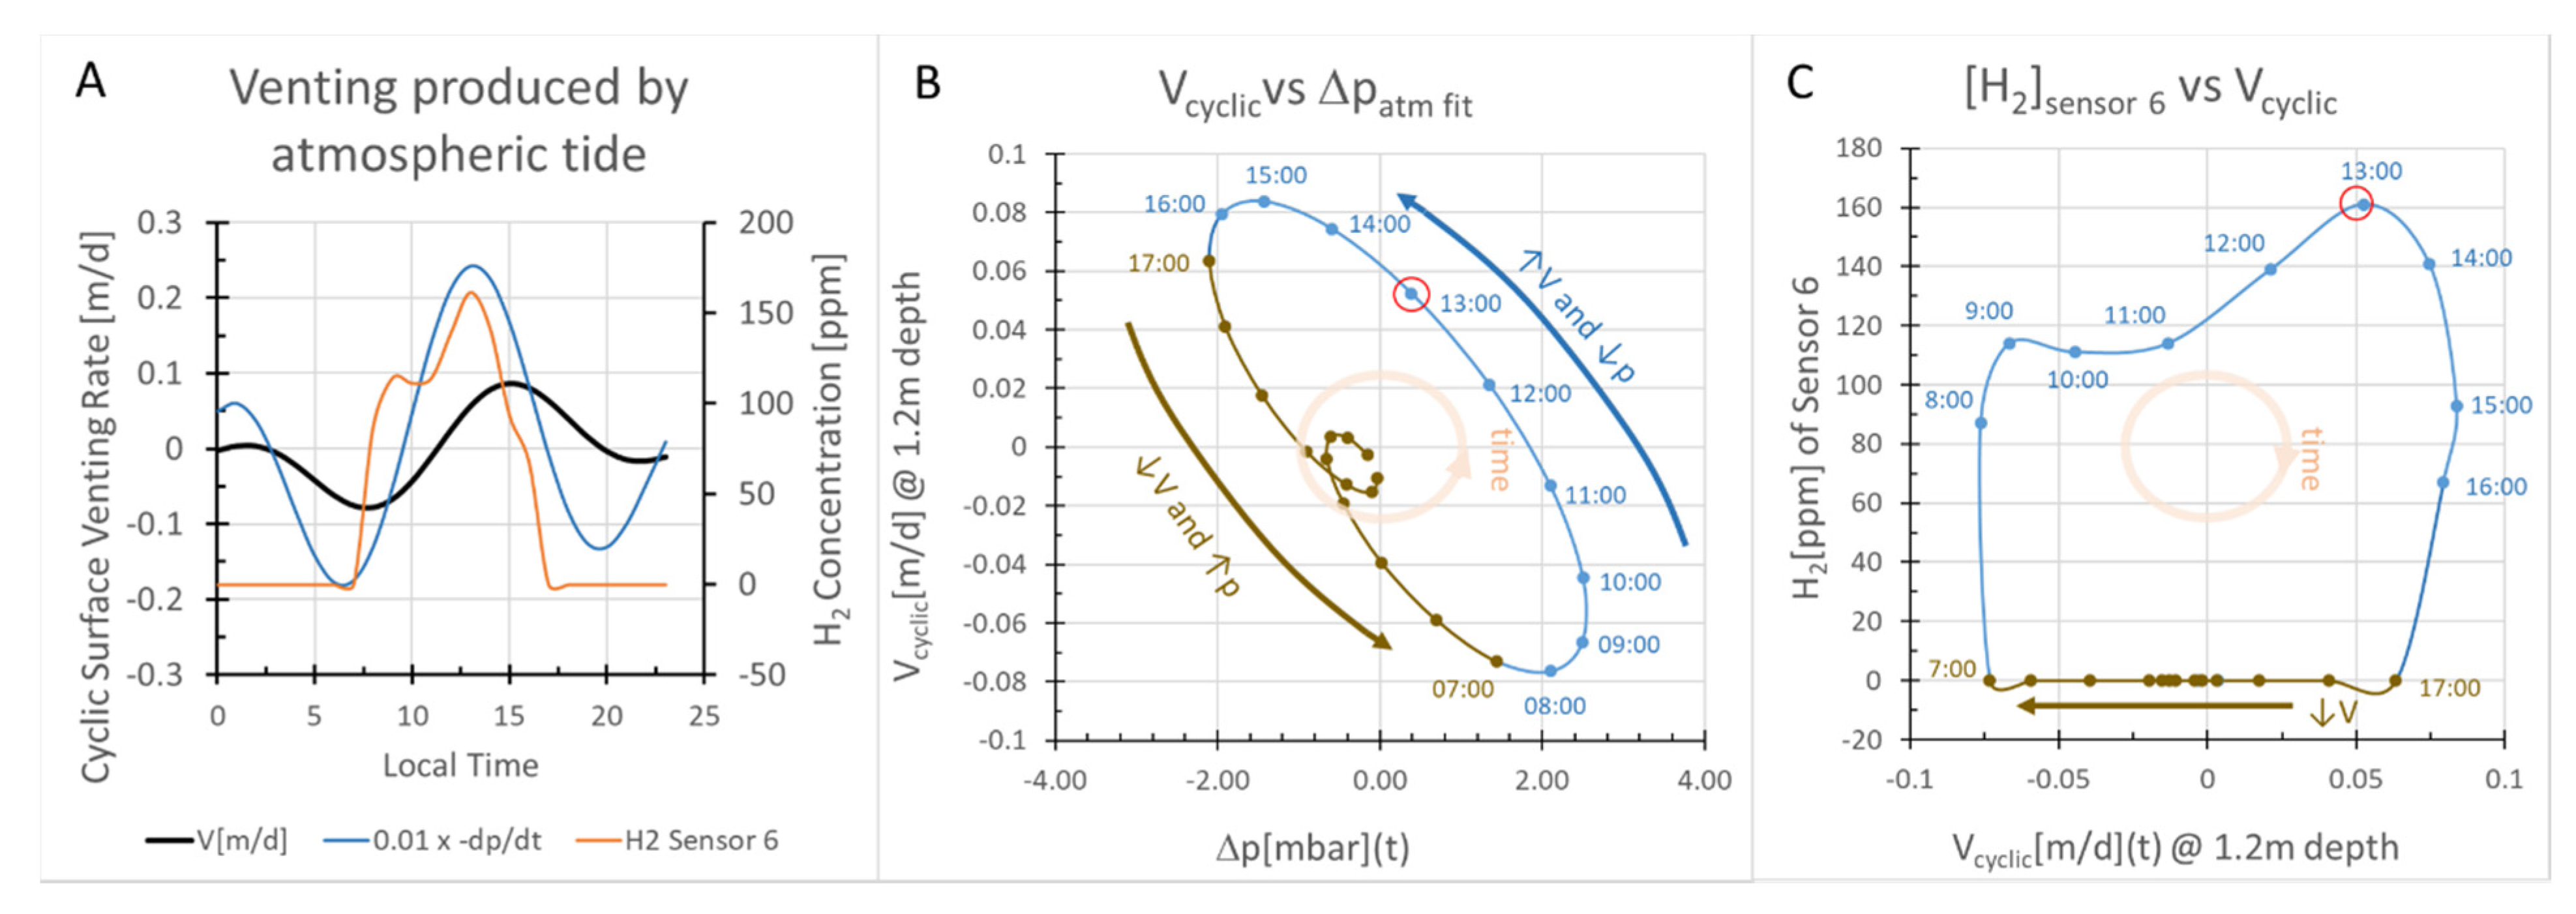
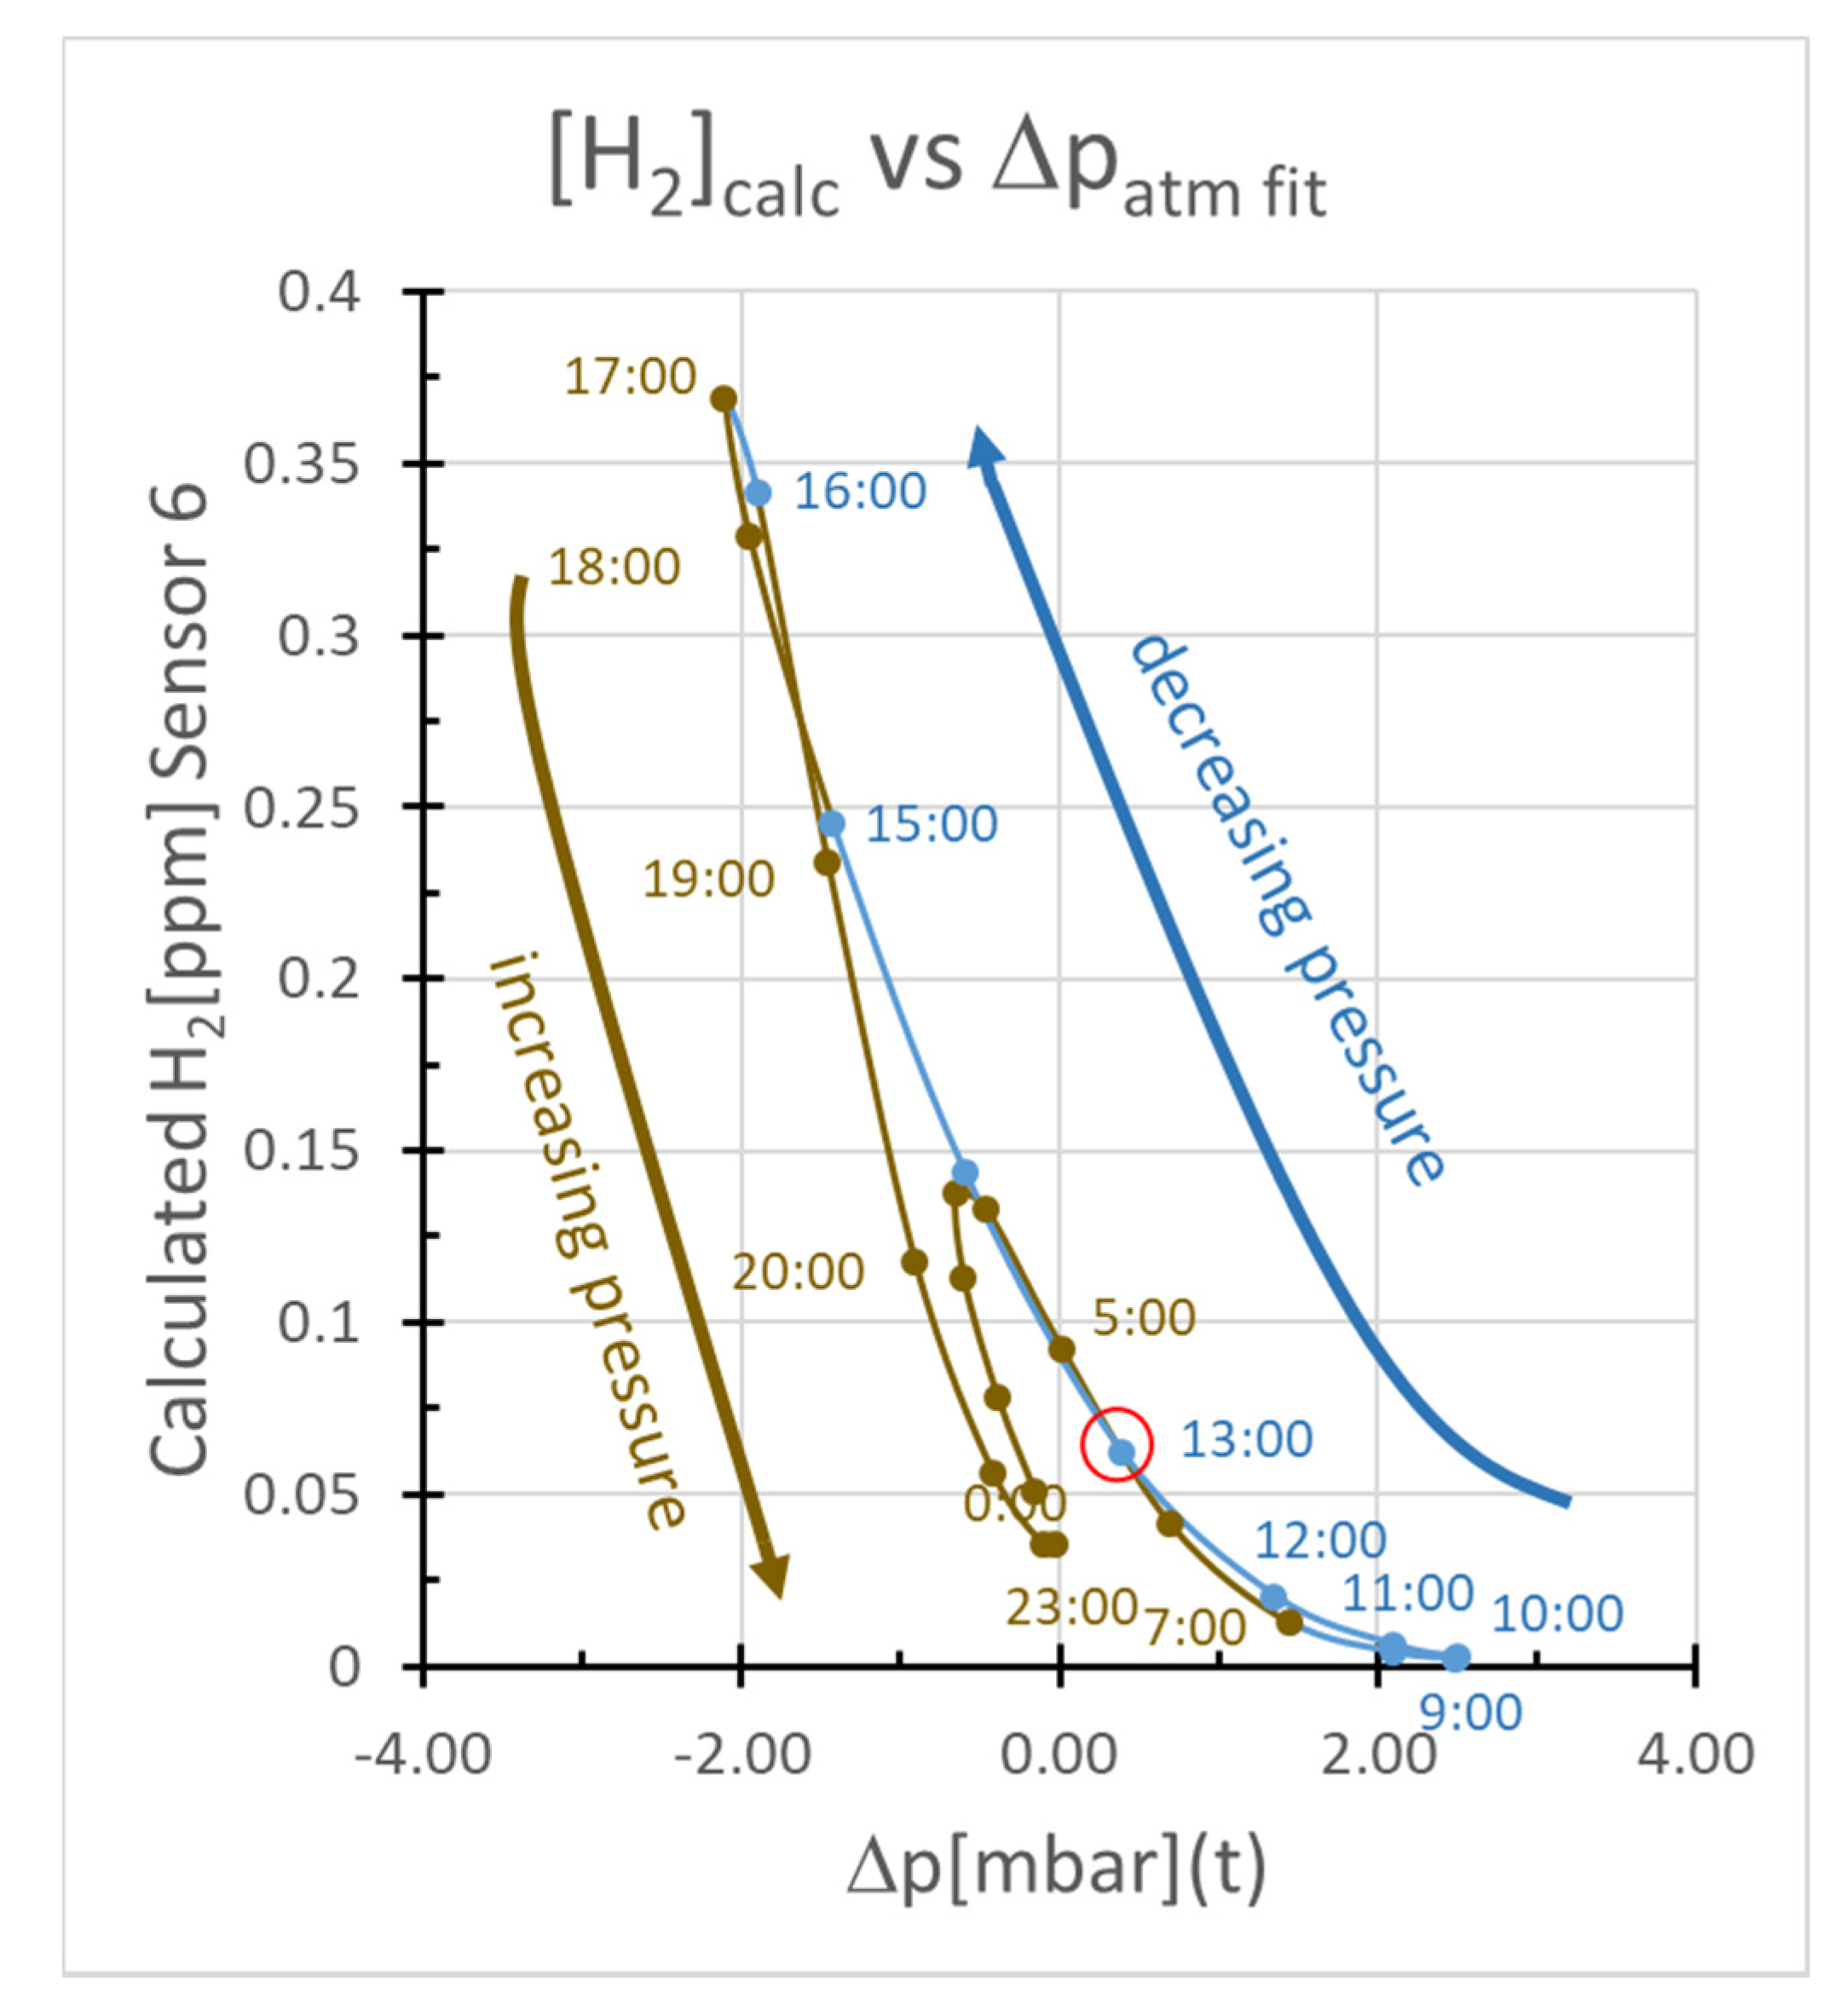
2.3.2. Pressure-driven Subsurface Gas Fluxes
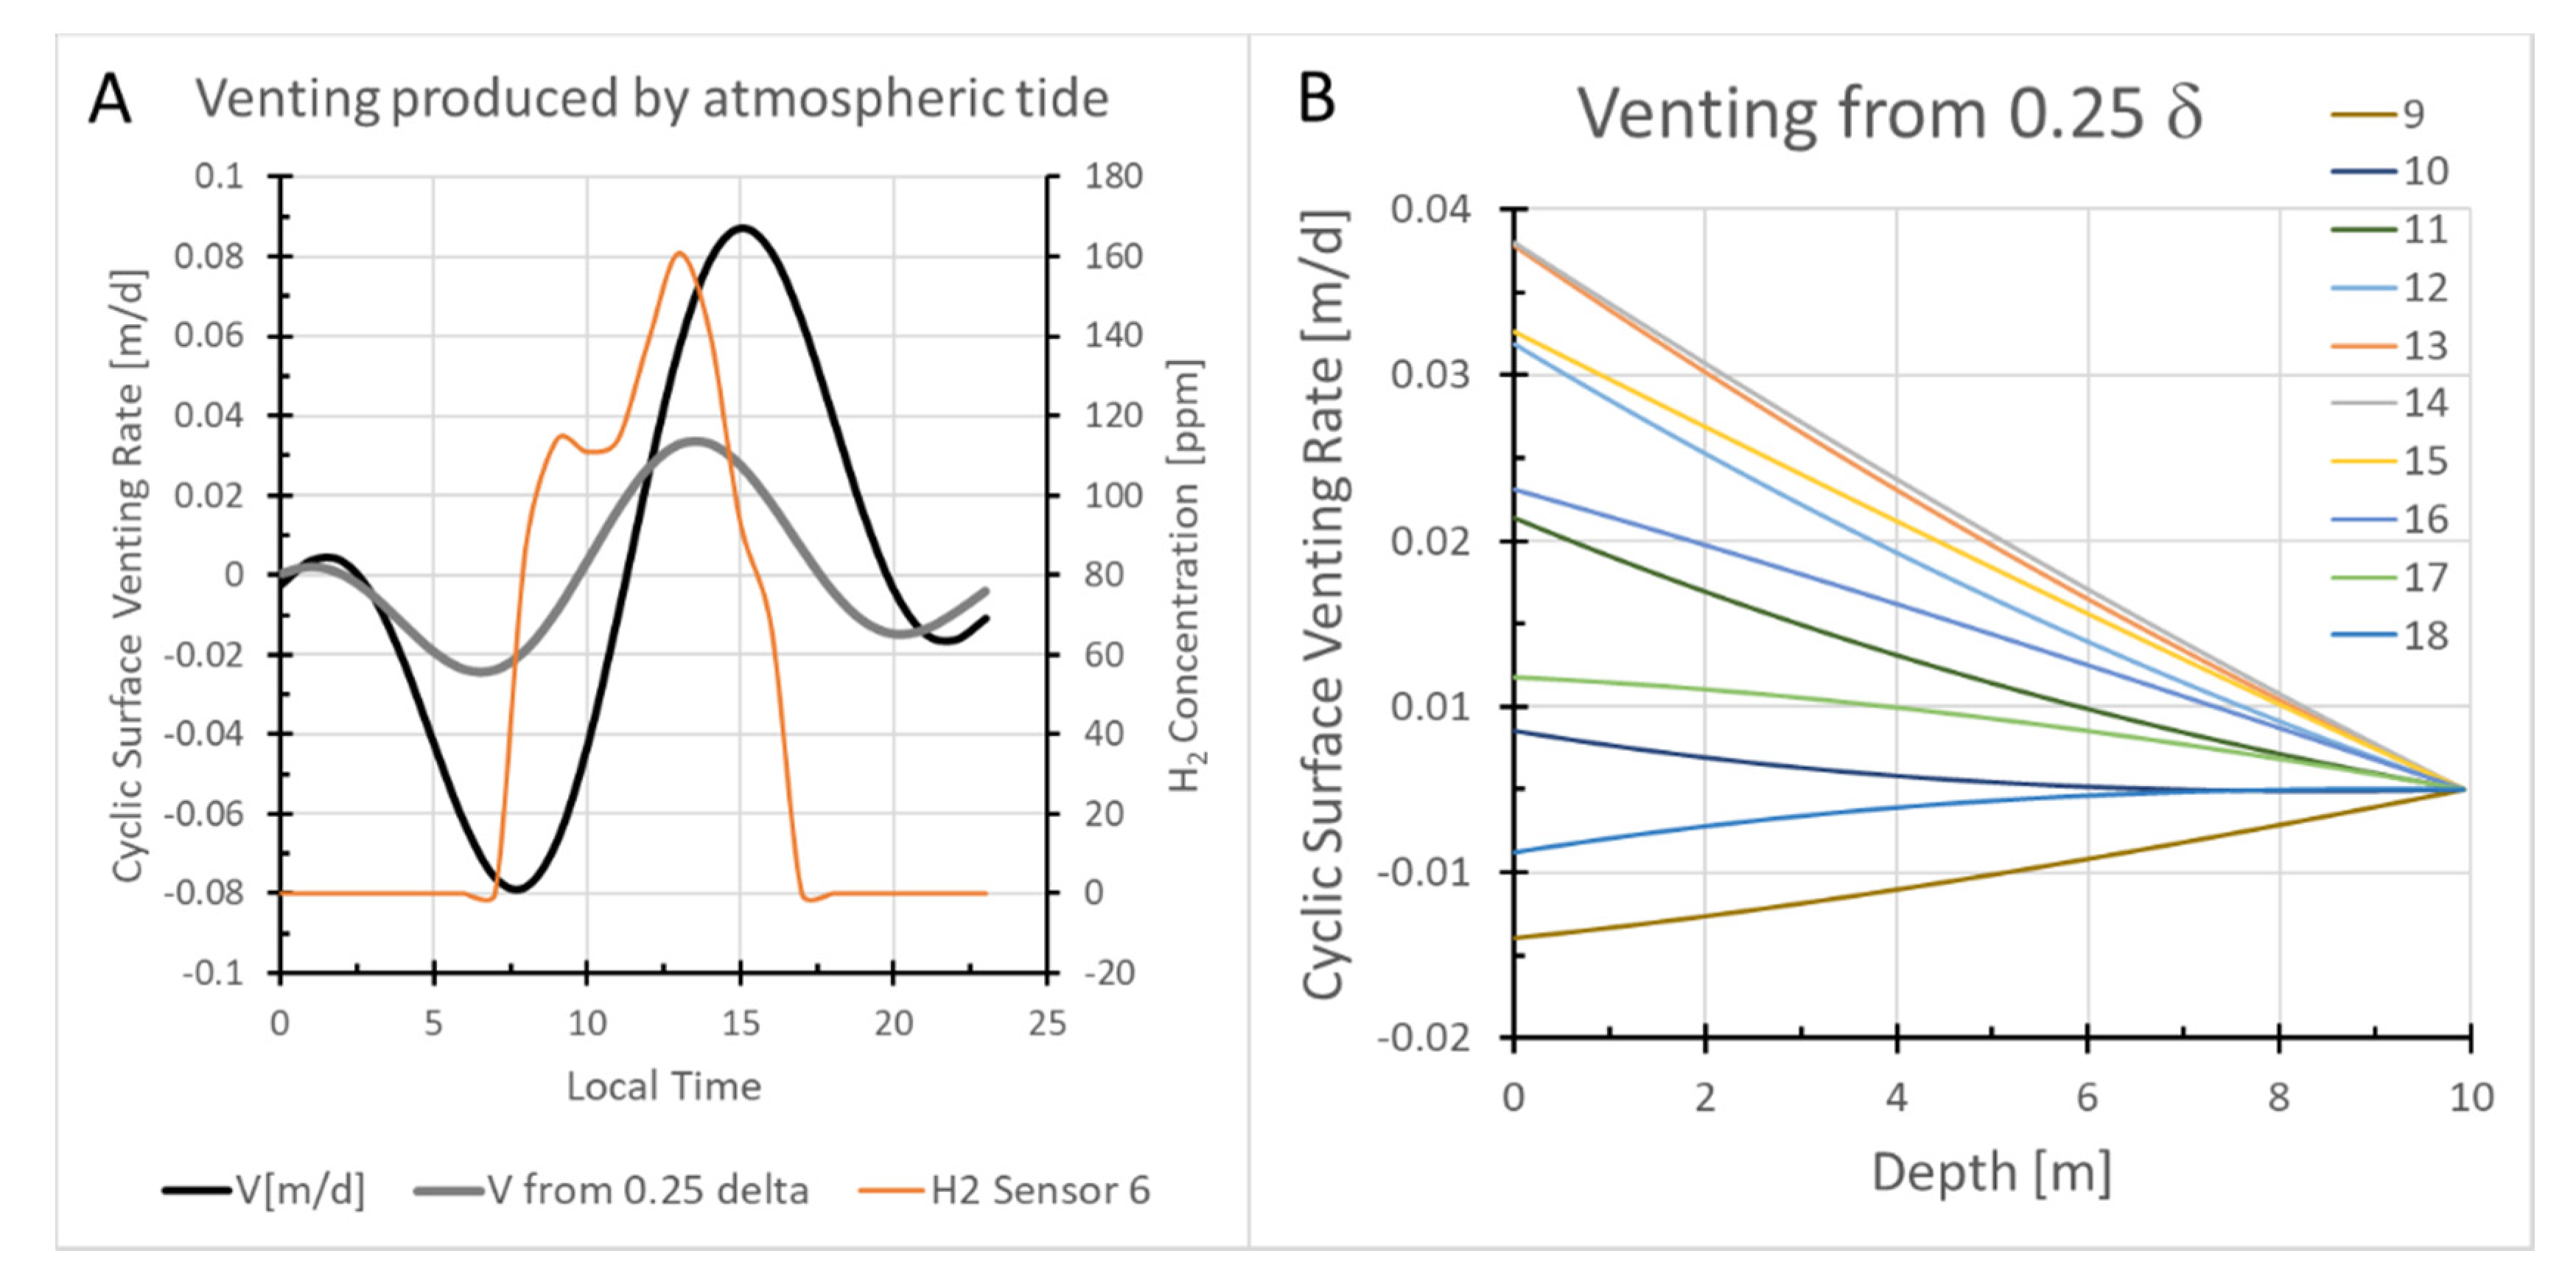
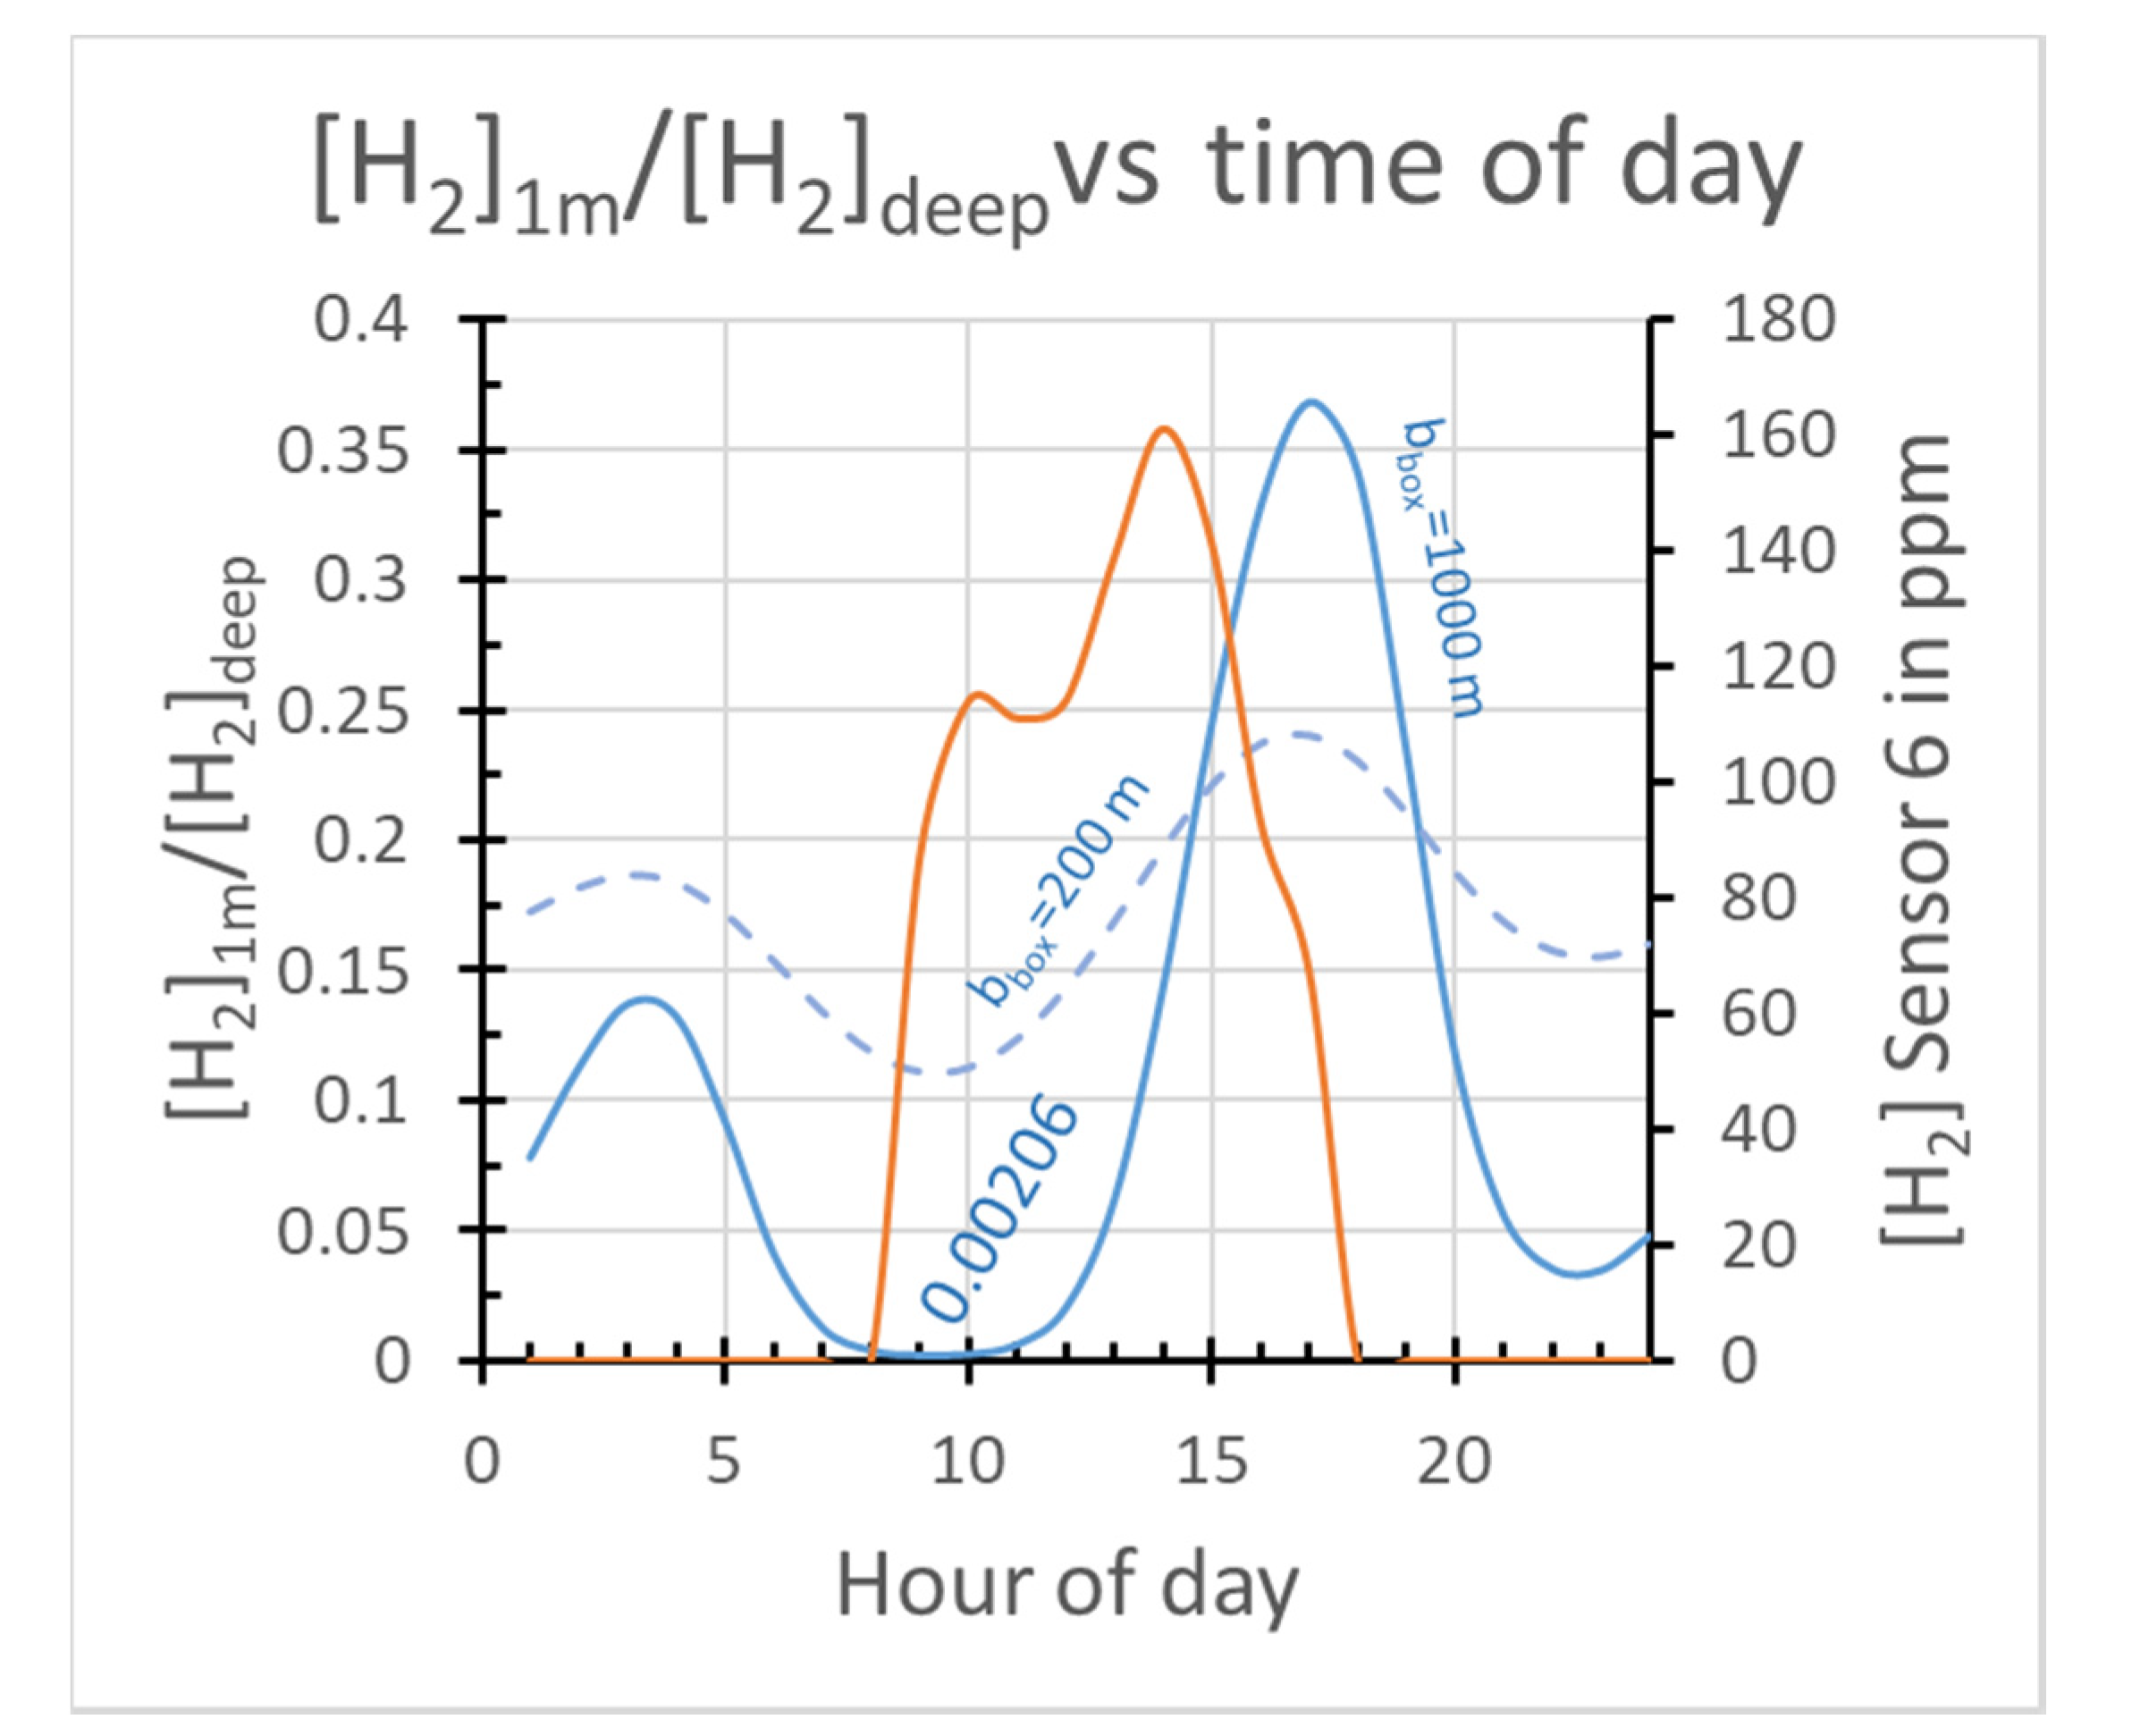
2.3.3. Box Model Advection/Diffusion Calculations of [H2] at 1 m Depth
3. Discussion
4. Conclusions
- The variations in hydrogen concentration measured at 1 m depth could be caused by propagation of a pressure wave into the subsurface, but not by the propagation of a thermal wave. Diurnal temperature changes penetrate less than a meter into the subsurface and produce only weak perturbations of gas flow above the one-meter sensor depth.
- The propagation of a pressure wave truncated at 25% of its potential penetration could produce changes in hydrogen concentration at 1 m with a phase shift relative to atmospheric tidal pressure changes similar to that most commonly observed.
- To change [H2] concentrations at 1 m depth, the gas volume in each vent needs to be <1/1000th of the reservoir gas volume with which atmospheric pressure variations interact.
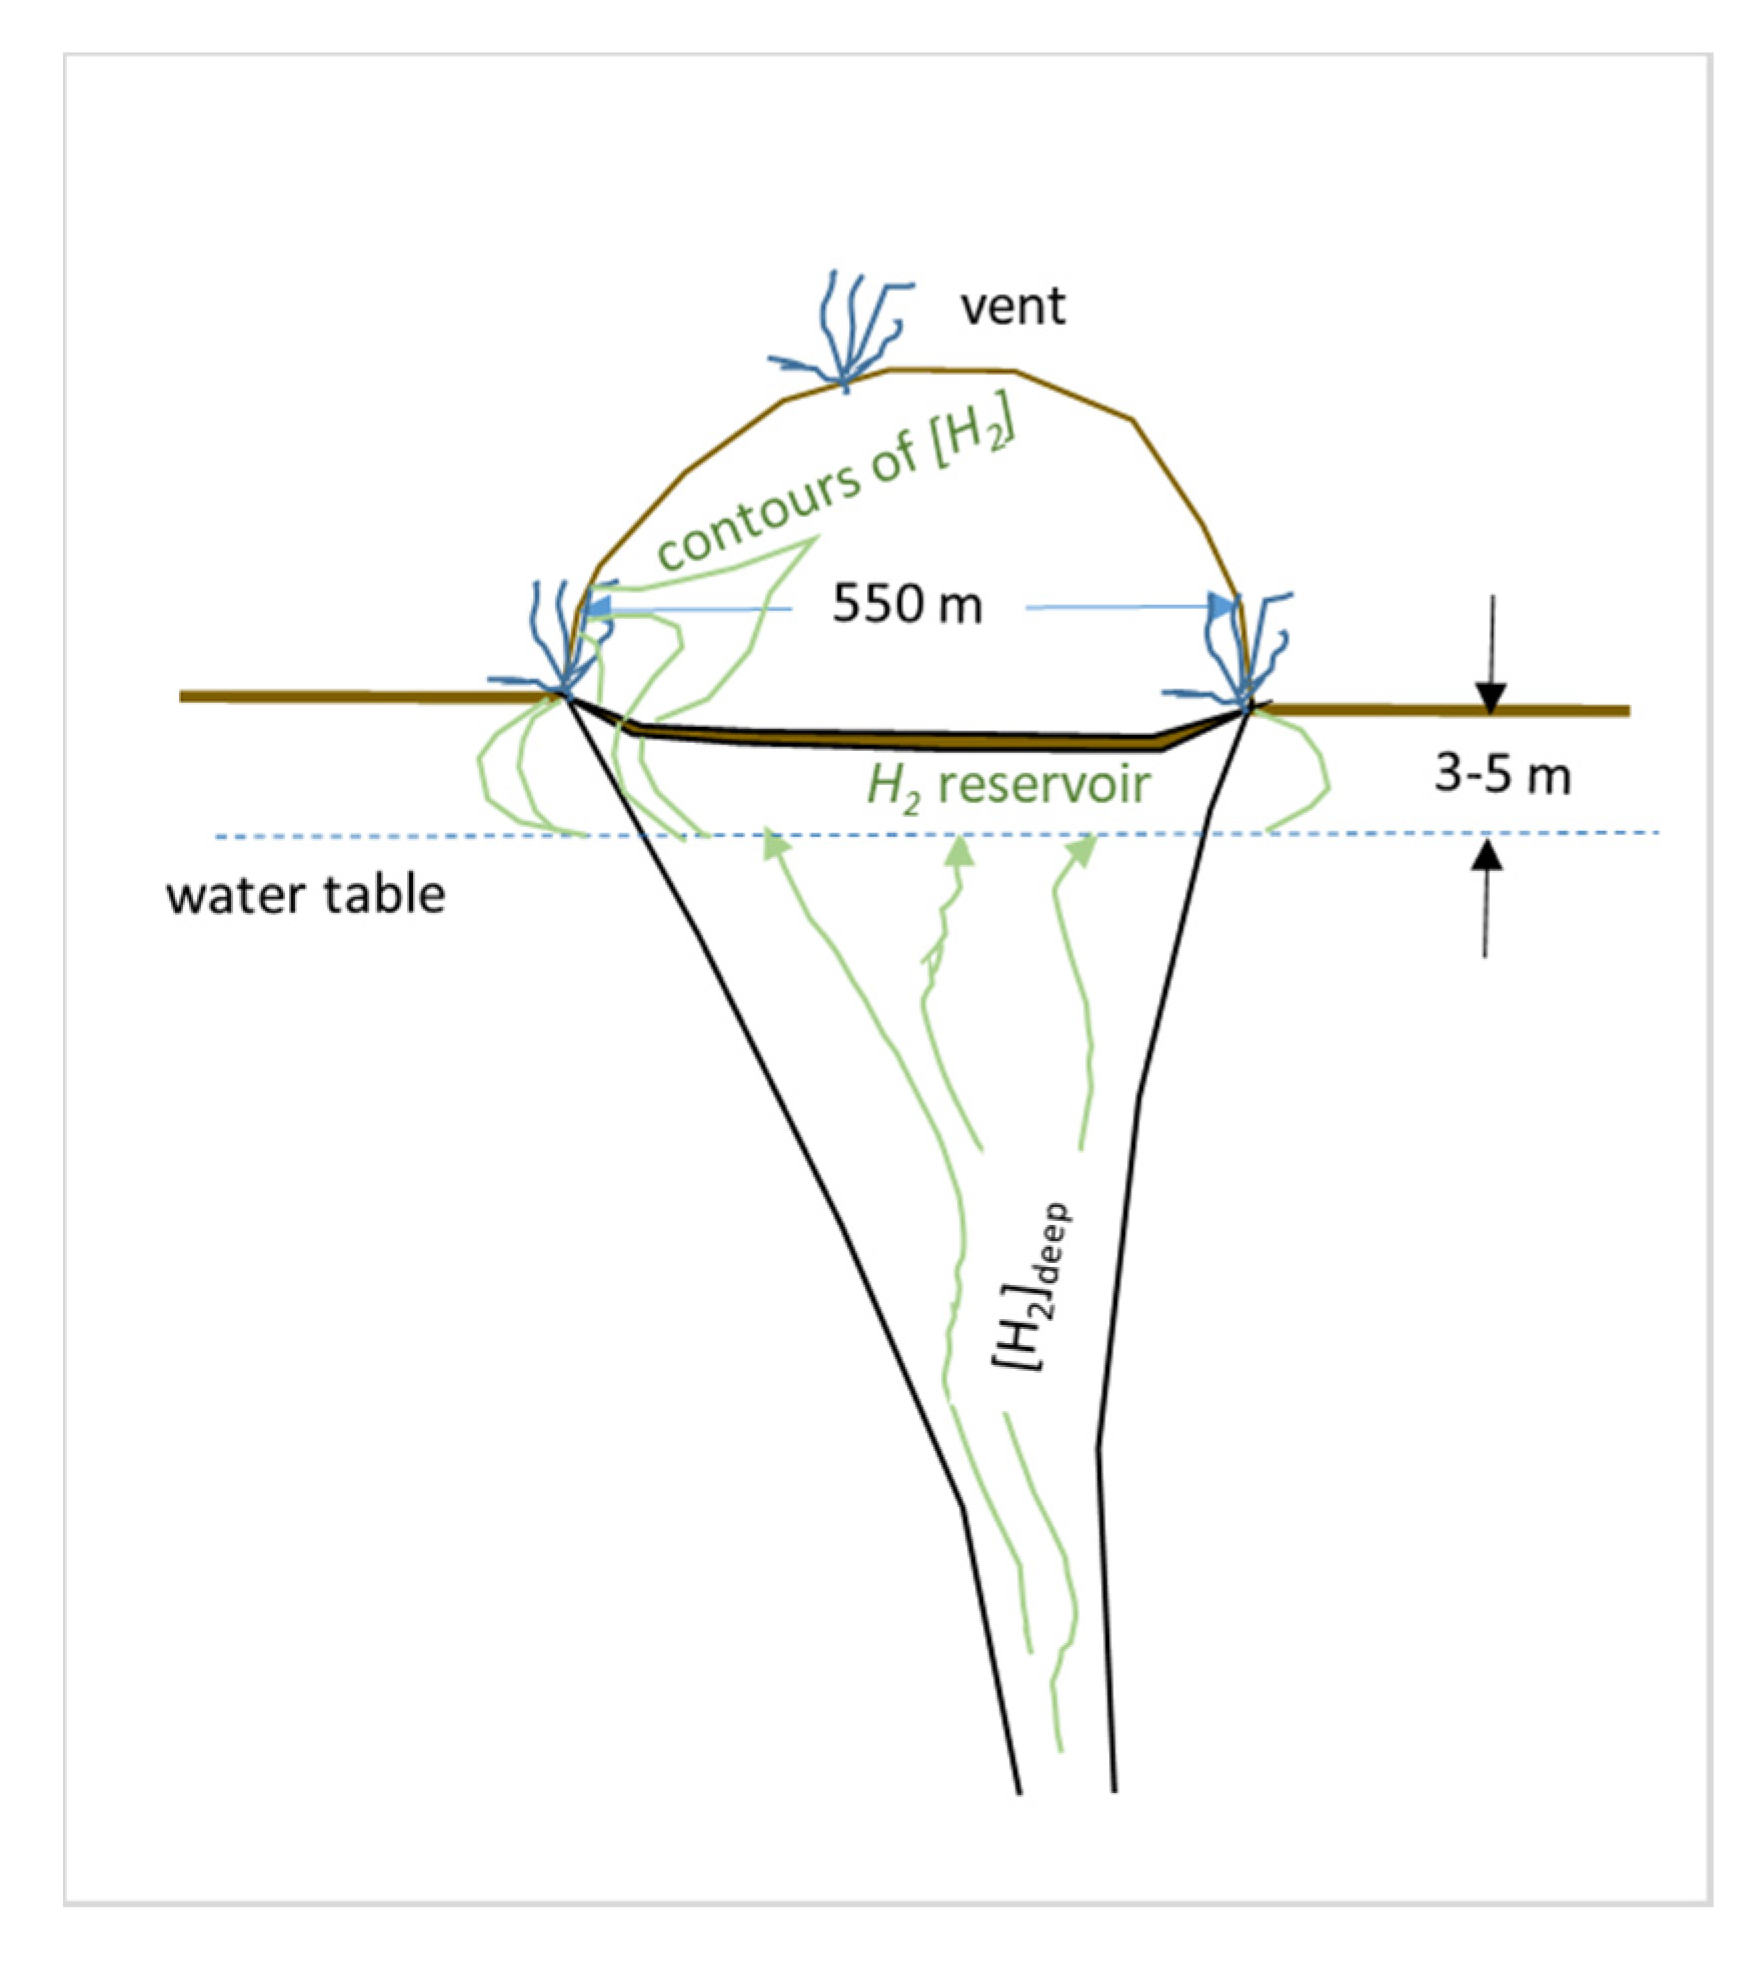
- The venting system we infer here from observations and calculations is illustrated in Figure 9. The characteristics of this hypothetical system should be tested by measuring reservoir hydrogen concentrations with gas probes or by drilling as indicated in the discussion section.
Author Contributions
Funding
Acknowledgments
Conflicts of Interest
References
- Ward, L.W. Inflammable gases occluded in the pre-Palaeozoic rocks of South Australia. Trans. R. Soc. S. Aust. 1933, 57, 42–47. [Google Scholar]
- Goebel, E.D.; Coveney, R.M.J.; Angino, E.E.; Zeller, E.J.; Dreschhoff, G.A.M. Geology, composition, isotopes of naturally occurring H2/N2 rich gas from wells near Junction City, Kansas. Oil Gas J. 1984, 82, 215–222. [Google Scholar]
- Newell, K.D.; Doveton, J.H.; Merriam, D.F.; Gilevska, T.; Waggoner, W.M.; Magnuson, L.M. H2-rich and Hydrocarbon Gas Recovered in a Deep Precambrian Well in Northeastern Kansas. Nat. Resour. Res. 2007, 16, 277–292. [Google Scholar] [CrossRef]
- Lollar, B.S.; Onstott, T.C.; Lacrampe-Couloume, G.; Ballentine, C.J. The contribution of the Precambrian continental lithosphere to global H2 production. Nature 2014, 516, 379–382. [Google Scholar] [CrossRef] [PubMed]
- Prinzhofer, A.; Deville, E. Hydrogène Naturel. La Prochaine Révolution énergétique. Available online: https://www.belin-editeur.com/hydrogene-naturel-la-prochaine-revolution-energetique (accessed on 16 April 2020).
- Guélard, J.; Beaumont, V.; Rouchon, V.; Guyot, F.; Pillot, D.; Jézéquel, D.; Ader, M.; Newell, K.D.; Deville, E. Natural H2in Kansas: Deep or shallow origin? Geochem. Geophys. Geosyst. 2017, 18, 1841–1865. [Google Scholar] [CrossRef]
- Prinzhofer, A.; Cissé, C.S.T.; Diallo, A.B. Discovery of a large accumulation of natural hydrogen in Bourakebougou (Mali). Int. J. Hydrogen Energy 2018, 43, 19315–19326. [Google Scholar] [CrossRef]
- Larin, N.; Zgonnik, V.; Rodina, S.; Deville, E.; Prinzhofer, A. Larin V.N. Evidences for natural molecular hydrogen seepages associated with rounded subsident structures. Part 1: The craton of European Russia. Nat. Resour. Res. 2014, 24, 369–383. [Google Scholar] [CrossRef]
- Zgonnik, V.; Beaumont, V.; Deville, E.; Larin, N.; Pillot, D.; Farrell, K.M. Evidence for natural molecular hydrogen seepage associated with Carolina bays (surficial, ovoid depressions on the Atlantic Coastal Plain, Province of the USA). Prog. Earth Planet. Sci. 2015, 2, 121. [Google Scholar] [CrossRef]
- Deville, E.; Prinzhofer, A. The origin of N2-H2-CH4-rich natural gas seepages in ophiolitic context: A major and noble gases study of fluid seepages in New Caledonia. Chem. Geol. 2016, 440, 139–147. [Google Scholar] [CrossRef]
- Prinzhofer, A.; Moretti, I.; Françolin, J.; Pacheco, C.; D’Agostino, A.; Werly, J.; Rupin, F. Natural hydrogen continuous emission from sedimentary basins: The example of a Brazilian H2-emitting structure. Int. J. Hydrogen Energy 2019, 44, 5676–5685. [Google Scholar] [CrossRef]
- Larin, N. Hydridic Earth the New Geology of Our Primortidally Hydrogen-Rich Planet Translation; Polar Publishing: Maple Ridge, BC, Canada, 1993; p. 247. [Google Scholar]
- Gilevska, T.; Voglesonger, K.; Lin, L.-H.; Lacrampe-Couloume, G.; Telling, J.; Abrajano, T.; Onstott, T.; Pratt, L.M. Hydrogeologic Controls on Episodic H2 Release from Precambrian Fractured Rocks—Energy for Deep Subsurface Life on Earth and Mars. Astrobiology 2007, 7, 971–986. [Google Scholar] [CrossRef]
- Milesi, V.P.; Guyot, F.; Brunet, F.; Richard, L.; Recham, N.; Benedetti, M.F.; Dairou, J.; Prinzhofer, A. Formation of CO2, H2 and condensed carbon from siderite dissolution in the 200–300 °C range and at 50MPa. Geochim. Cosmochim. Acta 2015, 154, 201–211. [Google Scholar] [CrossRef]
- Vacquand, C.; Deville, E.; Beaumont, V.; Guyot, F.; Sissmann, O.; Pillot, D.; Arcilla, C.; Prinzhofer, A. Reduced gas seepages in ophiolitic complexes: Evidences for multiple origins of the H2-CH4-N2 gas mixtures. Geochim. Cosmochim. Acta 2018, 223, 437–461. [Google Scholar] [CrossRef]
- Truche, L.; Joubert, G.; Dargent, M.; Martz, P.; Cathelineau, M.; Rigaudier, T.; Quirt, D. Clay minerals trap hydrogen in the Earth’s crust: Evidence from the Cigar Lake uranium deposit, Athabasca. Earth Planet. Sci. Lett. 2018, 493, 186–197. [Google Scholar] [CrossRef]
- Welhan, J.A.; Craig, H. Methane and hydrogen in East Pacific Rise hydrothermal fluids. Geophys. Res. Lett. 1979, 6, 829–831. [Google Scholar] [CrossRef]
- Neal, C.; Stanger, G. Hydrogen generation from mantle source rocks in Oman. Earth Planet. Sci. Lett. 1983, 66, 315–320. [Google Scholar] [CrossRef]
- Abrajano, T.A.; Sturchio, N.C.; Kennedy, B.M.; Lyon, G.L.; Muehlenbachs, K.; Bohlke, J.K. Geochemistry of reduced gas related to serpentinization of the Zambales ophiolite, Philippines. Appl. Geochem. 1990, 5, 625–630. [Google Scholar] [CrossRef]
- Sano, Y.A.; Urabe, T.; Wakita, H.; Wushiki, H. Origin of hydrogen–nitrogen gas seeps. Oman. Appl. Geochem. 1993, 8, 1–8. [Google Scholar] [CrossRef]
- Charlou, J.L.; Donval, J.P.; Fouquet, Y.; Jean-Baptiste, P.; Holm, N.G. Geochemistry of high H2 and CH4 vent fluids issuing from ultramafic rocks at the Rainbow hydrothermal field (36°14′ N, MAR). Chem. Geol. 2002, 191, 345–359. [Google Scholar] [CrossRef]
- Guélard, J.; Martinez, I.; Sissmann, O.; Bordmann, V.; Fleury, J.M. The role of ammonium in native H2 prodiction in continental lithosphere. In Proceedings of the Goldschmidt confonference, Boston, MA, USA, 12–17 August 2018; pp. 12–178. [Google Scholar]
- Le Blancq, F. Diurnal pressure variation: The atmospheric tide. Weather 2011, 66, 306–307. [Google Scholar] [CrossRef]
- Carslaw, H.S.; Jager, J.C. Conduction of Heat in Solids; Clarendon Press: Oxford, UK, 1959; p. 510. [Google Scholar]
- Luo, M.; Wood, J.R.; Cathles, L.M. Prediction of thermal conductivity in reservoir rocks using fabric theory. J. Appl. Geophys. 1994, 32, 321–334. [Google Scholar] [CrossRef]
- Baker, A.J.; Pepper, D.W. Finite Elements 1-2-3; McGraw Hill: New York, NY, USA, 1991; 341p. [Google Scholar]


| Param. | Units | Definition | Value | Method/Comment | |
|---|---|---|---|---|---|
| αoT | K | Amplitude harmonic Tz = 0(t) | 30 | Ground changes > atmospheric. | |
| αop’ | Pa | Diurnal amplitude p’z = 0(t) (lag 16 h) Semidiurnal p’z = 0(t) (14 h phase lag) | 150 120 | Atmospheric tide has two harmonic components (Figure 2). | |
| βT | - | Thermal expansion of air | 3.3 × 10⁻³ | =1/T[K] = 1/298 for 25 °C. | |
| βp’ | - | Volumetric compression of ideal gas | 10−5 | =1/p = 1/105 at atm. Pressure. | |
| b | m | Depth of system Equation (17) | ~20 m | [H2] changes only near the surface. | |
| bbox | m | Depth extent box model Equation (13) | >500 m | Large bbox needed for sufficient Vair | |
| cs | J kg−1 K−1 | Heat capacity of solid matrix | 837 | ||
| cair | J kg−1 K−1 | Heat capacity of water-saturated air | 4380 | ||
| δT | m | Thermal skin depth | ϕ | δT | |
| 0.1 | 0.107 | ||||
| 0.2 | 0.102 | ||||
| 0.4 | 0.098 | ||||
| m | Pressure skin depth for 1 day period | ϕ | δp’ | . Reduced by for semidiurnal. | |
| 0.1 | 56.1 | ||||
| 0.2 | 39.7 | ||||
| 0.4 | 28.0 | ||||
| D | m2 s−1 | Diffusion constant of H2 in large excess of air | 0.756 × 10⁻⁴ 6.45 m2 d−1 | By comparison DCO2= 0.208 × 10⁻⁴. Values from web. | |
| DE | m2 s−1 | Effective diffusion constant in vent | ϕ | DE | values assume τ = 2. Table units are m2 per day. |
| 0.1 | 0.323 | ||||
| 0.2 | 0.645 | ||||
| 0.4 | 1.29 | ||||
| ϕ | - | Porosity of vent subsurface | ~0.4 | ||
| [H2] | - | Volume fraction of H2 in air | |||
| [H2]1m | - | Volume fraction of H2 in air at 1 m depth | <102–103 ppm | ||
| [H2]deep | - | Fraction H2 deep in the vent | 0.5 to 1 | Deep H2 concentration ~1 from diverse observations (see text). | |
| - | H2 as fraction of [H2]deep | =[H2]/[H2]deep. | |||
| j | J m−2 s−1 | Heat flux | calculated | ||
| k’ | m2 | Permeability (10−12 m2 = 1 Darcy) | 10−12 | Near surface sandy soil is assumed to be very permeable. | |
| KT | W m−1 K−1 | Thermal conductivity of media | ϕ | KT | Calculated at 25 °C with fabric theory mix of Ks and Kair with fabric mixing parameter = 0.3, see Luo et al. (1994) [25]. |
| 0.1 | 0.843 | ||||
| 0.2 | 0.685 | ||||
| 0.4 | 0.498 | ||||
| Ks | W m−1 K−1 | Matrix thermal conductivity | 4 | Sandy soil with some clay at 25 °C. | |
| Kair | W m−1 K−1 | Air thermal conductivity | 0.0261 | Air at 25 °C. T Dependence weak. | |
| κT | m2 s−1 | Thermal dispersivity of media | ϕ | κT | . |
| 0.1 | 4.2 × 10⁻⁷ | ||||
| 0.2 | 3.8 × 10⁻⁷ | ||||
| 0.4 | 3.6 × 10⁻⁷ | ||||
| κp’ | m2 s−1 | Hydrodynamic dispersivity of H2-filled media for 1 Darcy vent permeability | ϕ | κp’ | ,κp’ for air is half H2. |
| 0.1 | 0.114 | ||||
| 0.2 | 0.057 | ||||
| 0.4 | 0.029 | ||||
| Npe | - | Peclet nbr (Equation (17)) | >7.72 | ||
| μair, μH2 | kg m−1 s−1 | dynamic viscosity of air | μair = 1.78 × 10⁻⁵ μH2 = 8.74 × 10⁻⁶ | μair = νair ρair. | |
| νair | m2 s−1 | kinematic viscosity of air | 1.48 × 10⁻⁵ | Regression: νair = −1.1555(10−14)T3 + 9.5728(10−11)T2 + 3.7604(10−8)T − 3.4484(10−6), from WWW. | |
| P | s | Period of P harmonic | 24 × 3600 | T surface change, tidal p’ change. | |
| - | Period normalized to 1 day | 1 | P/(1 day). | ||
| p | Pa | Atmospheric pressure | 105 | ||
| P’ | kg m s−2 | Perturbation from atmos. pressure | |||
| p’o | kg m s−2 | Amplitude atm pressure change | 200 to 400 | Changes due to atmospheric tide. | |
| ρT | kg m−3 | Density of media | ϕ | ρT | =ρs(1 − ϕ) + ϕρair. |
| 0.1 | 2430 | ||||
| 0.2 | 2160 | ||||
| 0.4 | 1620 | ||||
| ρs | kg m−3 | Density of solid matrix | 2700 | ||
| ρair | kg m−3 | Density of air | 1.1 | Density of air at 25 °C. | |
| ρTcT | J kg−1 K−1 | Volumetric heat capacity air-saturated soil | ϕ | cT | =ρscs(1 − ϕ) + ϕρaircair. |
| 0.1 | 2 × 10⁶ | ||||
| 0.2 | 1.8 × 10⁶ | ||||
| 0.4 | 1.4 × 10⁶ | ||||
| T | K | Temperature in degrees K | ~298 | ||
| To | K or °C | Amplitude of imposed surface T(t) | >20 | Can be greater if surface T > T air. | |
| τ | - | Tortuosity of sediment pores | 2 | ||
| τD | d | Time normalization in Equation (16) | . | ||
| Vair | m3 m−2 d−1 | Flux of air containing H2 | Vair = Vcyclic + Vdeep. | ||
| Vcyclic | m3 m−2 d−1 | Flux of air driven only by changes p | |||
| Vdeep | m3 m−2 d−1 | Deep (source) H2 gas flux assuming 100% H2 concentration | 0.05 to 1.2 | Estimated by Prinzhofer (2019) [11], assuming uniform venting in barren zone. | |
| VTmax | m d−1 | Maximum flux into subsurface from T(t) | ϕ | VTmax | |
| 0.1 | 0.005 | ||||
| 0.2 | 0.009 | ||||
| 0.4 | 0.018 | ||||
| Vp’max diurnal | m d−1 | Maximum flux into subsurface from diurnal p’(t), αop’ = 150 Pa. From Equation (6)a. A 1 darcy subsurface permeability is assumed. | ϕ | Vp’max | |
| 0.1 | 0.037 | ||||
| 0.2 | 0.053 | ||||
| 0.4 | 0.075 | ||||
| Vp’max Semi-diurnal | m d−1 | Maximum flux into subsurface from semidiurnal p’(t), αop’ = 120 Pa. From Equation (8). A 1 darcy vent permeability is assumed. | ϕ | Vp’max | |
| 0.1 | 0.042 | ||||
| 0.2 | 0.060 | ||||
| 0.4 | 0.084 | ||||
| Estimation Method | H2 or Air Flux |
|---|---|
| Prinzhofer Vdeep for 50% H2 concentration | 0.05 to 1.2 m3 m−2 d−1 |
| Calculated p-driven influx for φ = 0.1 to 0.4 | 0.079 to 0.159 m3 m−2 d−1 |
| Calculated T-driven influx for φ = 0.1 to 0.4 | 0.005 to 0.018 m3 m−2 d−1 |
© 2020 by the authors. Licensee MDPI, Basel, Switzerland. This article is an open access article distributed under the terms and conditions of the Creative Commons Attribution (CC BY) license (http://creativecommons.org/licenses/by/4.0/).
Share and Cite
Cathles, L.; Prinzhofer, A. What Pulsating H2 Emissions Suggest about the H2 Resource in the Sao Francisco Basin of Brazil. Geosciences 2020, 10, 149. https://doi.org/10.3390/geosciences10040149
Cathles L, Prinzhofer A. What Pulsating H2 Emissions Suggest about the H2 Resource in the Sao Francisco Basin of Brazil. Geosciences. 2020; 10(4):149. https://doi.org/10.3390/geosciences10040149
Chicago/Turabian StyleCathles, Lawrence, and Alain Prinzhofer. 2020. "What Pulsating H2 Emissions Suggest about the H2 Resource in the Sao Francisco Basin of Brazil" Geosciences 10, no. 4: 149. https://doi.org/10.3390/geosciences10040149
APA StyleCathles, L., & Prinzhofer, A. (2020). What Pulsating H2 Emissions Suggest about the H2 Resource in the Sao Francisco Basin of Brazil. Geosciences, 10(4), 149. https://doi.org/10.3390/geosciences10040149


