Article

The Mechanical Properties of Fly-Ash-Stabilized Sands

by
Minson Simatupang
1,*,
Lukas Kano Mangalla
2,
Romy Suryaningrat Edwin
1,
Adris Ade Putra
1,
Muhammad Thahir Azikin
1,
Nini H. Aswad
1 and
Wayan Mustika
1
1
Department of Civil Engineering, Halu Oleo University, Kendari 93232, Indonesia
2
Department of Mechanical Engineering, Halu Oleo University, Kendari 93232, Indonesia
*
Author to whom correspondence should be addressed.
Geosciences 2020, 10(4), 132; https://doi.org/10.3390/geosciences10040132
Submission received: 8 February 2020 / Revised: 19 March 2020 / Accepted: 25 March 2020 / Published: 8 April 2020

Abstract

:
The stabilization of soil through the addition of fly ash has been shown to be an effective alternative for improving the strength and stiffness of soil through the resulting chemical reactions. The chemical reaction that occurs dissociates the lime (CaO) in the fly ash, and the establishment of cementitious and pozzolanic gels (consisting of calcium silicate hydrate (CSH) gel and calcium aluminate hydrate (CAH) gel) binds the soil particles and increases the strength and stiffness of the soil. Investigations into the mechanical properties of sands stabilized with fly ash (fly-ash-stabilized sands) were conducted through a series of unconfined compressive strength (UCS) and direct shear strength tests for various fly ash percentages, curing times, grain sizes, degrees of saturation during sample preparation, and content of fines. It was found that the mechanical properties—UCS and direct shear strength (DSS)—of fly-ash-stabilized sands increased with both increasing fly ash content in the specimen and curing time, but decreased with increasing grain size, degree of saturation during sample preparation, and content of fines. The results indicated that fly-ash-stabilized sands required more than a month to attain their optimum performance with regard to binding sand particles.

1. Introduction

The chemical stabilization of cohesionless soil using a grouting technique is the most common method used for liquefaction mitigation of the ground below existing buildings. Varieties of chemical stabilization are undertaken rapidly, including cement, lime, epoxy or silicates, fly ash, calcite precipitation, and mixtures thereof [1,2,3,4,5,6,7,8,9,10,11,12,13,14]. One method increasingly taken into consideration is the usage of waste materials, such as fly ash, as a binder. Soil stabilization with fly ash can reduce environmental pollution, and costs of materials are relatively inexpensive [15,16,17]. Soil stabilization with fly ash has been proposed as an effective alternative for strength and stiffness improvement through chemical reactions [18,19], because certain types of fly ash contain lime (CaO) and pozzolan consisting of, for example, silica (SiO2) and alumina (Al2O3). When fly ash is mixed with soil in the presence of water, chemical reactions occur [20]. These chemical reactions dissociate the lime (CaO) in the fly ash and establish cementitious and pozzolanic gels consisting of calcium silicate hydrate (CSH) gel and calcium aluminate hydrate (CAH) gel, as described in Equations (1) to (4). Consequently, the fly ash will bind to soil particles and increase the strength and stiffness of that soil [21,22,23,24,25,26,27].
CaO + H2O → Ca(OH)2
Ca(OH)2 → Ca2+ + 2(OH)
Ca2+ + 2(OH) + SiO2 → CSH
Ca2+ + 2(OH) + Al2O3 → CAH
In terms of CaO content, fly ash is divided into two classes: F and C. Class F contains a small amount of CaO, indicating a non-self-cementing fly ash. This kind of fly ash can be effectively utilized by adding an activator, such as cement or lime. By contrast, Class C fly ash contains an abundant amount of CaO and is considered self-cementing fly ash. Therefore, Class C fly ash is more effective than Class F in forming CSH and CAH in binding soil [28].
Laboratory investigations on the mechanical properties of fly ash-improved soil, such as tests on the California bearing ratio (CBR), resilient modulus, unconfined compressive strength, and shear strength, have been conducted frequently [13,14,18,19,29]. The mechanical properties of fly-ash-stabilized soil increase in fly ash content, except for organic soil. The addition of fly ash has almost zero effect on the mechanical properties of fly ash-improved organic soil. Furthermore, its mechanical properties tend to decrease with increasing organic content in the soil [13,14].
On the other hand, the improvement in the mechanical properties of fly-ash-stabilized sands is also influenced by the moisture content of the specimen, as well as temperature. It was reported that a higher temperature accelerated not only the induction period in establishing cementitious and pozzolanic gel, but also the loss of moisture from the specimen, which resulted in strength improvement. This improvement is more tangible in the specimen with longer curing times [30,31,32].
In view of the aforementioned issue, a significant improvement of the mechanical properties of fly-ash-stabilized sands may be attained by lowering the degree of saturation during sample preparation. Many studies have been conducted regarding the alteration of sand mechanical properties using another stabilizing agent, precipitated calcite, under different degrees of saturation during various precipitation times [8,9,33,34]. At lower degrees of saturation during curing, the mechanical properties of calcite-improved sands are higher, indicating greater strength. This is because of the increased effectiveness of calcite-improved sands at low saturations during precipitation times. Under those conditions, air occupies the pore space and the precipitated calcite agglomerates at the contact surface of the grains where water menisci have formed, which is directly related to the strength improvement. Microscope images have also demonstrated these advantages [8,9,33,34]. In terms of fly ash usage, limited information is available regarding the effectiveness of fly-ash-stabilized sand and the improvement of its mechanical properties under different degrees of saturation during sample preparation. Little research has been devoted to the behavior of the fly-ash-stabilized sands cured at various degrees of saturation during sample preparation. The effectiveness of using this approach—of lowering the saturation—on the fly-ash-stabilized sand has not been well documented; therefore, proof is needed.
In this research, investigations were conducted to find out the alterations to the mechanical properties of fly-ash-stabilized sands based on different degrees of saturation during sample preparation, Sr. In order to uncover more details regarding the effectiveness of lowering Sr on fly-ash-stabilized sands, unconfined compressive strength (UCS) and direct shear strength (DSS) tests were conducted on sand specimens prepared under various saturations during the sample preparation and with various fly ash percentages, curing times, grain sizes, and content of fines.

2. Materials and Methods

2.1. Materials

The sands used in this research were local sands—fine and coarse sands—originating from the Pohara River of Konawe Regency, South East Sulawesi Province, Indonesia. The physical properties and the distribution of the grain sizes of both sands are presented in Table 1 and Figure 1, respectively. The sands were classified as poorly graded sands according to the Unified Soil Classification System [35]. The sand grains were nearly uniform in size and had angular to subangular particle shapes.
On the basis of the sieve analysis graph presented in Figure 1, the mean grain size of the coarse sand was around five times higher than that of the fine sand. The effects of different grain sizes on the mechanical properties were discussed. The maximum and minimum void ratio measurements were conducted to control the relative density of the specimens. Other properties, such as the specific gravity and mean grain size of both sand types, are available in Table 1.
Another material used in this experiment, fly ash, was taken from the Steam Power Generation of Nii Tanasa, in Konawe Regency of Southeast Sulawesi Province, Indonesia. On the basis of the results of the sieve analysis presented in Figure 1, the mean grain size of fly ash was smaller than that of fine sand at around 0.037 mm, and more than 50% of the fly ash mineral passed through sieve number 200. The grain size distribution and the chemical composition are shown in Figure 1 and Table 2, respectively. On the basis of Table 2, Nii Tanasa fly ash was classified as Class C ash according to American Society for Testing and Materials (ASTM) C618 [36], having an abundance of CaO content of more than 20% by weight. The CaO/SiO2 ratio of this fly ash was more than 1, indicating that it was a good stabilizer material. A higher CaO/SiO2 ratio in fly ash was indicative of greater effectiveness as cementation material.

2.2. Methods

In order to evaluate the effectiveness of fly-ash-stabilized sand regarding improvement of mechanical properties, dry sand was thoroughly mixed in a plastic bag with a specific amount of fly ash: 5%, 10%, 15%, 20%, 25%, and 30% of the total weight of the dry sand. The degree of saturation of the specimen during mixing was predetermined to be either 30%, 50%, or 100%. Cylindrical molds with an inner diameter and height of 55 and 110 mm, and 65 and 22 mm, respectively, were utilized for all unconfined compressive strength (UCS) and direct shear strength (DSS) specimens, respectively. The mixture was tamped carefully in the mold to form a specimen with a target relative density Dr of 50%. Particularly for the UCS specimen, tamping was conducted layer by layer, in five layers, to attain a uniform Dr throughout the specimen. On top of each layer, slight kerfs were applied to avoid segregation between layers. After tamping, the specimens were cured for 7, 14, 28, and 56 days and tested thereafter.
A series of unconfined compressive strength (UCS) and direct shear strength (DSS) tests were conducted on fly-ash-stabilized sand with a strain rate of around 1%/s until the specimen failed.

2.3. Test Conditions

The test conditions shown in Table 3 were used to determine the effects of these reviewed parameters, in combination, on the mechanical properties of fly-ash-stabilized sands, namely unconfined compressive strength and direct shear strength. Six different fly ash percentages, four different curing times, and three kind degrees of saturation during sample preparation were tested in various combinations. Two different sizes of sands—fine (0.075–0.25 mm) and coarse (0.6–2 mm) sands—in natural and clean conditions were also under investigation. In this research, the sand in natural condition referred to the unwashed sand from the site, while the clean condition referred to the water-washed sand from the site. The predetermined parameters are shown in Table 3. The target relative density of all specimens was Dr = 50%.
The amount of materials used is shown in Table 4. The sum of dry sand and fly ash was constant, irrespective of Sr, and only depended on the kind of the sand—either fine or coarse sand—and the kind of experiment—either unconfined compressive strength (UCS) or direct shear strength (DSS). Meanwhile, the water volume was strongly dependent on the Sr, as presented in Table 4.

3. Results and Discussion

3.1. Results

The results of both the UCS and DSS tests are detailed in Table 5 and Table 6 in the form of shear strength parameters, sequentially. Tests were conducted on two different kinds of sand—fine and coarse—under either natural or clean conditions, with different fly ash contents, curing times, and degrees of saturation during sample preparation. A part of the space in Table 5 is empty, which was designated for the UCS test results of coarse sand under low curing times and fly ash content up to 14 days and 10%, respectively. However, the specimens under these conditions failed after being encased from their molds and could not be tested.
In this study, the UCS test for the specimen under 50% saturation during sample preparation was only conducted for fine sand in both natural and clean conditions. For the other degrees of saturation of 30% and 100%, both UCS and DSS tests were performed. The UCS data presented in Table 5 were the maximum values obtained in the laboratory after calibration.
The DSS tests were conducted under vertical loadings of 4, 8, and 12 kg. Data corresponding to all peak stresses, on each loading, were collected, based on the stress–strain relationship. These values were plotted again on the graph connecting shear and normal stresses to attain the shear strength parameters of cohesion “c” and friction angle “θ”, according to the Mohr–Coulomb strength theory.

3.2. Discussion

3.2.1. Typical Stress–Strain Behaviors

In order to define the strength alteration of stabilized local sands over time, specimens were made by mixing dry sand with FA. The FA contents ranged from 5% to 30% at intervals of 5%. The stabilized specimens were tested, and the stress–strain responses of the specimens were recorded after curing at predetermined CTs starting from 7 up to 56 days. Each subsequent CT was set twice as long as the previous CT.
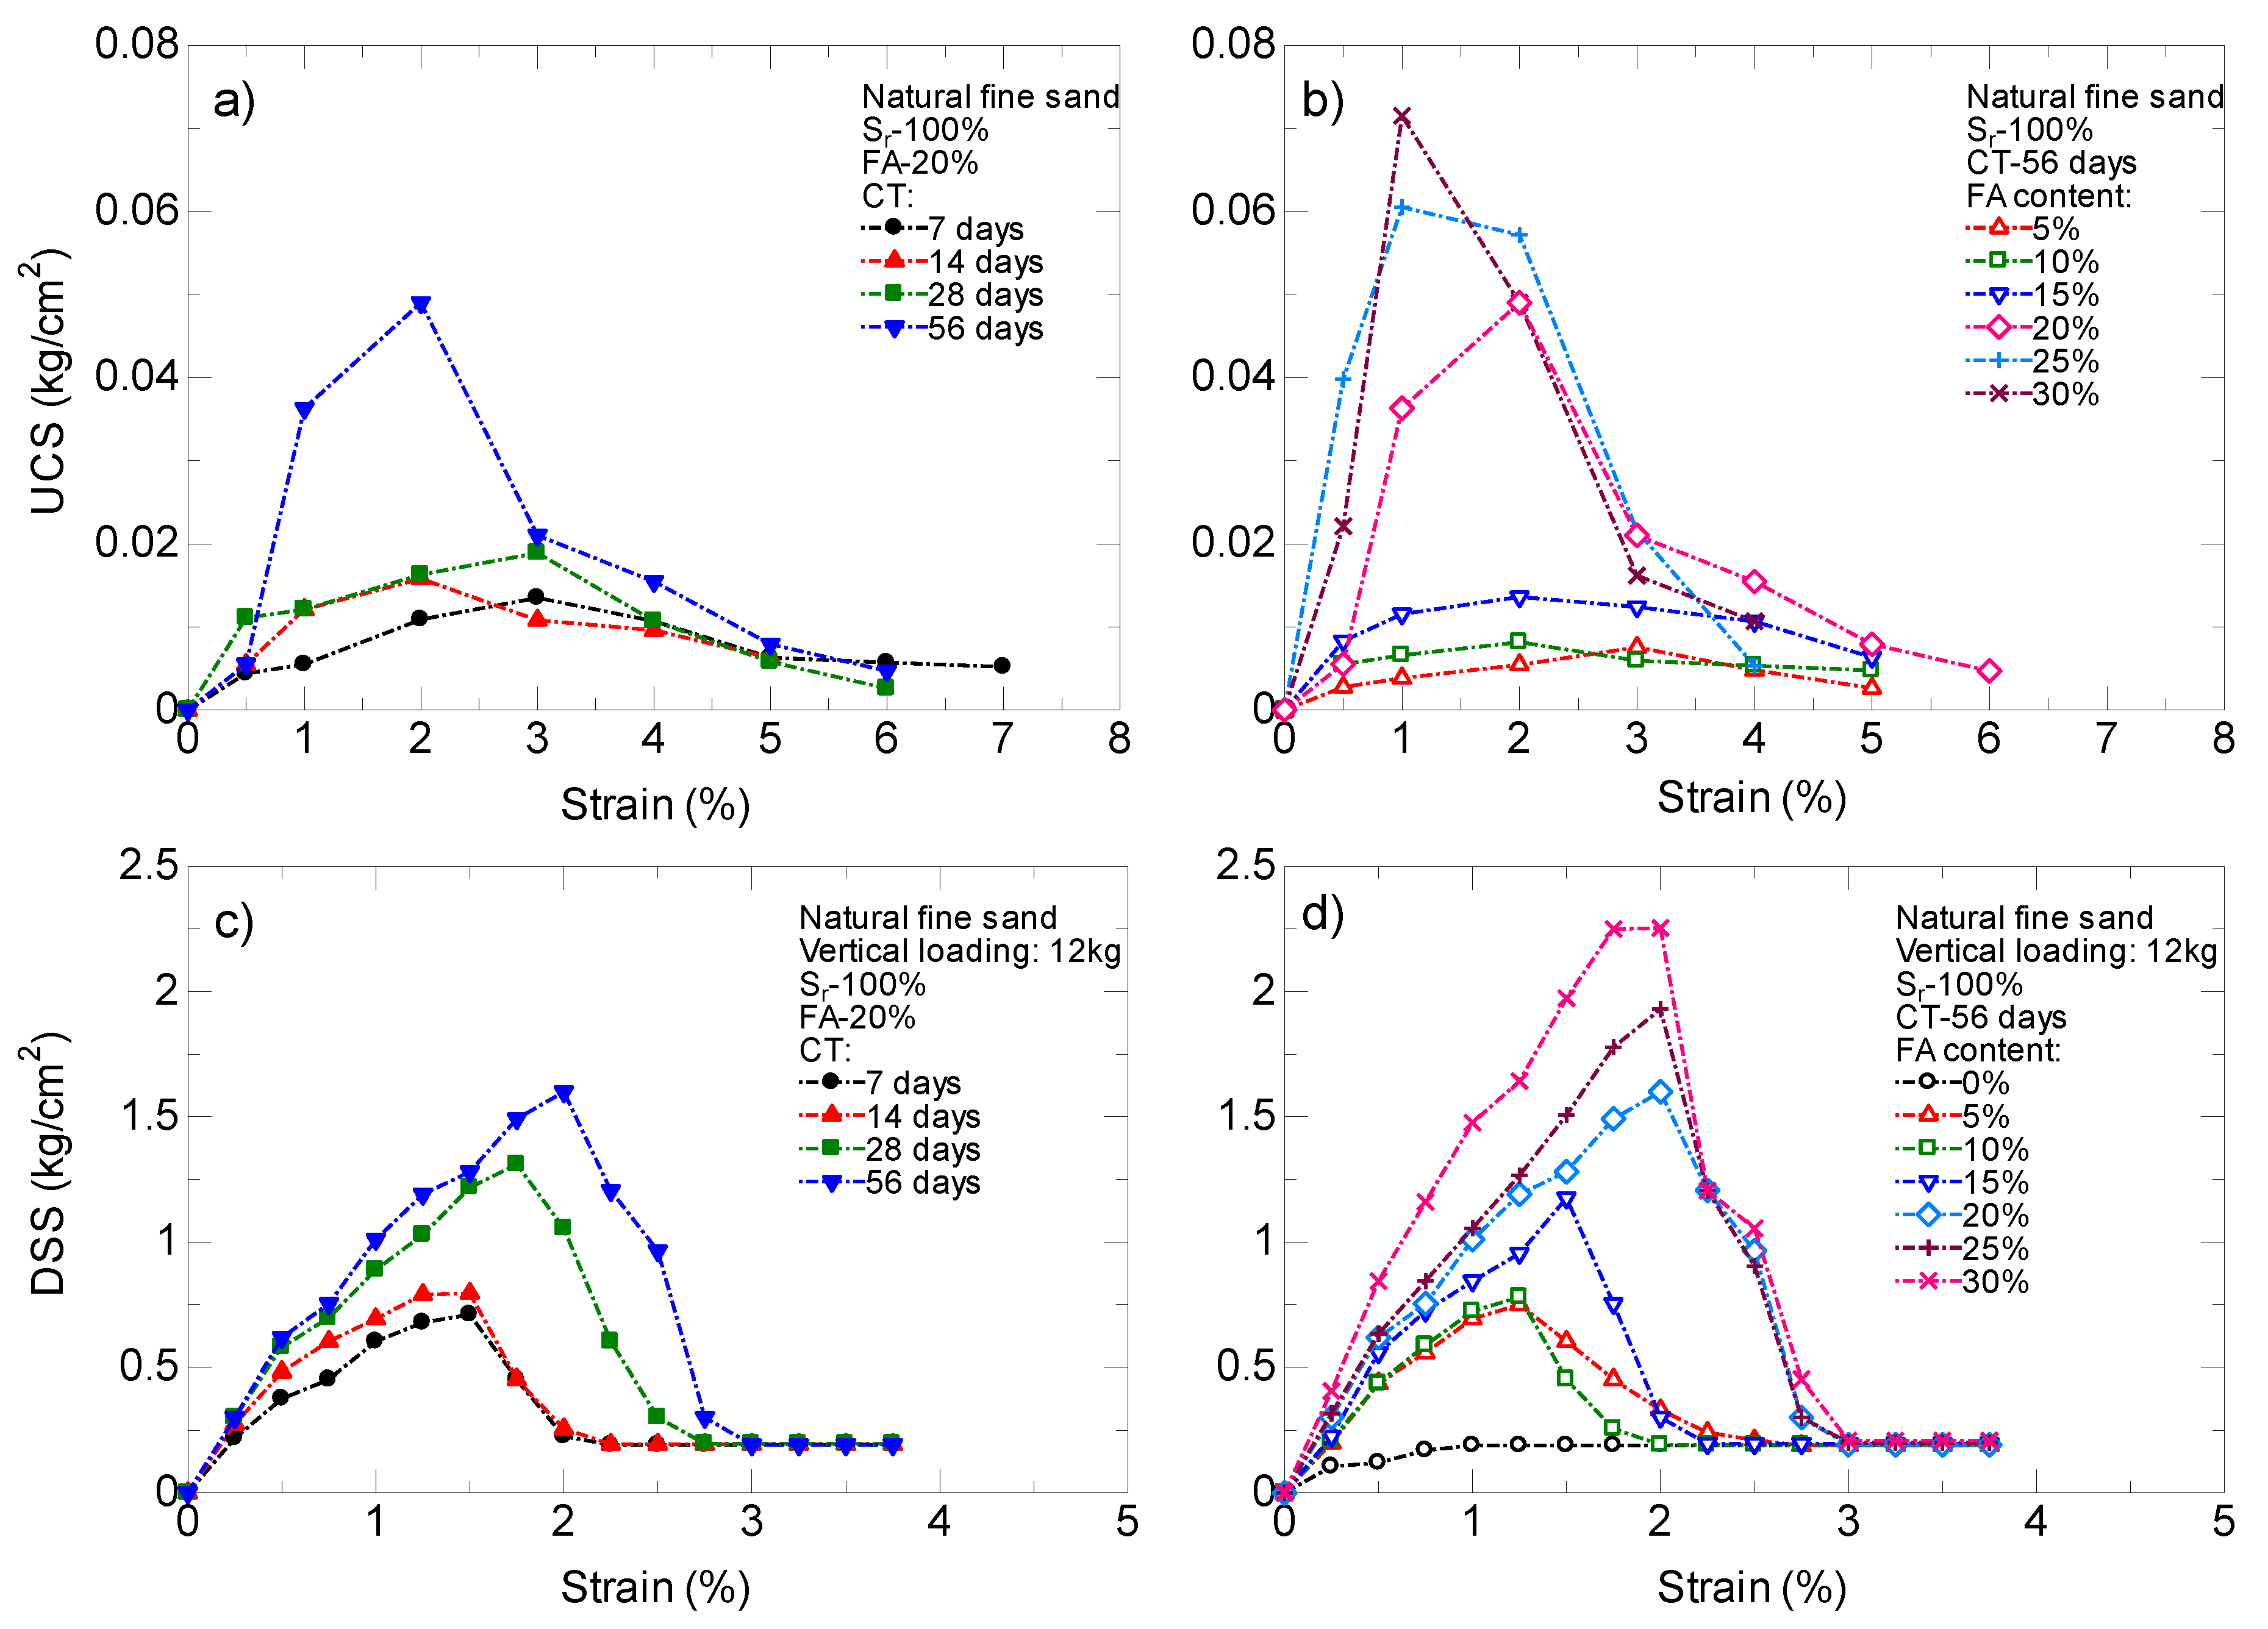
The typical stress–strain curve of unconfined compressive strength (UCS) and direct shear strength (DSS) tests on fly-ash-stabilized fine sands, under different curing times and fly ash contents, are shown in Figure 2. Both UCS and DSS test results clearly show that, at low fly ash (FA) contents of less than 20%, stresses incrementally increase along with strain elongation up to the peak failure state of the specimen’s stresses at any curing time. By contrast, both UCS and DSS tests indicate that those stresses increase sharply up to that corresponding to higher fly ash content, particularly at longer curing times. The higher the CT and FA content, the higher the peak stress reached. As aforementioned, the peak occurred at a very low strain. At a low FA content and CT, this strain was about 1.5%, particularly for shear strength curves, while at a higher FA content and CT, that strain was at 2%, as for the case of both the UCS and DSS stress–strain relationships in Figure 2. This fact illustrates that fly-ash-stabilized sand with a higher FA content and longer CT is more resistant to shearing up to a certain strain of 2%. The increase in FA content binds sand grains into larger and stronger particles as a result of the cementitious, pozzolanic reaction, and the self-hardening occurring during curing. This mechanism continues over time, and at the same time, there is an upgrade in the mechanical properties of the specimen. This prospect is more obvious in the specimen with greater CT and FA content, particularly the shearing specimen. In the case of the compressed specimen shown in Figure 2b, there is an exception: the peak stress of the specimen with the highest FA content and longest CT was at a lower strain of 1%. Those stresses, UCS and DSS, decrease continuously after the 2% strain has been exceeded, except for untreated sand (FA content = 0). The shear stress of untreated sand remains stable, even though the shear strain is extended, showing a failure state of the untreated sands. For stabilized sands, the stress decreases smoothly at lower fly ash contents. However, the stress alleviates sharply at higher fly ash contents, indicating brittle behavior of the bonding prepared by fly ash. The beneficial effect of fly ash through binding sand particles seems to have disappeared. A strain of approximately 2% is able to abolish this advantage.
On the basis of Table 5, UCSmax increases along with the increases in FA content and CT for both fine and coarse sand. Both natural and clean sands also show the same trend. This improvement with increases in FA content is the result of the bonding of grain into larger particles owing to increased FA. Along with the time of curing, self-hardening takes place on the generated bond, producing a stronger specimen. These prospects were also noted by Bell (1989), Ola (1978), and others [30,37,38,39,40]. In terms of the different saturations during sample preparation, UCSmax increases with decreasing Sr, as shown from the available data in Table 5. Specimens were prepared under three different Sr of 30%, 50%, and 100%. It was found that the highest value of UCSmax occurred for clean fine sand with a larger FA content and CT, and lower Sr. It seems that, at low saturation, there is a significant improvement in the mechanical properties of fly-ash-stabilized sands. This trend agrees with the test results of the investigations detailed in Jalali et al. (1997), Jha et al. (2009), and Sezer et al. (2006) [30,31,32], who made a valuable prediction; that is, that the observed improvements in mechanical properties might be caused by decreased saturation during curing. A similar observation conducted using another binder agent of precipitated calcite under various degrees of saturation was reported by Simatupang and coworkers, and Cheng et al. (2013) [8,9,34,41]. They found that the mechanical properties of calcite-treated sands increased with a decrease in saturation during curing. The test results attained in this research along with the previous test results indicated that Sr had an important role in improving the mechanical properties of fly-ash-stabilized sands.
In addition, the shear strength of the fly-ash-stabilized sand is higher than that of untreated sand, as presented in Figure 2d. This amelioration is conferred by the fly ash that is added to the sand specimen. Fly ash binds sand grains, creating a matrix among them, and hardens during curing, enhancing the mechanical properties of that sand. Regarding the stress–strain relationship, the shear strength of fly-ash-stabilized sands displays a similar trend to the compressive strength in terms of both the improvement rate and the fragility of fly ash binding. Specimens cured at a higher FA content and CT, but at lower Sr, show a dramatic increase in their strength until they reach their peak strength at a specific strain. In further shearing, the peaks of the strengths show a drastic fall in the small strain rate, demonstrating their fragility.
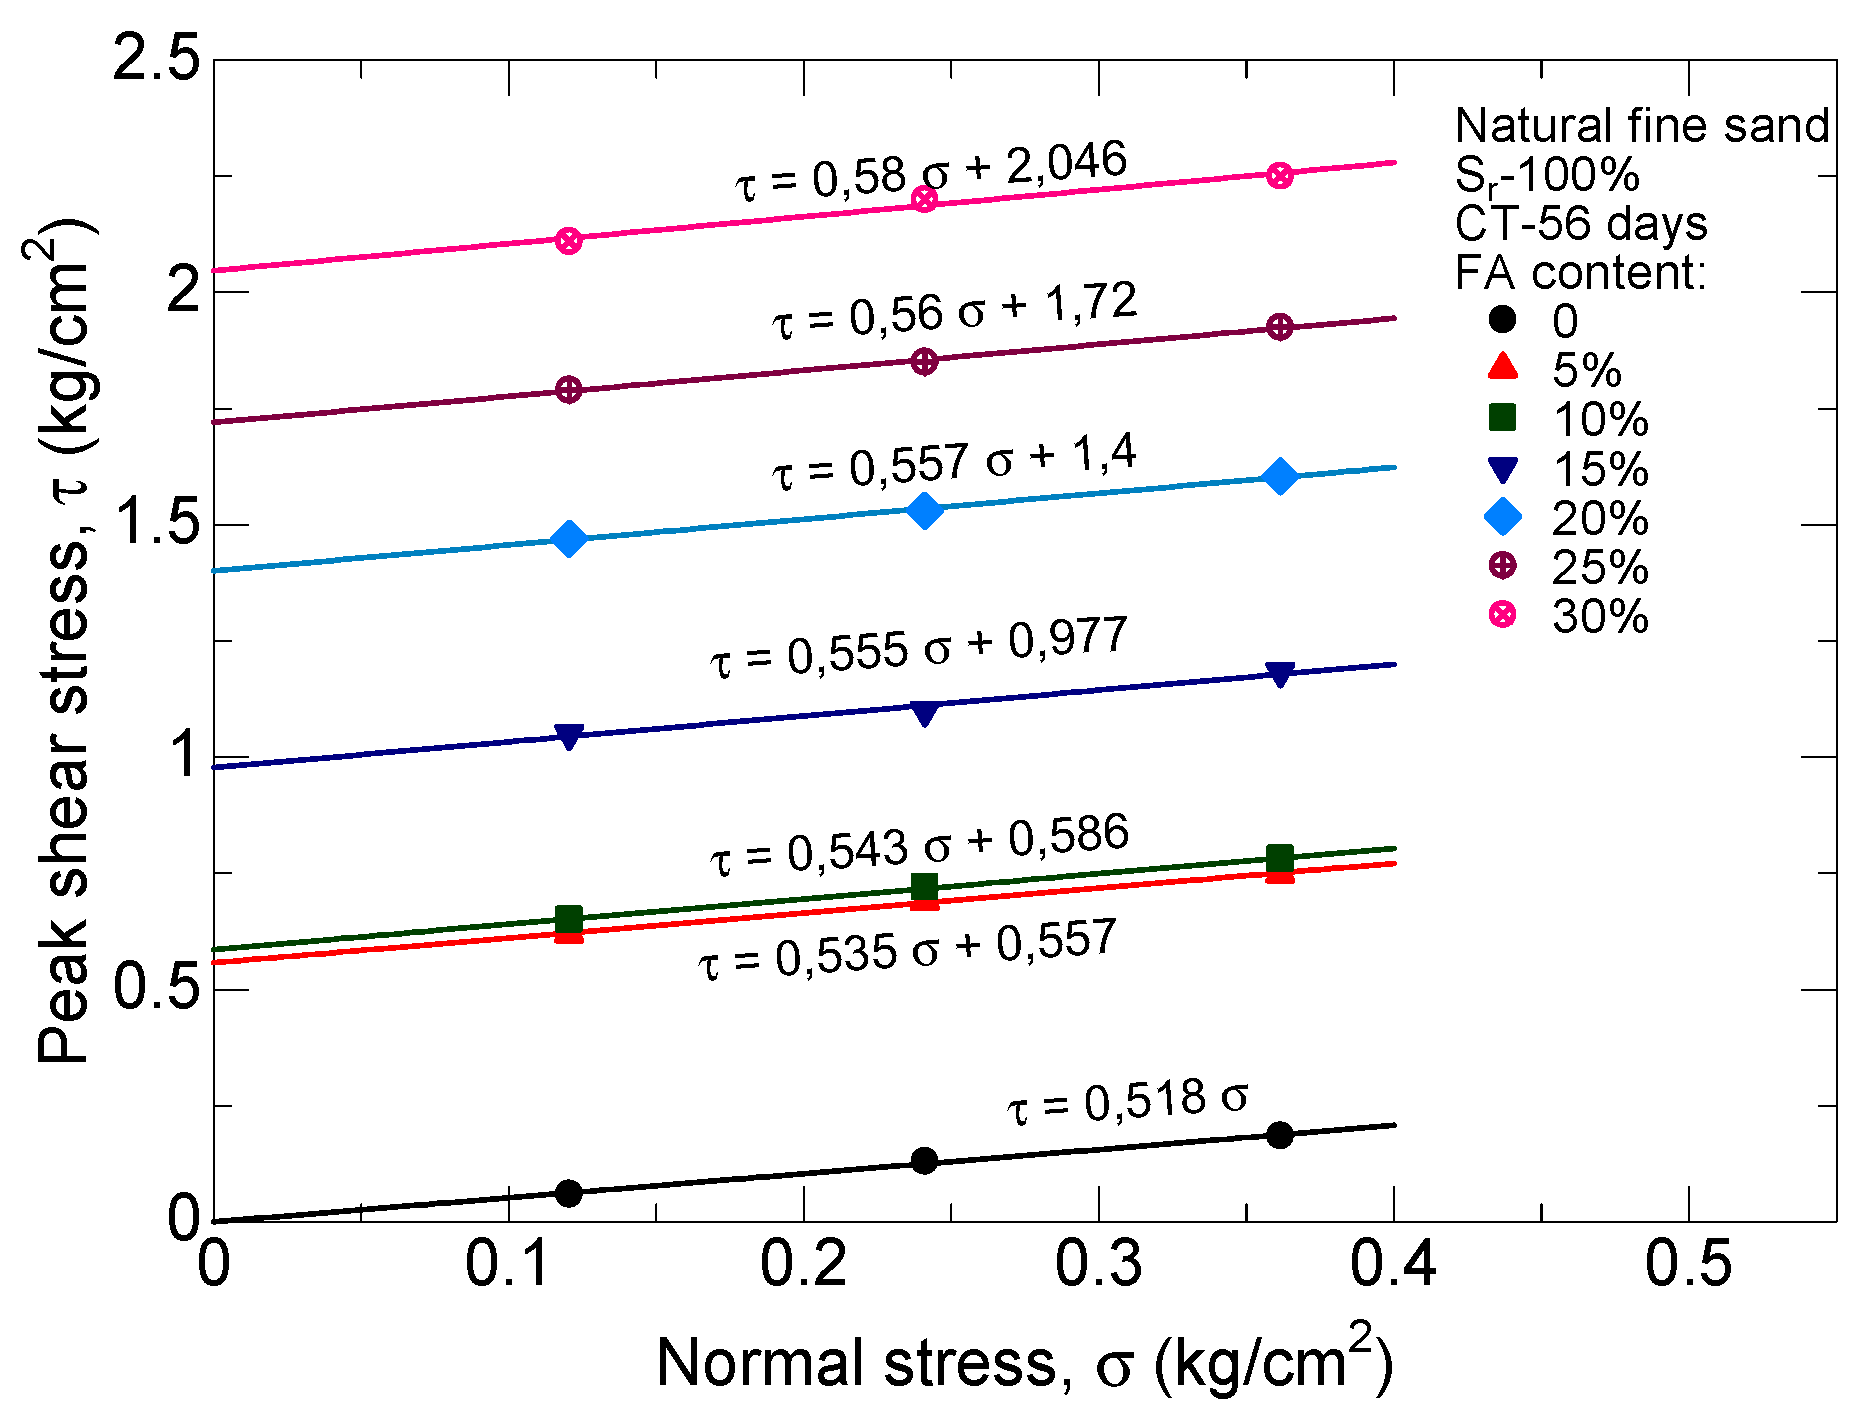
The graphs presented in Figure 2d are redrawn in Figure 3 in the form of shear strength parameters of cohesion “c” and friction angle “θ”. They were measured based on the graph connecting the peak shear stress at each normal stress applied at 0.12, 0.24, and 0.36 kg/cm2 according to the Mohr–Coulomb theory, as depicted in Figure 3. The graphs depicted in this figure clearly show that the shear strength parameters increase with FA content. In the case of the specimens cured at FA contents of either 5% or 10%, as included in Figure 3, their cohesions almost coincide. This is probably because of the fabric effect, as the FA contents at sample preparation were dissimilar [42].
Moreover, on the basis of the data available in Table 6, shear strength parameters increase with the increase in CT and the decrease in Sr. The increase in those parameters is the result of the increase of the amount of FA binding sand particles at the surface into larger grains as a consequence of the addition of FA into the specimen and the effectiveness of decreasing Sr. A larger grain produces a higher friction angle. The pozzolanic reaction, self-cementitious parameters, and loss of saturation during curing are other main factors resulting in the improvement of those parameters. Self-hardening makes the specimen stronger, which is directly related to the cohesion improvement. Other researchers have included these aspects in their considerations [30,31,32]. Simatupang and coworkers (colleagues) conducted observations on other binders of precipitated calcite and obtained a similar trend [8,9,41]. The results of their observations showed that the cohesion of the precipitated calcite increased by increasing calcite content and decreasing saturation during curing. Furthermore, they found that, at a CT of around 6 h, the precipitated calcite reached its optimum strength. This was determined by measuring the stiffness of the treated specimen at a small strain level during curing.
The shear strength parameters of fly-ash-stabilized sands are also influenced by the type of the sands used and their grain sizes. As shown in Table 6, they are distinguished based on their types as natural or clean sands, and their grain sizes as fine or coarse sands. It was found that the shear strength parameters of the clean sands were higher than those of the natural sands for both fine and coarse sands. The same trend was outlined by the grain size of sand, in which the friction angle “θ” for coarse sand was larger than that for fine sand. However, this is not the case for coarse sand in terms of cohesion; the cohesions of coarse sand are below those of fine sand. These trends apply to all cases of tested sand, and the results are tabulated in Table 6.
If stabilized sands are sheared further, their strength fails and comes close to the residual shear strength of untreated sands, as clearly shown in Figure 2c,d. The main factor of this drawback is bond deterioration. At strain levels of more than 2%, the beneficial effect of fly ash bonds disappears. In this state, the fly ash bond is destroyed along with shearing, as aforementioned. A similar trend is noted in the test results previously attained by researchers, including Delfosse-Ribay et al. (2004), Lin et al. (2016), and Simatupang et al. (2019) [3,41,43]. They prepared a deformation characteristic test on a treated specimen and found that the shear modulus of treated specimens decreased sharply along with strain increases and approached that of untreated specimens. The same conclusion is also shown here; that is, that the key point is the decline in the function of the binder. More detailed information regarding both the UCS and DSS test results for different test conditions is listed in Table 5 and Table 6, consecutively.

3.2.2. Effect of the Fly Ash Percentage

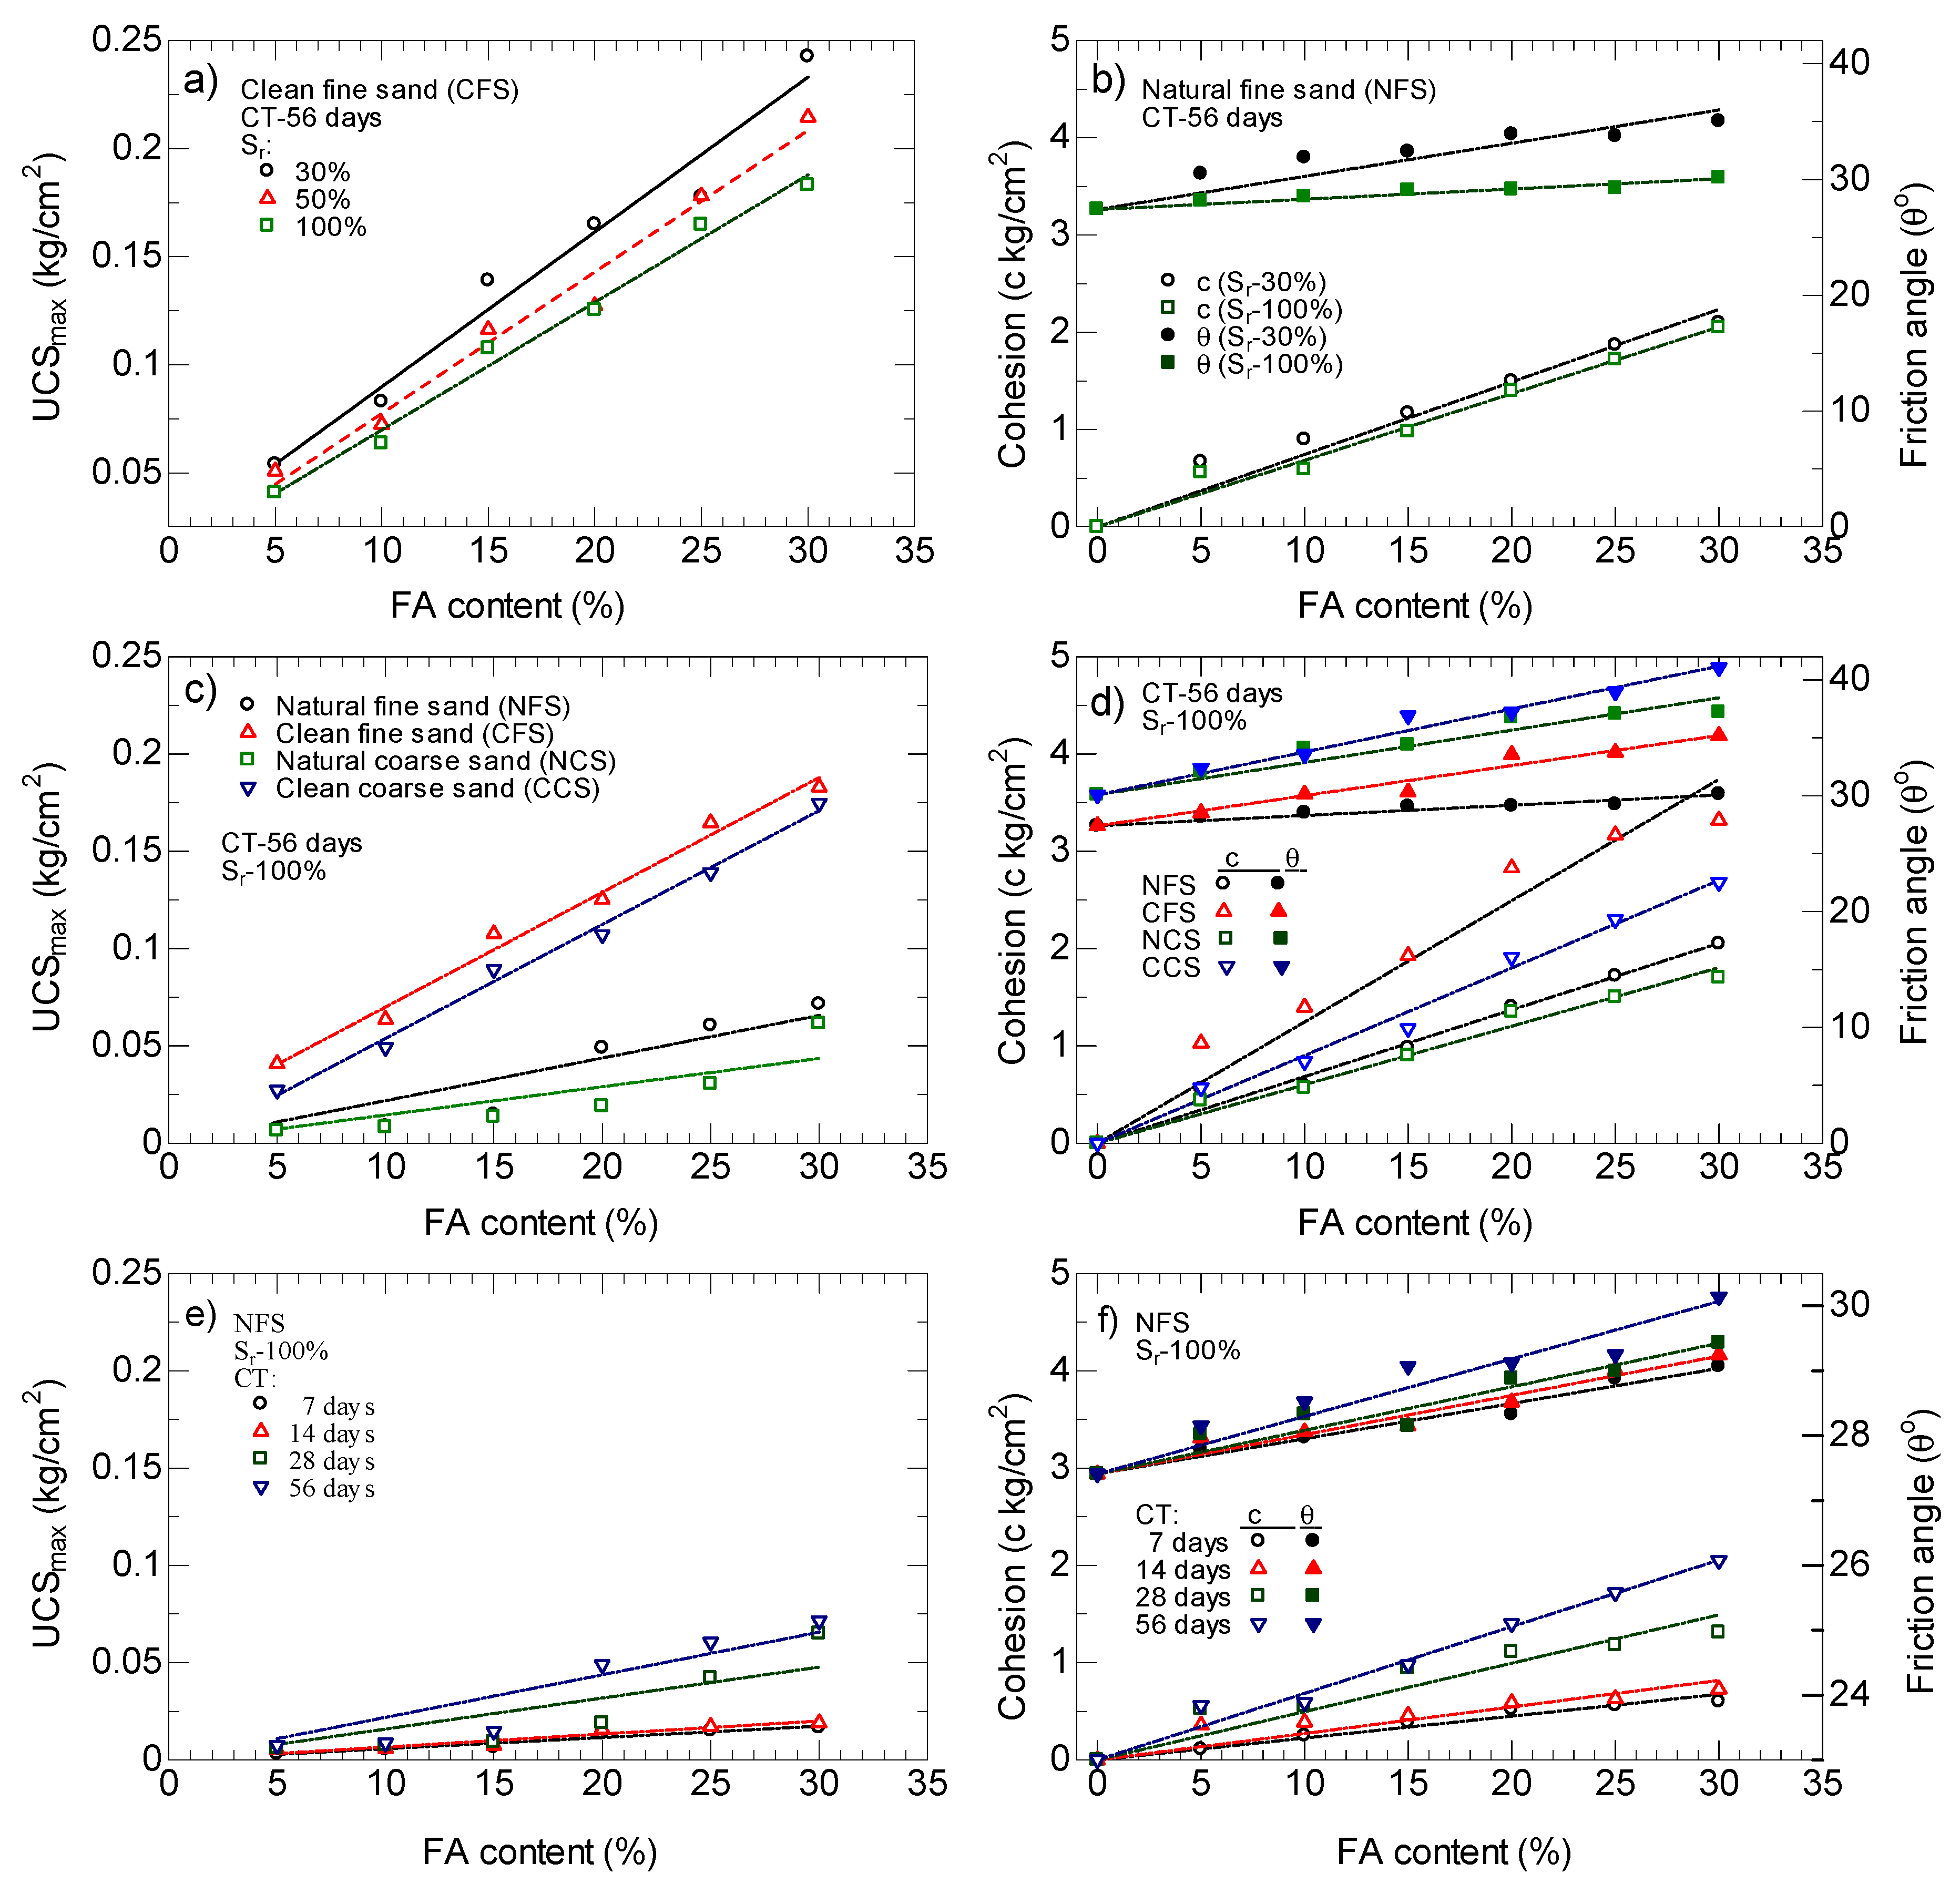
The effects of the fly ash (FA) content—which varied from 5% to 30% at intervals of 5%—on the UCS maximum and shear strength parameters of stabilized sand under the investigated parameters are tabulated in Table 5 and Table 6 respectively and shown typically in Figure 4. Some of the data plotted in the figures presented in this research were scattered, but their trends were represented by either solid lines or dashed dot lines, as shown in each figure. Both Table 5 as well as Table 6 and Figure 4 illustrate that the UCSmax tends to increase as the fly ash percentage increases in all cases of tested sands, as expected. The improvement in the UCSmax is a consequence of the bonding owing to FA. As the FA content increases, the sand particles become larger and stronger over time owing to self-hardening during curing. Previous research on fly-ash-stabilized soils prepared by Harichane et al., (2011), Ola (1978), Prabakar et al. (2004), Sezer et al. (2006), and Sridharan et al. (1997) showed the same behavior [18,28,30,37,39]. Other research on other binders of precipitated calcite showed a similar trend. The further increase in the content of the precipitated calcite generates a stronger material; it becomes rock-like with a higher UCS of typically more than several MPa [7,44,45].
The shear strength parameters of the fly-ash-stabilized sands in this research were stated as a function of the cohesion and friction angle, as expressed by the Mohr–Coulomb strength theory. They increase in fly ash content, as revealed in Figure 4b,d,f. Additional information taken from that figure indicates that the shear strength parameters of the fly-ash-stabilized sands are always higher than those of the untreated sands, showing the bond effect conferred by fly ash. Sand particles are bonded into larger and stronger grains and behave as dense sands. A similar trend was reported by Harichane et al. (2011), Ola, (1978), Prabakar et al. (2004), Sezer et al. (2006), and Canakci et al. (2015) [18,30,37,39,46].
The friction angles of untreated sands were around 27.413° and 30.07° for fine and coarse sands, respectively, and were independent of Sr. This condition is in line with the test results obtained by Cheng et al. (2013) [34]. Their test was conducted under Sr values of 30%, 65%, and 100%; however, they did not influence the friction angle of untreated silica sands, both fine and coarse. The friction angles of fly-ash-stabilized sand performed in this research, for both fine and coarse sand, were around 27.78–35.51° and 30.14–42.12°, respectively. Those friction angles were within the values reported by Cheng et al. (2013) [34]. Their test results were around 23–40° and 25–42° for fine and coarse silica sand, respectively. Similar performances were reported in other research studies conducted by Bell (1989), Canakci et al. (2015), and Ola (1978) [37,38,46].
The parameter of cohesion “c” showed values of 0–1.80 kg/cm2 and 0–2.89 kg/cm2 for both fine and coarse sands, respectively. These values are also in the range of values reported by Cheng et al. (2013) [34] using silica sands.

3.2.3. The Effect of Curing Time

The effects of curing time on the strength of the fly-ash-stabilized sands at various predetermined indicators are shown in Figure 5. The figure depicts the importance of curing time in determining strength improvement. The higher the curing time, the larger the UCS of the resulting specimen. A larger FA content of more than 20% produces a significant increase in UCSmax, especially at a later age. A significant loss of moisture at a later age might have occurred, consequently resulting in a notable improvement in UCSmax. This trend is in agreement with the test results shown by other investigators [30,31,32]. By contrast, for an FA content less than 15%, insignificant increases in UCSmax occur along with curing time. This is probably because of the bonding effect. At a low FA content, weak bonding between sand particles results in low strength. The following example, which occurred during the experiment in this study, further supports this trend; coarse sand specimens prepared with low FA contents showed weak bonding and were not strong enough to hold their own weight, as evidenced by their failure after encasing from their molds (shown by the empty values in Table 5). A similar fact was also demonstrated by Ola (1978), who showed that the increase in the mechanical properties of soil was largely dependent on the amount of the binder agent binding soil particles into larger and stronger aggregates. In such a condition, the soil behaves as a coarse aggregate that was strongly bound [37].
In addition, there is a considerable improvement in the shear strength parameters of both “c” and “θ” with the progression of curing time. On the basis of Figure 5, the cohesion increases around four-fold from a curing time of 7 to 56 days, especially for clean coarse sand (CCS) at an FA content of 20% and Sr of 100%. This is predicted to be because of the self-hardening of the mixture between the fly ash and sand particles. Previous research conducted by Gay and Schad (2000), Harichane et al. (2011), and Sezer et al. (2006) reported a similar trend [30,39,40].
However, the strength improvement is delayed at the beginning of the curing time. More time is required for the pozzolanic reaction in forming the cementitious compounds, CSH and CAH, in the mixture of soil particles and fly ash. At a curing time of less than 28 days, the strength increases slowly. It then sharply increases and slows down thereafter. Similar trends were shown in the results of research conducted by Amadi (2014), Amadi and Osu (2018), Consoli et al. (2001), Jha et al. (2009), Jalali et al. (1997), Miller and Azad (2000), Oriola and Moses (2011), Osinubi (2000), Peethamparan and Olek, (2008), Salahudeen et al. (2014), Sezer et al. (2006), and Sreekrishnavilasam et al. (2007) [21,22,23,24,25,26,27,30,31,32,47,48]. In more detail, Jalali et al. (1997) confirmed that the delayed improvement in the strength of stabilized soil was strongly dependent on the curing temperature [32].
In this research, experiments were conducted under constant room temperature of around 25 °C, either during sample preparation, curing, or testing. It was ensured that there was no acceleration or deceleration on saturation reduction owing to temperature fluctuations during the experimental stages. The delay in the strength improvement at the initial stage is the natural behavior of FA as a binder. Sufficient time is needed for completion of the pozzolanic reaction in establishing cementitious and pozzolanic gel [21,22,23,24,25,26,27,30,31,32,38,47,48].
In terms of strength improvement, there should be a situation where there is no further change in strength even though the curing time increases. This condition is stated as the maximum strength that can be reached by the specimen. It seems that, in this research, the curing time needed for the specimen to attain the maximum strength was longer than a month, as shown in Figure 5. The majority of the graphs presented in that figure show that the strength increases significantly from a curing time of 14 to 28 days, but insignificantly thereafter, as observed for up to 56 days. Further studies are needed to determine the optimum curing time to achieve the maximum strength of fly-ash-stabilized sands.

3.2.4. The Effect of Degrees of Saturation

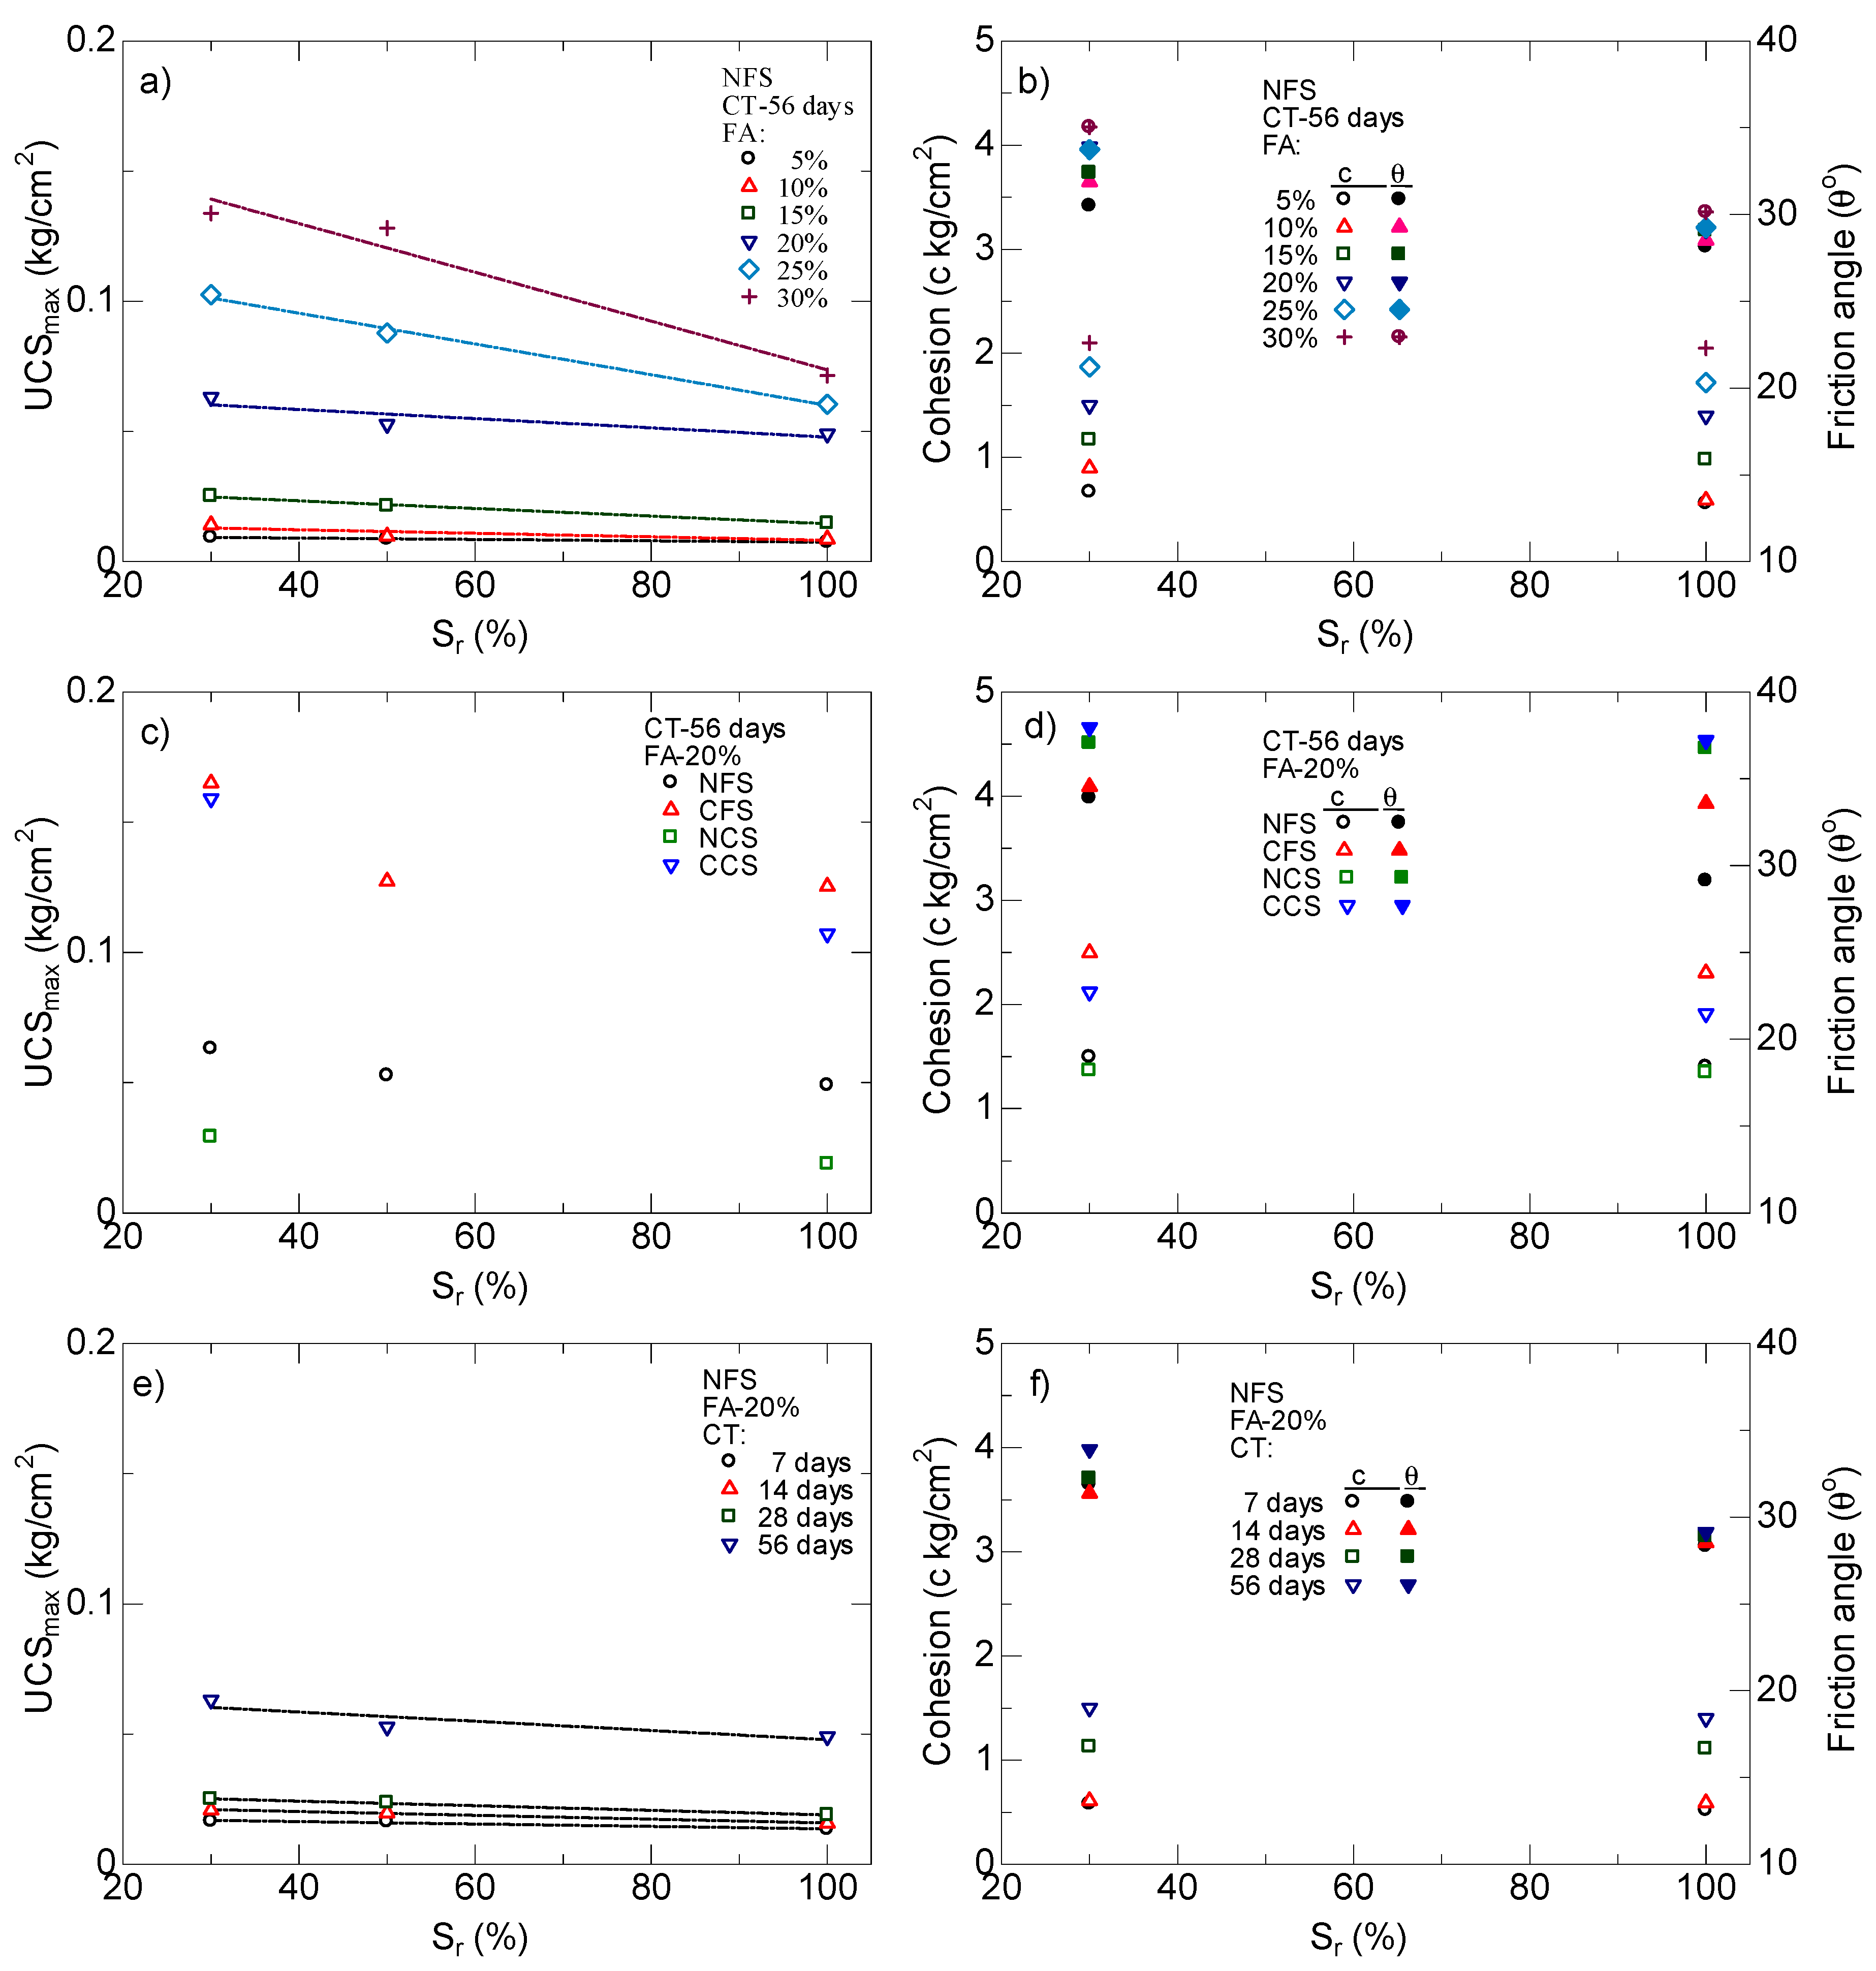
Figure 6 illustrates that the degree of saturation during sample preparation influences the strength of fly-ash-stabilized sand. The specimens were prepared under a degree of saturation of 30%, 50%, or 100%. The fly ash percentages and curing times were varied. Those percentages started from 5% to 30% with 5% intervals, and the curing times were 7, 14, 28, and 56 days.
On the basis of Figure 6, the mechanical properties of fly-ash-stabilized sand increase with the decrease in the degree of saturation during sample preparation for all cases of the reviewed parameters. This increase is predicted to be because of the effectiveness of fly ash binding that congregates at inter-particle contact and is directly related to the improvement in strength. With a higher degree of saturation during sample preparation, a longer time is needed for evaporation to reduce the saturation. This trend is in line with the test results obtained by others prepared on calcite-treated sands under different Sr [8,9,34,41]. In terms of the strength improvement shown in Figure 6, the highest values occur for clean sands with a higher FA content and CT, but with a lower Sr.
With an FA content and CT of 30% and 56 days, respectively, the UCSmax increased by approximately 1.5–2 times when decreasing the Sr from 100% to 30%. On the other hand, the FA content could be reduced by around one-third to one-half to anticipate the expected UCSmax by lowering Sr, as with the previous rate. For example, in the case of natural fine sand (NFS) (as presented in Table 5), at 14 days of curing, fly-ash-stabilized sand cured at FA contents of either 30% or 20% provided almost the same UCSmax value under Sr of either 100% or 30%, respectively. This mechanism can be explained as follows. At a higher Sr of, for example, 100%, the entire surface of fly-ash-stabilized sand will be moistened with water. In such conditions, keeping in mind the basic nature of the FA in that it will react in the presence of water, the entire surface of the sand will be covered with cementitious material. As a consequence, a lot of the cementitious material formed beyond the contact surface will not be beneficial in increasing the strength of the fly-ash-stabilized sand. The limited cementitious material formed binds sand at inter-particles, which contributes to a small increase in strength. This is also noted by the researchers for the calcite precipitation approach. The spatial distribution of calcite in the calcite-treated soil observed using microscopic images showed that the precipitated calcite was distributed uniformly not only at the contact surface, but also over the whole surface [7,43,49,50,51].
At low Sr, however, pore water is concentrated on the contact surface, forming a meniscus where the formed cementitious material will accumulate, which will result in an increase in the strength of the fly-ash-stabilized sand. A similar investigation on different binder agents of calcite-treated sands has been conducted by Simatupang and colleagues with Sr of 30% and 97% [8,9,41], and Cheng et al. (2013) with Sr of 20%, 40%, 80%, and 100% [34]. They provided scanning electron microscopy (SEM) images for specimens in order to show the more detailed effect of Sr on treated sands. The SEM results show that, for specimens prepared under higher Sr, the precipitated calcite was distributed uniformly on the sand surface. Only a small amount of the precipitated calcite binds sand particles, which results in a small increase in strength. At low Sr, however, the calcite was precipitated locally at the contact surface between grains, which was directly related to the strength improvement. This result, along with the findings of this study, demonstrates that the effectiveness of fly-ash-stabilized sand depends on the formation of cementitious material generated by the FA content present in the specimen. The agglomerate of cementitious material at the interparticle contact surface is more valuable than the total sum of that on the entire surface of the sand.
However, there may be a minimum limit of water content in the specimen that is capable of dissociating the lime (CaO) that exists in the fly ash and establishing the cementitious and pozzolanic gels. The latter will be the next topic for research into the effectiveness of fly ash usage as a cementitious material.

3.2.5. The Effect of Grain Size

The effect of grain size on the mechanical properties of fly-ash-stabilized sands (unconfined compressive and direct shear strength) for different fly ash contents, curing times, and degrees of saturation during sample preparation is shown in panels (c) and (d) of Figure 4, Figure 5 and Figure 6. The graph provides the value of the UCS maximum and shear strength parameters of fly-ash-stabilized sand for both fine and coarse sand. It is clearly depicted that the UCS maximum of the smaller grain size is higher than that of the larger grain size. Relative angularity is one of the main factors contributing to this increase. This is the ratio between the crystal size donated by fly ash binding on the surface of the sand and the size of the sand grain. At the same crystal size, smaller granules produce greater relative angularity, directly yielding a higher strength increase. The same results occur for the cohesion “c”, but not for the friction angle “θ”. The friction angle is higher with a larger grain size. As for sand with a large grain size and a low curing time of up to 14 days, the effect of fly ash content on the unconfined compressive strength is almost zero. Fly ash bonding is not strong enough to retain the self-weight of the specimen. These failed after encasing from the mold (shown as empty value in Table 5). This is presumably because of the bonding effect provided by the fly ash. As aforementioned, the pozzolanic reaction in the formation of cementation (cohesion) develops slowly at the initial stage of curing. As a consequence, the bonding effect increases at a low rate, and there is less resistance to the working load.

3.2.6. The Effect of Content of Fines

The unconfined compressive strengths and shear strength parameters of fly-ash-stabilized sand with fine grains are presented in Figure 4, Figure 5 and Figure 6, which depict the use of sand with content of fines (natural sand) and without content of fines (clean sand). The content of fines, as referred to here, is the difference between the sand masses before and after being washed. The amount of the content of fines was around 2.88% and 1.33% of the total mass of the dry fine and coarse sand, respectively. The mechanical properties of the clean sand are higher than that of the sand with content of fines (natural sand) for all cases of fly ash content, curing time, and degree of saturation. Despite these increases in fly ash, the value of sand containing content of fines is always smaller than that without content of fines. This indicates that content of fines has a negative effect (inhibition) on the chemical reaction between fly ash and sand particles. It seems that, with a larger fly ash content, the mechanical properties of clean sands are much higher than those of sands with content of fines. The same behavior was mentioned by Axelsson et al. (2002), Canakci et al. (2015), Janz and Johansson (2002), Tremblay et al. (2002), and Hampton and Edil (1998). Their research concluded that content of fines could chemically influence the cementing reaction of the stabilized soil [46,52,53,54,55].
The effects of content of fines on the mechanical properties of fly-ash-stabilized sand under any kind of saturation are shown in Figure 4b and Figure 5a,b for both various FA contents and various CTs, respectively. Both figures illustrate the drawback of content of fines on the mechanical properties. The UCSmax and the cohesion almost coincide as Sr changes. It seems that the beneficial effect of lowering Sr, which will improve the mechanical properties of fly-ash-stabilized sand, is diminished by the presence of content of fines. At different grain sizes, on the other hand, depicted in panels (c) and (d) of those figures, a similar trend—near coinciding of both UCSmax and cohesion—is also shown. The content of fines degraded the serviceable quality of lower grain sizes and produced a lower UCSmax and cohesion. As mentioned above, a lower grain size generates higher mechanical properties of fly-ash-stabilized sands, but this benefit is reduced with the presence of content of fines in the specimen. Regarding the other parameters of CT and FA content depicted in Figure 4 and Figure 5, particularly panels (e) and (f), narrow differences are presented, especially at low values of either CT or FA content. The presence of content of fines is predicted to extend the induction time. As a consequence, the cementitious process as well as pozzolanic reaction have not yet been properly completed, resulting in a low strength. A similar problem occurred when the FA content was low. Binding and hardening processes might be delayed for producing a larger and stronger particle. As content of fines is present in the fly-ash-stabilized sands, the mechanical properties of UCS and cohesion “c” come close to each other, and the serviceable quality of both CT and FA content improved slowly. It seems that this weakness is clearer for specimens cured at low CTs and FA contents. A similar trend is also illustrated in Figure 6.
On the other hand, the effect of the presence of content of fines in the liquefaction susceptibility of soil was investigated. It was found that liquefaction resistance increased with the increase in content of fines [56,57,58]. This finding, along with the test results obtained in this study, leads to the final remark that the decrease in the mechanical properties of sand with content of fines (natural sand) is not because of the lower strength of the content of fines itself, but is rather a result of both cementitious and pozzolanic reactions being inhibited by the presence of content of fines during curing.

4. Conclusions

Laboratory investigations were conducted involving UCS and DSS tests on sands, including fine and coarse sands, which were stabilized with fly ash. The reviewed parameters were fly ash percentages (5–30%), curing times (7–56 days), grain sizes (0.075–0.25 mm and 0.6–2 mm), degree of saturation during sample preparation (30%, 50%, and 100%), and content of fines (2.88% and 1.33%). This investigation was conducted to study the effects of those parameters on the mechanical behavior of sands stabilized with fly ash. On the basis of the test results, the following conclusions can be made.
Specimen stresses incrementally increase with strain up to the peak failure state at low FA contents of less than 20%, irrespective of CT. However, those specimen stresses grow sharply along with strain elongation up to that at a higher FA content, especially at a longer CT. The peak failure state achieved by the specimen occurred at a very low strain of around 1.5% for the specimen cured with FA content and CT at low-scale and 2% for that at a higher value. This illustrates that the specimens cured at a higher FA content and longer CT are more resistant to shearing up to a specific strain of 2%. In further shearing after those strains were achieved, their stress–strain relationships decrease continuously and come close to the peak stress of untreated sand. Those decreases were sharper on the specimen cured at a higher FA content and longer CT, indicating brittle behavior of the bonding prepared by fly ash. The beneficial effects of fly ash bonds seem to disappear and be destroyed in strains exceeding 2%.
The stress–strain relationship of fly-ash-stabilized sands is quite different from that of untreated sands. The peak stresses of untreated sands remain stable in the failure state, and this is generally counted as residual strength.
The mechanical properties—UCS and DSS stated in the form of shear strength parameters—of fly-ash-stabilized sand increase with the fly ash content. Those parameters of cohesion “c” and friction angle “θ” of fly-ash-stabilized sands are always higher than those of untreated sands. The increase in the mechanical properties is caused by the fly ash bonding, which binds the grains of sand into larger and stronger particles as a result of further increases in FA content. Self-cementation and self-hardening during curing become a main factor on that improvement.
The mechanical properties of fly-ash-stabilized sands are delayed at the initial stage of curing and increase significantly thereafter. It seems that more time is needed to complete the pozzolanic reaction in establishing the cementitious compounds of both CSH and CAH. A significant improvement in the mechanical properties of fly-ash-stabilized sands occurring at a higher CT is estimated owing to a decrease in saturation during the curing and self-cementing process given by fly ash.
A low degree of saturation during sample preparation provides significant improvement in the mechanical properties of fly-ash-stabilized sand. This is because of the effectiveness of the fly ash bond, which clots on the contact surface, which is directly related to the increase in strength. At a low Sr, pore water is concentrated around the contact surface where the fly ash bond is coagulated, resulting in an increase in the mechanical properties.
The mechanical properties of fly-ash-stabilized sands are higher at a lower grain size, except for the friction angle. In the case of friction angle, bigger grain size produces a higher friction angle. This is caused by the relative angularity provided by fly ash bond. This is the ratio between the size of the crystal produced by the FA content and the size of the sand particles. At the same crystal size, the relative angularity of the smaller grain size is higher than that of the bigger grain size, which leads to an enhancement in the mechanical properties.
Fine content has a negative effect on the mechanical properties improvement of fly-ash-stabilized sand. This can disturb the chemical reaction between fly ash and sand, which is directly related to strength deterioration. As a consequence, the mechanical properties of clean sands (without fines) are higher than those of natural sands (with fines).

Author Contributions

Conceptualization, M.S. and L.K.M.; methodology, M.S. and R.S.E.; validation, A.A.P., M.T.A., and N.H.A.; formal analysis, W.M. and N.H.A.; investigation, M.S., L.K.M., and R.S.E.; resources, W.M.; data curation, M.S. and L.K.M.; writing—original draft preparation, M.S. and R.S.E.; writing—review and editing, L.K.M., A.A.P., M.T.A., and N.H.A.; project administration, W.M.; funding acquisition, M.S., L.K.M., and R.S.E. All authors have read and agreed to the published version of the manuscript.

Funding

This research was funded by Higher Education of Indonesia, grant number 171/SP2H/LT/DRPM/2019.

Acknowledgments

The financial support for this research was provided by Higher Education of Indonesia. The authors would like to acknowledge Halu Oleo University as a leading sector on this research, all members of the research, technicians, students, and all participants. Fly ash used in this research was collected from Steam Power Generation of Nii Tanasa, Konawe Regency, Southeast Sulawesi Province-Indonesia. Those supports are gratefully acknowledged.

Conflicts of Interest

The authors declare no conflicts of interest.

References

  1. Dano, C.; Hicher, P.-Y. Behaviour of Uncemented Sands and Grouted Sands before Peak Strength. Soils Found. Jpn. Geotech. Soc. 2003, 43, 13–19. [Google Scholar] [CrossRef] [Green Version]
  2. Dano, C.; Hicher, P.Y.; Tailliez, S. Engineering Properties of Grouted Sands. J. Geotech. Geoenviron. Eng. ASCE 2004, 130, 328–338. [Google Scholar] [CrossRef]
  3. Delfosse-Ribay, E.; Djeran-Maigre, I.; Cabrillac, R.; Gouvenot, D. Shear Modulus and Damping Ratio of Grouted Sand. Soil Dyn. Earthq. Eng. 2004, 24, 461–471. [Google Scholar] [CrossRef]
  4. Pantazopoulos, I.A.; Atmatzidis, D.K. Dynamic Properties of Microfine Cement Grouted Sands. Soil Dyn. Earthq. Eng. 2012, 42, 17–31. [Google Scholar] [CrossRef]
  5. Acar, Y.B.; El-Tahir, E.-T.A. Low Strain Dynamic Properties of Artificially Cemented Sand. J. Geotech. Eng. 1986, 112, 1001–1015. [Google Scholar] [CrossRef]
  6. Al Qabany, A.; Soga, K. Effect of Chemical Treatment used in MICP on Engineering Properties of Cemented Soils. Géotechnique 2013, 63, 331–339. [Google Scholar] [CrossRef]
  7. Yasuhara, H.; Neupane, D.; Hayashi, K.; Okamura, M. Experiments and Predictions of Physical Properties of Sand Cemented by Enzymatically-Induced Carbonate Precipitation. Soils Found. Jpn. Geotech. Soc. 2012, 52, 539–549. [Google Scholar] [CrossRef] [Green Version]
  8. Simatupang, M.; Okamura, M. Liquefaction Resistance of Sand Remediated with Carbonate Precipitation at Different Degrees of Saturation during Curing. Soils Found. Jpn. Geotech. Soc. 2017, 57, 619–631. [Google Scholar] [CrossRef]
  9. Simatupang, M.; Okamura, M.; Hayashi, K.; Yasuhara, H. Small-strain Shear Modulus and Liquefaction Resistance of Sand with Carbonate Precipitation. Soil Dyn. Earthq. Eng. 2018, 115, 710–718. [Google Scholar] [CrossRef]
  10. Kitazume, M.; Okamura, M. Contributions to “Soils and Foundations”: Ground Improvement. Soils Found. Jpn. Geotech. Soc. 2010, 50, 965–975. [Google Scholar] [CrossRef] [Green Version]
  11. Xiao, Y.; He, X.; Evans, T.M.; Stuedlein, A.W.; Liu, H. Unconfined Compressive and Splitting Tensile Strength of Basalt Fiber-Reinforced Biocemented Sand. J. Geotech. Geoenviron. Eng. 2019, 145. [Google Scholar] [CrossRef]
  12. McCarthy, M.J.; Csentanyi, L.J.; Jones, M.R.; Sachdeva, A. Clay-Lime Stabilization: Charecterizing Fly Ash Effects in Minimizing the Risk of Sulfate Heave. In Proceedings of the World Coal Ash Conference, Denver, CO, USA, 9–12 May 2011. [Google Scholar]
  13. Tastan, E.O.; Edil, T.B.; Benson, C.H.; Aydilek, A.H. Stabilization of Organic Soils with Fly Ash. J. Geotech. Geoenviron. Eng. ASCE 2011, 137, 819–833. [Google Scholar] [CrossRef] [Green Version]
  14. Edil, T.B.; Acosta, H.A.; Benson, C.H. Stabilizing Soft Fine-Grained Soils with Fly Ash. J. Mater. Civ. Eng. 2006, 18, 283–294. [Google Scholar] [CrossRef]
  15. Parsons, R.L.; Kneebone, E. Field Performance of Fly Ash Stabilised Subgrades. GR Improv. 2005, 9, 33–38. [Google Scholar] [CrossRef]
  16. Lirer, S.; Liguori, B.; Capasso, I.; Flora, A.; Caputo, D. Mechanical and Chemical Properties of Composite Materials Made of Dredged Sediments in a Fly-ash based Geopolymer. J. Environ. Manag. 2017, 191, 1–7. [Google Scholar] [CrossRef]
  17. Capasso, I.; Lirer, S.; Flora, A.; Ferone, C.; Cioffi, R.; Caputo, D.; Liguori, B. Reuse of Mining Waste as Aggregates in Fly ash-based Geopolymers. J. Clean. Prod. 2019, 220. [Google Scholar] [CrossRef]
  18. Prabakar, J.; Dendorkar, N.; Morchhale, R.K. Influence of Fly Ash on Strength Behavior of Typical Soils. Constr. Build. Mater. 2004, 18, 263–267. [Google Scholar] [CrossRef]
  19. Trzebiatowski, B.B.D.; Edil, T.B.; Benson, C.H. Case Study of Subgrade Stabilization using Fly Ash: State Highway 32, Port Washington, Wisconsin. Recycl. Mater. Geotech. 2004, 123–136. [Google Scholar] [CrossRef]
  20. TRB Lime Stabilization: Reaction, Properties, Design, and Construction. State of the Art Report 5. Available online: http://onlinepubs.trb.org/Onlinepubs/state-of-the-art/5/5.pdf (accessed on 7 September 2019).
  21. Amadi, A.A. Enhancing Durability of Quarry Fines Modified Black Cotton Soil Subgrade with Cement Kiln Dust Stabilization. Transp. Geotech. 2014, 1, 55–61. [Google Scholar] [CrossRef]
  22. Miller, G.A.; Azad, S. Influence of Soil Type on Stabilization with Cement Kiln Dust. Constr. Build. Mater. 2000, 14, 89–97. [Google Scholar] [CrossRef]
  23. Oriola, F.O.P.; Moses, G. Compacted Black Cotton Soil Treated with Cement Kiln Dust as Hydraulic Barrier Material. Am. J. Sci. Ind. Res. 2011, 2, 521–530. [Google Scholar] [CrossRef]
  24. Osinubi, K.J. Stabilisation of Tropical Black Clay with Cement and Pulverised Coal Bottom Ash Admixture. Adv. Unsatur. Geotech. ASCE Geotech. Spec. Publ. 2000, 99, 289–302. [Google Scholar]
  25. Peethamparan, S.; Olek, J. Study of the Effectiveness of Cement Kiln Dusts in Stabilizing Na-Montmorillonite Clay. J. Mater. Civ. Eng. ASCE 2008, 20, 137–146. [Google Scholar] [CrossRef]
  26. Salahudeen, A.B.; Eberemu, A.; Osinubi, K.J. Assessment of Cement Kiln Dust-Treated Expansive Soil for the Construction of Flexible Pavements. Geotech. Geol. Eng. 2014. [Google Scholar] [CrossRef]
  27. Sreekrishnavilasam, A.; Rahardja, S.; Kmetz, R.; Santagata, M. Soil Treatment using Fresh and Landfilled Cement Kiln Dust. Constr. Build. Mater. 2007, 21, 318–327. [Google Scholar] [CrossRef]
  28. Sridharan, A.; Prashanth, J.P.; Sivapullaiah, P.V. Effect of Fly Ash on the Unconfined Compressive Strength of Black Cotton Soil. GR Improv. 1997, 1, 169–175. [Google Scholar] [CrossRef]
  29. Brooks, R.M. Soil Stabilization With Flyash and Rice Husk Ash. Int. J. Res. Rev. Appl. Sci. 2009, 1, 2076–7366. [Google Scholar]
  30. Sezer, A.; Inan, G.; Yılmaz, H.R.; Ramyar, K. Utilization of a Very High Lime Fly Ash for Improvement of Izmir Clay. Build. Environ. 2006, 41, 150–155. [Google Scholar] [CrossRef]
  31. Jha, J.N.; Gill, K.S.; Choudhary, A.K. Effect of High Fraction Class F Flyash on Lime Stabilization of Soil. Int. J. Geotech. Environ. 2009, 1, 105–128. [Google Scholar]
  32. Jalali, S.; Abyaneh, M.Y.; Keedwell, M.J. Differential Scanning Calorimetry Tests Applied to Lime—Fly Ash Soil Stabilization. In Test Soil Mix with Waste or Recycl Mater STP 1275; ASTM: West Conshohocken, PA, USA, 1997; pp. 181–191. [Google Scholar]
  33. Cheng, L.; Cord-Ruwisch, R. In Situ Soil Cementation with Ureolytic Bacteria by Surface Percolation. Ecol. Eng. 2012, 42, 64–72. [Google Scholar] [CrossRef] [Green Version]
  34. Cheng, L.; Cord-Ruwisch, R.; Shahin, M.A. Cementation of Sand Soil by Microbially Induced Calcite Precipitation at Various Degrees of Saturation. Can. Geotech. J. 2013, 50, 81–90. [Google Scholar] [CrossRef]
  35. ASTM Standard Practice for Classification of Soils for Engineering Purposes (Unified Soil Classification System). Available online: https://www.scribd.com/document/339563388/ASTM-D-2487-06-Soil-Clasification-pdf (accessed on 21 October 2019).
  36. ASTM Standard Specification for Coal Fly Ash and Raw or Calcined Natural Pozzolan for Use in Concrete. Available online: https://kupdf.net/download/astm-c6181203394-1_59ce2c1508bbc5a942686f32_pdf (accessed on 21 October 2019).
  37. Ola, S.A. Geotechnical Properties and Behaviour of Some Stabilized Nigerian Lateritic Soils Geotechnical Properties and Behaviour of Some Stabilized Nigerian Lateritic Soils. Q. J. Eng. Geol. Hydrogeol. Geotech. 1978, 11, 145–160. [Google Scholar] [CrossRef]
  38. Bell, F.G. Lime Stabilization of Clay Soils. Bull. Int. Assoc. Eng. Geol. 1989, 39, 67–74. [Google Scholar] [CrossRef]
  39. Harichane, K.; Ghrici, M.; Kenai, S. Effect of Curing Time on Shear Strength of Cohesive Soils Stabilized with Combination of Lime and Natural Pozzolana. Int. J. Civ. Eng. 2011, 9, 90–96. [Google Scholar]
  40. Gay, G.; Schad, H. Influence of Cement and Lime Additives on the Compaction Properties and Shear Parameters of Fine Grained Soils. Otto Graf J. 2000, 11, 19–32. [Google Scholar]
  41. Simatupang, M.; Sukri, A.S.; Nasrul, S.; Putri, T.S. Effect of Confining Pressures on the Shear Modulus of Sand Treated with Enzymatically Induced Calcite Precipitation. IOP Conf. Ser. Mater. Sci. Eng. 2019, 615. [Google Scholar] [CrossRef]
  42. Mulilis, J.R.; Seed, H.B.; Chan, C.K.; Michell, J.K.; Arulanandan, K. Effect of Sample Preparation on Sand Liquefaction. J. Geotech. Geoenviron. Eng. ASCE 1977, 103, 91–108. [Google Scholar]
  43. Lin, H.; Suleiman, M.T.; Brown, D.G.; Kavazanjian, E. Mechanical Behavior of Sands Treated by Microbially Induced Carbonate Precipitation. J. Geotech. Geoenviron. Eng. 2016, 142, 04015066. [Google Scholar] [CrossRef]
  44. Chu, J.; Stabnikov, V.; Ivanov, V. Microbially Induced Calcium Carbonate Precipitation on Surface or in the Bulk of Soil. Geomicrobiol. J. 2012, 29, 544–549. [Google Scholar] [CrossRef]
  45. van Paassen, L.A.; Ghose, R.; van der Linden, T.J.M.; van der Star, W.R.L.; van Loosdrecht, M.C.M. Quantifying Biomediated Ground Improvement by Ureolysis: Large-Scale Biogrout Experiment. J. Geotech. Geoenviron. Eng. ASCE 2010, 136, 1721–1728. [Google Scholar] [CrossRef]
  46. Canakci, H.; Sidik, W.; Halil, I.H. Effect of Bacterial Calcium Carbonate Precipitation on Compressibility and Shear Strength of Organic Soil. Soils Found. 2015, 55, 1211–1221. [Google Scholar] [CrossRef] [Green Version]
  47. Amadi, A.A.; Osu, A.S. Effect of Curing Time on Strength Development in Black Cotton Soil—Quarry Fines Composite Stabilized with Cement Kiln Dust ( CKD ). J. King Saud. Univ.–Eng. Sci. 2018, 30, 305–312. [Google Scholar] [CrossRef] [Green Version]
  48. Consoli, B.N.C.; Prietto, P.M.D.; Carraro, J.A.H.; Heineck, K.S. Behaviour of Compacted Soil-Fly Ash-Carbide Lime Mixtures. J. Geotech. Geoenviron. Eng. ASCE 2001, 127, 774–782. [Google Scholar] [CrossRef]
  49. Al Qabany, A.; Soga, K.; Santamarina, C. Factors Affecting Efficiency of Microbially Induced Calcite Precipitation. J. Geotech. Geoenviron. Eng. ASCE 2012, 138, 992–1001. [Google Scholar] [CrossRef]
  50. DeJong, J.T.; Fritzges, M.B.; Nüsslein, K. Microbially Induced Cementation to Control Sand Response to Undrained Shear. J. Geotech. Geoenviron. Eng. ASCE 2006, 132, 1381–1392. [Google Scholar] [CrossRef]
  51. Feng, K.; Montoya, B.M. Influence of Confinement and Cementation Level on the Behaviour of Microbially-Induced Calcite Precipitated Sands under Monotonic Drained Loading. J. Geotech. Geoenviron. Eng. ASCE 2015, 142, 04015057. [Google Scholar] [CrossRef]
  52. Axelsson, K.; Johansson, S.-E.; Andersson, R. Stabilization of Organic Soils by Cement and Puzzolanic Reactions—Feasibility Study; Swedish Geotechnical Institute: Linkoping, Sweden, 2002. [Google Scholar]
  53. Janz, M.; Johansson, S.-E. The Function of Different Binding Agents in Deep Stabilization; Swedish Geotechnical Institute: Linkoping, Sweden, 2002. [Google Scholar]
  54. Tremblay, H.; Duchesne, J.; Locat, J.; Leroueil, S. Influence of the Nature of Organic Compounds on Fine Soil Stabilization with Cement. Can. Geotech. J. 2002, 39, 535–546. [Google Scholar] [CrossRef]
  55. Hampton, M.B.; Edil, T.B. Strength Gain of Organic Ground with Cement-Type Binders. In Soil Improvement for Big Digs; ASCE: Reston, WV, USA, 1998; pp. 135–148. [Google Scholar]
  56. Seed, H.B.; Tokimatsu, K.; Harder, L.F.; Chung, R.M. Influence of SPT Procedures in Soil Liquefaction Resistance Evaluations. J. Geotech. Eng. ASCE 1985, 111, 1425–1445. [Google Scholar] [CrossRef]
  57. Huang, Y.; Zhao, L. The Effects of Small Particles on Soil Seismic Liquefaction Resistance: Current Findings and Future Challenges. Nat. Hazards 2018. [Google Scholar] [CrossRef]
  58. Tokimatsu, K.; Yoshimi, Y. Empirical Correlation of Soil Liquefaction based on SPT N-Value and Fines Content. Soils Found. Jpn. Soc. Soil Mech. Found. Eng. 1983, 23, 56–74. [Google Scholar] [CrossRef] [Green Version]
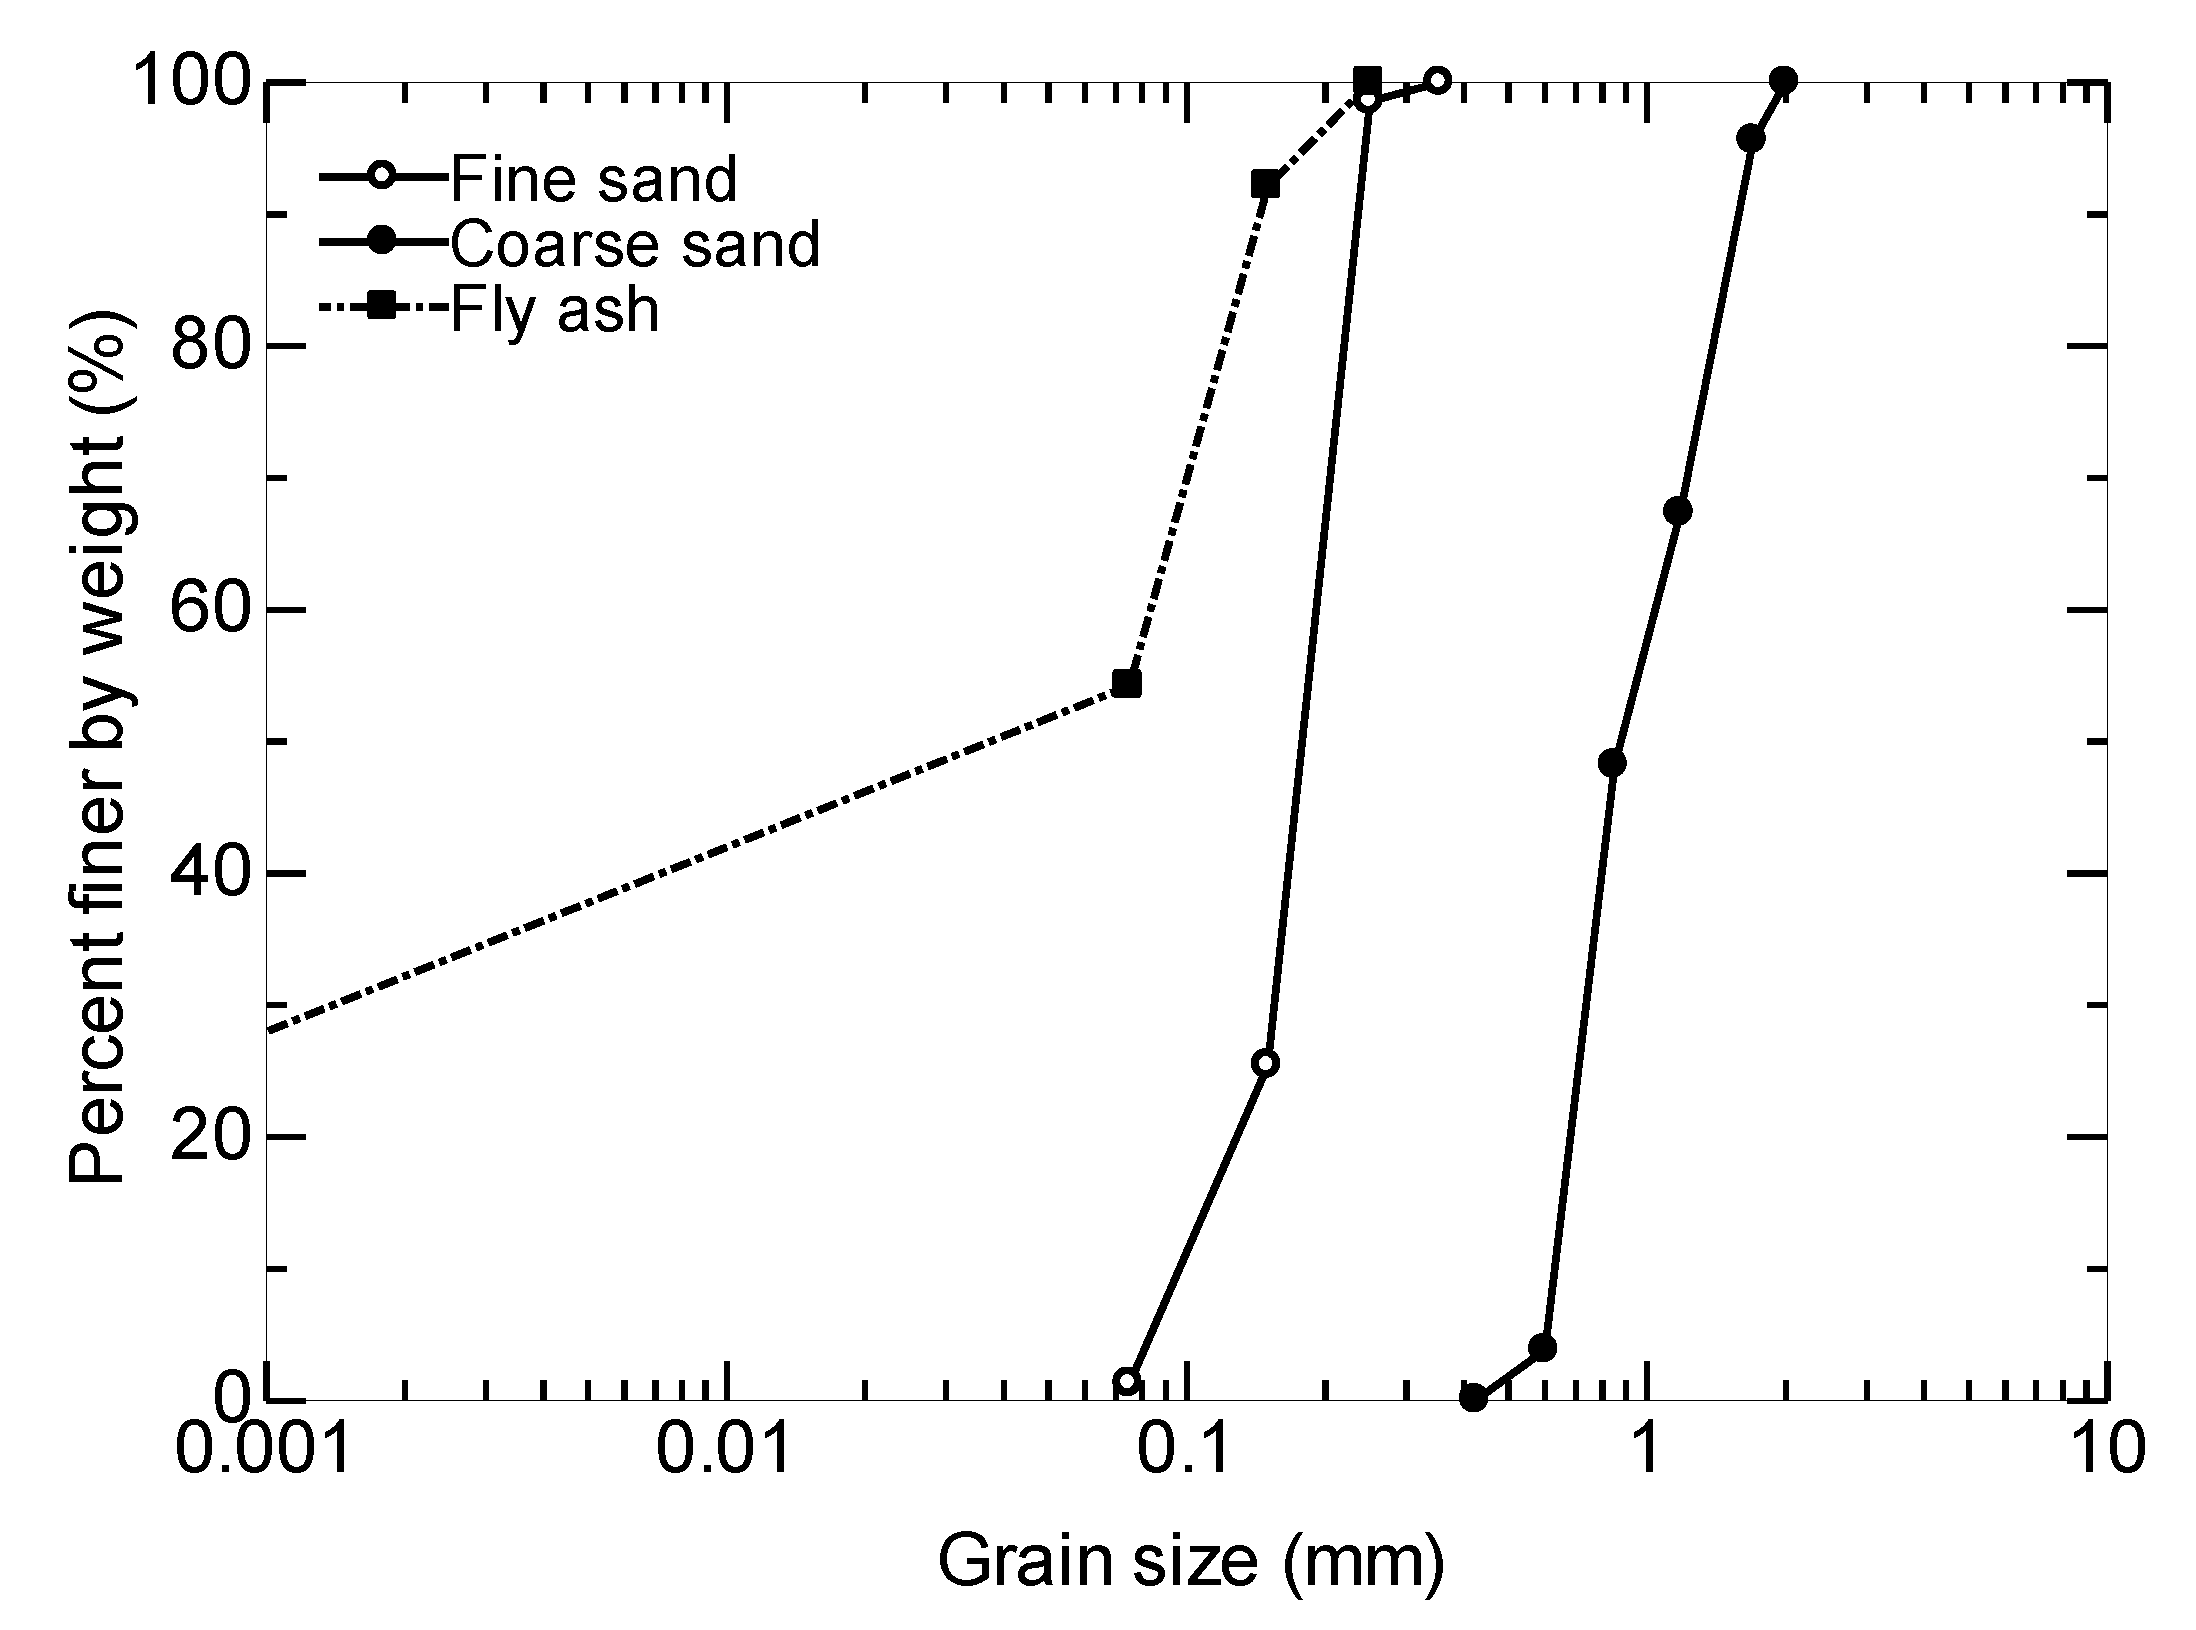
Figure 1. The grain size distribution of the studied sand.
Geosciences 10 00132 g001
Figure 2. Stress–strain relationships on natural fine sand at Sr-100%. (a) stress–strain curve of UCS at various CT with 20% FA, (b) stress–strain curve of UCS at different FA with CT-56 days, (c) stress–strain curve of DSS at various CT with 20% FA, and (d) stress–strain curve of DSS at different FA with CT-56 days.
Geosciences 10 00132 g002
Figure 3. Shear strength parameters.
Geosciences 10 00132 g003
Figure 4. The effect of fly ash percentages on the mechanical properties of fly-ash-stabilized sand. (a) UCSmax-FA relationship of CFS at various Sr with CT-56 days, (b) shear strength parameters-FA relationship of NFS at different Sr with CT-56 days, (c) UCSmax-FA relationship of dissimilar sands with Sr-100% and CT-56 days, (d) shear strength parameters-FA relationship of diverse sands with Sr-100% and CT-56 days, (e) UCSmax-FA relationship of NFS at various CT with Sr-100%, (f) shear strength parameters-FA relationship of NFS at any kinds of CT with Sr-100%.
Geosciences 10 00132 g004
Figure 5. The effect of curing time on the mechanical properties of fly-ash-stabilized sands. (a) UCSmax-CT relationship of NFS at various Sr with 20% FA, (b) shear strength parameters-CT relationship of NFS at different Sr with FA 20%, (c) UCSmax-CT relationship of dissimilar sands with Sr-100% and 20% FA, (d) shear strength parameters-CT relationship of diverse sands with Sr-100% and 20% FA, (e) UCSmax-FA relationship of NFS at various FA with Sr-100%, (f) shear strength parameters-FA relationship of NFS at any kinds of FA with Sr-100%.
Geosciences 10 00132 g005
Figure 6. The effect of the degree of saturation on the mechanical properties of fly-ash-stabilized sand. (a) UCSmax-Sr relationship of NFS at various FA with CT-56 days, (b) shear strength parameters-Sr relationship of NFS at different FA with CT-56 days, (c) UCSmax-Sr relationship of dissimilar sands with CT-56 days and 20% FA, (d) shear strength parameters-Sr relationship of diverse sands with CT-56 days and 20% FA, (e) UCSmax-Sr relationship of NFS at various CT with 20% FA, (f) shear strength parameters- Sr relationship of NFS at any kinds of CT with 20% FA.
Geosciences 10 00132 g006
Table 1. The physical properties of the local sands used.
Fine SandCoarse Sand
Specific gravityGs2.672.72
Maximum void ratioemax1.230.98
Minimum void ratioemin0.880.76
Mean grain sizeD500.180.88
Table 2. The chemical composition of Nii Tanasa fly ash (in wt %).
SiO2CaOAl2O3Fe2O3MgOTiO2MnO2Na2OK2OP2O5SO3LOI
19.8824.0412.0012.638.720.580.227.472.230.1810.261.134
Note: LOI = loss on ignition.
Table 3. The reviewed parameters.
Parameter
Fly ash percentages (%)5, 10, 15, 20, 25, 30
Curing time (days)7, 14, 28, 56
Degrees of saturation during sample preparation—Sr (%)30, 50, 100
Grain sizesFine and coarse
Type of sandNatural and clean
Table 4. The amount of material used, unconfined compressive strength (UCS), and direct shear strength (DSS).
SrDry Sand + Fly Ash (gr)Water Volume (mL)
(%)Fine sandCoarse sandFine sandCoarse sand
UCSDSSUCSDSSUCSDSSUCSDSS
30 40.4111.2936.4910.19
50339.694.9380.1106.267.2318.7860.8216.99
100 134.1237.47121.6433.98
Table 5. Unconfined compressive strength (UCS) of sand stabilized with fly ash.
SrFAUCS (kg/cm2)
(%)(%)Fine Sand (0.075−0.25 mm)
NaturalClean
CT = 7 days1428567142856
3050.00610.00760.00860.00940.00640.01180.04750.0540
100.00730.00810.00940.01420.00750.01200.05700.0830
150.00810.01070.01090.02520.02070.02740.08320.1390
200.01650.02080.02500.06310.02720.03300.10690.1650
250.02060.02570.05050.10260.05260.05900.11880.1777
300.02110.04010.10530.13380.13770.15250.18910.2426
5050.00600.00680.00710.00870.00650.00800.03970.0509
100.00670.00720.00920.00980.00700.00910.05090.0725
150.00720.00830.00970.02140.01760.02200.07360.1163
200.01640.01980.02360.05270.02050.02910.09940.1273
250.01890.02500.04260.08780.05180.05340.11270.1781
300.01980.03600.09300.12810.08180.13360.17090.2145
10050.00320.00520.00590.00750.00330.00530.02070.0409
100.00540.00600.00750.00870.00580.00650.04360.0636
150.00650.00760.00920.01470.01070.01430.06000.1076
200.01350.01580.01890.04900.01960.02170.09310.1253
250.01510.01720.04210.06050.04580.05100.10330.1647
300.01670.01910.06500.07150.05500.12200.15830.1830
(%)(%)Coarse Sand (0.6−2 mm)
NaturalClean
CT = 7 days1428567142856
305--0.00720.0086---0.0450
10--0.00910.0130--0.04770.0505
150.00750.00970.01070.0209-0.02100.08070.1308
200.01500.01880.02200.02920.02700.02950.09500.1590
250.01950.02510.04600.09620.04770.05080.10620.1710
300.02020.03880.09150.13060.09760.10920.18050.2171
1005--0.00540.0065--0.01750.0273
10--0.00620.0082--0.02700.0492
150.00600.00690.00840.01360.00830.01090.05050.0893
200.00750.00930.01140.01900.01700.02050.06170.1071
250.00960.01210.01440.03050.02980.03900.07690.1390
300.01320.01650.06030.06150.04390.09160.13650.1747
Table 6. Shear strength parameters of sand stabilized with fly ash
SrFAShear Strength Parameters
(%)(%)Fine Sand (0.075−0.25 mm)
NaturalClean
CT = 7 days1428567142856
cθcθcθcθcθcθcθcθ
3050.2328.330.4029.430.5730.320.6730.500.4029.070.7330.320.9831.891.6032.57
100.3228.880.4330.500.7331.200.9031.890.5330.140.9230.851.5232.231.9733.57
150.4530.140.5131.020.9731.891.1732.400.9531.021.0031.891.9733.572.1334.06
200.5831.890.6131.371.1332.231.5033.901.1031.891.3331.722.1834.062.5034.55
250.6731.370.7831.891.2733.571.8733.741.3733.071.5033.572.3034.233.0035.03
300.8033.571.0032.401.3734.232.1035.031.5334.392.0035.192.6035.193.2335.51
10050.1527.780.3627.970.5228.020.5628.150.2727.870.6328.331.0028.701.0328.52
100.2827.970.3928.060.5528.330.5928.520.4728.060.7329.251.1029.431.4030.14
150.4328.150.4628.150.9428.150.9829.070.8028.330.8329.611.3029.791.9330.32
200.5728.330.5928.521.1228.881.4029.121.0030.141.0031.891.5732.402.8333.57
250.6028.880.6329.011.1828.991.7229.251.1030.141.0332.231.9832.063.1733.74
300.6429.070.9629.251.3129.432.0530.141.1331.891.1733.572.1333.573.3335.19
Coarse Sand (0.6−2 mm)
NaturalClean
CT = 7 days1428567142856
cθcθcθcθcθcθcθcθ
3050.1930.670.3331.020.4732.740.6032.570.2131.200.3331.890.4732.230.6033.07
100.2831.020.3632.060.6733.900.8634.550.3031.890.4332.570.6733.900.8633.90
150.4131.890.4233.570.8734.551.1034.870.4333.070.5534.060.8735.191.1035.98
200.5433.570.5334.391.0035.351.3737.050.5433.570.6534.551.0337.051.3737.95
250.6033.900.6835.191.2035.661.6037.650.6334.060.7835.031.2038.971.8039.40
300.7334.710.9335.821.2735.981.8038.090.7335.030.9436.901.3739.962.1742.12
10050.1130.140.3230.320.4831.890.5432.060.1330.850.3331.200.4831.890.5732.40
100.2530.500.3431.720.4933.570.5734.060.2831.020.4231.890.6033.240.8433.57
150.3931.890.4032.400.9233.570.9034.390.3932.570.4733.570.9235.351.0036.90
200.5232.060.5133.071.0635.031.3536.750.5232.910.5831.891.0636.751.3537.20
250.5632.740.6133.571.0835.191.7037.050.6133.570.7334.391.1038.241.7338.97
300.6033.570.9235.191.2335.511.9937.200.6934.550.9336.751.3539.682.0041.06
Relative density, Dr = 50%; Sr = degree of saturation (%); FA = fly ash (%); CT = curing time (days); c = cohesion (kg/cm2); θ = friction angle (°); unconfined compressive strength (UCS); direct shear strength (DSS).