Abstract
Uraniferous sandstone deposits commonly resulted when uranium in groundwater precipitated in reducing environments caused by degradation of ancient wood and organic debris. However, the mineralogy of uranium in fossil wood has received relatively little study. Previous microscopic observations of petrified wood from a few uranium mines have demonstrated that uranium in fossil wood primarily involves the oxide mineral uraninite or the silicate mineral coffinite, often in association with metal sulfides such as chalcopyrite. These observations are applicable to primary ore zones that are located below the water table, where oxidation is inhibited. New analyses utilizing scanning electron microscopy and X-ray fluorescence (SEM/EDS) reveal that fossil wood from oxidized ore zones may contain a diverse variety of uranium minerals, including carnotite, tyuyamunite, and zippeite, as well as various vanadate and sulfate minerals. Uranium-bearing common opalized wood and stratiform common opal from two prospects in Nevada, USA, contain no identifiable uranium minerals. Instead, the element is dispersed in trace amounts within the opal.
1. Introduction
For most of human history, uranium has been an element that had very little usefulness. Uranium-tinted glass is known from 79AD [1]. Pure uranium was first isolated in 1841, and Henri Becquerel discovered radioactivity in 1896. However, until the late 1930s commercial use of uranium was largely limited to uranium oxides that were employed for ceramic glaze and glass tinting. Scientific interest increased after Enrico Fermi’s team observed fission of uranium in 1939. In 1940, the transmutation of uranium to plutonium was discovered. These events marked the beginning of the Atomic Era, when the power of fission was understood to release enormous energy that could be used for nuclear weapons and generation of nuclear power.
The uranium prospecting boom that developed in the late 1940s and peaked in the 1950s was accompanied by an abundance of investigations of geologic conditions that produced uranium ore. By the 1960s, the International Atomic Energy Agency recognized 15 deposit types, including those found in igneous, metamorphic, and sedimentary environments [2]. The latter include sandstone deposits where uranium deposition is commonly associated with the presence of fossil wood and other plant debris. The purpose of this study is to provide an overview of uranium mineralization in fossil wood from localities in western USA, using optical microscopy, scanning electron microscopy, and energy dispersive X-ray fluorescence spectrometry.
Uranium is present in small amounts in many geologic materials. The element is slightly more common than tin, 40 times more abundant than silver, and 500 times more abundant than gold. Under oxidizing conditions, uranium has relatively high solubility, and sedimentary ore deposits typically occur where uranium dissolved in groundwater encounters reducing conditions, causing the element to precipitate as “pitchblende” (uraninite, UO2). Very commonly, the cause of precipitation is the halo of reducing compounds that surround decomposing organic matter. Uranium may also be present as organic complexes as well as inorganic minerals. The source of the dissolved uranium varies, but in the element has commonly been leached from trace amounts present in thick beds of volcanic ash. Relict organic matter may include intact logs (Figure 1), or layers of “trash” (Figure 2). Uranium mineralization may reach high levels in wood and organic debris. During the 1950s uranium boon, in the American Southwest the ore in some small mines consisted of a single fossil log [3,4]. The uranium contents of fossil logs are as high as 35 wt.% [5].
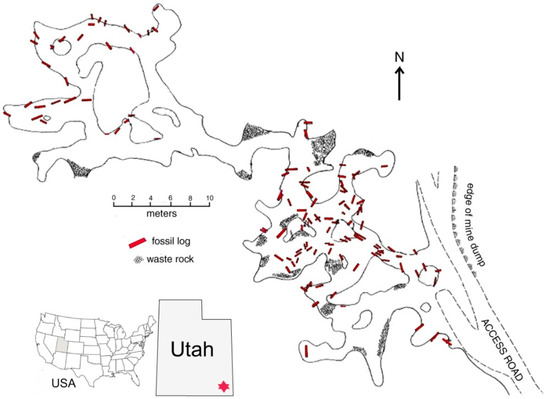
Figure 1.
Fossil logs in Verdure Mine, Montezuma Canyon, San Juan County (UT, USA). Adapted from [6].
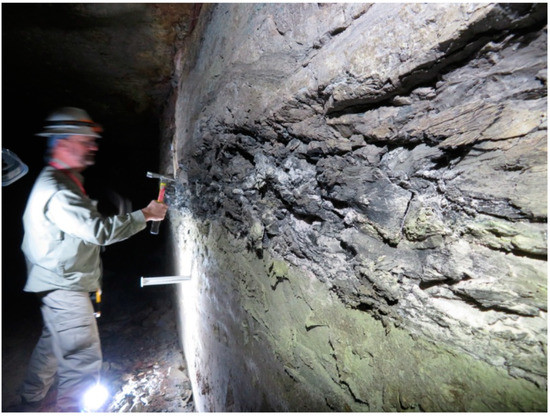
Figure 2.
Woody debris layer exposed in the wall of an inactive uranium mine in the White Valley District, San Juan County (UT, USA). 2019 photo, courtesy of Mark Hart.
The abundance of wood and organic debris in Mesozoic uranium deposits in the Colorado Plateau can be explained by the nature of the mineralization process, which was initiated when uranium-bearing groundwater permeated the porous sediments of ancient river channels, a paleoenvironment that was likely to contain driftwood logs and woody debris. Uranium precipitation occurred in direct response to reducing agents produced by decomposition of the plant tissue, and compounds released by anaerobic microbes that benefited from nutrients released from the decaying wood. Because hexavalent uranium complexes heavily with organic matter, this process could produce an initial accumulation of uranium, subsequent microbial activity may result in the formation of reduced uranium precipitates [7,8].
Despite the importance of fossil wood for uranium precipitation in sandstone deposits, very little attention has been paid to the uranium mineralogy within the wood. In studies in the 1950s [9,10,11], the microscopic examination of specimens from uranium ores zones in the American Southwest caused investigators to conclude that the primary form of wood mineralization is replacement of the cell walls by uraninite, U2O3, with cell internal spaces (lumina) observed to contain copper sulfides, coffinite, U(SiO4)1−x(OH)4x, or calcite (Figure 3).
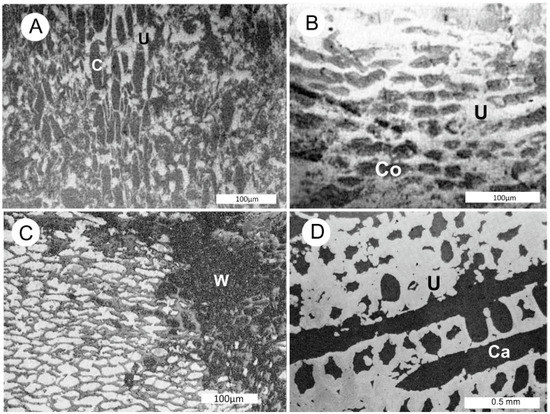
Figure 3.
Reflected light optical photomicrographs of polished specimens of uraninite-mineralized fossil wood from San Juan County (UT, USA). (A) Wood with calcite (C) filling cell lumina and uraninite replacing cell walls. (B) Coffinite (Co) filling lumina, uraninite (U) replacing cell walls. A,B from Mi Vida Mine, Lisbon-Big Indian Wash District [9]. (C) Carbonized wood fragment partially mineralized with chalcopyrite and uraninite. Chalcopyrite (white) has filled lumina, uraninite (gray) has replaced cell walls. W = unmineralized carbonized wood. Happy Jack Mine, White Canyon District [10]. (D) Coalified wood from Mi Vida Mine, with cell walls replaced by uraninite (U), open fractures and lumina interior regions mineralized with calcite (Ca) [11].
More recently, uraninite and coffinite mineralization has been reported from a uranium deposit in NW China [12]. Examination of the samples used for my report reveal that in oxidized ores the uranium mineralization of fossil wood is very different from fossil wood in the primary ore zones. The mineralogic differences are commonly related to the position of ore zones relative to the water table. In anaerobic water-saturated strata, the initial precipitation of uranium from groundwater is typically in the form of black oxides collectively known as “pitchblende”. The primary constituent is uraninite. In ore zones that are above the water table, pitchblende is susceptible to secondary alteration. The extent of possible alteration reflects the fact that Uranium can react with all non-metallic elements except noble gasses; at least 249 uranium minerals have been recognized [13].
Uranium deposits in sandstone commonly contain several ore zones. One example is the Happy Jack Mine in the White Canyon District in southeastern Utah. In this mine, uranium ore occurs in a sulfide-rich zone, an oxidized zone, and a transition area between the two. The mine is not currently accessible; the following description comes from a detailed 1955 study [10]. Fossil wood in the sulfide zone commonly contains uraninite and chalcopyrite, with covellite and sphalerite being present in lesser abundance. In a few specimens, the wood has been replaced by pyrite, chalcopyrite, and sphalerite. Cellular structure is seldom preserved in these specimens.
The transition zone contains abundant goethite and relict concentrations of primary sulfide minerals. As in the sulfide zone, uranium is concentrated in fossil wood, organic “trash”, and adjacent porous sediments. The persistence of uraninite and primary sulfide minerals may have been due to the reducing environments of the organic material, which inhibited the reactive capabilities of oxidizing solutions that affected the surrounding strata. Some wood in this zone has been replaced by goethite. Uranium minerals in the oxidized zone include carnotite, zippeite, uranopilite ((UO2)6(SO4)O2(OH)6·14H2O), and other secondary alteration products. Sulfide minerals are largely absent. Fossil wood in the oxidized zone predominately contains these secondary uranium minerals, formed as alteration products of uraninite.
The mineralogy trends observed in the Happy Jack mine are typical of many uranium-bearing sandstone deposits in the American Southwest, but conditions may vary among the various mining districts, and even in individual mines within a district (Figure 4).
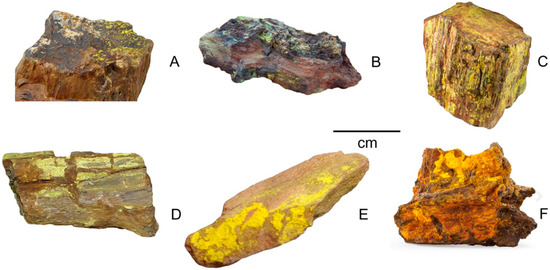
Figure 4.
Uranium minerals in fossil wood from mines in the American Southwest. (A) Uraninite, Henry Mountains (UT). (B) Uraninite with secondary alteration, Reuben Weeks Mine, Cainville Wash (UT). (C) Uranophane, Happy Jack Mine, San Juan County (UT). (D), Carnotite, La Sal Valley, (CO). (E) Carnotite, Grand County (UT). (F) Zippeite, Happy Jack Mine, San Juan County (UT).
2. Materials and Methods
The study of uranium mineralogy in fossil wood is hindered by the scarcity of specimens. Beginning in the late 1960s, most uranium used in the U.S. is imported from foreign countries, principally Canada, Kazakhstan, Australia, and Russia. By 2011, only three US mines were producing uranium, all from in situ leaching operations that expose no bedrock. With one exception, an inactive mine in the White Canyon District of southeast Utah, the mine specimens used in this study were collected many years ago from tunnels that are no longer accessible. Uraniferous opal and opalized wood came from prospects in Nevada that are still available for visitation. General collecting locations are shown in Figure 5. The formulas of uranium minerals mentioned in this report are shown in Table 1.
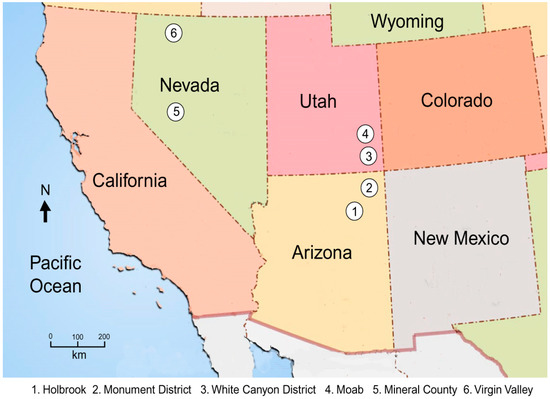
Figure 5.
Location map for the samples used in this study.

Table 1.
Common Uranium Minerals.
Radioactivity measurements were made at a distance of 1 cm, using a Ludlow Model 3 survey meter (Ludlum Measurements, Inc., Sweetwater, TX 79556, USA) at the Environmental Health and Safety Office at Western Washington University. The metal-window detector primarily detects β radiation. Gamma radiation levels were low in all specimens, based on count rates measured with a steel-shielded detector.
SEM/EDS analyses were made using a Vega III scanning electron microscope (Tescan, Brno, Czech Republic) equipped with an Oxford X-ray detector (Oxford Instruments, Abington, UK) Scanning electron microscopy is a powerful method for studying uranium minerals for two reasons: because backscattered electron (BSE) images produce grayscale images where brightness is proportional to the atomic number of elements, uranium shows up very brightly compared to most other substances. Second, XRF spectra can be obtained from very small areas on the specimen surface, allowing quantitative analyses of all major elements. These data can be used to identify uranium minerals without requiring the larger amounts that would be required for X-ray diffraction analysis, optical mineralogy, or wet chemistry, the only tools that were available in the 1950’s and 1960’s.
Mineral identifications are based on the classic works [14,15] and more recent publications [1,16]. Indescriptions of UV fluorescence, “short wave” is 254 nm, “long wave” is 360 nm.
3. Results
Research is based on the following specimens, from the localities shown in Figure 5.
3.1. Silicified Wood from Late Triassic Chinle Group, Petrified Forest Member, Holbrook, Arizona
Of the specimens studied for this report, this one (Figure 6) comes closest to being a primary uranium ore, with only slight secondary alteration. This Triassic silicified wood has two distinct zones: a light brown zone that contains only small amounts of uranium (β = ~100 CPM), and a dark gray uranium-enriched zone (β = ~400 CPM). For both zones, measured α radiation values are approximately 10 times higher than for β radiation. Fracture planes within the dark gray zone contain thin residues of a non-fluorescent yellow mineral. The weathered outer surface of the fossil wood has reddish brown color.
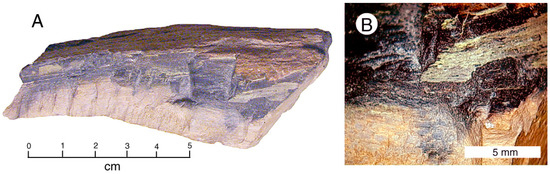
Figure 6.
Uraniferous silicified wood, Holbrook (AZ, USA). (A) Light brown wood and dark gray uranium rich zone. (B) Fracture planes in dark gray zone contain thin coatings of a secondary uranium mineral, possibly tyuyamunite.
SEM images (Figure 7) show that wood cells have largely been replaced by silica, but cell walls contain areas of relict carbon. BSE images (Figure 7B) thin zones of uranium mineralization. The light brown color is probably caused by the relict carbon; the dark gray zone owes its color to the abundant presence of coffinite, as evidenced by the SEM/EDS spectrum (Figure 8).
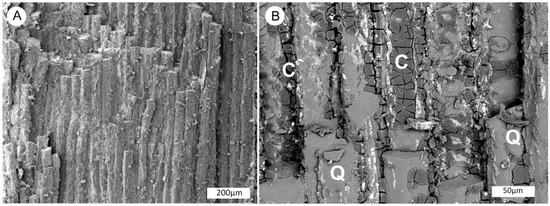
Figure 7.
SEM views of silicified wood in light brown zone. (A) Longitudinal view shows tracheid cells that have been replaced by silica, secondary electron image. (B) Carbonaceous material (labeled C) is preserved as brittle material in areas of cell walls, quartz-mineralized wood is marked with Q. Thin stringers of coffinite (unlabelled) appear as white zones in this backscatter electron image.
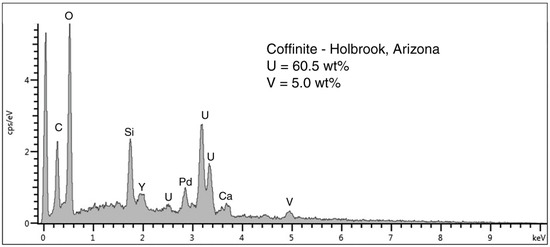
Figure 8.
SEM/EDS spectrum of coffinite in the dark gray zone shown in Figure 6. Peak at 0 KeV is detector noise, Pd is coating applied to provide electrical conductivity. The large Si peak probably comes partly from from silicified wood cells, in addition to Si in coffinite, a uranium silicate. Y is a common minor element in uranium ores.
Scanning electron photomicrographs made with a BSE detector show areas of coffinite mineralization (Figure 9). In these zones, coffinite occurs as a myriad of microcrystals in close association with the quartz microcrystals that replace original wood. Coffinite is abundant as a filling material in cell lumina, but small amounts are present in silicified cell walls.
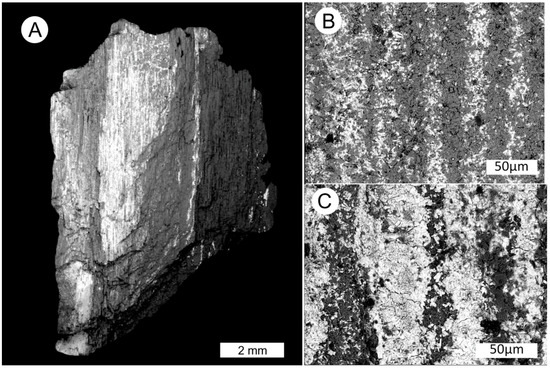
Figure 9.
SEM BSE images. (A) Coffinite is revealed as bright white zones in the silicified wood. (B) Coffinite in a region of relatively low uranium mineralization, longitudinal view of silicified wood. (C) Coffinite occupying cell lumina, and as fine disseminations in silicified cell walls in a zone of relatively high uranium abundance.
The composition of yellow zones cannot be ascertained by SEM/EDS analysis; XRF spectra show C, Si, and O from the silicified wood, as well as peaks for elements in the yellow mineral. This zone contains U, V, and Ca as important components, suggesting tyuyaminite as a possible alteration product. This tentative identification is consistent with the absence of UV fluorescence.
3.2. White Canyon District, San Juan County, Utah
This specimen (Figure 10) was collected in 2019 from a carbonaceous layer exposed in the wall of an inactive mine (Figure 2). The owner asked that the name and exact location of the mine be kept confidential. The mineralization appears to represent secondary alteration in an oxidized ore zone, from a mining district where the primary mineralization is uraninite [10]. Like other mines in this district, uranium occurs in sandstone and conglomerate that was deposited as channel fill during the Late Triassic. These fluvial facies are situated at the contact between the basal bed of the Chinle Group and the underlying Moenkopi Formation.
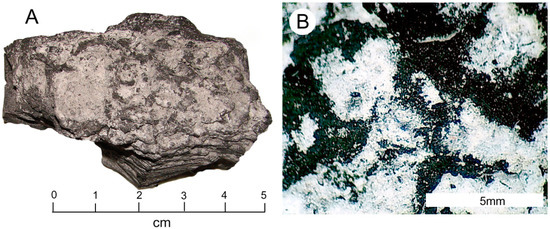
Figure 10.
Carbonaceous sample containing light-colored ncrustrations. (A) β-Radiation intensity of the upper surface is low, β=~100 CPM (B) Reflected light photomicrograph showing white patches of aluminum sulfate.
The carbonaceous layer contains intact wood fragments that have been silicified (Figure 11A), as well as thin lamellae of bituminous coal. SEM BSE images reveal the presence of prismatic crystals of a uranium mineral on the surface and within the carbonaceous layers (Figure 11B).
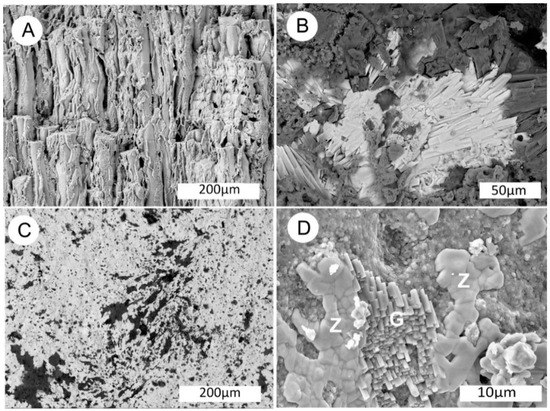
Figure 11.
SEM images of uraniferous wood from White Canyon District (UT). (A) Silicified wood, oblique longitudinal view showing unmineralized spaces between some adjacent cells. (B) BSE image showing prismatic crystals of zippeite on wood surface. (C) Layer of zippeite encrusting specimen surface, BSE image. (D) High magnification SE image showing semi-botryoidal zippeite (Z) adjacent to gypsum crystal cluster (G).
SEM/EDS (Figure 12) spectra show this mineral to contain uranium, potassium, and sulfur as the major constituents, suggesting zippeiteas the most likely identification. The paucity of vanadium is interesting, because most uranium ores in the White Canyon District contain abundant vanadium.
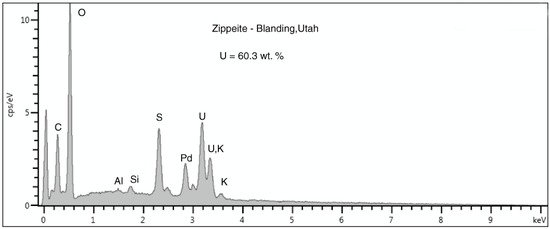
Figure 12.
SEM/EDS spectrum of microcrystals shown in Figure 11B. The Pd peak is caused by the metal layer applied to the specimen surface to provide electrical conductivity. The peak at 0KeV is detector noise related to the low count rate. The peak at 3.3KeV is a combination of the M orbital peak for uranium and the Kα peak for potassium. The presence of the latter element can be confirmed by the smaller Kβ peak at 3.59 KeV.
The flat siltstone surface of the specimen lack white encrustations. Uranium minerals are not visible to the naked eye, but the ß-radioactivity of this surface is 1,500 CPM. Areas of the surface show bright green fluorescence under short-wave UV (Figure 13), and weak fluorescence under long-wave UV. SEM images show this surface to be encrusted with a thin layer of zippeite. In contrast to the euhedral prismatic crystals observed in other parts of the specimen, zippeite in surface layer has a slightly botryoidal form. Small amounts of crystalline gypsum are present (Figure 11C,D).
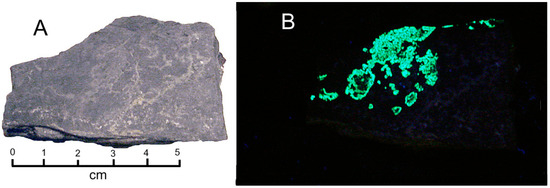
Figure 13.
Flat silty surface of White Canyon sample, containing thin coatings of zippeite. (A) Ordinary light. (B) Fluorescence under short-wave UV light.
The sample contains abundant thin layers of light-colored mineral. SEM images show that two forms are present: radiating clusters of prismatic crystals, and porous crusts composed of a multitude of aggregated microcrystals (Figure 14). SEM/EDS spectra show that the composition of the prismatic crystals is aluminum sulfate. Aluminum sulfate minerals are characterized by differing degrees of hydration, and iron commonly substitutes for aluminum in the crystal lattice. Known forms include Alunogen (Al2(SO4)3·17H2O), Meta-alunogen (Al2(SO4)3·12H2O), Mangazeite (Al2(SO4)3(OH)4·3H2O), Millosevichite–(Al,Fe)2(SO4)3 and Fibroferrite (Fe3+(SO4)(OH)·5H2O).
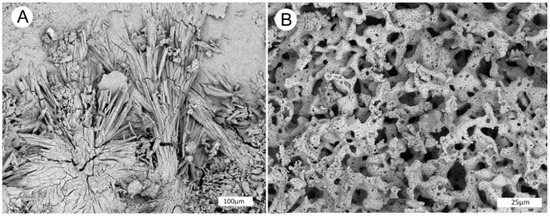
Figure 14.
SEM BSE images of light-colored encrustations reveal two forms. (A) Prismatic crystals of aluminum sulfate. (B) porous coral-like ferruginous aluminum sulfate.
Millosevichite has been reported from coalmine dumps that have caught fire, when gases released from sulfur-containing coal reacted with adjacent aluminous rocks (shale, etc) to produce aluminum sulfate. Millosevichite has also been reported from volcanic rocks where sulfuric vapors reacted with aluminous rocks. The reaction temperature for both environments has been estimated to be 600 °C. Alunogen can form from hydration of millosevichite, but this mineral can also form by low temperaturereactions, explaining its common occurrence on walls of mines and quarries. Because XRF spectra do not reveal hydration state, the light-colored materials described in this report as aluminum sulfate and ferruginous aluminum sulfate.
Members of the zippeite group are secondary minerals that form in the oxidized zone of uranite deposits; the sulfate composition is consistent with their occurrence in zones that contain sulfide minerals. Zippeite often forms as efflorescences on mine walls as a product of evaporation [1]. The aluminum sulfate minerals probably also the result of precipitation from elements that were released from contact of the ore zone with atmospheric exposure from underground mining.
3.3. Blanding Utah, Judd Claim, White Canyon
This sample (Figure 15) was collected many years ago at the Judd Claim, White Canyon District, San Juan County (UT). Like the previous sample, the Triassic wood is from the Shinarump Formation, the lowest member of the Chinle Group. The only detectable uranium mineral is carnotite, as evidenced by the EDS spectrum (Figure 16) and the lack of UV fluorescence. Radioactivity is relatively high for this rich uranium ore, with ß-radiation measured at 3,800 CPM. The carnotite presumably was derived from precipitation of uranium dissolved from uraninite, the primary ore mineral in this mining district [10].
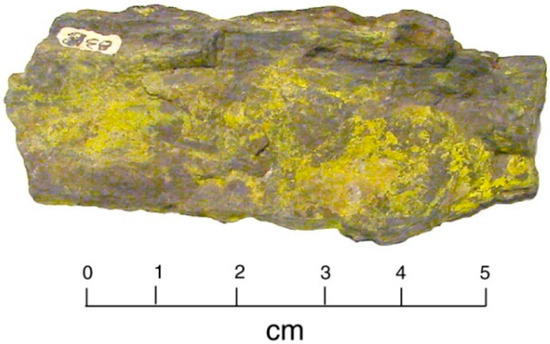
Figure 15.
Carnotite-bearing fossil wood from Judd Claim, White Canyon District (UT).
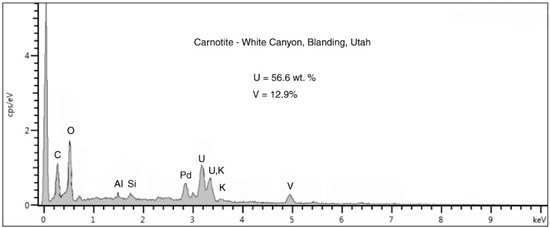
Figure 16.
SEM/EDS spectrum showing carnotite composition. Palladium peak is an artifact from specimen coating. The high peak at the left side of the spectrum is detector noise related to the low count rate.
SEM images show that carnotite occurs as interlayers in the carbonized wood where it occupies fracture planes (Figure 17A) fills larger spaces, and as tiny disseminated specks within the wood itself (Figure 17B). Carnotite also can be seen filling cell lumina, with cell walls being (Figure 17C) composed of carbonized tissue. This mode of mineralization differs from the early descriptions of uraninite-mineralized wood (Figure 3); clearly the carnotite in the lumina did not originate from in situ alteration of uraninite. Carnotite also occurs as encrustations on the outer surfaces of individual cells (Figure 17D).
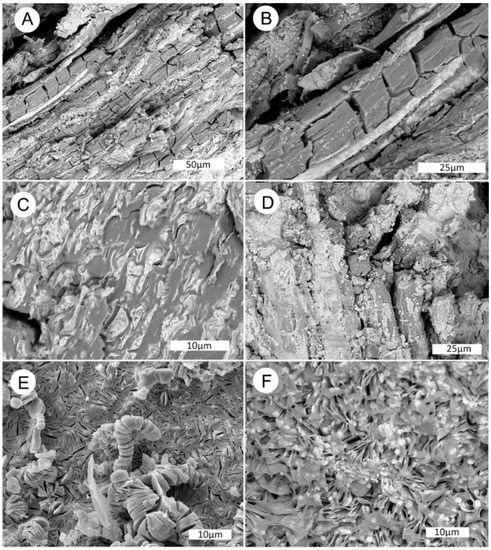
Figure 17.
SEM images from Judd Claim sample. (A,B) carnotite occurs in layers within carbonized wood, visible as bright zones in these BSE images. Note the constellation of tiny bright spots in the fractured carbonized wood in image B. (C) Transverse view, showing carnotite filling lumina. Cell walls are carbonized. (D) Longitudinal view, showing wood cells encrusted with patchy carnotiite. (E) Pure carnotite showing crystal habit. (F) Platy clay minerals sowing disseminated carnotite.
At high magnification, carnotite can be observed as aggregates of flat crystals that occur both as dense aggregates and as vermicular assemblages (Figure 17E), and as very small particles dispersed within clay minerals (Figure 17F). The latter mode of occurrence is perhaps analogous to the “vanadium clays” that have been reported from other mines in the American Southwest These largely consist of chlorite and/or hydromica that contain dispersed particles of various vanadium minerals. The vanadium clays occur in both oxidized an unoxidized ores [3].
3.4. Monument #2 Mine, Monument Valley, Apache County, Arizona
This specimen (Figure 18) was collected in the early 1960s by Dr. Eugene B. Gross, who worked for the Atomic Energy Commission 1952–1958, and later for the California Division of Mines and Geology. The β-radioactivity is 1,250 CPM. Uraninite is the primary uranium ore in this district, but oxidized zones contain a diverse variety of secondary uranium minerals [3]. Ores occur in sandstone within the Shinarump Member of the Late Triassic Chinle Group.
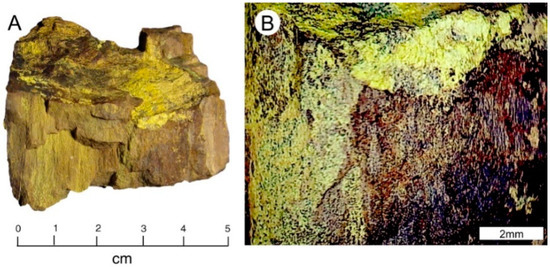
Figure 18.
Silicified wood containing uranium and vanadium, Monument #2 Mine, Monument Valley, AZ. (A) Tyuyamunite coatings occur in fracture plane surfaces, and within silicified wood tissue. (B) Reflected light photomicrograph.
The mineralogy of this sample is complex. The most evident mineralization is in the form of bright yellow powder coatings on fracture surfaces. SEM images show these to consist of lath-like crystals (Figure 19). The underlying fossil wood is silicified, containing only small amounts of relict carbon.
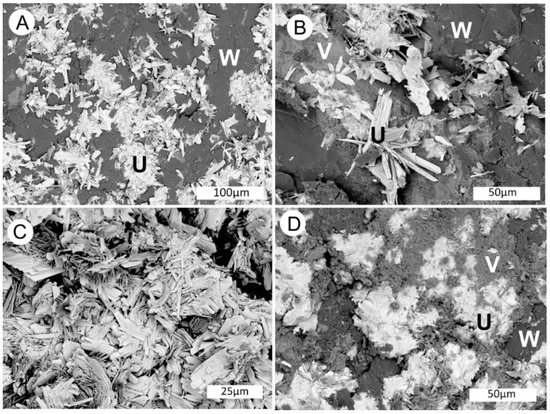
Figure 19.
SEM backscatter electron images show bright crystals of tyuyamanite (labeled U) within dark silicified wood (labeled W). (A,B) Radiating crystals of tyuyamunite on fossil wood. (C) Mass of pure tyuyamunite. (D) Tyuyamunite and a vanadium mineral (V) incorporated within fossil wood.
SEM/EDS spectral data (Figure 20, Table 2) indicate that the yellow uranium mineral is tyuyamunite. The encrustations on fracture surfaces are evidence that the wood had been silicified prior to the deposition of this mineral; the low abundance of relict carbon in the wood is evidence that carbon in the tyuyamunite crust came from some other source. Carbon may represent the presence of calcium carbonate; ores in the oxidized zone of Colorado Plateau deposits have been described as “a confused mixture of minerals” [17], in part because of the contribution of elements from meteoric waters circulating through the porous host rocks. The host rock provides an abundant source of Ca, where calcite cement in the sandstone averages 4.3 wt.% [3].
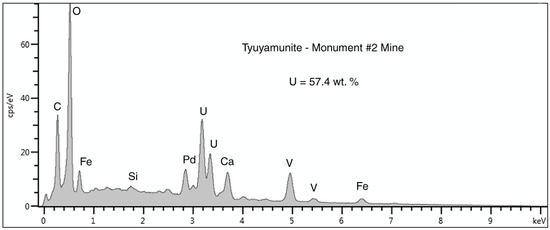
Figure 20.
SEM/EDS spectrum of a surface crust of tyuyamunite on fossil wood from the Monument #2 Mine. The large carbon peak may be caused by small amounts of calcium carbonate. The Pd peak is a artifact from specimen coating to provide electrical conductivity. The small peak at 0 KeV is caused by detector noise.
Table 2.
SEM/EDS results for uranium mineral from Monument Mine #2.
Although tyumanunite surface crusts are the richest source of uranium in the specimen, the fossilized wood contains uranium and vanadium minerals formed during earlier precipitation events. SEM backscattered electron (BSE) images show that individual wood cells contain a mixture of silica and a vanadium oxide mineral. Tyuyamunite is present in lesser abundance (Figure 21).
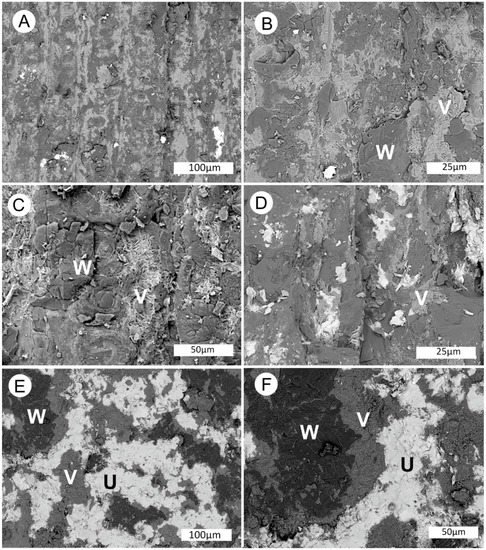
Figure 21.
SEM images of fossil wood from Monment #2 Mine. (A–C) Longitudinal view of tracheid cells containing fossil wood (W) and a vanadium mineral (V). (D–E) Fossil wood containing a vanadium mineral and tyuyamunite (U), a uranium mineral.
The complex interfingering of silicified wood and the vanadium mineral suggest that the two forms of mineralization were syngenetic (Figure 21A–C). Tyuyamunite is also locally present in close association with the vanadium mineral (Figure 21D–F). The two minerals are always sharply defined, evidence that they were formed as discrete phases rather being an intergrade.
SEM/EDS spectral data (Figure 22, Table 3) provide clues for identifying the vanadium mineral. The major constituent elements are Fe, V, Ca, and O. The Fe:V ratio is close to 1:1, suggesting five possibilities (Table 4). Monument #2 Mine is the type locality for navajoite [18]; the mineral is commonly present in sandstone in the uranium ore zone (Figure 23). Montroseite and fervanite are important vanadium ores of the Uravan mining district in Colorado; both minerals have been informally reported from the Monument #2 Mine by mineral collectors, but the justifications for the identifications are not reported. Navajoite seems like the most likely correct identification for this sample. The presence of ~6 atom %Ca can be explained by the affinity of this element for vanadium, as evidenced by the presence of hewettite, CaV6O16·9H2O, at the Monument #2 Mine [14].
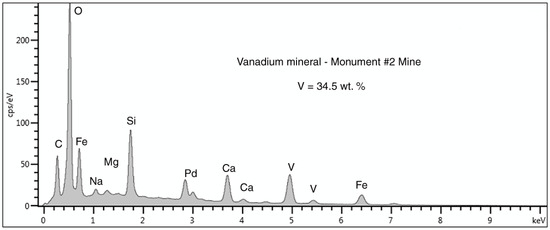
Figure 22.
SEM/EDS spectrum of the vanadium mineral n silicified wood from the Monument #2 Mine. The carbon peak is perhaps indicative of small amounts calcium carbonate. The large Si peak is probably from the silicified wood. The Pd peak is an artifact from specimen coating to provide electrical conductivity.
Table 3.
SEM/EDS results for vanadium mineral from Monument Mine #2.
Table 4.
Feric vanadium minerals with Fe:V = 1.
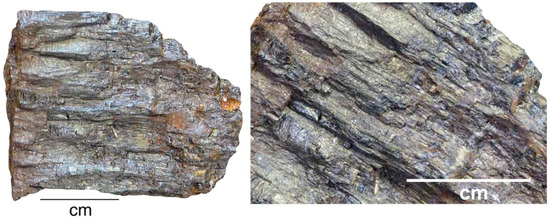
Figure 23.
Navajoite in silty sandstone, Monument # 2 Mine, Apache County, AZ.
The relationships between mineralization and wood cell anatomy are unclear. SEM images appear to show an intimate intermixture of Si, V, and U minerals, but these images primarily show the exterior surface of individual cells. One SEM sample shows a transverse view of fossil wood, and in this specimen cell lumina contain only silica, with U and V mineralization limited to relict cell walls or intercellular spaces (Figure 24). Given the poor degree of anatomical preservation, interpretation of mineralization sequence is difficult. Certainly the abundant tyuyamunite crystalline crusts post- date wood petrifaction.
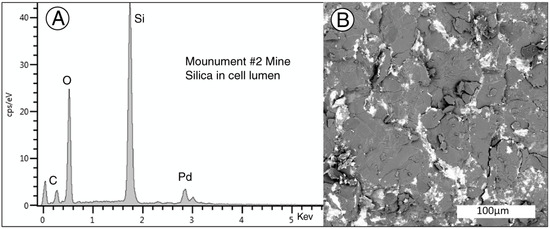
Figure 24.
(A) SEM/EDS spectrum of silica filling cell lumina. Pd peak is an artifact from metal coating of the specimen to provide electrical conductivity, Peak at 0 KeV is detector noise. (B) SEM BSE image showing bright areas where U and V minerals have replaced cell walls and filled intracellular spaces. The uranium mineral is probably tyuyamunite.
3.5. Moab Area, San Juan County, Utah
This specimen came from a private collection, the location listed as Moab (UT). The specimen (Figure 25) contains a zone of fragmental carbonized wood enclosed in a sandstone matrix. ß radiation levels are highest in the carbonaceous material, measured at 3000 counts per minute, compared to 300 counts per minute for the sandstone.
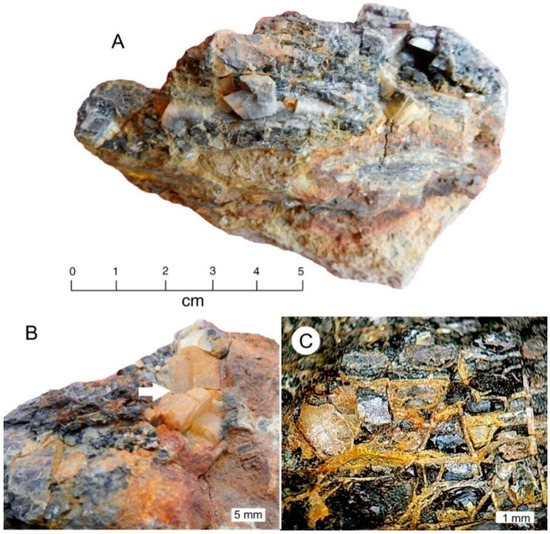
Figure 25.
Uranium ore from Moab, Utah area, consisting of carbonized wood in a sandstone matrix. (A) Upper zone contains uranium-bearing carbonized wood, lower zone contains sandstone with local iron oxide staining. (B) Rhombic white calcite crystals are abundant within the wood layer. (C) Thin fracture networks in wood zone are filled with yellow barite.
The mineralogy suggests that the sample came from the Lisbon Valley/Big Indian Wash mining district, located approximately 60km southwest of Moab. Mines in this district are in the Late Triassic Chinle Group. Distinctive characteristics of ore from this district [9] include mineralization of carbonaceous material with low-vanadium coffinite, abundance of calcite, and geometric fractures filled with amber- colored barite (Figure 25C).
This specimen appears to represent a primary uranium ore that has undergone partial alteration. Cell lumina in carbonized wood contain abundant coffinite, a common primary precipitate in anaerobic environments in sandstone-hosted uranium ores (Figure 26A–C). However, a secondary uranium mineral, zippeite, occurs as three forms. Zippeite occurring in cell lumina (Figure 26D) probably resulted from in situ oxidation of coffinite. Crusty layers of zippeite represent uranium that has been solubilized and re-precipitated (Figure 26E). Clusters of tabular gypsum microscrystals on specimen surfaces are associated with granular zippeite crystals that contain elevated Na levels (Figure 27).
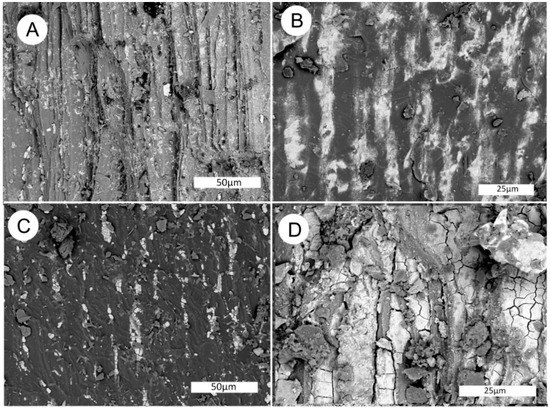
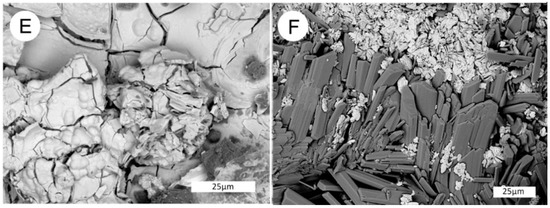
Figure 26.
SEM images of carbonized wood layer, Moab, Utah specimen. (A) Secondary electron image showing relict cell structure. (B,C) Backscattered electron images, longitudinal view of tracheid cells showing cabonized tissue (dark), and the uranium mineral coffinite (light). Coffinite primarily occurs within cell lumina. (D) BSE image shows carbonized cell walls, with luminafileld with zippeite, probably formed as an alteration product of coffinite. (E) Surface crust containing nearly pure zippeite. (F)Surface curst containing tabular gypsum crystals (dark) and microcrystalline Na-zippeite (light).
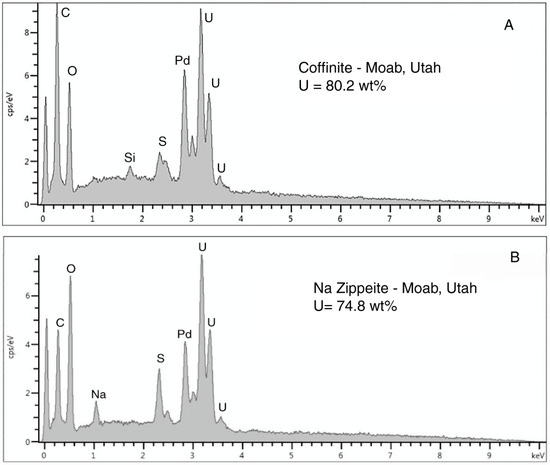
Figure 27.
SEM/EDS spectra of the three uranium minerals present in the Moab, Utah specimen. (A) Coffinite is the primary uranium mineral, typically occurring in lumina of carbonized wood cells. (B) Zippeite appears to be an alteration product that occurs both as surface crusts and within the carbonized wood zone. Na-Zippeite is associated with gypsum crystal clusters that are present as surface crusts.
The abundance of barite is a distinctive feature of the Moab sample (Figure 28). Amber-colored barite veins are abundant, the result of from late-stage mineralization when the mineral precipitated in fractures in the brittle carbonaceous zone. Less commonly, barite occurs as a cell replacement (Figure 28A), and as small inclusions in carbonized wood (Figure 28C). Rhombic calcite crystals represent another late-stage mineral (Figure 25B). Uranium levels are low in both the barite and calcite, but high magnification SEM images show that small amounts of uranium occurs in some calcite crystals (Figure 28D). Uranium is evident from EDS spectra fromthese zones, but the domain size is too small to allow determination of any particular mineral.
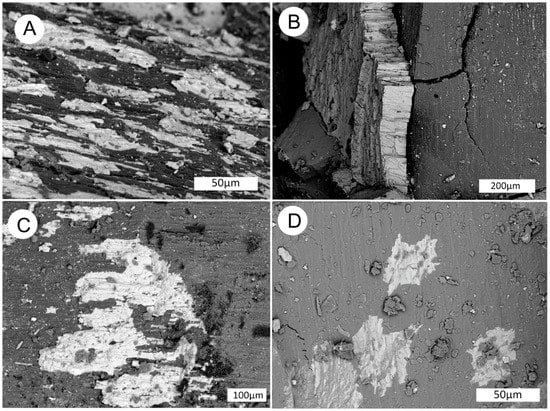
Figure 28.
Moab (UT) specimen, SEM backscatter electron images. (A) Barite (light) occurring as a cell replacement for carbonized wood. (B) Barite filling fracture in carbonized wood. (C) Barite inclusion within carbonized wood. (D) Unidentified uranium mineral (light) within a calcite crystal in wood layer.
To summarize, the mineralogy of this sample suggests that it a transitional specimen where coffinite-mineralized fossil wood has undergone complex alteration, with precipitation of barite and calcite from dissolved elements supplied by groundwater. The partial alteration of coffinite to zippeite may have been caused by oxidation triggered by changes in the water table.
3.6. Rawhide District, Mineral County, Nevada
Samples were collected by the author (age 13) in 1962 at a site in Mineral County (NV). Two recorded uranium claims in the area are characterized by low-grade uranium/vanadium mineralization in opalized plant material preserved within rhyolitic tuff. The claims are the Robinson Claim (Secs. 21 and 23, T. 14. N., R. 30 E.), and the Bubbles Claim (Secs.27 and 28, T. 14 N., R. 30. The 1962 samples came from the Bubbles Claim. The age is Neogene, probably late Miocene or early Pliocene. Radioactivity levels were not reported for the Robinson Claim, but a channel sample assay revealed a 0.02% U3O8 content; fossil wood at the Bubbles Claim (Secs.27 and 28, T. 14 N., R. 30 E.) had a reported highest reading of 1.5 mR/hr [21], presumably equivalent to ~1000CPM. These radioactivity levels are comparable to the low radioactivity of the samples in this study.
The fossil wood appears to have accumulated as driftwood along the shore of an ancient lake. Three forms are present: intact silicified wood showing grain structure, assemblages of many small wood fragments cemented by common opal, and single wood specimens that have been replaced by vitreous opal (Figure 29). All samples show strong green fluorescence under short-wave UV light, less strong for long-wave UV.
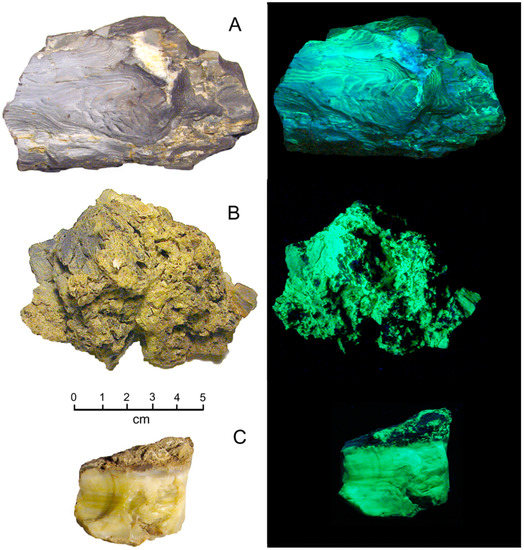
Figure 29.
Uraniferous fossil wood from Bubbles Claim. Mineral County (NV). Photos on right show fluorescence under short-wave UV light. (A) Opalized wood showing well-preserved grain pattern. (B) Assemblage of small wood fragments cemented by common opal. (C) Wood mineralized with common opal.
Specimens commonly have yellowish color, butno uranium minerals are evident in SEM images; EDS spectra do not show uranium peaks. One specimen contained minor amounts of a vanadium mineral dispersed as tiny specks within the opalized wood; otherwise V was not observed in EDS spectra.
These characteristics suggest that uranium is present at trace levels within the opal-CT that is present both as a replacement for wood cells, and as botryoidal encrustations on wood surfaces (Figure 30). The diagenetic history of the fossil wood appears to have involved multiple episodes of silica deposition, as evidenced by the presence of fractures in the opalized wood that contain crystalline quartz. This quartz does not contain uranium or vanadium, suggesting that it represents late-stage mineralization. Radiation levels are relatively low in the silicified wood preserves cellular architecture (25 CPM), compared to samples where wood has been encrusted with or replaced by common opal (50 to 300 CPM). The highest reading (3800 CPM) was a specimen of fossil wood that had a prominent yellow streak on one surface (Figure 30B). These characteristics suggest that uranium was not initially precipitated within the cellular tissue, but instead arrived later in the silica-bearing groundwater that produced the opal.
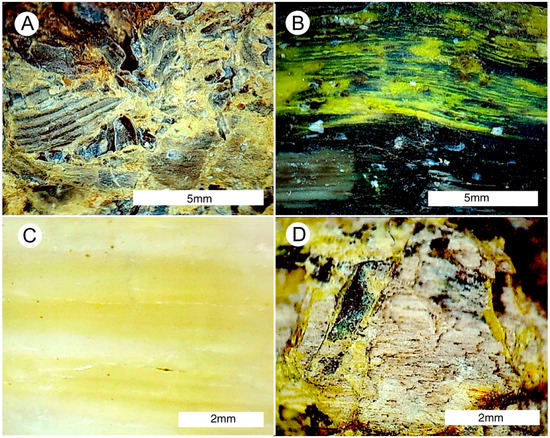
Figure 30.
Reflected light photomicrographs of uraniferous wood from Mineral County, Nevada USA. (A) Fragmental wood silicified with opal cement. (B) Bright yellow uranium-rich opal following wood grain. (C) Wood replaced by opal, with color zones parallel to wood grain. (D) Fossil wood with uranium-rich opal filling fractures that are perpendicular to wood grain.
SEM images provide useful clues for understanding this deposit (Figure 31). The lacustrine shoreline environment is supported by preservation of diatom frustules preserved on some wood surfaces (Figure 31C). Sparse amounts of a vanadium mineral were observed in SEM images from the specimen shown in Figure 30B).
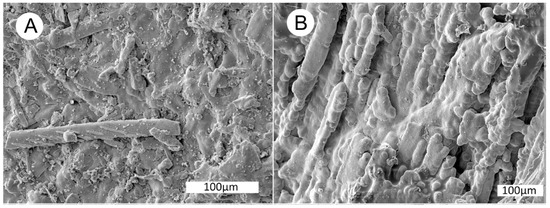
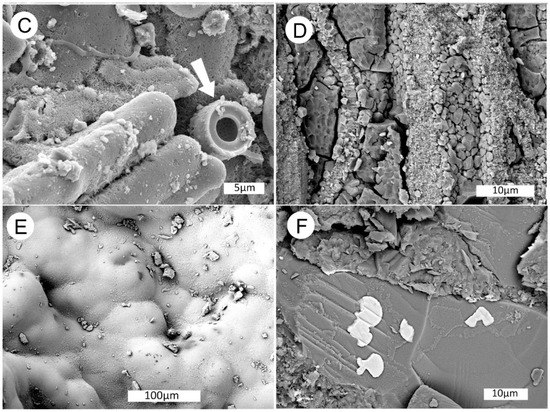
Figure 31.
SEM images of specimen shown in Figure 29B. (A) SE image of small wood fragments in a matrix of common opal. (B) longitudinal view of wood cells encased in botryoidal opal. (C) High magnification SE image of opal-coated wood cells, Arrow shows end view of a diatom frustule. Crystalline structure of Opal-CT is visible on background surfaces. (D) Fractures in dessicated opal are filled with microcrystalline quartz. (E) BSE image of botryoidal opal on exterior surface of specimen. (F) BSE view showing an unidentified vanadium minera deposited on the surface of a plagioclase feldspar clast. Similar vanadium inclusions occur in the adjacent opalized wood.
SEM/EDS evidence (Figure 32) suggest possibilities that include hewettite CaV6O16·H2O, melanovanadite (CaO)2(VO4)2(V2O5)3·H2O, rossite CaV2O6·4H2O and roscoelite (Al,V)(AL,Si4)(K,Na)O20(OH,F).
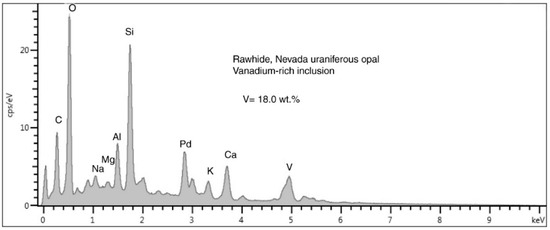
Figure 32.
SEM/EDS spectrum of a single small vanadium mineral bleb lying on a plagioclase clast (Figure 22F). The tiny size of the vanadium-rich inclusion allows the electron beam to excite elemnts in the adjacent matrix. The Pd peak is an artifact from specimen coating. The unlabelled peak ner 0 KeV is detector noise resulting form the low count rate.
3.7. Virgin Valley Royal Peacock Claim, Nevada, USA
The Miocene Virgin Valley Formation was deposited in a fluvial/lacustrine setting that preserves abundant fossilized wood. With minor exceptions, this opalized wood is typically not fluorescent or detectably radioactive. Common opal is abundant in the area; fluorescent opal (Figure 33) is found at a claim that does not preserve fossil wood. At this locality, yellow-colored opal specimens are weakly radioacive (100 CPM); white opal specimens from the same bed are fluorescent, but not measurably radioactive.
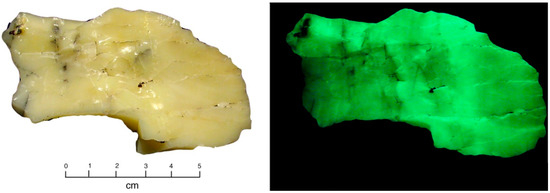
Figure 33.
Uraniferous opal from uranium claim on hillside above Royal Peacock Mine headquarters. Location details canbe found in [21,22].
Uranium claims at Virgin Valley began in 1950,resulting in the eventual staking of more than 700 claims [23]. None proved to be economic, but interest in uranium mineralogy resulted in a detailed investigation [24]. Uranium levels ranged from 7.4 to 823 ppm. Fission track images show the uranium distribution in the opal is very homogeneous, suggesting that uranium coprecipitated with the silica rather than being present as inclusions or fracture fillings. This mode of origin is perhaps similar to Australian precious opal, where atoms ofuranium and other heavy metals provided nucleation points for the precipitation of opal spherulites [25]. Daylight-luminescent hyalite opal from Zacatecas, Mexio is belived to result from dispersed microcrystals of uranium minerals [26,27,28,29].
This Virgin Valley opal is analagous the the Mineral County (NV) locality, where trace amounts of uranium were carried by the silica-bearing groundwater that produced the opal; uranium precipitation is not directly associated with the fossilization process, but is instead merely a trace accessory. As at the Mineral County locality, extensive deposits of rhyolitic tuff in the Virgin Valley area provided a likely source for the dissolved uranium. At Virgin Valley, extensive diatomite deposits provided an additional source of dissolved silica.
4. Discussion
In the 1950s the production of uranium for construction of nuclear weapons and nucler power plants provided an incentive for numerous scientific studies, but these investigations were gnerally focused on factors that related to economic geology. Studies of the chracteristics of known deposits were intended to provide valuble information for locating new uranium occurrences. Although wood and other organic matter was known to play important roles for the precipitation of uranium and vanadium minerals, surprisingly little attention was given to how these minerals might relate to the fossilization process. At present, the study of mineralization of ancient wood in uranium deposits is hindered by the scarcity of specimens. Among the multitude of uranium mines that once fluorished in the sedimentary rocks of the American Southwest, very few sites remain accessible for study. Specimens in collections commonly lack detailed provenance information. This report suffers from those limitations, and in many instances a uranium claim is represented by only a single specimen. Despite these limitations, some results are clear: the uranium mineralogy of fossil wood is highly varied. Uraninite and coffiite were dominant mineral s in primary ore zones that are present in some mines, but many mines exploited ore that had undergone secondary altertion, where the most economically important uranium minerals were carnotite, tyuyamunite, and autunite, along with a host of other oxidation products. In these oxidized zones, fossil wood may contain complex mineral assemblages.
This report demonstrates the value of BSE SEM images and EDS X-ray fluorescence spectra for studying the micromineralogy of uranium and vanadium deposits, but other modern analytical methods potentially offer additional possbilities for studying mineralization of carbonaceos maaterials in uranium deposits.In recent years, uranium ore minerals have been studied in using micro X-ray fluorescence (μXRF), inductively coupled plasma mass spectrometry (ICP-MS), luminescence spectroscpy, micro X-ray absorption spectroscopy, mcroXRD, Raman spectroscopy, and isotopic analysis. (For comprehensive references, see [30]). Data in this report are an advance over the information that was obtained in the “uranium boom” era of the 1950s, but other instrumental methods offer future researchers exciting possibilities.
Funding
This research received no external funding.
Acknowledgments
The author thanks Mark Hart and Jim Mills for providing uranium ore specimens. Sue Sullivan, director of Environmental Health and Safety at Western Washington University, facilitated measurement of radioactivity of specimens used in this study. Mike Kraft and Charles Wandler provided technical support for my use of the SEM/EDS facilities at SciTech Services, W.W.U. Three anonymous reviewers provided helpful suggestions for improving the manuscript.
Conflicts of Interest
The author declares no conflict of interest.
References
- Lauf, R. Introduction to Radioactive Minerals; Schiffer Pub.: Atglen, PA, USA, 2007. [Google Scholar]
- Anon. Geological Classification of Uranium Deposits and Selected Examples; IAEA Techdoc 1842; IAEA: Vienna, Austria, 2018. [Google Scholar]
- Chenowith, W.L.; Malan, R.C. The uranium deposits of northeastern Arizona. In Guidebook of Monument Valley and Vicinity, Arizona and Utah, 24th Field Conference; Trauger, F.C., Ed.; New Mexico Geological Society: Socorrro, NM, USA, 1967; pp. 139–149. [Google Scholar]
- Chenowith, W.L. The uranium-vanadium deposits of the Uravan mineral belt and adjacent areas, Colorado and Utah. In New Mexico Geological Society Guidebook, 32nd Field Conference; Western Slope Colorado; Epis, R.C., Callender, J.F., Eds.; New Mexico Geological Society: Socorro, NM, USA, 1981; pp. 165–170. [Google Scholar]
- Bolin, E.M.; Kerr, P.F. Uranium mineralization near Cameron, Arizona. In Black Mesa Basin (Northeastern Arizona); New Mexico Geological Society 9th Annual Fall Field Conference Guidebook; Anderson, R.Y., Harshbarger, J.W., Eds.; New Mexico Geological Society: Socorro, NM, USA, 1958; pp. 164–168. [Google Scholar]
- Huff, L.C.; Lesure, F.G. Geology and Uranium Deposits of Montezuma Canyon Area, San Juan County, Utah; U.S. Geological Survey Bulletin 1190; USGS: Reston, VA, USA, 1965.
- Updegraff, D.M.; Douros, J.D. The relationship of microorganisms to uranium deposits. Dev. Ind. Microbiol. 1972, 13, 76–90. [Google Scholar]
- Charles, S. The role of organic matter in the formation of uranium deposits in sedimentary rocks. Ore Geol. Rev. 1996, 11, 53–59. [Google Scholar]
- Gross, E.B. Mineralogy and paragenesis of the uranium ore, Mi Vida Mine, San Juan County, Utah. Econ. Geol. 1956, 51, 632–648. [Google Scholar] [CrossRef]
- Trites, A.F., Jr.; Chew, R.T.; Lovering, T.G. Mineralogy of the Uranium at the Happy Jack Mine, White Canyon District, San Juan County, Utah; U.S. Geological Survey Trace Elements Report 514; USGS: Washington, DC, USA, 1955.
- Weeks, A.D.; Coleman, R.G.; Thompson, M.E. Part 5. Summary of the ore mineralogy. In Geochemistry and Mineralogy of the Colorado Plateau Uranium Ores; U.S. Geological Survey Professional Paper 320; Garrels, R.M., Larsen, E.S., Eds.; USGS: Washington, DC, USA, 1959; pp. 65–79. [Google Scholar]
- Min, M.Z.; Lup, X.Z.; Mao, S.L.; Wang, Z.Q.; Quin, L.F.; Tan, X.I. An excellent fossil wood cell texture with primary minerals at a sandstone-hosted roll-type uranium deposit, NA China. Ore Geol. Rev. 2001, 17, 233–239. [Google Scholar] [CrossRef]
- Mineral Species Containing Uranium. Available online: http://webmineral.com/chem/Chem-U.shtml#.XivHTE9Kjcs (accessed on 24 January 2020).
- Weeks, A.D.; Thompson, M.E. Identification and Occurrence of Uranium and Vanadium Minerals from the Colorado Plateaus; U.S. Geological Survey Bulletin 1009-B; USGS: Washington, DC, USA, 1954.
- Frondel, C. Systematic Mineralogy of Uranium and Thorium; U.S. Geological Survey Bulletin 1064; USGS: Washington, DC, USA, 1958.
- Lauf, R. Mineralogy of Uranium and Thorium; Schiffer Pub.: Atglen, PA, USA, 2016. [Google Scholar]
- Hess, F.L.; Henderson, E.P. Fervanite, a hydrous ferric vanadium mineral. Am. Mineral. 1931, 16, 227–273. [Google Scholar]
- Weeks, A.D.; Cisney, E.A.; Sherwood, A.M. Montroseite, a new vanadium oxide from the Colorado Plateau. Am. Mineral. 1951, 36, 310–328. [Google Scholar]
- Cesbron, F. La schubnélite, nouveau vanadate de ferhydraté. Bull. Soci. Fran. Minéral. Cristallogr. 1970, 93, 470–475. [Google Scholar] [CrossRef]
- Pekov, I.V.; Siidra, O.I.; Yapaskurt, V.O.; Polekhovsky, Y.S.; Kartashov, P.M. Ziminaite, Fe3+VO4, a new howardevansite-group mineral from the Bezymyannyi volcano, Kamchatka, Russia. Mineral. Petrol. 2018, 112, 371–379. [Google Scholar] [CrossRef]
- Garside, L.G. Radioactive Mineral Occurrences in Nevada. Nevada Bureau Mines Geol. Bull. 1973, 81, 77–78. [Google Scholar]
- Statz, M.H.; Bauer, H.L. Virgin Valley opal district Humboldt County, Nevada; U.S. Geological Survey Circular 142; USGS: Washington, DC, USA, 1951.
- Tuchek, E.T.; Johnson, F.J.; Conyac, M.D. Economic appraisal. In Charles Sheldon Wilderness Study Area, Nevada and Oregon; U.S. Geological Survey Bulletin 1538; USGS: Washington, DC, USA, 1984; pp. 131–138. [Google Scholar]
- Zielinski, R.A. Uraniferous opal, Virgin Valley, Nevada: Conditions of formation and implications for uranium exploration. J. Geochem. Explor. 1981, 16, 197–216. [Google Scholar] [CrossRef]
- Senior, B.R.; Chadderton, L.T. Natural gamma radioactivity and exploration for precious opal in Australia. Aust. Gemmol. 2007, 23, 160–176. [Google Scholar]
- Megaw, P.K.M.; Fritsch, E.; Spano, T.L.; Gray, M. Geology and mineralogy of electric opal. Green daylight-luminescing hyalite opal from Zacatecas, Mexico. Rocks Miner. 2018, 93, 404–412. [Google Scholar] [CrossRef]
- Fritsch, E.; Megaw, P.K.W.; Spano, T.L.; Chauviré, B.; Rondeau, B.; Gray, M. Green luminescing hyalite opal from Zacateas, Mexico. J. Gemmol. 2015, 34, 490–508. [Google Scholar] [CrossRef]
- Fritsch, E.T.; Spano-Franco, T.; Megaw, P. Gem notes: Green daylight-fluorescent hyalite opal from Mexico. J. Gemmol. 2014, 34, 294–296. [Google Scholar]
- Haag, T. Green daylight-fluorescing hyalite opal. Lapid. J. 2017, 71, 38–43. [Google Scholar]
- Corcoran, L.; Simonetti, A.; Spano, T.L.; Lewis, S.R.; Dorais, C.; Simonetti, S.; Burns, P.C. Multivariate analysis based on geochemical, isotopic, and mineralogical compositions of uranium-rich samples. Minerals 2019, 9, 537. [Google Scholar] [CrossRef]


© 2020 by the author. Licensee MDPI, Basel, Switzerland. This article is an open access article distributed under the terms and conditions of the Creative Commons Attribution (CC BY) license (http://creativecommons.org/licenses/by/4.0/).