Abstract
Microplastics are a fast-emerging group of contaminants. Their worldwide occurrence in water, sediment, and aquatic fauna raises questions and concerns as to their probable effects on aquatic life and ecology. This study investigates for the first time presence, abundance, and types of microplastics in water and sediment from a lagoon bordering the large urban agglomeration of Lagos in Nigeria, and renders additional information about the sediment composition. Water and sediment samples were collected from four locations in the Lagos Lagoon and a tributary. The abundance and distribution of microplastics in four range classes were determined for the sampled locations. Plastic particles were counted using digital microscopy, and identified with Fourier Transform-Infrared Spectroscopy (FTIR) and pyrolysis Gas Chromatography–Mass Spectrometry (GC-MS). The abundance of microplastics ranged from 310–2319 particles/kg in sediment, and 139–303 particles/L in water. The large discrepancy in the sediments can be explained by sediment characteristics as more microplastics were detected in the fine-grained sediments of Makoko. Fibres were the predominant shape found in all samples followed by fragments and few films. Fibres were more abundant in water (92.6%) than in sediments (32.5%), while more fragments and foils occurred in sediments. The most commonly used polymers polypropylene and polyethylene were also the most detected ones in both matrices. Compared to other studies in Nigeria, our findings especially in the coarser sediments were lower while the fine-grained site revealed similar results.
1. Introduction
Plastic pollution of the world’s oceans and inland waters has become a matter of global concern [1,2]. The plastic production has exponentially risen from 1.5 Mt in 1950 to 359 Mt in 2018 [3]. Millions of single-use bottles are purchased daily, and the use of plastic bags is even more pervasive with approximately trillions per year [4]. Improper waste management leads to littering in the environment and to a rising occurrence of plastics in freshwater and marine environments. Macroplastics degrade to microplastics (MPs) (5 mm) which were first described in the 1970s [5,6]. MPs are distinguished in terms of their origin. Primary MPs mostly consist of small-sized industrially manufactured pellets, fragments, or microbeads which are used in personal care products [2] or in processes such as industrial shot blasting wherein MPs are used as abrasive media [7]. Secondary MP are formed by abrasion from larger plastic pieces during usage or by fragmentation due to weathering in the environment [7]. This category includes fragments of plastic litter in aquatic environments and on land, films from agricultural use [8] or fibres from textiles released to the environment as a result of everyday usage or cleaning [9]. Moreover, different shapes (spheres, fibres, foils and fragments) exist [10].
Macro- and microplastics enter fresh- and marine waters when not properly disposed. Thus, most of the world’s plastic reaches the oceans by rivers and other inland waters [11,12,13]. Moreover, large amounts of such debris affect the aquatic fauna posing risks of fouling/entanglement, injury, and ingestion [14,15].
However, basic information about the occurrence of MPs in Africa′s oceans, lakes, and estuaries is lacking [16]. In the last years, several case studies have been published. MPs in water have been investigated in East, and North Africa: Lake Naivasha, Kenya [17], Lake Victoria, Uganda [18], in fish and sediments in Ethiopia [19], and in sediments of the Bizerte Lagoon in Tunisia [20]. For Nigeria, one study about MP ingestion of gastropods in the river Osun, Nigeria (a tributary of the Lagos Lagoon), and another about MP ingestion of aquatic insect larvae has recently been published [21]. MPs in fish in the River Nile, Egypt [22], in pelagic and demersal fish [23] and two local fish species [24] in the marine waters of Ghana were also investigated.
The city of Lagos is a densely populated area with a proliferation of overcrowded slums and neighbourhoods that are home to millions of the city’s population [25]. These densely populated locations next to the bordering Lagos Lagoon are significant contributors to the loading of plastic waste into this water body. In the city of Lagos, large amounts of waste are generated daily, with plastics contributing a significant proportion [26]. Missing or improper management leads to a high amount of waste in the environment.
The goal of this study is to present first data about the presence, abundance and types of MPs in water and sediment of the Lagos Lagoon abutting the large urban agglomeration of Lagos in Nigeria and to compare these results with sedimentological characteristics of the sediments.
2. Materials and Methods
2.1. Study Area
The study area is located at the Gulf of Guinea in the State of Lagos, Nigeria. The city Lagos is a west African megacity [27] with a large and strongly growing population estimated at 17 million inhabitants [28] and projected to reach 88.3 million by 2100 [29]. The lagoon of Lagos borders the city of Lagos. With an estimated length of 50 km, width of 3–13 km, and a total size of 6354.7 km2 [30], the lagoon is the fourth largest lagoonal system of the Gulf of Guinea. The two larger rivers Ogun and Osun discharge into the lagoon. Several channels and the Badagry creek connect the lagoon with Cotonou, Benin in the west, and with the Lekki lagoon to the east. A 2–16 km wide beach barrier separates Lagos Lagoon off the Gulf of Guinea. Badagry creek has its confluence with the lagoon in its southwestern part where they discharge into the Gulf of Guinea (Figure 1).
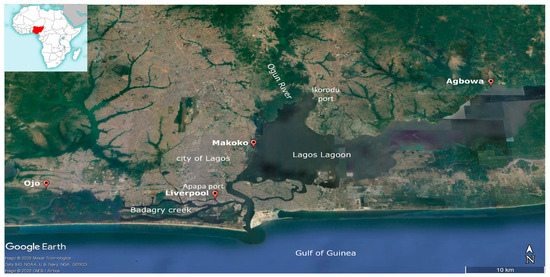
Figure 1.
Location of the study area. Sampling sites in the Lagos Lagoon and the Badagry creek (source: Google Earth pro 2020).
Four different sites were sampled along the Lagos Lagoon (Agbowa and Makoko) and further to the west (Ojo and Liverpool) (Figure 1). The sampling sites Makoko and Agbowa are located inside the Lagos Lagoon. Makoko [31] on the western side is characterised by stilt houses. Ojo lies upstream of Badagry creek 37 km to the west of Lagos city and Liverpool/Apapa with the main harbour of the agglomeration of Lagos further downstream. Badagry creek was sampled upstream and at the site Liverpool, close to the embouchure into Lagos Lagoon.
2.2. Sampling
The samples were taken approximately 1 m from the shore. Four water samples (one per sampling site) of 700 mL were taken with a pre-cleaned jar directly below the water surface. The four sediment samples (one per sampling site; ~110–190 g) were retrieved with a Van-Veen-grabber at a depth of approximately 80 cm.
2.3. MP Xtraction from Water and Sediment Samples
Water samples were filtered using glass fibre filters paper (Whatman™ 1823-047 Grade GF/D, diameter: 4.7 cm, pore size: 2.7 µm, Cytiva, Uppsala, Sweden)). Sediments were oven-dried and both samples sent to the Federal Institute of Hydrology (Koblenz, Germany). The wet and dry weight of sediment samples were noted. The particles from the glass fibre filter papers were rinsed off with distilled water. Depending on the amount of organic matter, the samples were digested with 35–145 mL of hydrogen peroxide (Sigma-Aldrich 34.5–36.5%, St. Louis, MO, USA) and agitated for 5–6 days [32,33]. Tentative MP particles were separated from the remaining inorganic material in a separation funnel with a saturated aqueous potassium formate solution (density: 1.6 g mL−1). After 3–4 days, the lowest water phase with inorganic material was separated and the remaining water with MPs pressure-filtrated on nanopore inorganic membrane (anodisc) filters (Whatman, diameter: 47 mm, pore size: 0.2 µm). The filters were covered to prevent contamination, air-dried at 50 °C, and stored in an aluminium bowl.
2.4. Identification of MP in Water and Sediment Samples
2.4.1. Visual Identification
For visual identification, a digital microscope with an attached camera (Keyence VHX2000, Mechelen, Belgium) was used. Standard criteria for visual identification of tentative MP particles were chosen after Norén [34]. Colour (black, blue, grey, green, purple, red, transparent, turquoise, white, yellow), size (longest particle diameter), and shape (fragment, sphere, fibre, film) were considered. Moreover, the absence of organic structures, equal thickness e.g., for fibres and homogenous coloration of the particle were taken into account. For the water samples, total particle abundance was calculated based on the filtered water volume and stated as particles per l. MPs in sediment samples are given as particles per kg dry sediment.
2.4.2. ATR-FTIR and µFTIR Analysis
All tentative MPs 2 mm were measured with a Vertex 70 ATR-FTIR (Bruker, Ettlingen, Germany). Subsamples 2 mm of tentative MPs of both water and sediment samples were further isolated and analysed using µFTIR analysis (Hyperion 2000, Bruker, Ettlingen, Germany) to determine particle polymer composition. The FTIR measurements with the Vertex 70 were conducted in attenuated total reflectance mode (ATR) in a wavenumber range of 4000–600 cm−1 with 8 co-added scans and a spectral resolution of 4 cm−1. The µFTIR measurements were conducted in transmission mode (wavenumber range 3800–1250 cm−1) and ATR (wavenumber range 4000–600 cm−1) mode with 32 co-added scans and a spectral resolution of 4 cm−1. Particle spectra were compared to a plastic polymer data bank with reference spectra for the most common polymer types using the software OPUS 7.5 (Bruker) [35] and considered as MP with a hit quality 700 [36,37]. Natural fibres were also identified.
2.4.3. Pyrolysis GC-MS Analysis
For pyrolysis GC-MS, selected particles and fibres from water and sediment samples were measured in metal cups (Eco-Cup LF, Frontier Laboratories, Saikon, Japan) and flash pyrolyzed at 600 °C [38]. Measurements were done with a Multi-Shot Pyrolyzer EGA/PY-3030D (Frontier Laboratories, Saikon, Japan) and an Auto-Shot Sampler AS-1020E (Frontier Laboratories, Saikon, Japan). An Agilent 7890B gas chromatograph (Santa Clara, CA, USA) with a separation column DB-5ms (Agilent, Santa Clara, CA, USA) of the dimensions 30 m length, 0.25 mm inner diameter, 0.25 µm film thickness was used. Injection was performed in split mode with a split ratio 1:25 for particles and 1:10 for fibres. Chromatographic separation was performed by the temperature program: hold at 40 °C for 2 min, increase at 20 °C min−1 to 320 °C and hold for 13 min. An Agilent MSD 5977B (Santa Clara, CA, USA) in full scan mode (m/z 40–500) was used for detection. For identification, the resulting pyrograms were compared to the NIST 14 MS database and the F-Search 3.4 database (Frontier Laboratories, Saikon, Japan).
2.5. Quality Control
Quality controls for the samples were conducted during the extraction process and visual sorting. For the extraction process, two processing blanks were run by digesting and filtrating 10 mL of distilled water in the same way as the water and sediment samples. For the quantification of atmospheric fallout, aluminium oxide filters (sorting blanks) were exposed next to the digital microscope for a duration equalling the time needed for visual analysis for filtrates of one sampling site. MPs on the processing and sorting filters were characterized visually and some representative particles were analysed with the µFTIR.
2.6. Granulometry and C/N Ratio
For grain size analysis, the sediment samples were dried and sieved (2 mm). Samples were treated with hydrogen peroxide (15% H2O2) for destruction of the organic content and with sodium pyrophosphate (Na4P2O7, 46 g/L for dispersion. A laser diffraction particle size analyser (Beckman Coulter, LS-13320, Brea, CA, USA) was used for measuring the grain size. Statistical analysis was done with the Gradistat software [39].
The C/N ratio (carbon/nitrogen contents) is an important parameter for determining the sediment composition and the sources of organic matter. It is calculated based on carbon/nitrogen and total organic carbon (TOC) values (total organic carbon). For measuring the C/N ratio, all sediments were homogenized and weighed three times in tin boats. Measurements were conducted with a Vario Macro CNS (Elementar, Langensenbold, Germany).
Total carbon (TC) and nitrogen (N) were determined, followed by the total organic carbon (TOC).
3. Results
3.1. Abundance, Shape, and Size
After visual analysis, all water and sediment samples from the four locations (Figure 2) Agbowa, Makoko, Ojo, and Liverpool contained tentative MPs with sizes 100 µm. For sediments, Makoko revealed the highest quantity of tentative MPs (2319 particles/kg) followed by Ojo (410 particles/kg), Liverpool (345 particles/kg) and Agbowa (310 particles/kg) (Figure 2). The water samples revealed concentrations with a max. in the Liverpool sample (303 particles/L) and a min. in the Agbowa sample (139 particles/L). In Makoko and Ojo samples, ca. 200 particles/L were counted (204 particles/L and 184 particles/L respectively).
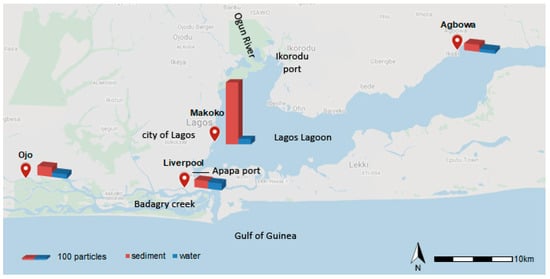
Figure 2.
Abundance of tentative microplastics (MPs) in sediment (per kg) and water (per L at the four sampling sites (source: Google Maps, 2020).
The three shapes fibres, fragments and foils were differentiated. The majority of tentative MPs were fibres. In the water samples 87–95% fibres were counted, in sediments 24–50%. Some fragments (2–11%), mostly in Liverpool and Agbowa, and few foils (0–4%) were detected in the water phase. The shape differed within one site in the different compartments as the number of fragments was considerably higher in sediments (31–73%; min. Ojo, max. Liverpool) than in the water phase (1–12%). Only Ojo revealed more fibres than fragments in the sediments. Moreover, the number of foils was higher in the sediments from Makoko and Ojo (both 18/19%) than in the other two samples (Liverpool 2%, Agbowa 7%) (Figure 3).
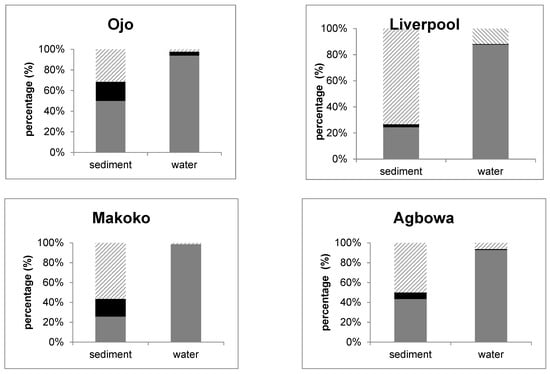
Figure 3.
Form of microplastics in water and sediment samples (grey: fibre, black: foil, dashed line: fragment).
Tentative MPs were differentiated into three size classes 100–500 μm, 500–1000 μm, and 1000 μm. The size of the tentative MPs reveals contradictory results in the two compartments: more particles with a larger size were counted in the water phase (Figure 4). With the exception of Agbowa, more particles with a smaller size were present in the sediments.
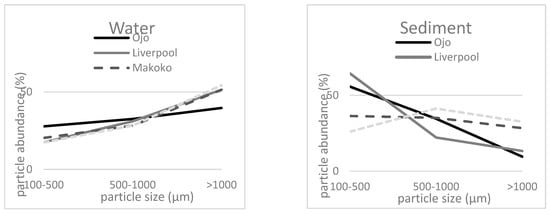
Figure 4.
Size distribution of tentative MP particles (visual analysis) in the water and sediment samples of the four sampling sites.
Tentative MPs of ten different colours were identified in the samples: black, blue, grey, green, purple, red, transparent, turquoise, white, and yellow. The most common colours of tentative MPs were transparent (41%) and black (30%) for sediments and black (40%), blue (23%), and transparent (22%) for the water samples.
3.2. Control Samples
On the blanks, only fibres were detected. On processing blanks, 13 fibres were counted for water samples and 58 for sediments. Sorting blanks revealed 1–4 fibres per sampling site. Representative fibres (two blue, one red, one transparent) were measured using µFTIR. The results revealed that all measured fibres were of natural origin, most probably cotton.
3.3. Grain Size and C/N
The sediments of Ojo, Liverpool, and Agbowa are composed of coarse-grained sand (mean 450–608 µm). Makoko in contrast is dominated by clayey silt with a mean of 18.5 µm (Table 1).

Table 1.
Grain size distribution (%).
The C/N ratio and TOC (total organic carbon) was determined for all sediment samples. Ojo has a C/N ratio of 15 and a TOC of 0.3%, Liverpool a C/N of 30 and a TOC of 0.6%, Makoko a C/N of 20.22 and the highest TOC (4.65%). The lowest C/N ratio was measured at Agbowa (12.5, TOC: 0.25%).
3.4. Microplastic Identification
Overall, 45 representative particles out of 889 (5.1%) were chosen for Attenuated Total Reflectance-FTIR and pyrolysis GC-MS analysis. 18 particles could be identified as polymers. In the water phase, PP, PE, and polyester were identified while sediments revealed a more diverse polymer distribution (PP, PE, polyester, PS and polyacrylic). The most abundant polymer type was PP (23% in sediments, 17% in water), followed by polyester for water (13%) and PE for sediments (9%) (Figure 5 and Figure 6).
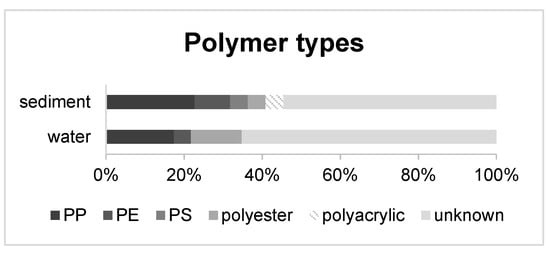
Figure 5.
Polymer abundances of 45 representative particles (5.1%) in percentage from water and sediment samples.

Figure 6.
µFTIR spectra (red: measured spectrum, blue: reference spectrum from the Bruker spectral database) of analysed microplastics: (a) red polyester fibre, (b) green polypropylene fragment, (c) transparent polyethylene foil.
4. Discussion
4.1. Characterization and Distribution of Microplastics in Nigeria and the Lagos Lagoon
The ubiquitous presence of MPs in the world’s oceans has been described by different authors [40,41]. Estimations show that millions of tons of plastic waste enter the world’s oceans every year originating predominantly from land-based sources (e.g., as a result of poorly managed waste) [11,42,43,44] and transported via freshwater into the oceans [45] where it is present in marine litter aggregations [46]. At the same time, MPs are generated due to attritive processes including photolytic and thermal oxidation, hydrolysis, and microbial driven biodegradation [47]. This ultimately results in the degradation of larger marine plastic fragments in a prolonged and sustained manner considering the environmental resilience and persistence of fabricated plastic polymers. In contrast, only little information on presence, distribution, types and contribution of inland waters including estuaries, rivers, and lagoons, especially from inland Africa [48], is available [49].
The per capita consumption of plastics in Nigeria has grown consistently since 1997 and is estimated to reach 7.5 kg in 2020 [50]. Based on the latter projection and using Lagos as a microcosm of Nigeria, the city is set to generate a correspondingly large amount of non-degradable waste in 2020, mainly of single-use type plastics. Considering this against the backdrop of poor sewage disposal, usually without preliminary waste treatment, of liquid domestic and industrial waste streams, indiscriminate solid waste disposal and incineration on unprotected/poorly managed landfills [51], land-based contributions to plastic waste generation and contamination of water niches in the Lagos scenario can be rightly surmised to be significant.
The results of this study clearly revealed that many tentative MPs were found in sediments which leads to the assumption that sediments are a sink for MPs [32]. Between the study sites, differences were visible. Makoko had the highest number of tentative MPs with 2319 particles/kg, about eight times more than the other sites (310–410 particles/kg). The sediments of Makoko mainly contained silt and clay. A lower flow velocity and the deposition of more fine-grained particles are the consequence. Makoko is a community of largely stilt habitations situated offshore, and directly built into the lagoon. Movements between habitations and fishing activities (livelihood of a majority of inhabitants) are mainly done using paddle boats which serve as floating markets and service centres for residents. Waste (human, animal, solid) is directly disposed into the lagoon. The sediments of the other three sampling sites, in contrast, mainly consisted of sand (ca. 99%) and considerably fewer numbers of MPs in water and sediments. This can be explained by a higher flow velocity of the creek and in the lagoon and thus by a deposition of fewer small particles. The relatively high C/N rations point to an allochthonous origin, thus a higher input of terrestrial plants [52,53]. In the water phase, the highest amount of water-suspended fibres was counted in Liverpool (302 particles/m3) whereas Makoko only revealed 204 particles/m3. Liverpool also revealed the highest numbers of tentative MPs 1000 µm in the water phase and the highest proportion of fragments in the sediments (73%). A description of human activities at this location may help to explain the latter finding. This location is a major embarkation and berthing site for water transport boats, a landing site for one of the biggest daily fish markets in Lagos, and a site of significant levels of sand dredging. Liverpool is also located close to the main Lagos port and sea lanes. These activities serve to keep the waters in this location in a semi-permanent state of flux responsible for prolonged suspension and reduced settling of MPs. Alongside seasonal high water runoffs such as heavy rainfall events could help to accentuate the situation by remobilizing pools of larger sediment-bound MPs [54]. We surmise that MP distribution in all matrices and locations are governed by the local dynamics of their proximity to urban areas and human activities, as suggested by Frere et al. and Tata et al. [55,56]. The impacts of human habitations and activities are heightened in the low energy microtidal environment of the lagoon by low tidal speeds, and restricted intra-lagoon circulation between the main lagoon basin and interconnecting creeks, sites of active silting and deposition of mud and ensconced detritus [57].
Fibres were the most common MP type in the water phase. A predominance of fibre presence in sediment and water have been reported in other studies in peri-urban water bodies [58,59,60,61]. These large percentages of fibres could be attributed to domestic wastewater streams, sewage overflows, in-situ washing of synthetic fabrics, seasonal rainy season inundations, terrestrial runoffs, and tidal hydrological interplay with the adjoining Atlantic Ocean (fluvial dynamics).
The sediment composition may enhance retention at Makoko. Compared to our results, a Canadian study [62] reported a lower number of MPs in water (max. 0.24/L), but similar results in the sediment (max. 2200/kg DWT) and the preponderance of fibres. The authors posited that MP abundances in sediments was not significantly related to the mean particle size or the organic content of the sediment, suggesting that aggregated MPs (clumps) settle quicker due to mixing with other organic and inorganic materials (foulers), giving greater density/less buoyancy and thus enhancing MP settling [62]. The authors suggest further investigations to ascertain these observations. Other studies in fresh- and marine waters showed that fibres have a low settling velocity. Moreover, water currents also prevent fibres from sinking and thus they do not accumulate in the sediments [53,57,63]. Foils and fragments were more common in the sediments than the water phase, probably due to the development of biofilms, the density of the polymers [63,64,65], or a lower surface to volume ratio [66]. Their particle size was also smaller (125–500 µm in sediments) whereas fibres with a size 1000 µm dominated the water phase. Thus, a direct connection between particle form and particle size can be made (see Figure 4) [67].
The polymer content also reveals differences between the compartments. Polypropylene (PP), polyethylene (PE), and polyester were the most common polymers in the water samples. Sediments were characterised by a more diverse polymer distribution (PP, PE, polyester, PS, and polyacrylic). This has been confirmed by other studies [32,68,69,70]. The higher diversity in the sediments can be explained by many polymers with a density 1 g/cm3 as well as weathering, biofouling, or the formation of hetero-aggregates [63,64,65].
Abundance trends for water and sediment were fairly consistent with global trends of polymers (PE ≈ PP PS PVC PET), indicating global [71] and local plastic demand [50] in Nigeria. Low-density polyethylene (LDPE) and PP are widely used in plastic packaging, PP especially for the packaging of water in sachets. These single-use applications of LDPE and PP have made indiscriminate post-usage disposal one of the most significant sources of non-degradable waste in Nigerian urban centres [72,73], being responsible for the pollution of waterways, storm and sewage drains, and landfill mass in terms of sheer tonnage. Black plastic foil (2 mm) as commonly found in the Makoko sediments probably originated from black plastic bags, such as shown in the study by Akindele et al. [74].
4.2. Comparison to Other Studies
In this study, tentative MP particles ranged between 310–2319 particles/kg and 139–303 particles/L in sediment and water, respectively. Ilechukwu et al. [75] studied four beaches in the Lagos Lagoon and detected higher concentrations of MPs on beaches along the southern coastline (2420–3400 MPs/kg) than our findings in the western part of the lagoon. Our results confirm the occurrence of the polymers PE, PP and PS which have been described by Ilechukwu et al. [75]. Martellini et al. [76] published a compilation of MP studies in coastal areas in the Mediterranean Sea. The results of studied sediments reveal that the most contaminated sites were the lagoon and estuaries. Sediments were predominantly studied. In Tunisia, two studies have been published about sediments of the Bizerte Lagoon and surrounding streams [77]. The results revealed higher counts than in this study with 2340–6920 MPs/kg for the streams and 3000–18,000 MPs/kg for the lagoon. Similar to this study, fibres and fragments dominated. In the Venice Lagoon, similar MP concentrations (672–2175 MPs/kg) as in Lagos Lagoon were observed [78].
In most of these studies, particles were first investigated by means of visual identification followed by an analytical verification (with the exception of the Venice Lagoon). Thus, the results of these studies are such as ours not reliable to 100% as only a small part of the tentative particles were verified analytically. The polymers in all studies were also similar to our study with a dominance of PP and PE. Results for the water phase were published for the freshwater Lake Naivasha, Kenya with very low concentrations of 1.5–5 MPs/m3 [13]. For rivers in contrast, many studies investigating the water phase report concentrations of 0.29 [59] to 340,000 MPs/m3 [79]. Compared to rivers worldwide, the findings in the Lagos Lagoon range in the upper limit of these results.
5. Conclusions
One consequence of the exponential increase in plastic production worldwide is the presence of plastics in the marine environment. Rivers are responsible for the majority of the plastic input into the oceans. In order to draw conclusions about Nigeria′s plastic input, this study was carried out to demonstrate the pollution caused by MPs in the Lagos Lagoon and the adjacent rivers. Plastic contamination of the water bodies could be determined by taking samples at different water bodies. Within the sediments, comparatively more microplastics were found in the fine-grained sediments of Makoko (2319 particles/kg) than in the sandy three other sites (310–410 particles/kg). This clearly shows that MPs dominate the finer grain sizes and that the high amount of particles points to a sink of MPs in sediments. However, as only four samples were analysed in both sediment and water, a more detailed investigation with more samples is absolutely necessary for further studies.
The form also differed in the compartments: The water phase was dominated by larger MPs and fibres whereas more fragments and smaller MPs were present in the sediments. This is most probably due to a higher fragmentation in the sediments.
The most common polymers were PE and PP such as proven in many other studies. 5% of the potential MP particles were identified by means of FTIR and pyrolysis GC-MS. However, the misidentification rate, especially with the pyrolysis GC-MS, was quite high. This was most probably caused by single measurements especially of fibres and a too low concentration of polymers within these fibres. Thus, future studies should also include more measurements of the tentative MPs.
As the Lagos Lagoon is connected to the Gulf of Guinea, one part of the plastic will most probably be transported into the final sink the Atlantic Ocean. In the future, further studies will be needed to determine the exact concentrations, the increased sources of entry, and the possible effects of microplastics.
Author Contributions
O.M.O. and F.S. were responsible for research conception and design, O.M.O., S.G., and O.W. were involved in field collection of samples, and pre-analytical sample clean-up. N.S. and F.S. did further laboratory analysis. C.A. was involved in site determination and pre-collection site reconnaissance. All authors participated in paper preparation and proofreading. O.M.O. and F.S.: Conceptualization, Methodology, Writing—Original Draft, Supervision. O.M.O., S.G. and O.W.: field collection of samples, and pre-analytical sample clean-up. F.S. and N.S.: further laboratory analysis. C.A.: Site determination and pre-collection site reconnaissance. O.M.O., F.S. and N.S.: Data Curation, Formal Analysis, Writing—Review Editing. All authors have read and agreed to the published version of the manuscript.
Funding
This study was funded by the German Federal Ministry of Transport and Digital Infrastructure.
Acknowledgments
We thank Sonja M. Ehlers for ATR-FTIR and µFTIR measurements and Tim Lauschke for pyrolysis GC-MS measurements.
Conflicts of Interest
The authors declare no conflict of interest.
References
- Shim, W.J.; Thomposon, R.C. Microplastics in the Ocean. Arch. Environ. Contam. Toxicol. 2015, 69, 265–268. [Google Scholar] [CrossRef] [PubMed]
- Auta, H.; Emenike, C.U.; Fauziah, S. Distribution and importance of microplastics in the marine environment: A review of the sources, fate, effects, and potential solutions. Environ. Int. 2017, 102, 165–176. [Google Scholar] [CrossRef] [PubMed]
- PlasticsEurope. Plastics—The Facts 2019: An Analysis of European Plastics Production, Demand and Waste Data. Factsheet. 2019. Available online: https://www.plasticseurope.org/en/resources/publications/1804-plastics-facts-2019 (accessed on 26 November 2020).
- Giacovelli, C. Single-Use Plastics: A roadmap for Sustainability. In Technology for Environment; United Nations Environment Programme: Nairobi, Kenya, 2018. [Google Scholar]
- Carpenter, E.J.; Anderson, S.J.; Harvey, G.R.; Miklas, H.P.; Peck, B.B. Polystyrene Spherules in Coastal Waters. Science 1972, 178, 749–750. [Google Scholar] [CrossRef] [PubMed]
- Carpenter, E.J.; Smith, K.L. Plastics on the Sargasso Sea Surface. Science 1972, 175, 1240–1241. [Google Scholar] [CrossRef]
- Lambert, S.; Wagner, M. Microplastics Are Contaminants of Emerging Concern in Freshwater Environments: An Overview; Springer Science and Business Media LLC: Cham, Switzerland, 2018; pp. 1–23. [Google Scholar]
- Galgani, F.; Hanke, G.; Werner, S.; De Vrees, L. Marine litter within the European Marine Strategy Framework Directive. ICES J. Mar. Sci. 2013, 70, 1055–1064. [Google Scholar] [CrossRef]
- Braun, U.; Jekel, M.; Gerdts, G.; Ivleva, N.; Reiber, J. Microplastics Analytics Sampling, Preparation and Detection Methods. Discussion Paper within the scope of the research focus Plastics in the Environment Sources • Sinks • Solutions. Discussion paper. German Federal Ministry of Education and Research; 2018; p. 23. Available online: https://bmbf-plastik.de/sites/default/files/2018-12/Discussion%20Paper%20Mikroplastics%20Analytics%20Nov%202018.pdf (accessed on 26 November 2020).
- Thompson, R.C. Microplastics in the Marine Environment: Sources, Consequences and Solutions; Springer Science and Business Media LLC: Cham, Switzerland, 2015; pp. 185–200. [Google Scholar]
- Lebreton, L.; Van Der Zwet, J.; Damsteeg, J.-W.; Slat, B.; Andrady, A.; Reisser, J. River plastic emissions to the world’s oceans. Nat. Commun. 2017, 8, 15611. [Google Scholar] [CrossRef]
- Dubaish, F.; Liebezeit, G. Suspended Microplastics and Black Carbon Particles in the Jade System, Southern North Sea. Water Air Soil Pollut. 2013, 224, 1–8. [Google Scholar] [CrossRef]
- Yonkos, L.T.; Friedel, E.A.; Perez-Reyes, A.C.; Ghosal, S.; Arthur, C.D. Microplastics in Four Estuarine Rivers in the Chesapeake Bay, U.S.A. Environ. Sci. Technol. 2014, 48, 14195–14202. [Google Scholar] [CrossRef]
- Colmenero, A.I.; Barría, C.; Broglio, E.; García-Barcelona, S. Plastic debris straps on threatened blue shark Prionace glauca. Mar. Pollut. Bull. 2017, 115, 436–438. [Google Scholar] [CrossRef]
- Franco-Trecu, V.; Drago, M.; Katz, H.; Machín, E.; Marín, Y. With the noose around the neck: Marine debris entangling otariid species. Environ. Pollut. 2017, 220, 985–989. [Google Scholar] [CrossRef]
- Khan, F.R.; Mayoma, B.S.; Biginagwa, F.J.; Syberg, K. Microplastics in Inland African Waters: Presence, Sources, and Fate. In The Handbook of Environmental Chemistry; Springer: Cham, Switzerland, 2018; pp. 101–124. [Google Scholar]
- Migwi, F.K.; Ogunah, J.A.; Kiratu, J.M. Occurrence and Spatial Distribution of Microplastics in the Surface Waters of Lake Naivasha, Kenya. Environ. Toxicol. Chem. 2020, 39, 765–774. [Google Scholar] [CrossRef] [PubMed]
- Egessa, R.; Nankabirwa, A.; Basooma, R.; Nabwire, R. Occurrence, distribution and size relationships of plastic debris along shores and sediment of northern Lake Victoria. Environ. Pollut. 2020, 257, 113442. [Google Scholar] [CrossRef] [PubMed]
- Merga, L.B.; Redondo-Hasselerharm, P.E.; Brink, P.J.V.D.; Koelmans, A.A. Distribution of microplastic and small macroplastic particles across four fish species and sediment in an African lake. Sci. Total. Environ. 2020, 741, 140527. [Google Scholar] [CrossRef] [PubMed]
- Toumi, H.; Abidli, S.; Bejaoui, M. Microplastics in freshwater environment: The first evaluation in sediments from seven water streams surrounding the lagoon of Bizerte (Northern Tunisia). Environ. Sci. Pollut. Res. 2019, 26, 14673–14682. [Google Scholar] [CrossRef]
- Akindele, E.O.; Ehlers, S.M.; Koop, J.H.E. Freshwater insects of different feeding guilds ingest microplastics in two Gulf of Guinea tributaries in Nigeria. Environ. Sci. Pollut. Res. 2020, 27, 33373–33379. [Google Scholar] [CrossRef]
- Khan, F.R.; Shashoua, Y.; Crawford, A.; Drury, A.; Sheppard, K.; Stewart, K.; Sculthorp, T. ‘The Plastic Nile’: First Evidence of Microplastic Contamination in Fish from the Nile River (Cairo, Egypt). Toxics 2020, 8, 22. [Google Scholar] [CrossRef]
- Adika, S.A.; Mahu, E.; Crane, R.; Marchant, R.; Montford, J.; Folorunsho, R.; Gordon, C. Microplastic ingestion by pelagic and demersal fish species from the Eastern Central Atlantic Ocean, off the Coast of Ghana. Mar. Pollut. Bull. 2020, 153, 110998. [Google Scholar] [CrossRef]
- Biginagwa, F.J.; Mayoma, B.S.; Shashoua, Y.; Syberg, K.; Khan, F.R. First evidence of microplastics in the African Great Lakes: Recovery from Lake Victoria Nile perch and Nile tilapia. J. Great Lakes Res. 2016, 42, 146–149. [Google Scholar] [CrossRef]
- Olarinmoye, O.M.; Ugwumba, O.A.; Awe, F.O. The Nigerian Environment. In The Political Ecology of Oil and Gas Activities in the Nigerian Aquatic Ecosystem; Ndimele, P.E., Ed.; Elsevier BV: Amsterdam, The Netherlands, 2018; pp. 3–15. [Google Scholar]
- Ojowuro, O.M.; Olowe, B.; Aremu, A.S. Characterization of Municipal Solid Wastes from Lagos Metropolis, Nigeria. In Waste Management and Resource Efficiency; Springer Science and Business Media LLC: Singapore, 2018; pp. 159–166. [Google Scholar]
- United Nations; D.o.E.a.S.A. Population Division. The World’s Cities in 2018—Data Booklet (ST/ESA/SER.A/417). Available online: https://www.un.org/en/events/citiesday/assets/pdf/the_worlds_cities_in_2018_data_booklet.pdf (accessed on 15 January 2020).
- Lagos State Bureau of Statistics. LBS. Digest of statistics. 2017. Available online: http://lagosstate.gov.ng/Digest_of_Statistics_2017.pdf (accessed on 26 November 2020).
- Hoornweg, D.; Pope, K. Population predictions for the world’s largest cities in the 21st century. Environ. Urban 2016, 29, 195–216. [Google Scholar] [CrossRef]
- Badejo, O.T.; Olaleye, J.B.; Alademomi, A.S. Tidal Characteristics and Sounding Datum Variation in Lagos State. Int. J. Innov. Res. Stud. 2014, 3, 433–457. [Google Scholar]
- Mazen, M. 2013. Available online: https://www.bloomberg.com/news/articles/2013-08-11/lagos-demolishes-homes-as-9-000-forcibly-evicted-amnesty (accessed on 30 March 2020).
- Scherer, C.; Weber, A.; Stock, F.; Vurusic, S.; Egerci, H.; Kochleus, C.; Arendt, N.; Foeldi, C.; Dierkes, G.; Wagner, M.; et al. Comparative assessment of microplastics in water and sediment of a large European river. Sci. Total Environ. 2020, 738, 139866. [Google Scholar] [CrossRef] [PubMed]
- Pojar, I.; Kochleus, C.; Dierkes, G.; Ehlers, S.M.; Reifferscheid, G.; Stock, F. Quantitative and qualitative evaluation of plastic particles in surface waters of the Western Black Sea. Environ. Pollut. 2020, 115724. [Google Scholar] [CrossRef] [PubMed]
- Norén, F. Small Plastic Particles in Coastal Swedish Waters. KIMO Report; KIMO Sweden. 2007. Available online: https://www.n-research.se/pdf/Small%20plastic%20particles%20in%20Swedish%20West%20Coast%20Waters.pdf (accessed on 26 November 2020).
- Löder, M.G.J.; Kuczera, M.; Mintenig, S.; Lorenz, C.; Gerdts, G. Focal plane array detector-based micro-Fourier-transform infrared imaging for the analysis of microplastics in environmental samples. Environ. Chem. 2015, 12, 563. [Google Scholar] [CrossRef]
- Bergmann, M.; Wirzberger, V.; Krumpen, T.; Lorenz, C.; Primpke, S.; Tekman, M.B.; Gerdts, G. High Quantities of Microplastic in Arctic Deep-Sea Sediments from the HAUSGARTEN Observatory. Environ. Sci. Technol. 2017, 51, 11000–11010. [Google Scholar] [CrossRef] [PubMed]
- Cabernard, L.; Roscher, L.; Lorenz, C.; Gerdts, G.; Primpke, S. Comparison of Raman and Fourier Transform Infrared Spectroscopy for the Quantification of Microplastics in the Aquatic Environment. Environ. Sci. Technol. 2018, 52, 13279–13288. [Google Scholar] [CrossRef]
- Dierkes, G.; Lauschke, T.; Becher, S.; Schumacher, H.; Földi, C.; Ternes, T.A. Quantification of microplastics in environmental samples via pressurized liquid extraction and pyrolysis-gas chromatography. Anal. Bioanal. Chem. 2019, 411, 6959–6968. [Google Scholar] [CrossRef]
- Blott, S.J.; Pye, K. GRADISTAT: A grain size distribution and statistics package for the analysis of unconsolidated sediments. Earth Surf. Process. Landf. 2001, 26, 1237–1248. [Google Scholar] [CrossRef]
- Isobe, A.; Uchiyama-Matsumoto, K.; Uchida, K.; Tokai, T. Microplastics in the Southern Ocean. Mar. Pollut. Bull. 2017, 114, 623–626. [Google Scholar] [CrossRef]
- Suaria, G.; Perold, V.; Lee, J.R.; Lebouard, F.; Aliani, S.; Ryan, P.G. Floating macro- and microplastics around the Southern Ocean: Results from the Antarctic Circumnavigation Expedition. Environ. Int. 2020, 136, 105494. [Google Scholar] [CrossRef]
- Jambeck, J.R.; Geyer, R.; Wilcox, C.; Siegler, T.R.; Perryman, M.; Andrady, A.; Narayan, R.; Law, K.L. Plastic waste inputs from land into the ocean. Science 2015, 347, 768–771. [Google Scholar] [CrossRef]
- Lechner, A.; Keckeis, H.; Lumesberger-Loisl, F.; Zens, B.; Krusch, R.; Tritthart, M.; Glas, M.; Schludermann, E. The Danube so colourful: A potpourri of plastic litter outnumbers fish larvae in Europe’s second largest river. Environ. Pollut. 2014, 188, 177–181. [Google Scholar] [CrossRef] [PubMed]
- Thiel, M.; Luna-Jorquera, G.; Álvarez-Varas, R.; Gallardo, C.; Hinojosa, I.A.; Luna, N.; Miranda-Urbina, D.; Morales, N.; Ory, N.; Pacheco, A.S.; et al. Impacts of Marine Plastic Pollution from Continental Coasts to Subtropical Gyres—Fish, Seabirds, and Other Vertebrates in the SE Pacific. Front. Mar. Sci. 2018, 5, 238. [Google Scholar] [CrossRef]
- Cózar, A.; Echevarría, F.; González-Gordillo, J.I.; Irigoien, X.; Úbeda, B.; Hernández-León, S.; Palma, Á.T.; Navarro, S.; García-De-Lomas, J.; Ruiz, A.; et al. Plastic debris in the open ocean. Proc. Natl. Acad. Sci. USA 2014, 111, 10239–10244. [Google Scholar] [CrossRef] [PubMed]
- Singh, B.; Sharma, N. Mechanistic implications of plastic degradation. Polym. Degrad. Stab. 2008, 93, 561–584. [Google Scholar] [CrossRef]
- Khan, F.R.; Mayoma, B.S.; Biginagwa, F.J.; Syberg, K. Microplastics in Inland African Waters: Presences, Sources and Fate, in the Handbook of Environmental Chemistry: Freshwater Microplastics: Emerging Environmental Contaminants; M. Wagner, M., Lambert, S., Eds.; Springer: Cham, Switzerland, 2018; pp. 107–129. [Google Scholar]
- Lusher, A.; Hollman, P.; Mendoza-Hill, J. Microplastics in Fisheries and Aquaculture, in FAO Fisheries and Aquaculture Technical Papers; Food and Agricultural Organization of the United Nations: Rome, Italy, 2017. [Google Scholar]
- Spur, B. Nigeria Plastic Production Q4. 2017. Available online: https://brandspurng.com/2017/11/07/nigeria-plastic-production-q4-2017/ (accessed on 12 July 2020).
- Shiru, M.S.; Shahid, S.; Shiru, M.S.; Chung, E.S.; Alias, N.; Ahmed, K.; Dioha, E.C.; Sa’Adi, Z.; Salman, S.; Noor, M.; et al. Challenges in water resources of Lagos mega city of Nigeria in the context of climate change. J. Water Clim. Chang. 2019. [Google Scholar] [CrossRef]
- Rossi, L.; Costantini, M.L.; Carlino, P.; Di Lascio, A.; Rossi, D. Autochthonous and allochthonous plant contributions to coastal benthic detritus deposits: A dual-stable isotope study in a volcanic lake. Aquat. Sci. 2010, 72, 227–236. [Google Scholar] [CrossRef]
- Meyers, P.A.; Teranes, J.L. Sediment Organic Matter in Tracking Environmental Change Using Lake Sediments Volume 2: Physical and Geochemical Methods; Kluwer Academic Publishers: Dordrecht, The Netherlands, 2002. [Google Scholar]
- Nizzetto, L.; Bussi, G.; Futter, M.; Butterfield, D.; Whitehead, P.G. A theoretical assessment of microplastic transport in river catchments and their retention by soils and river sediments. Environ. Sci. Process. Impacts 2016, 18, 1050–1059. [Google Scholar] [CrossRef]
- Frère, L.; Paul-Pont, I.; Rinnert, E.; Petton, S.; Jaffré, J.; Bihannic, I.; Soudant, P.; Lambert, C.; Huvet, A. Influence of environmental and anthropogenic factors on the composition, concentration and spatial distribution of microplastics: A case study of the Bay of Brest (Brittany, France). Environ. Pollut. 2017, 225, 211–222. [Google Scholar] [CrossRef]
- Tata, T.; Belabed, B.E.; Bououdina, M.; Bellucci, S. Occurrence and characterization of surface sediment microplastics and litter from North African coasts of Mediterranean Sea: Preliminary research and first evidence. Sci. Total. Environ. 2020, 713, 136664. [Google Scholar] [CrossRef]
- Iwugo, K.; Arcy, B.; Andoh, R. Aspects of land-based pollution of an African coastal megacity of Lagos. In Diffuse Pollution Conference; Dublin, Ireland, 2003. Available online: https://www.ucd.ie/dipcon/docs/theme14/theme14_32.PDF (accessed on 26 November 2020).
- Tibbetts, J.; Krause, S.; Lynch, I.; Smith, G.H.S. Abundance, Distribution, and Drivers of Microplastic Contamination in Urban River Environments. Water 2018, 10, 1597. [Google Scholar] [CrossRef]
- Dris, R.; Gasperi, J.; Rocher, V.; Saad, M.; Renault, N.; Tassin, B. Microplastic contamination in an urban area: A case study in Greater Paris. Environ. Chem. 2015, 12, 592–599. [Google Scholar] [CrossRef]
- Vaughan, R.; Turner, S.D.; Rose, N.L. Microplastics in the sediments of a UK urban lake. Environ. Pollut. 2017, 229, 10–18. [Google Scholar] [CrossRef] [PubMed]
- Li, C.; Busquets, R.; Campos, L. Assessment of microplastics in freshwater systems: A review. Sci. Total. Environ. 2020, 707, 135578. [Google Scholar] [CrossRef] [PubMed]
- Vermaire, J.C.; Pomeroy, C.; Herczegh, S.M.; Haggart, O.; Murphy, M. Microplastic abundance and distribution in the open water and sediment of the Ottawa River, Canada, and its tributaries. Facets 2017, 2, 301–314. [Google Scholar] [CrossRef]
- Bagaev, A.; Mizyuk, A.; Khatmullina, L.; Isachenko, I.; Chubarenko, I. Anthropogenic fibres in the Baltic Sea water column: Field data, laboratory and numerical testing of their motion. Sci. Total. Environ. 2017, 599–600, 560–571. [Google Scholar] [CrossRef]
- Chubarenko, I.; Bagaev, A.; Zobkov, M.; Esiukova, E. On some physical and dynamical properties of microplastic particles in marine environment. Mar. Pollut. Bull. 2016, 108, 105–112. [Google Scholar] [CrossRef]
- Corcoran, P.L. Benthic plastic debris in marine and fresh water environments. Environ. Sci. Process. Impacts 2015, 17, 1363–1369. [Google Scholar] [CrossRef]
- Morét-Ferguson, S.; Law, K.L.; Proskurowski, G.; Murphy, E.K.; Peacock, E.E.; Reddy, C.M. The size, mass, and composition of plastic debris in the western North Atlantic Ocean. Mar. Pollut. Bull. 2010, 60, 1873–1878. [Google Scholar] [CrossRef]
- Wang, W.; Ndungu, A.W.; Li, Z.; Wang, J. Microplastics pollution in inland freshwaters of China: A case study in urban surface waters of Wuhan, China. Sci. Total. Environ. 2017, 575, 1369–1374. [Google Scholar] [CrossRef]
- Wang, Z.; Su, B.; Xu, X.; Di, D.; Huang, H.; Mei, K.; Dahlgren, R.A.; Zhang, M.; Shang, X. Preferential accumulation of small (<300 μm) microplastics in the sediments of a coastal plain river network in eastern China. Water Res. 2018, 144, 393–401. [Google Scholar] [CrossRef]
- Klein, S.; Worch, E.; Knepper, T.P. Occurrence and Spatial Distribution of Microplastics in River Shore Sediments of the Rhine-Main Area in Germany. Environ. Sci. Technol. 2015, 49, 6070–6076. [Google Scholar] [CrossRef] [PubMed]
- Horton, A.A.; Walton, A.; Spurgeon, D.J.; Lahive, E.; Svendsen, C. Microplastics in freshwater and terrestrial environments: Evaluating the current understanding to identify the knowledge gaps and future research priorities. Sci. Total. Environ. 2017, 586, 127–141. [Google Scholar] [CrossRef] [PubMed]
- Zhu, L.; Bai, H.; Chen, B.; Sun, X.; Qu, K.; Xia, B. Microplastic pollution in North Yellow Sea, China: Observations on occurrence, distribution and identification. Sci. Total Environ. 2018, 636, 20–29. [Google Scholar] [CrossRef]
- Koelmans, A.A.; Nor, N.H.M.; Hermsen, E.; Kooi, M.; Mintenig, S.M.; De France, J. Microplastics in freshwaters and drinking water: Critical review and assessment of data quality. Water Res. 2019, 155, 410–422. [Google Scholar] [CrossRef]
- Idiata, D.J.; Agbale, N.R.; Iguisi, K. Menace of Sachet Water Waste in Benin City, Nigeria. J. Sci. Res. 2013, 2, 26–29. [Google Scholar]
- Sylvester, O.; Abraham, I.O.; Osaru, O.-O.F. Externality Effects of Sachet and Plastic Bottled Water Consumption on the Environment: Evidence from Benin City and Okada in Nigeria. Int. J. Sustain. Dev. World Policy 2020, 9, 1–9. [Google Scholar] [CrossRef]
- Akindele, E.O.; Ehlers, S.M.; Koop, J.H. First empirical study of freshwater microplastics in West Africa using gastropods from Nigeria as bioindicators. Limnologica 2019, 78, 125708. [Google Scholar] [CrossRef]
- Ilechukwu, I.; Ndukwe, G.I.; Mgbemena, N.M.; Akandu, A.U. Occurrence of Microplastics in Surface Sediments of Beaches in Lagos, Nigeria. Eur. Chem. Bull. 2019, 8, 371–375. [Google Scholar] [CrossRef]
- Martellini, T.; Guerranti, C.; Scopetani, C.; Ugolini, A.; Chelazzi, D.; Cincinelli, A. A snapshot of microplastics in the coastal areas of the Mediterranean Sea. TrAC Trends Anal. Chem. 2018, 109, 173–179. [Google Scholar] [CrossRef]
- Abidli, S.; Toumi, H.; Lahbib, Y.; El Menif, N.T. The First Evaluation of Microplastics in Sediments from the Complex Lagoon-Channel of Bizerte (Northern Tunisia). Water Air Soil Pollut. 2017, 228, 262. [Google Scholar] [CrossRef]
- Vianello, A.; Boldrin, A.; Guerriero, P.; Moschino, V.; Rella, R.; Sturaro, A.; Da Ros, L. Microplastic particles in sediments of Lagoon of Venice, Italy: First observations on occurrence, spatial patterns and identification. Estuarine Coast. Shelf Sci. 2013, 130, 54–61. [Google Scholar] [CrossRef]
- Lahens, L.; Strady, E.; Kieu-Le, T.-C.; Dris, R.; Boukerma, K.; Rinnert, E.; Gasperi, J.; Tassin, B. Macroplastic and microplastic contamination assessment of a tropical river (Saigon River, Vietnam) transversed by a developing megacity. Environ. Pollut. 2018, 236, 661–671. [Google Scholar] [CrossRef] [PubMed]
Publisher’s Note: MDPI stays neutral with regard to jurisdictional claims in published maps and institutional affiliations. |
© 2020 by the authors. Licensee MDPI, Basel, Switzerland. This article is an open access article distributed under the terms and conditions of the Creative Commons Attribution (CC BY) license (http://creativecommons.org/licenses/by/4.0/).