Understanding the Relationship between Large-Scale Fold Structures and Small-Scale Fracture Patterns: A Case Study from the Oman Mountains


Abstract
1. Introduction
2. Geological Setting
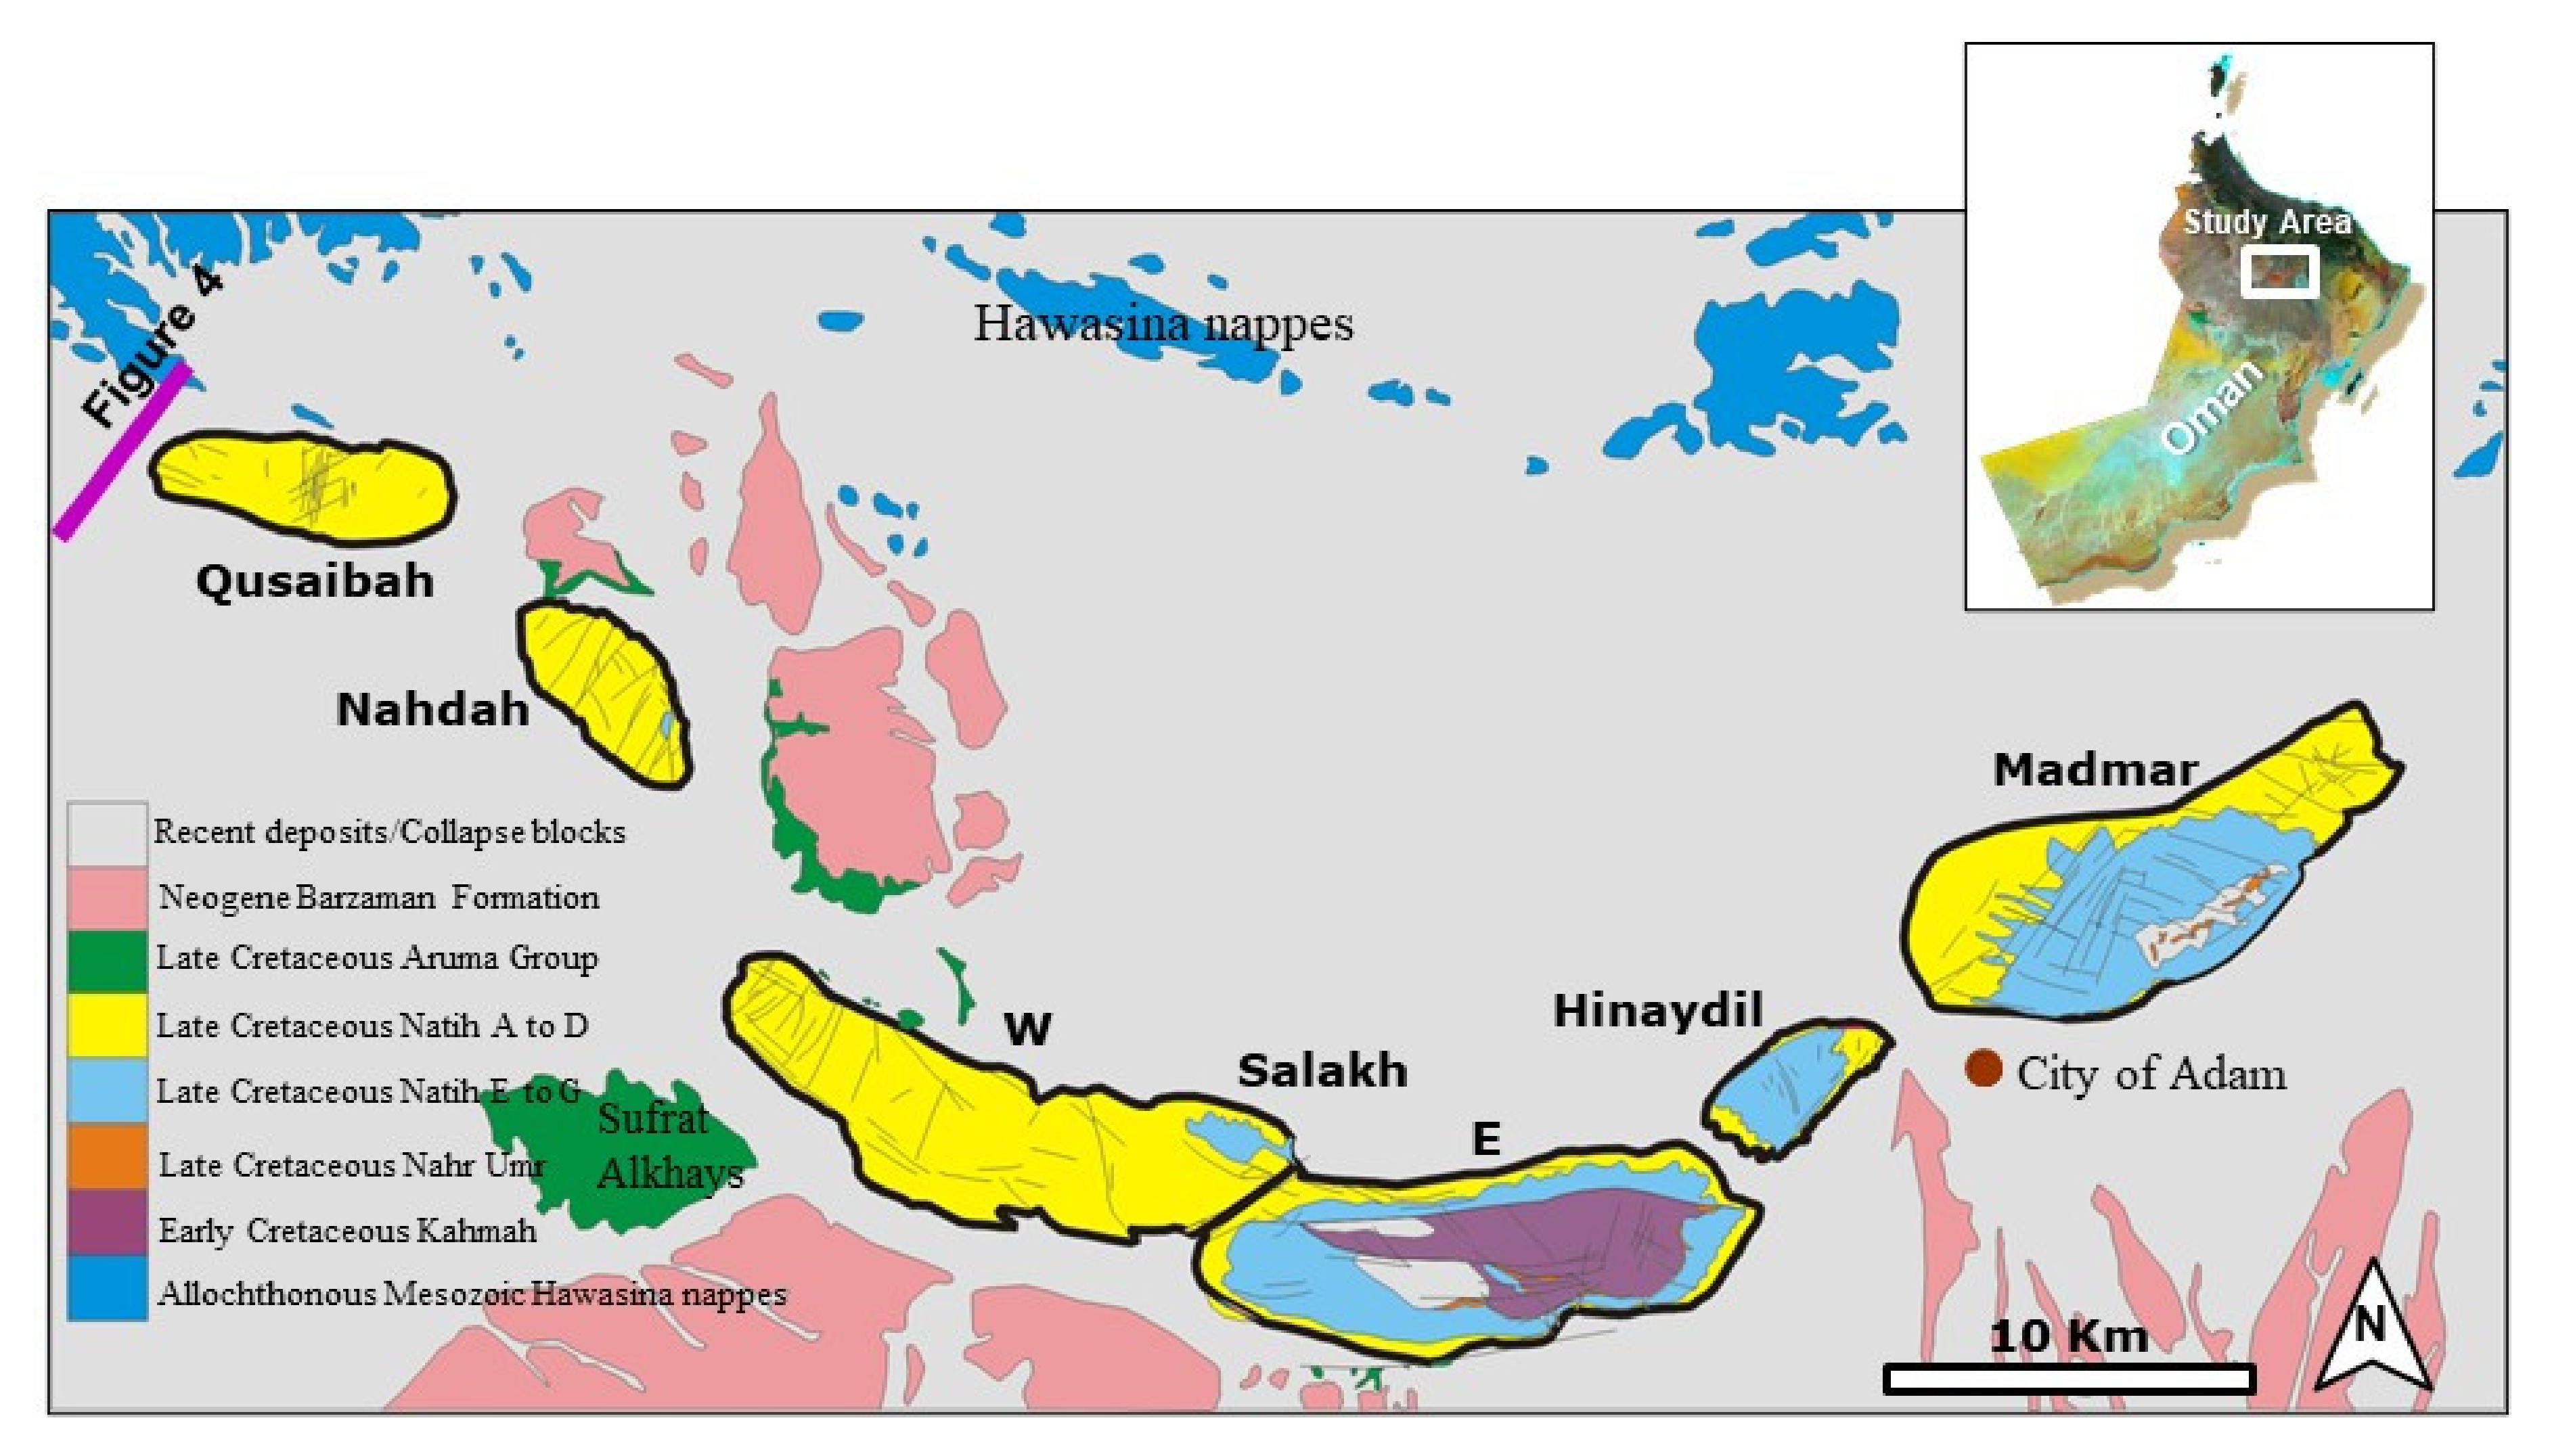
2.1. Study Area
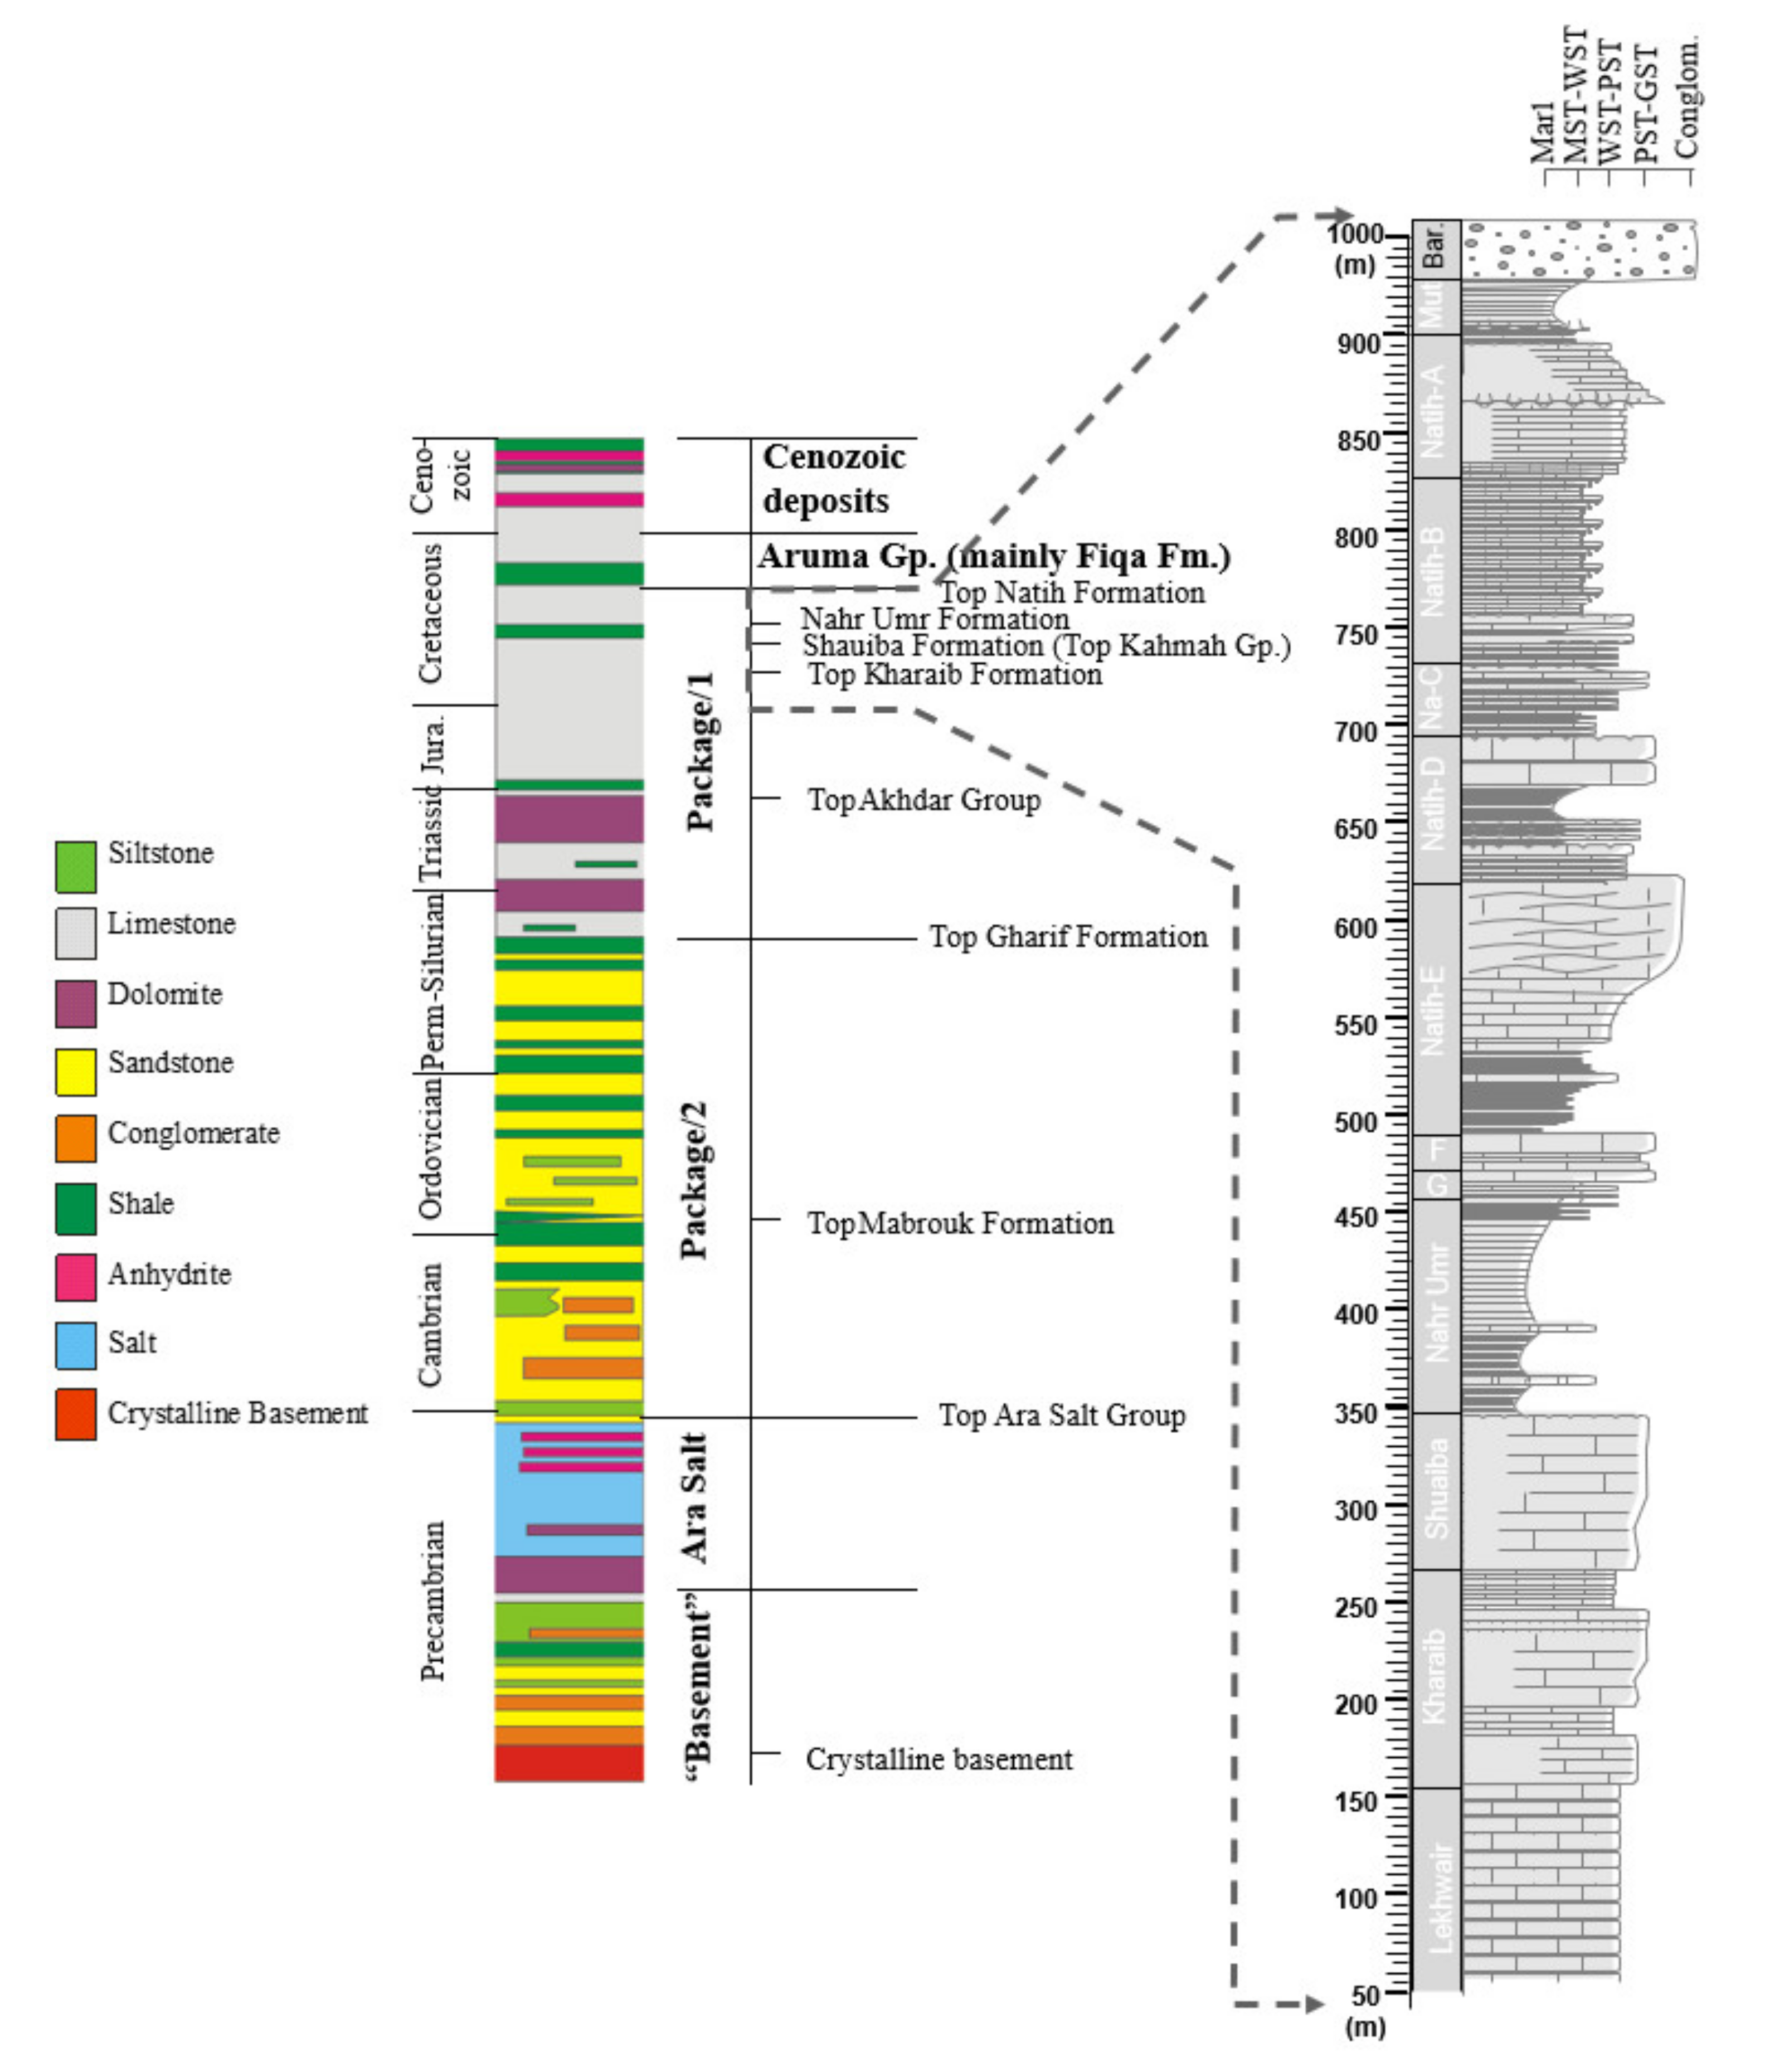
2.2. Stratigraphy of the Area
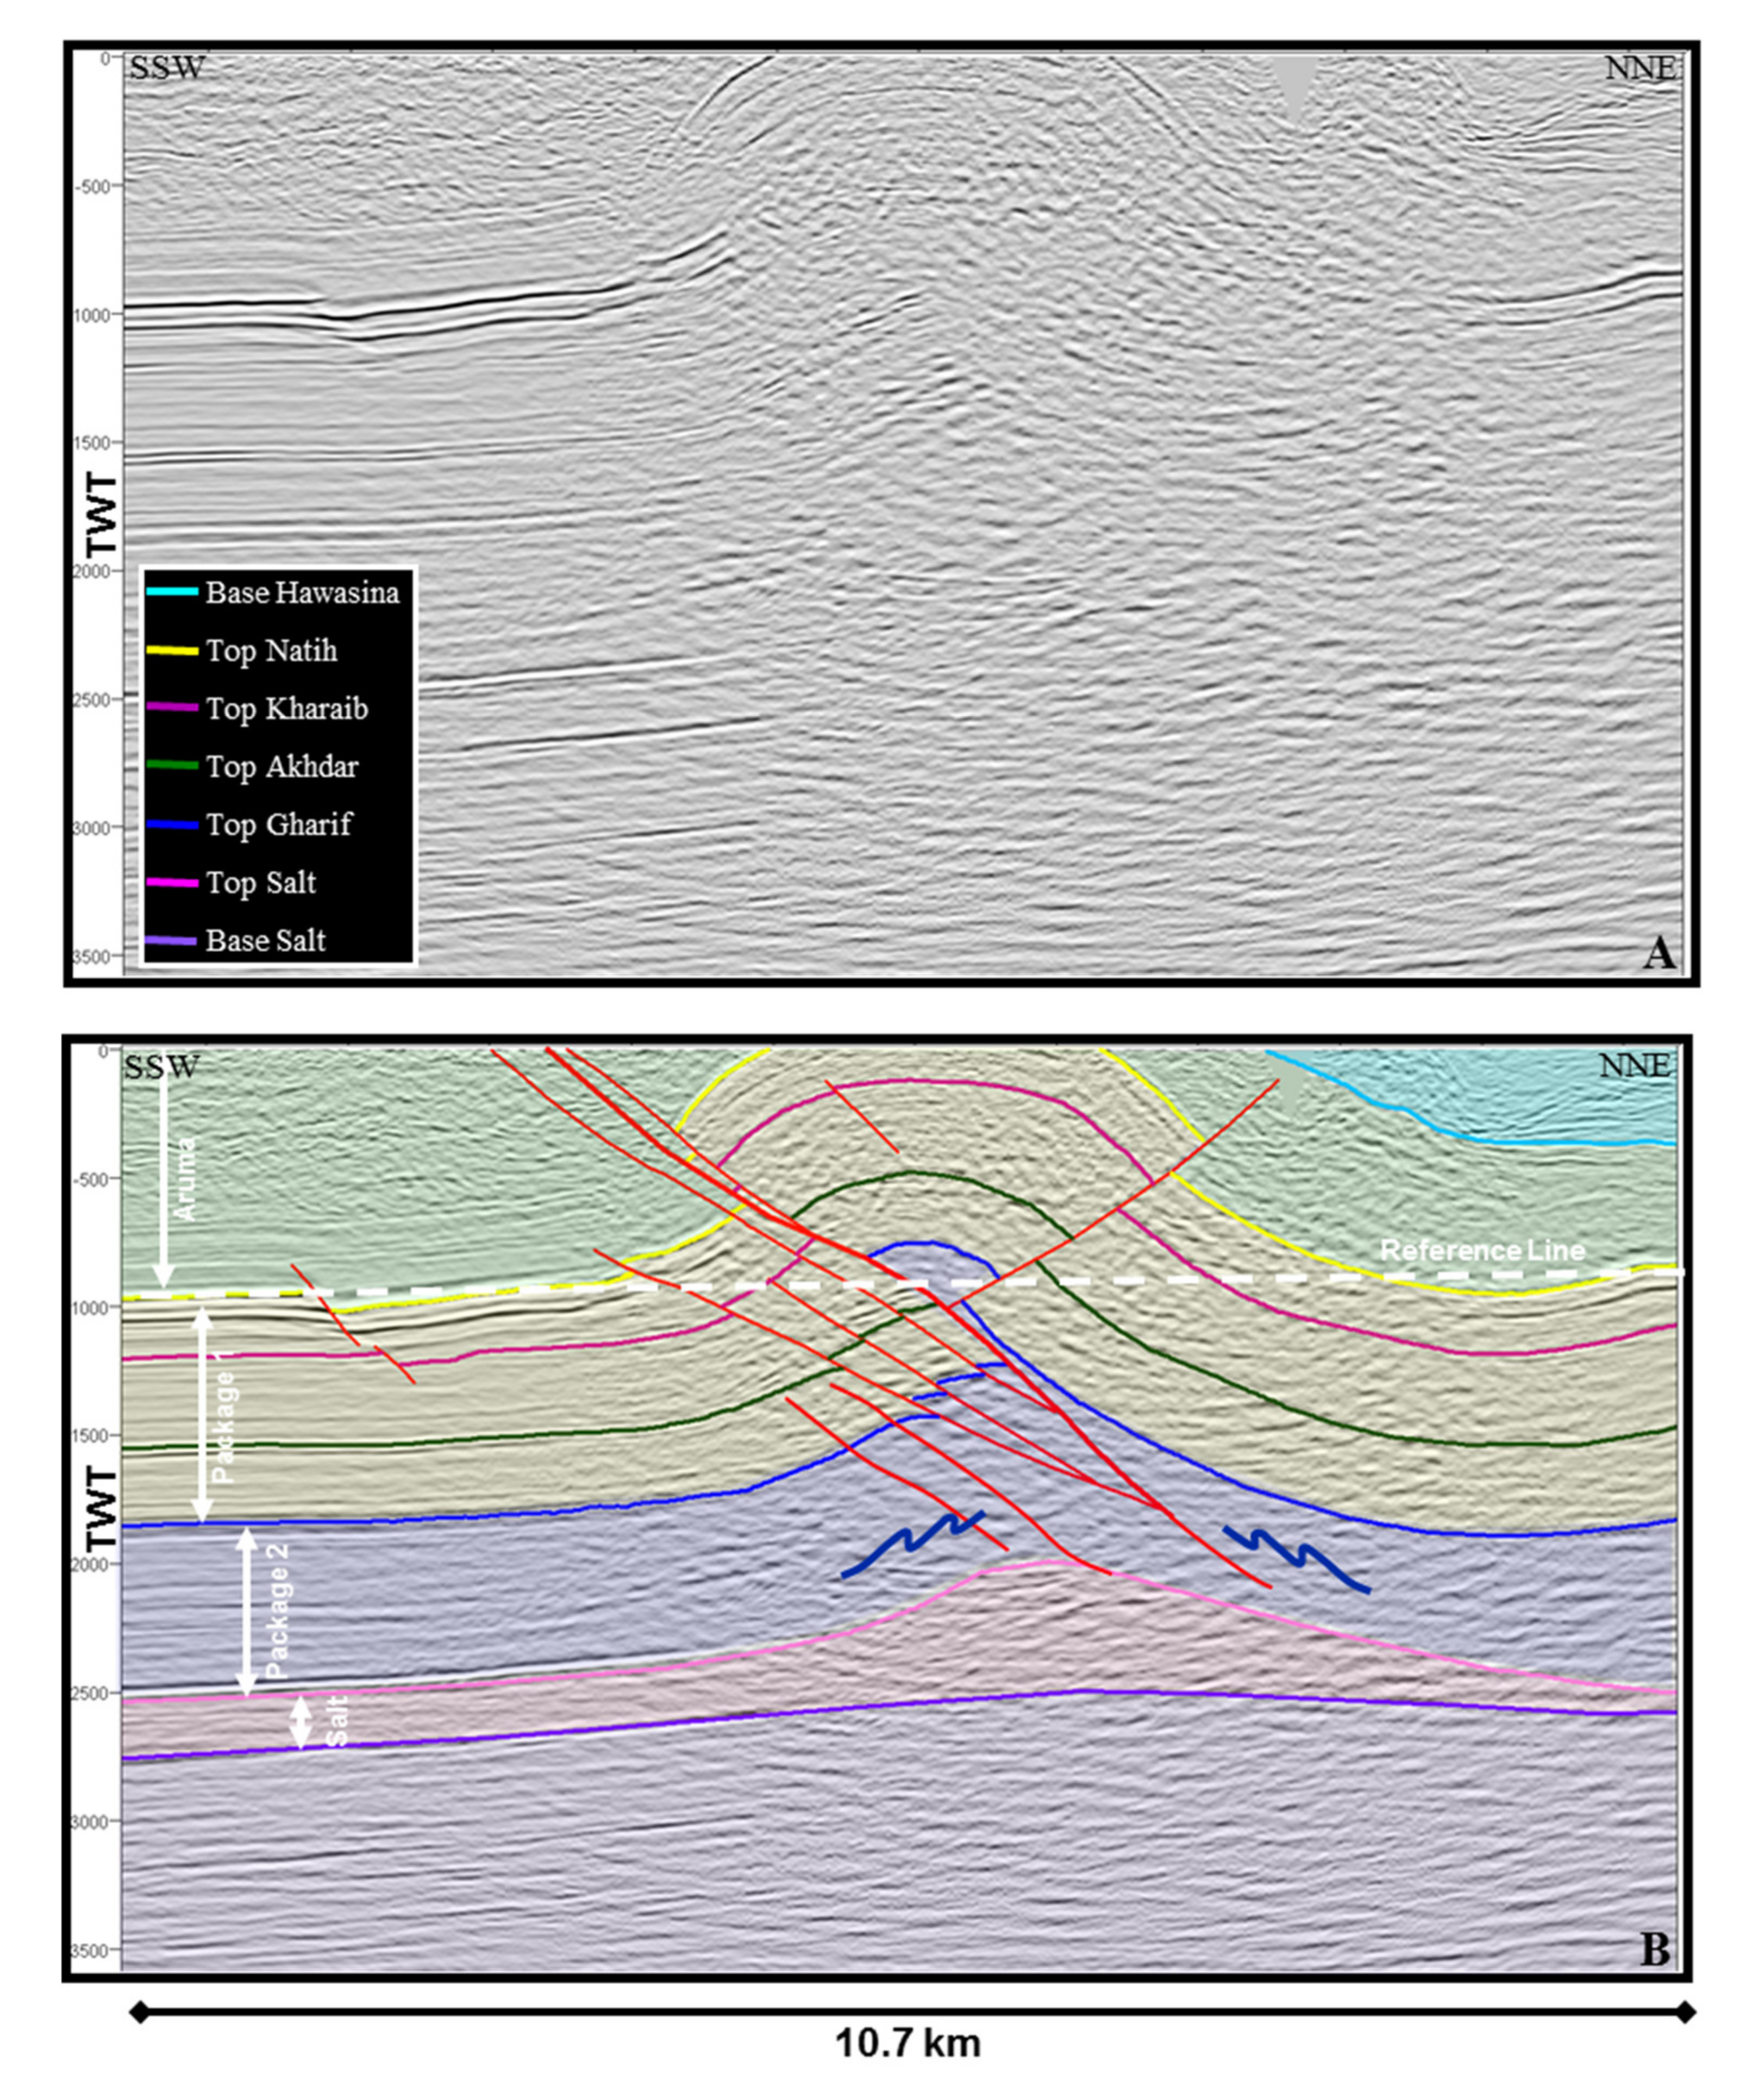
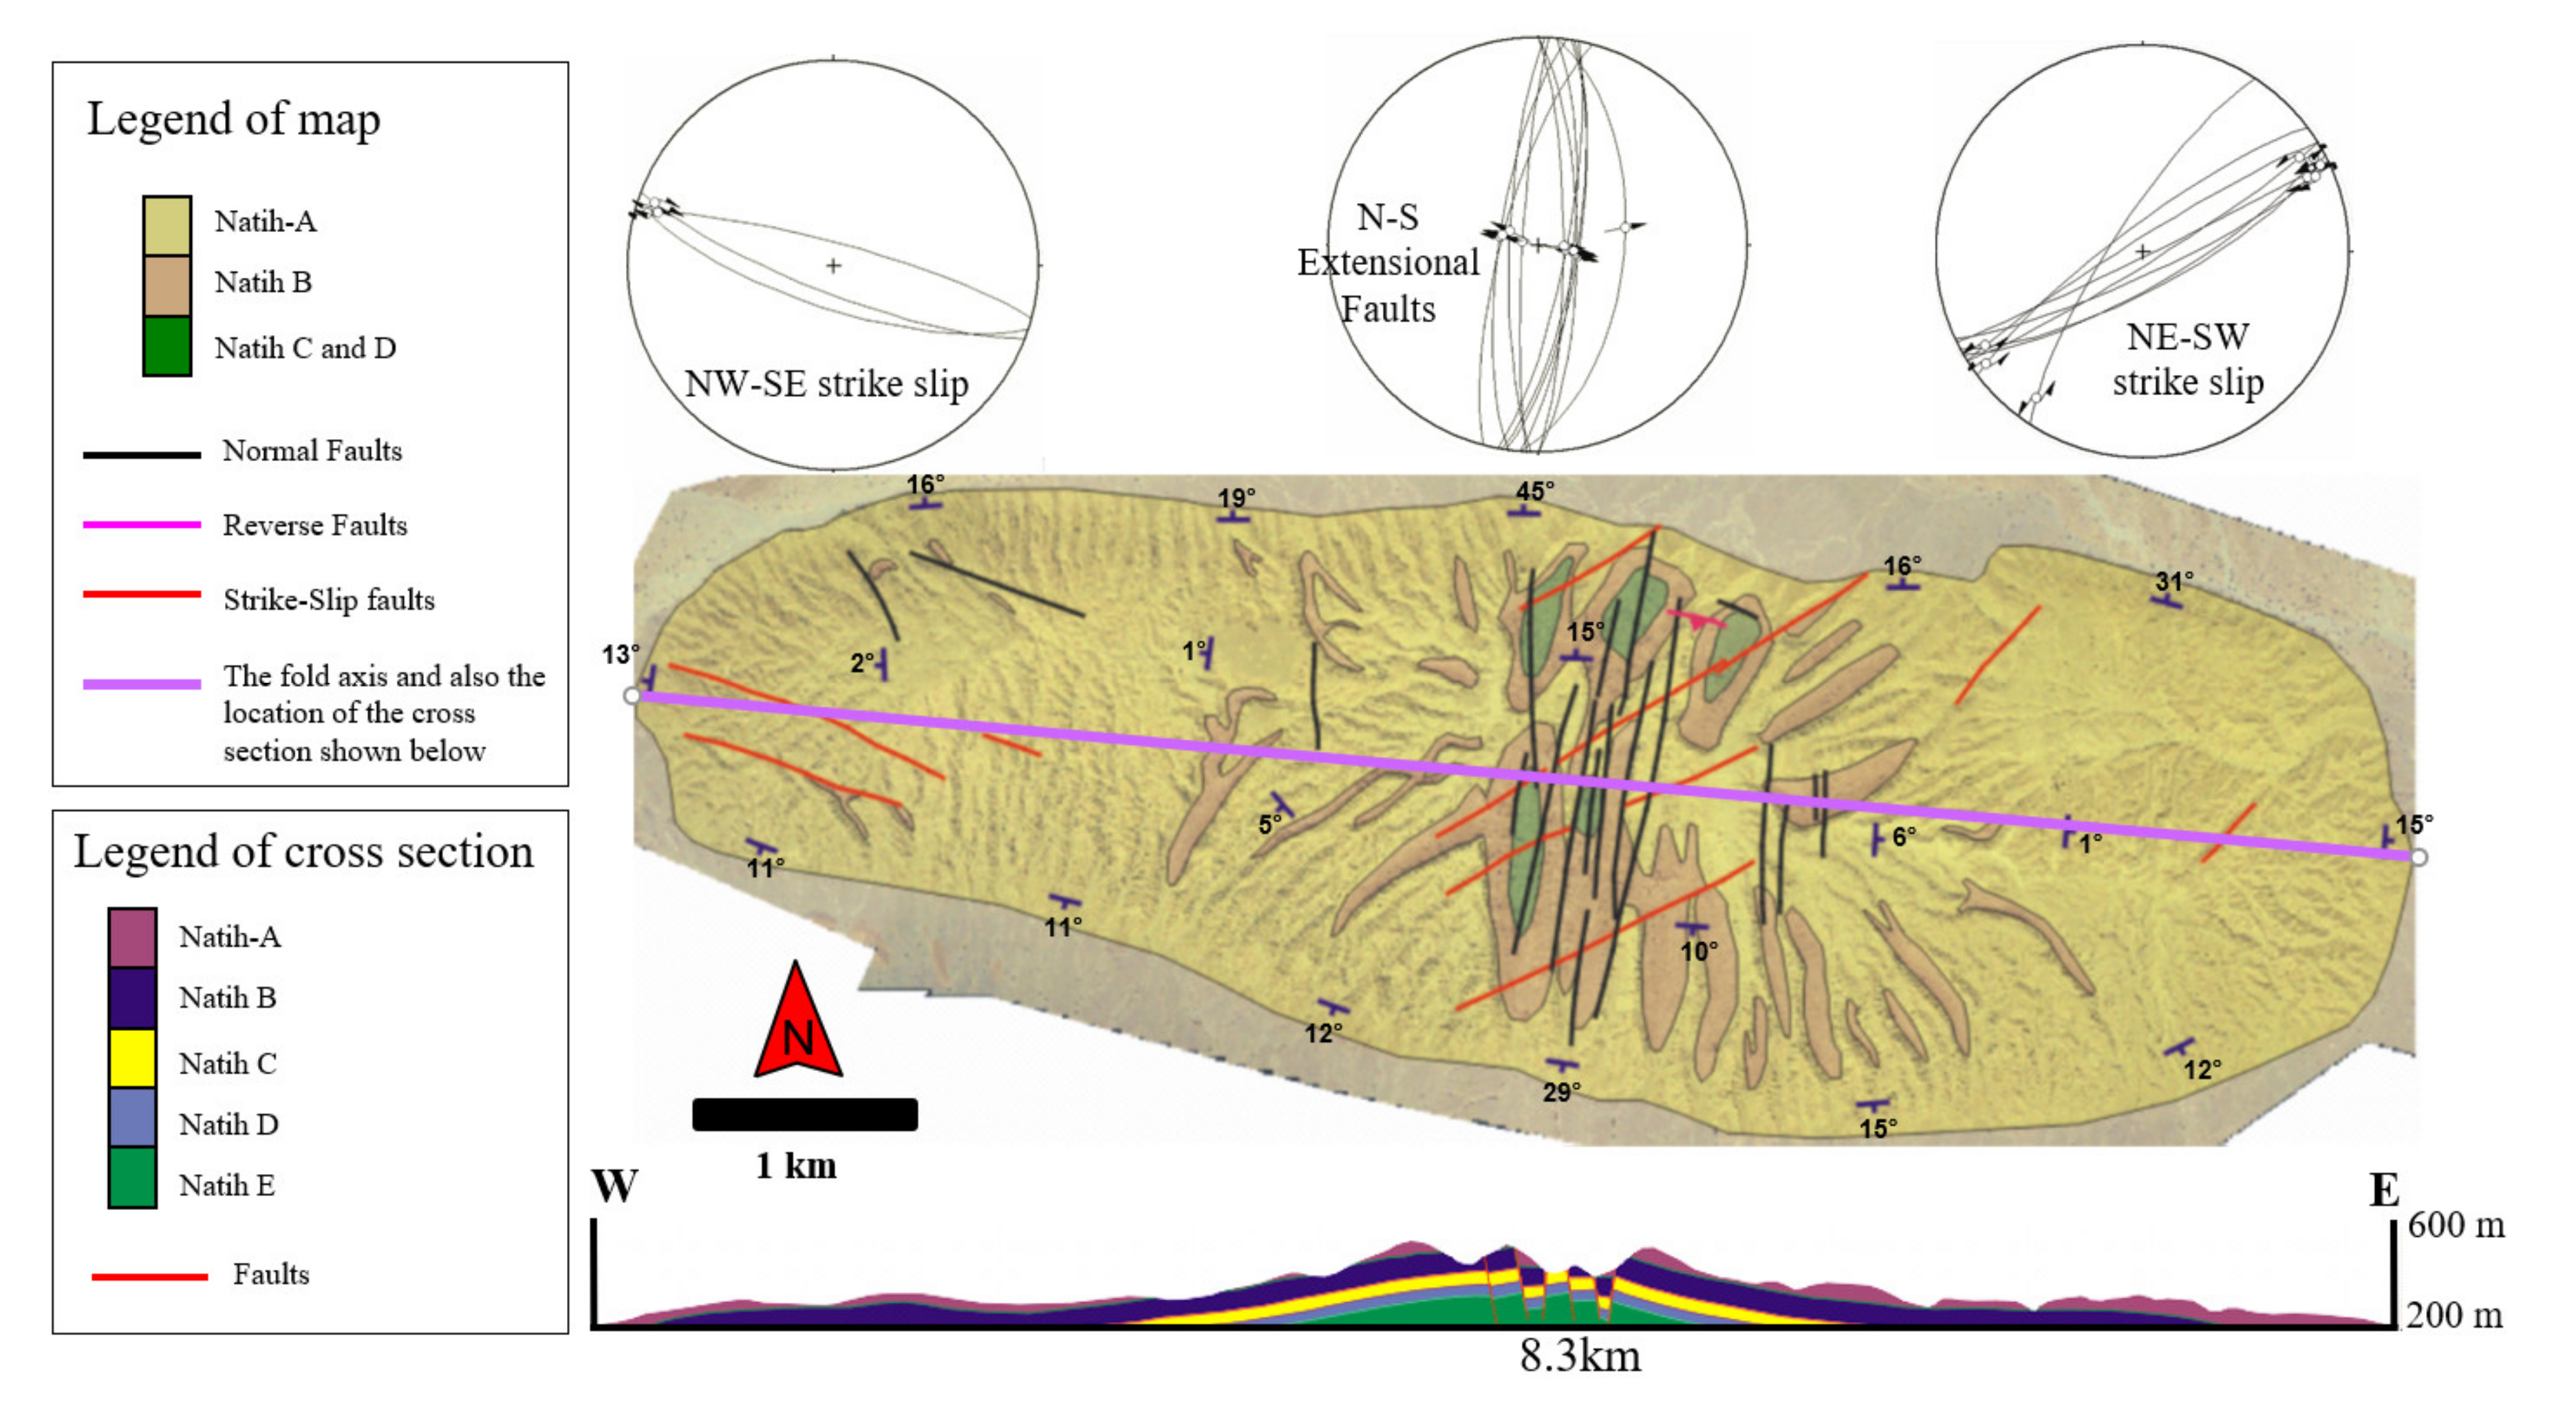
2.3. Structural Style of the Salakh Arch
3. Methodology
3.1. Fracture Field Mapping
3.2. Building 3D Model for Jebel Qusaibah
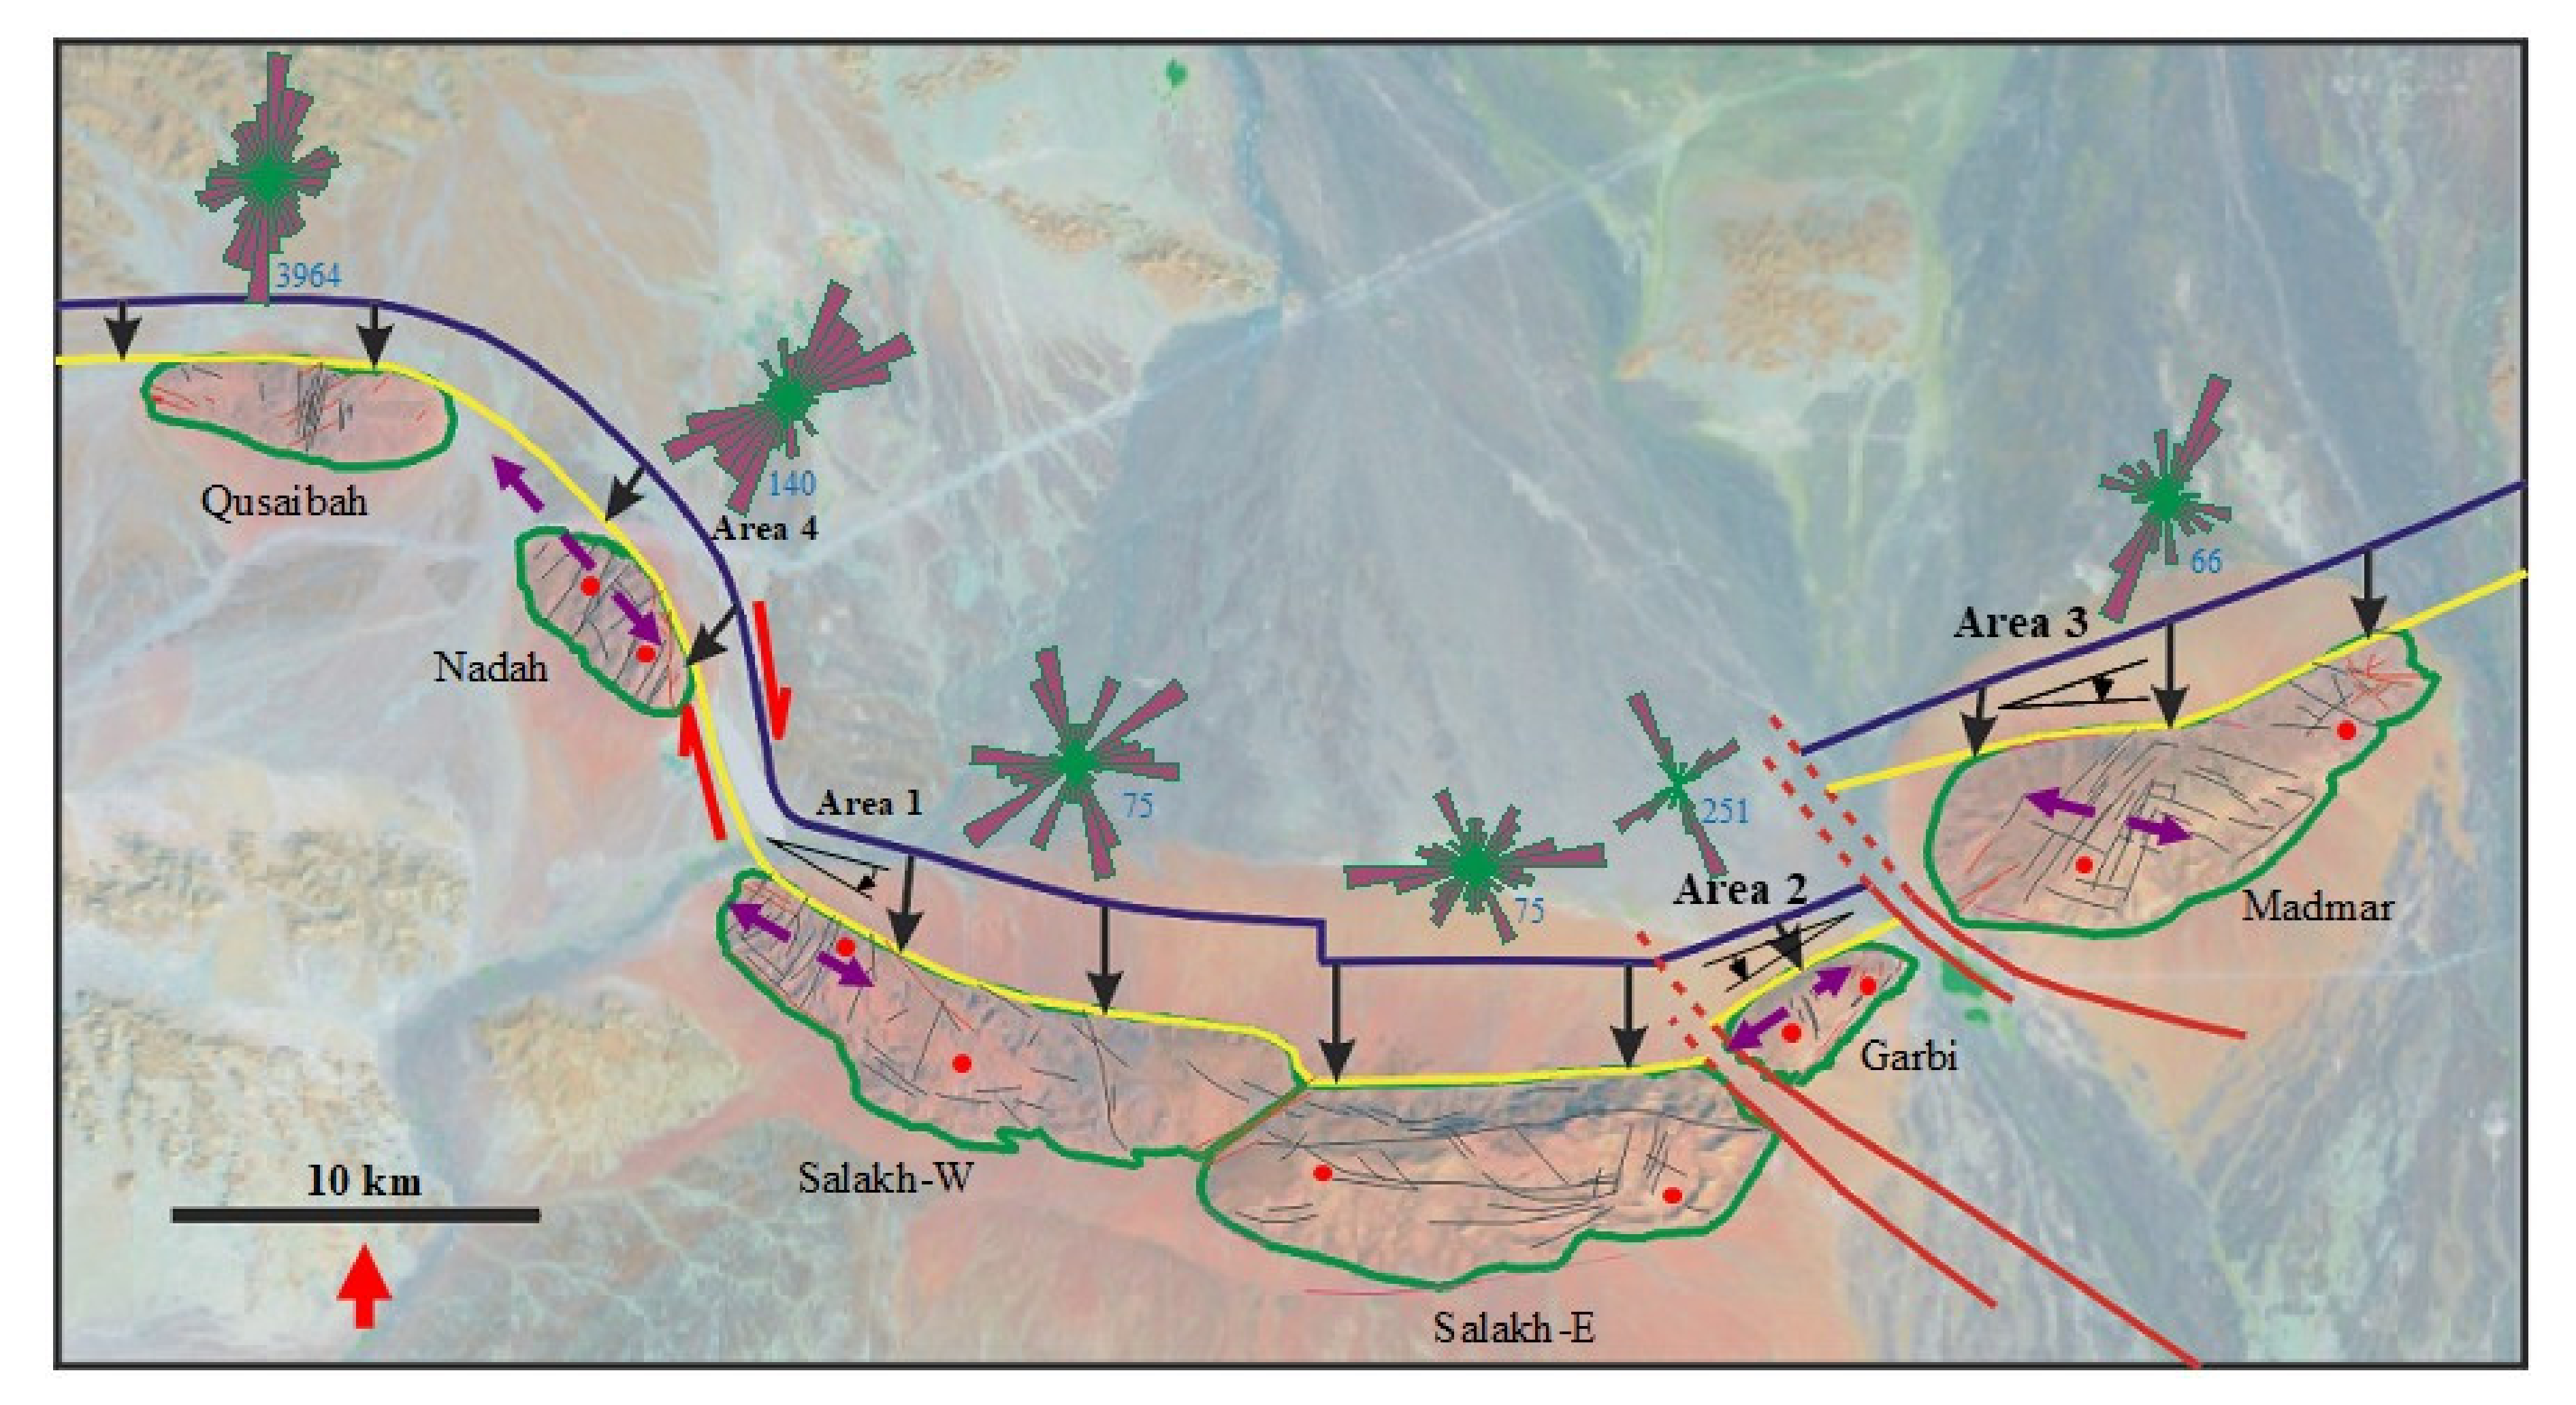
4. Results of Surface Fracture Mapping
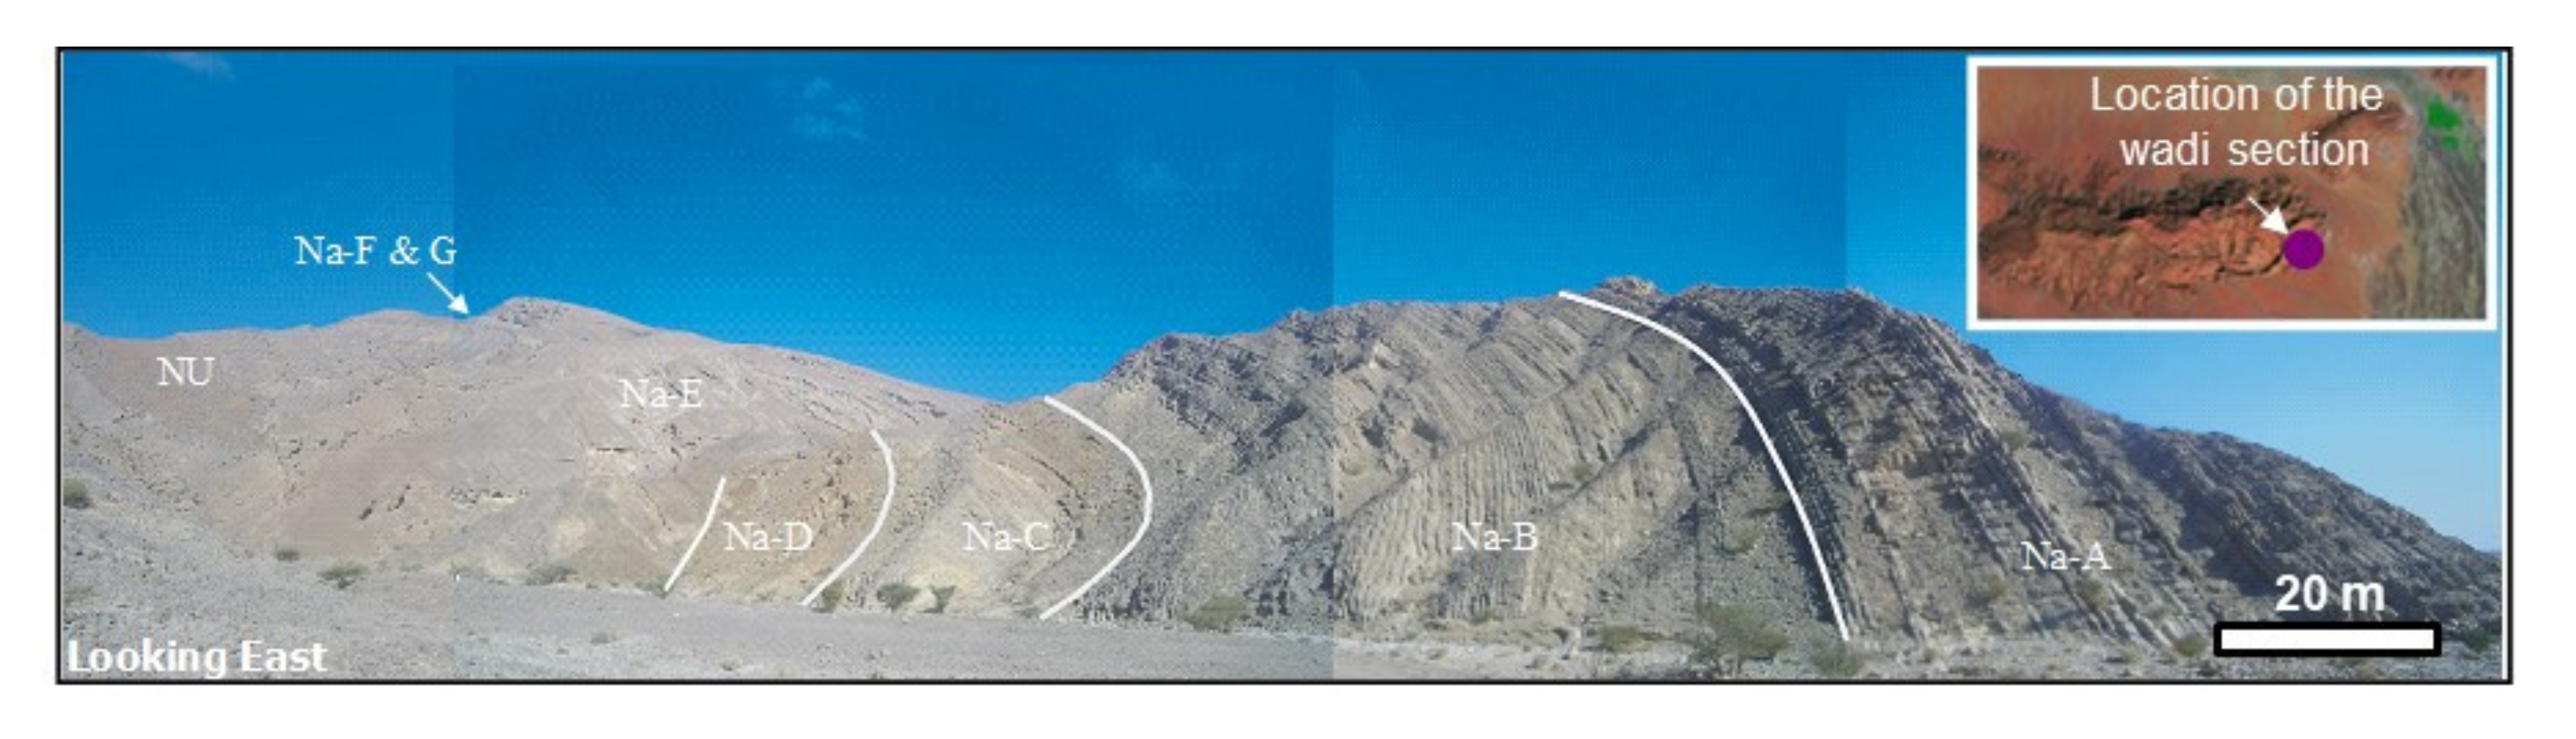
4.1. Qusaibah
4.2. Jebel Nahdah
4.3. Salakh-W
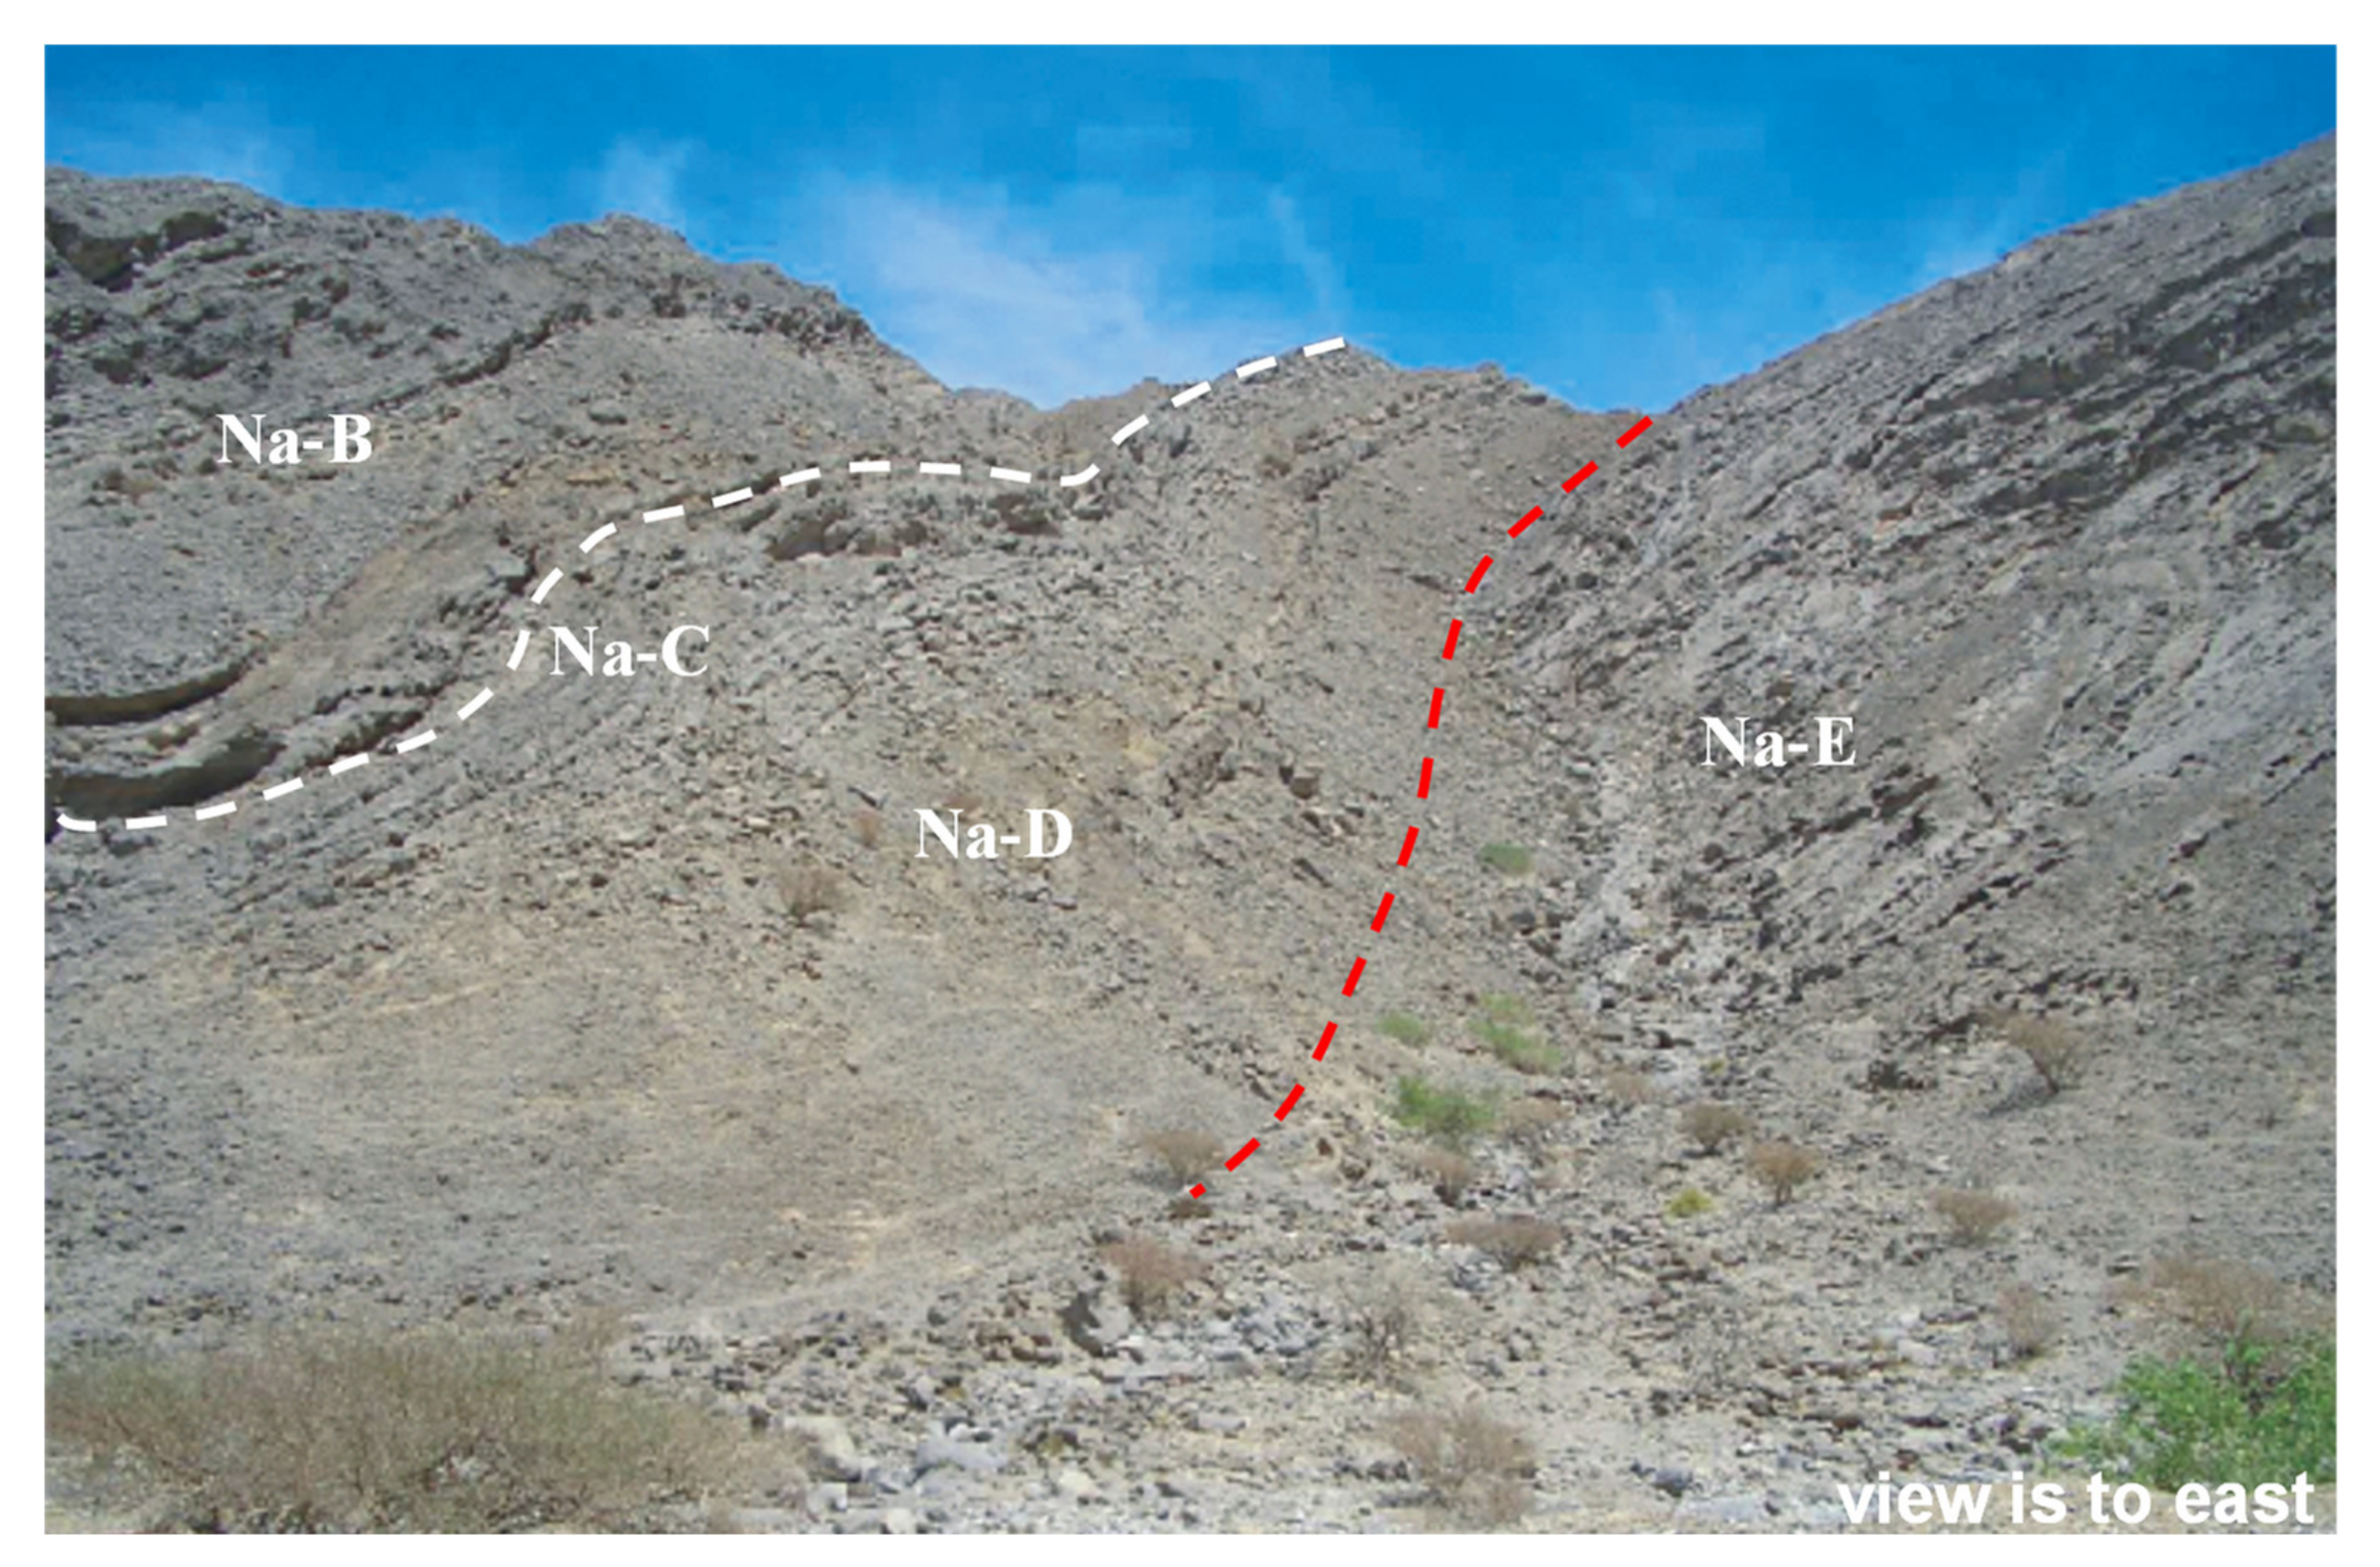
4.4. Salakh-E
4.5. Jebel Hinaydil
4.6. Madmar
5. Overall Fracture Pattern at the Salakh Arch
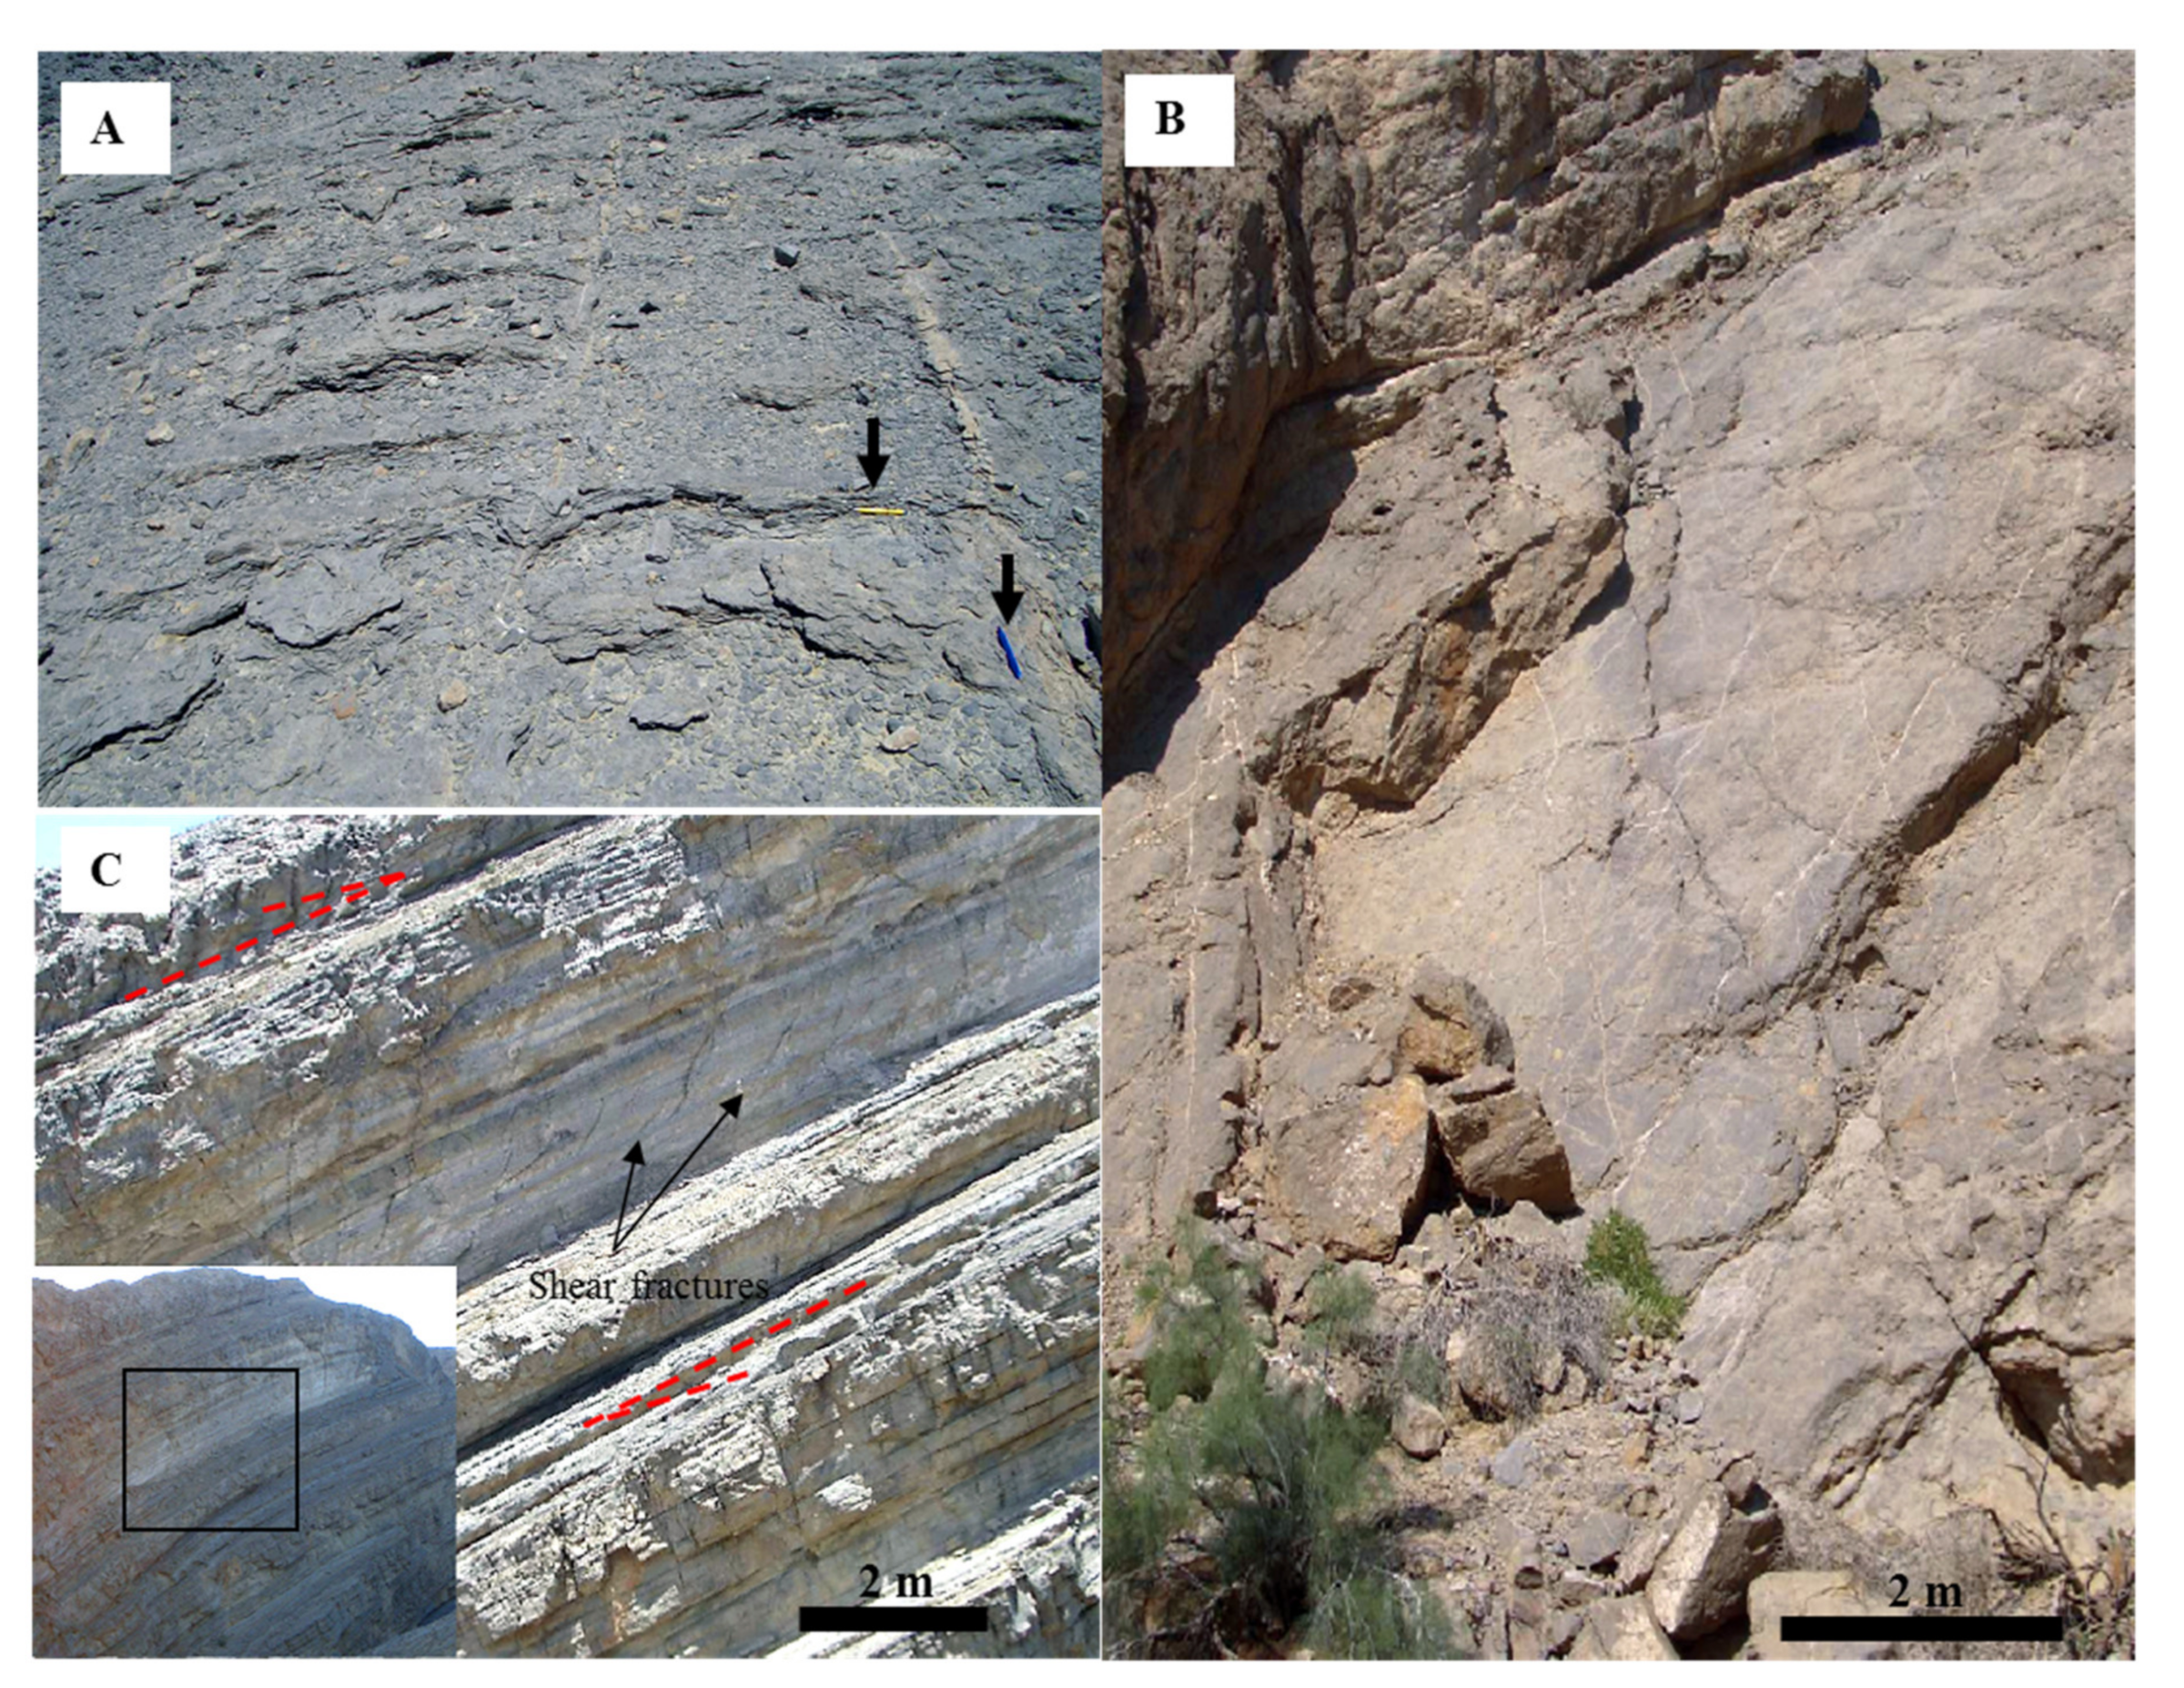
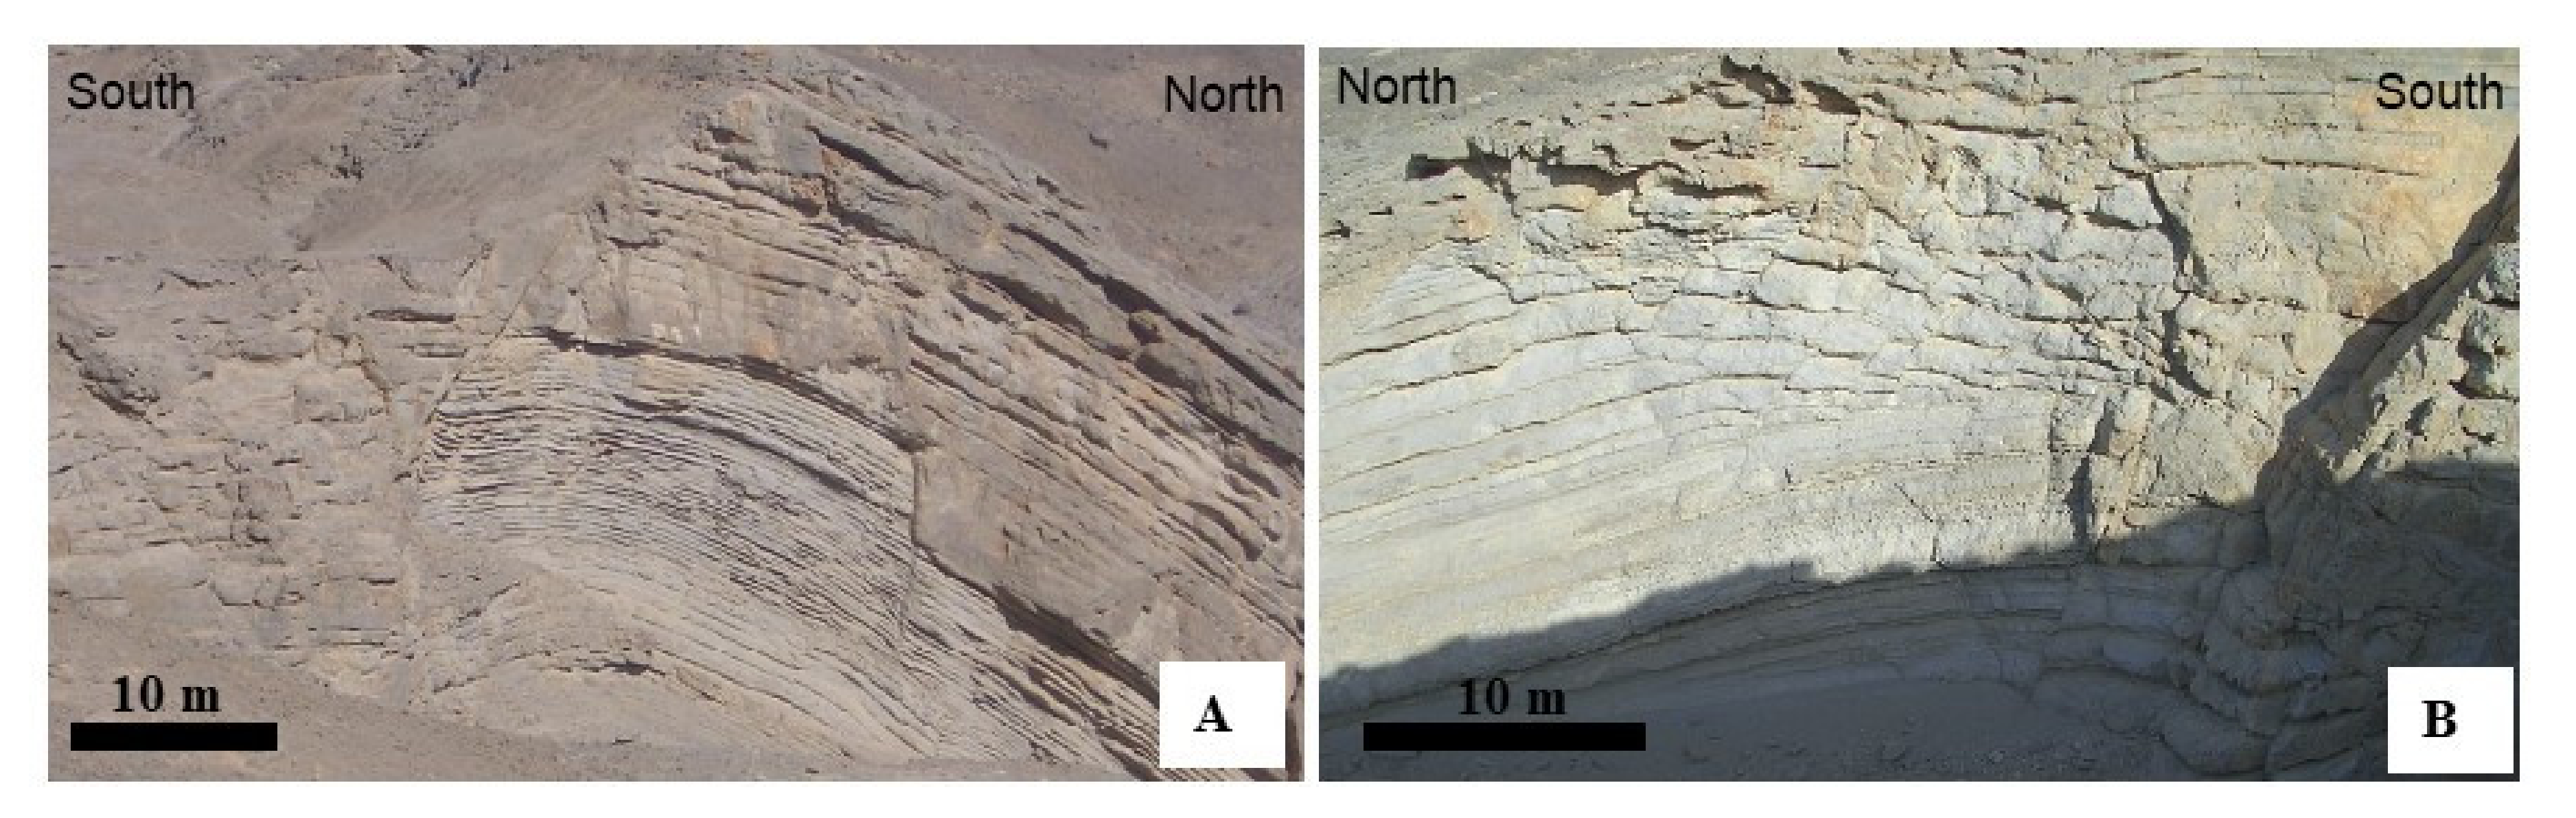
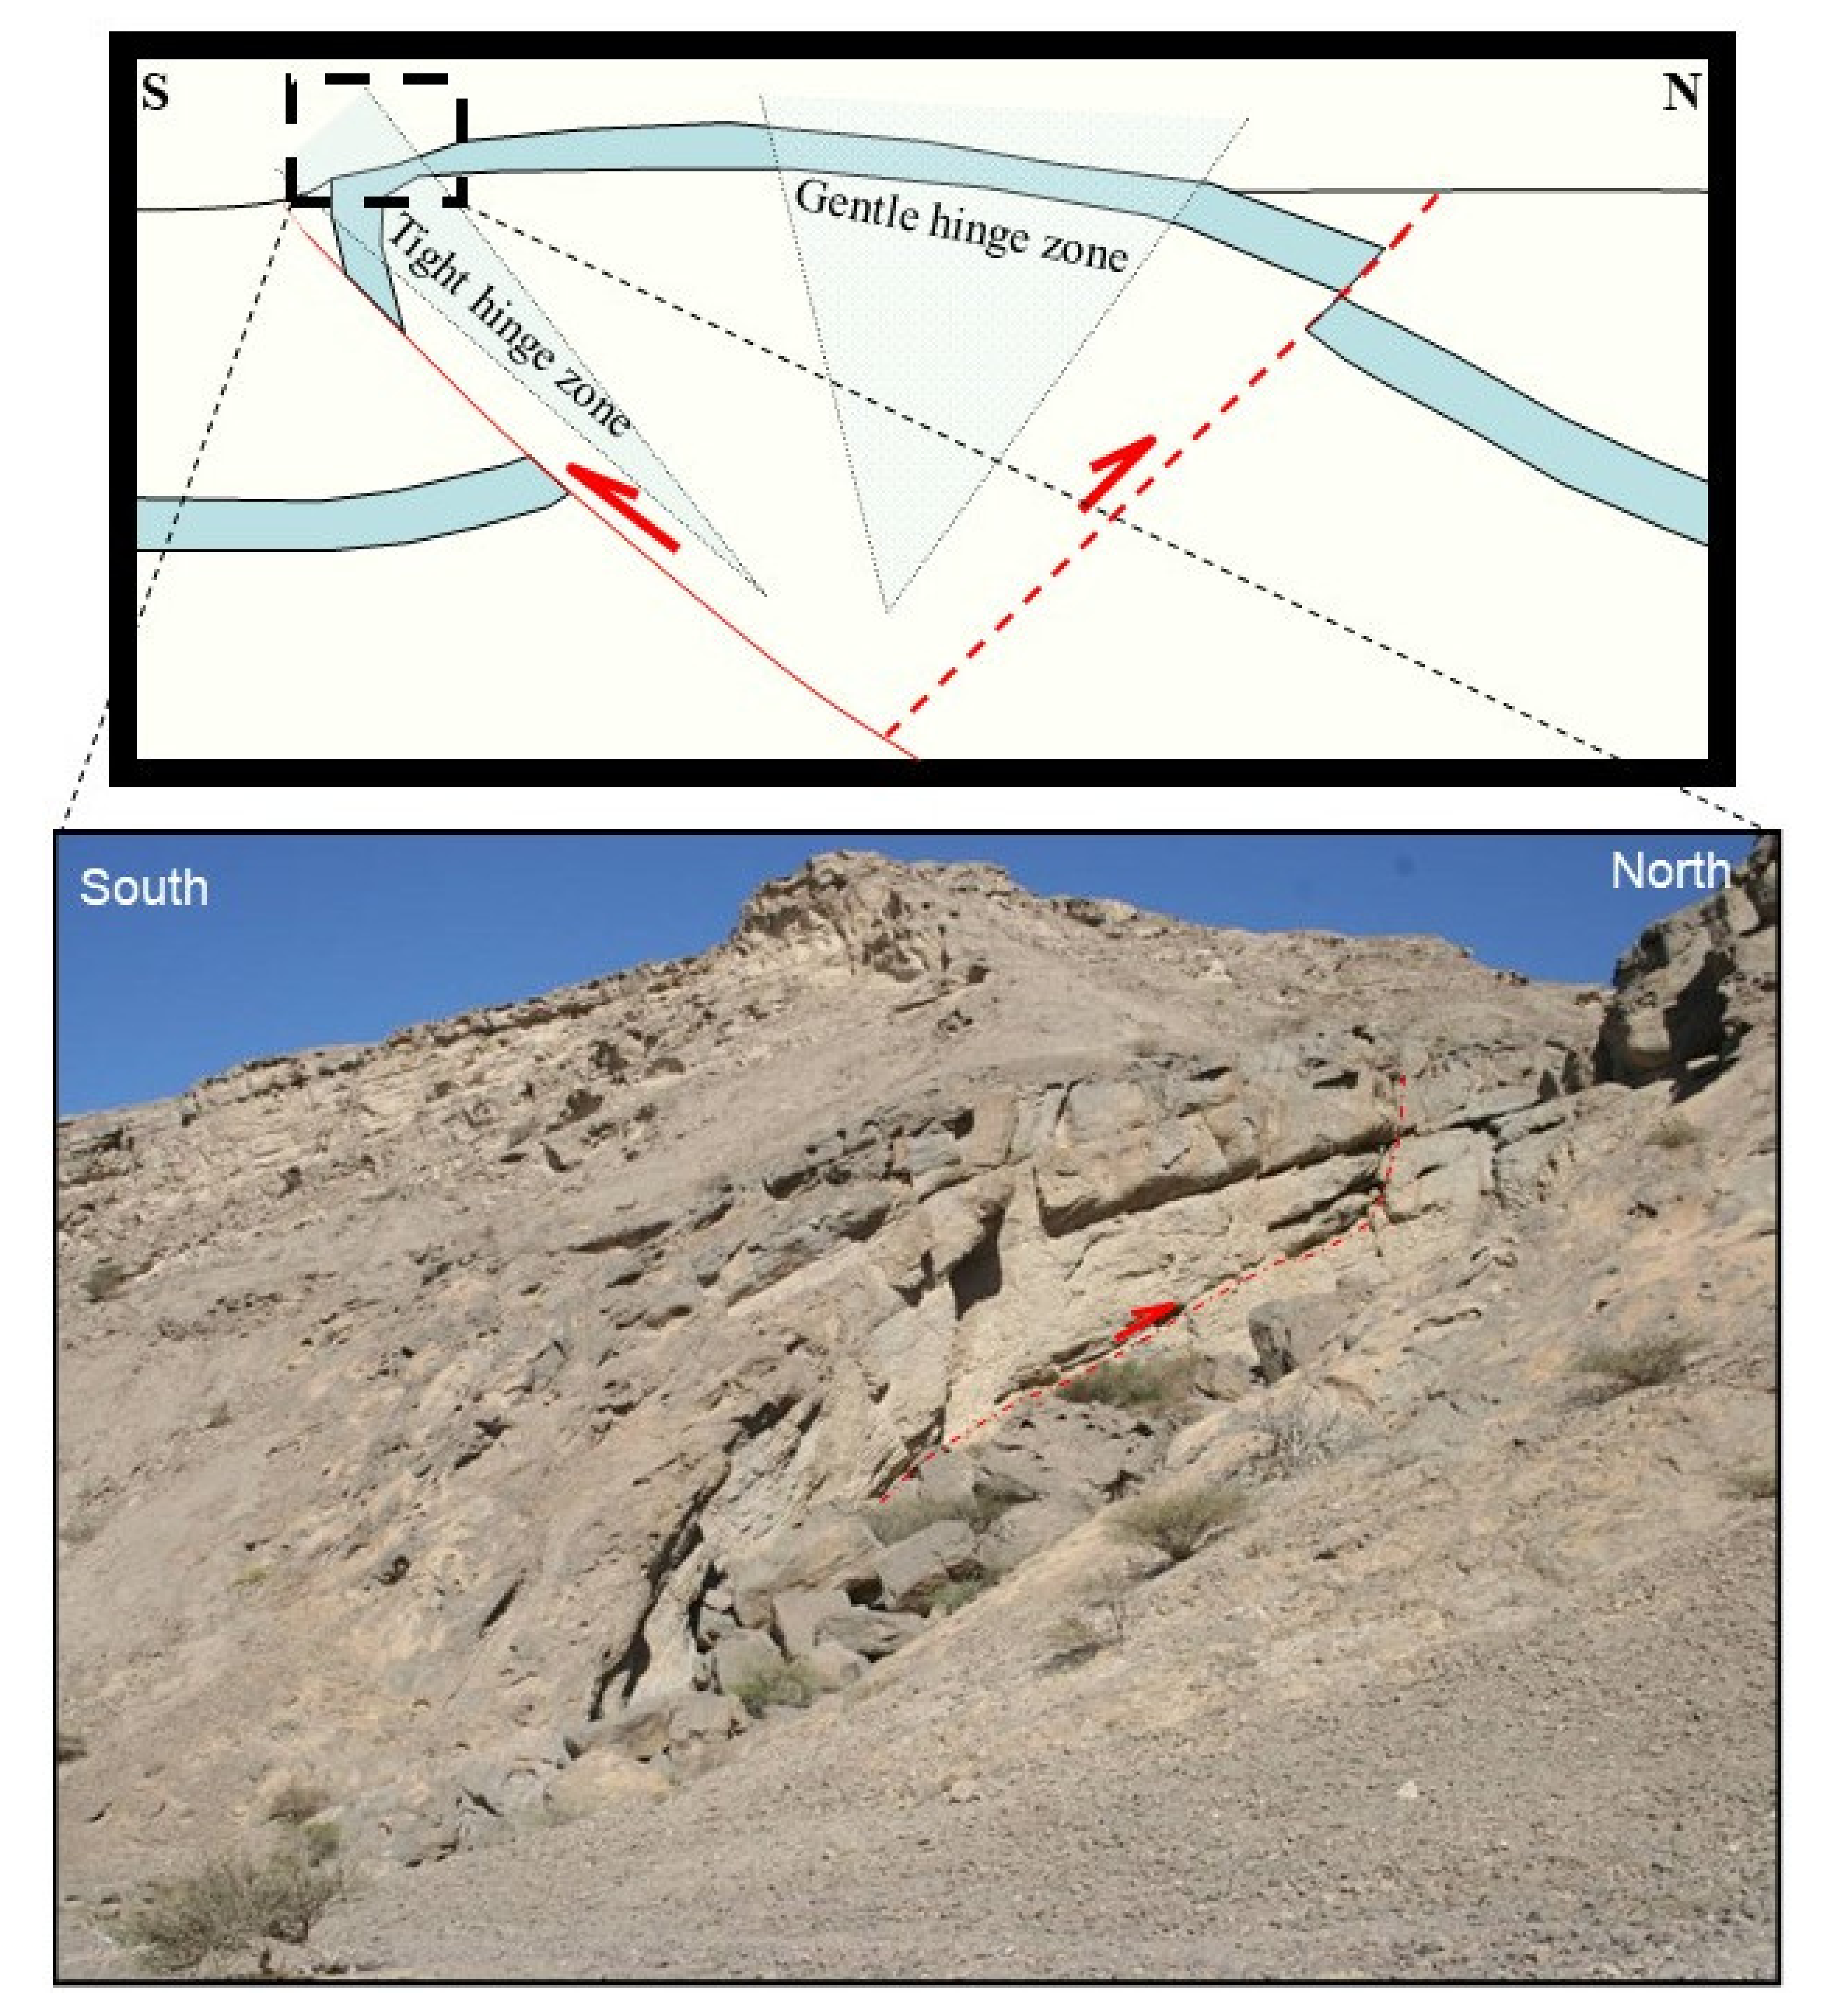
5.1. Field Observations and Interpretation
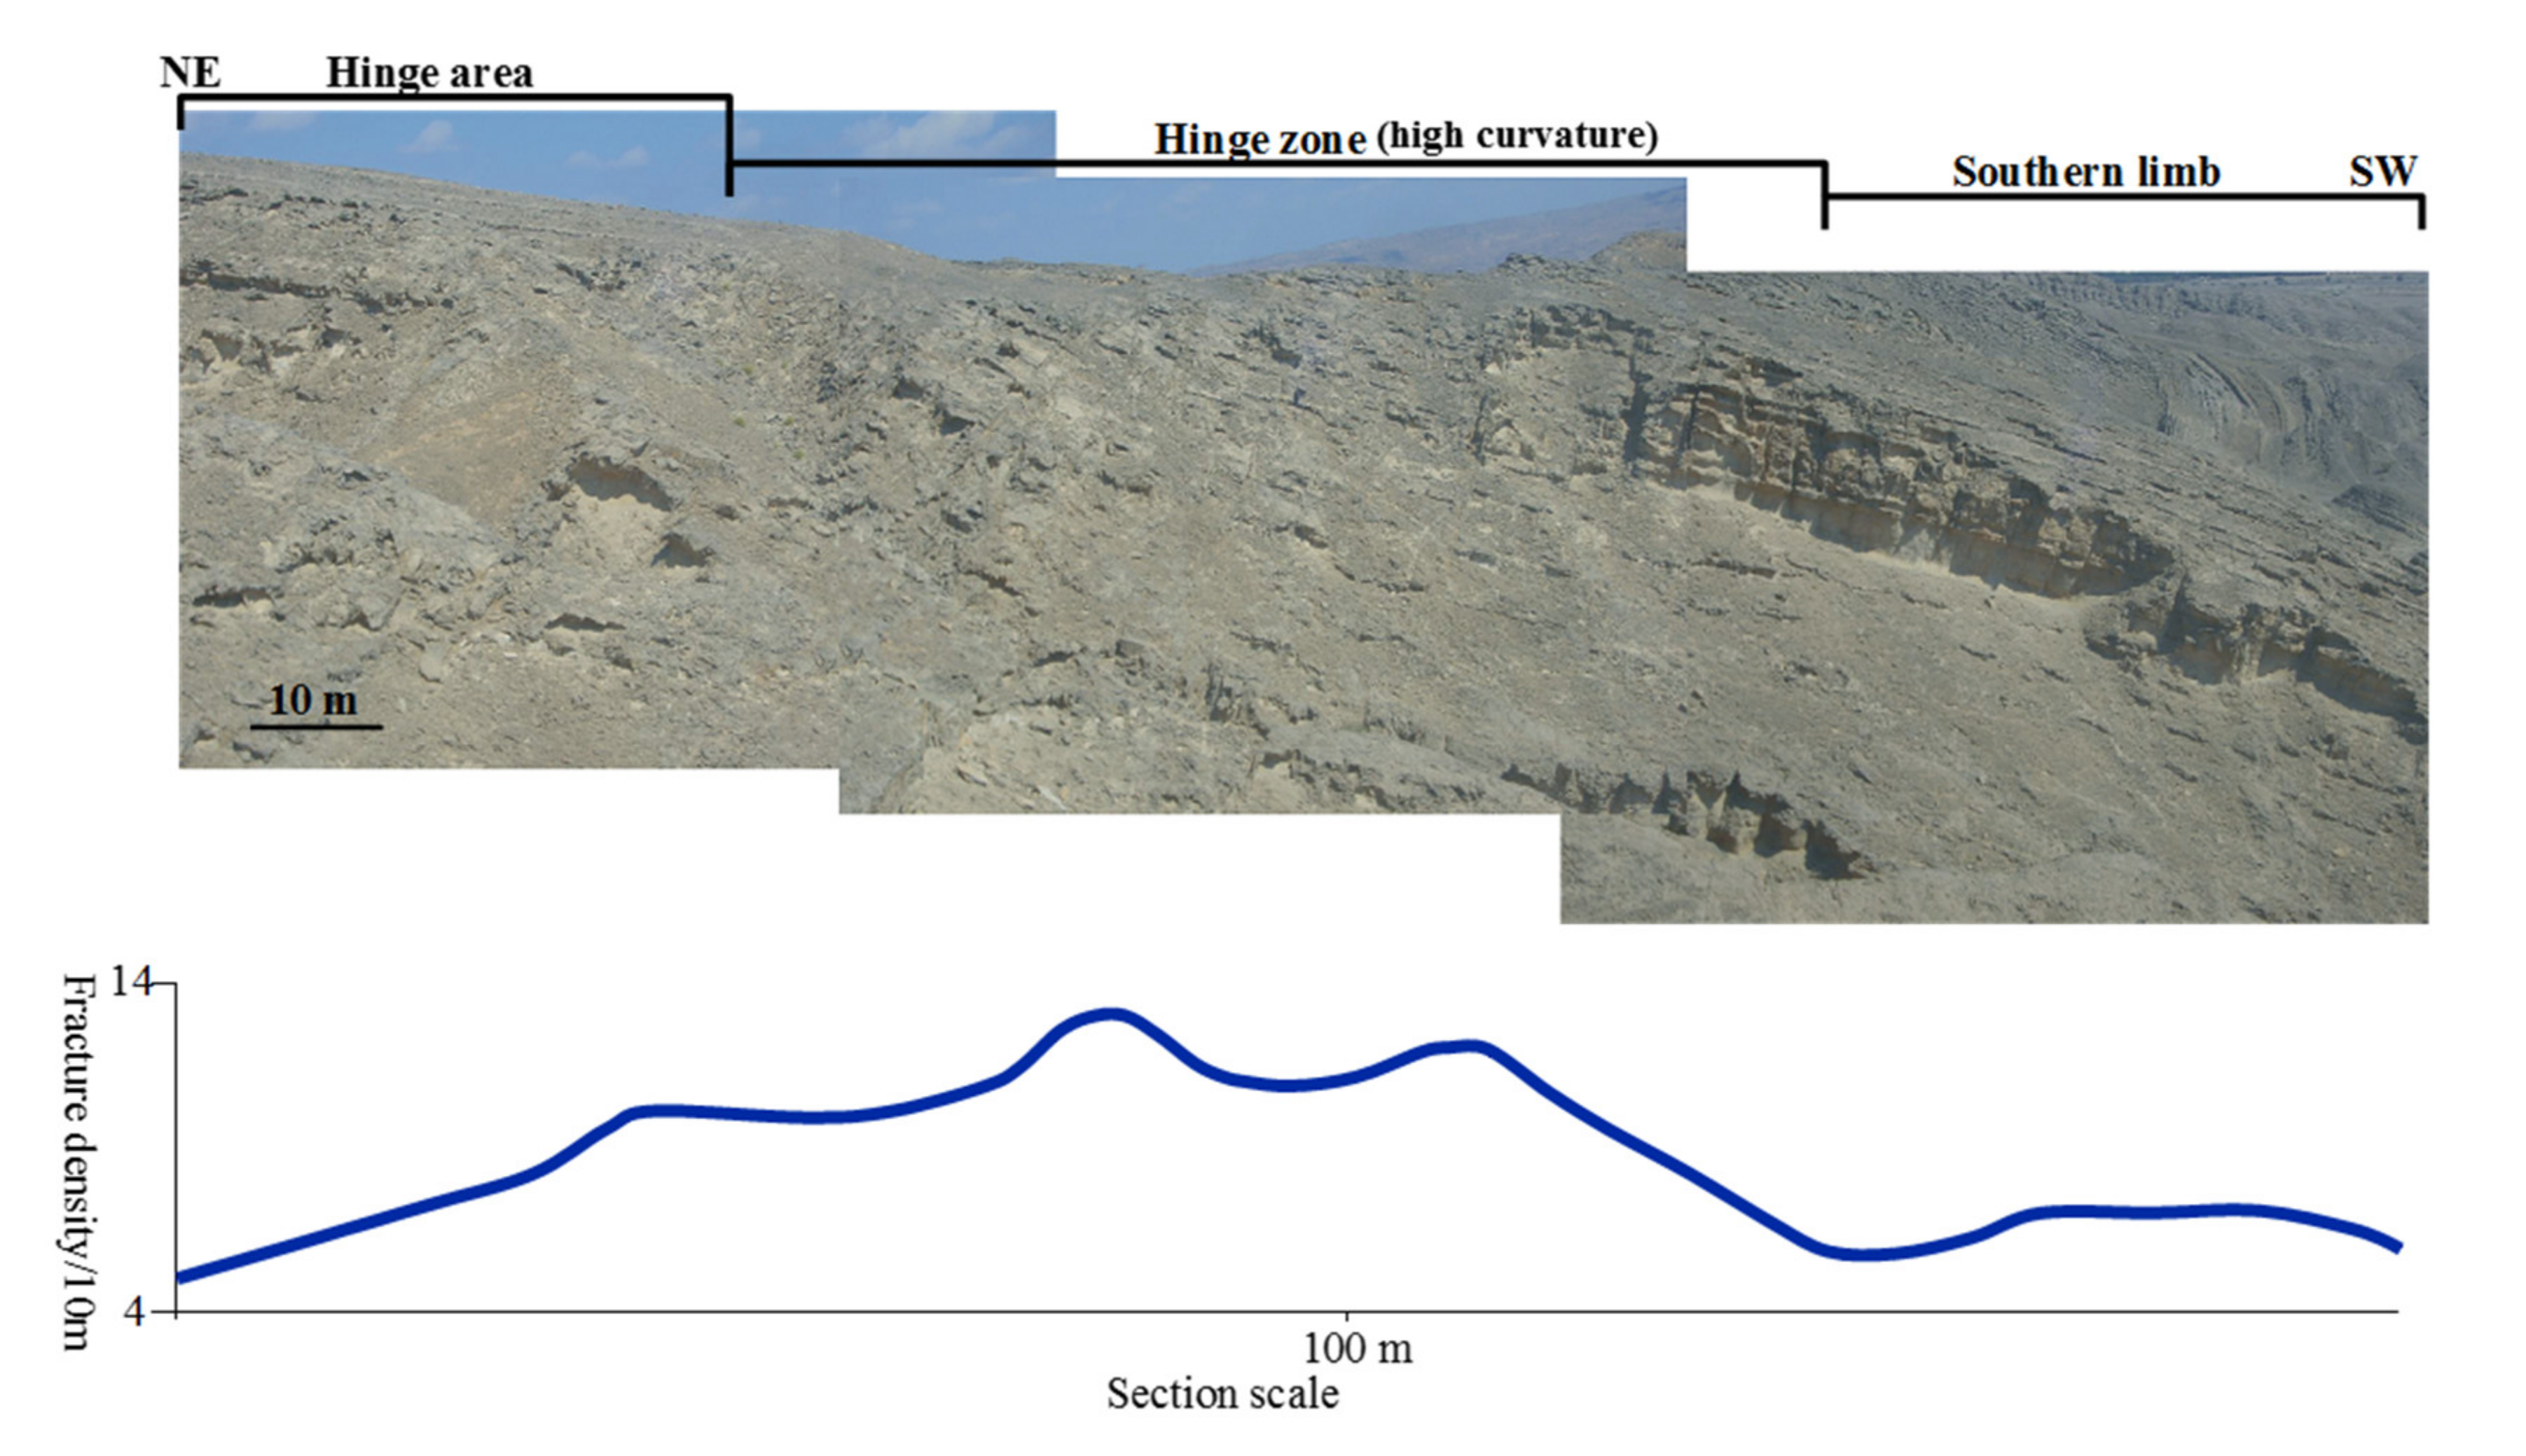
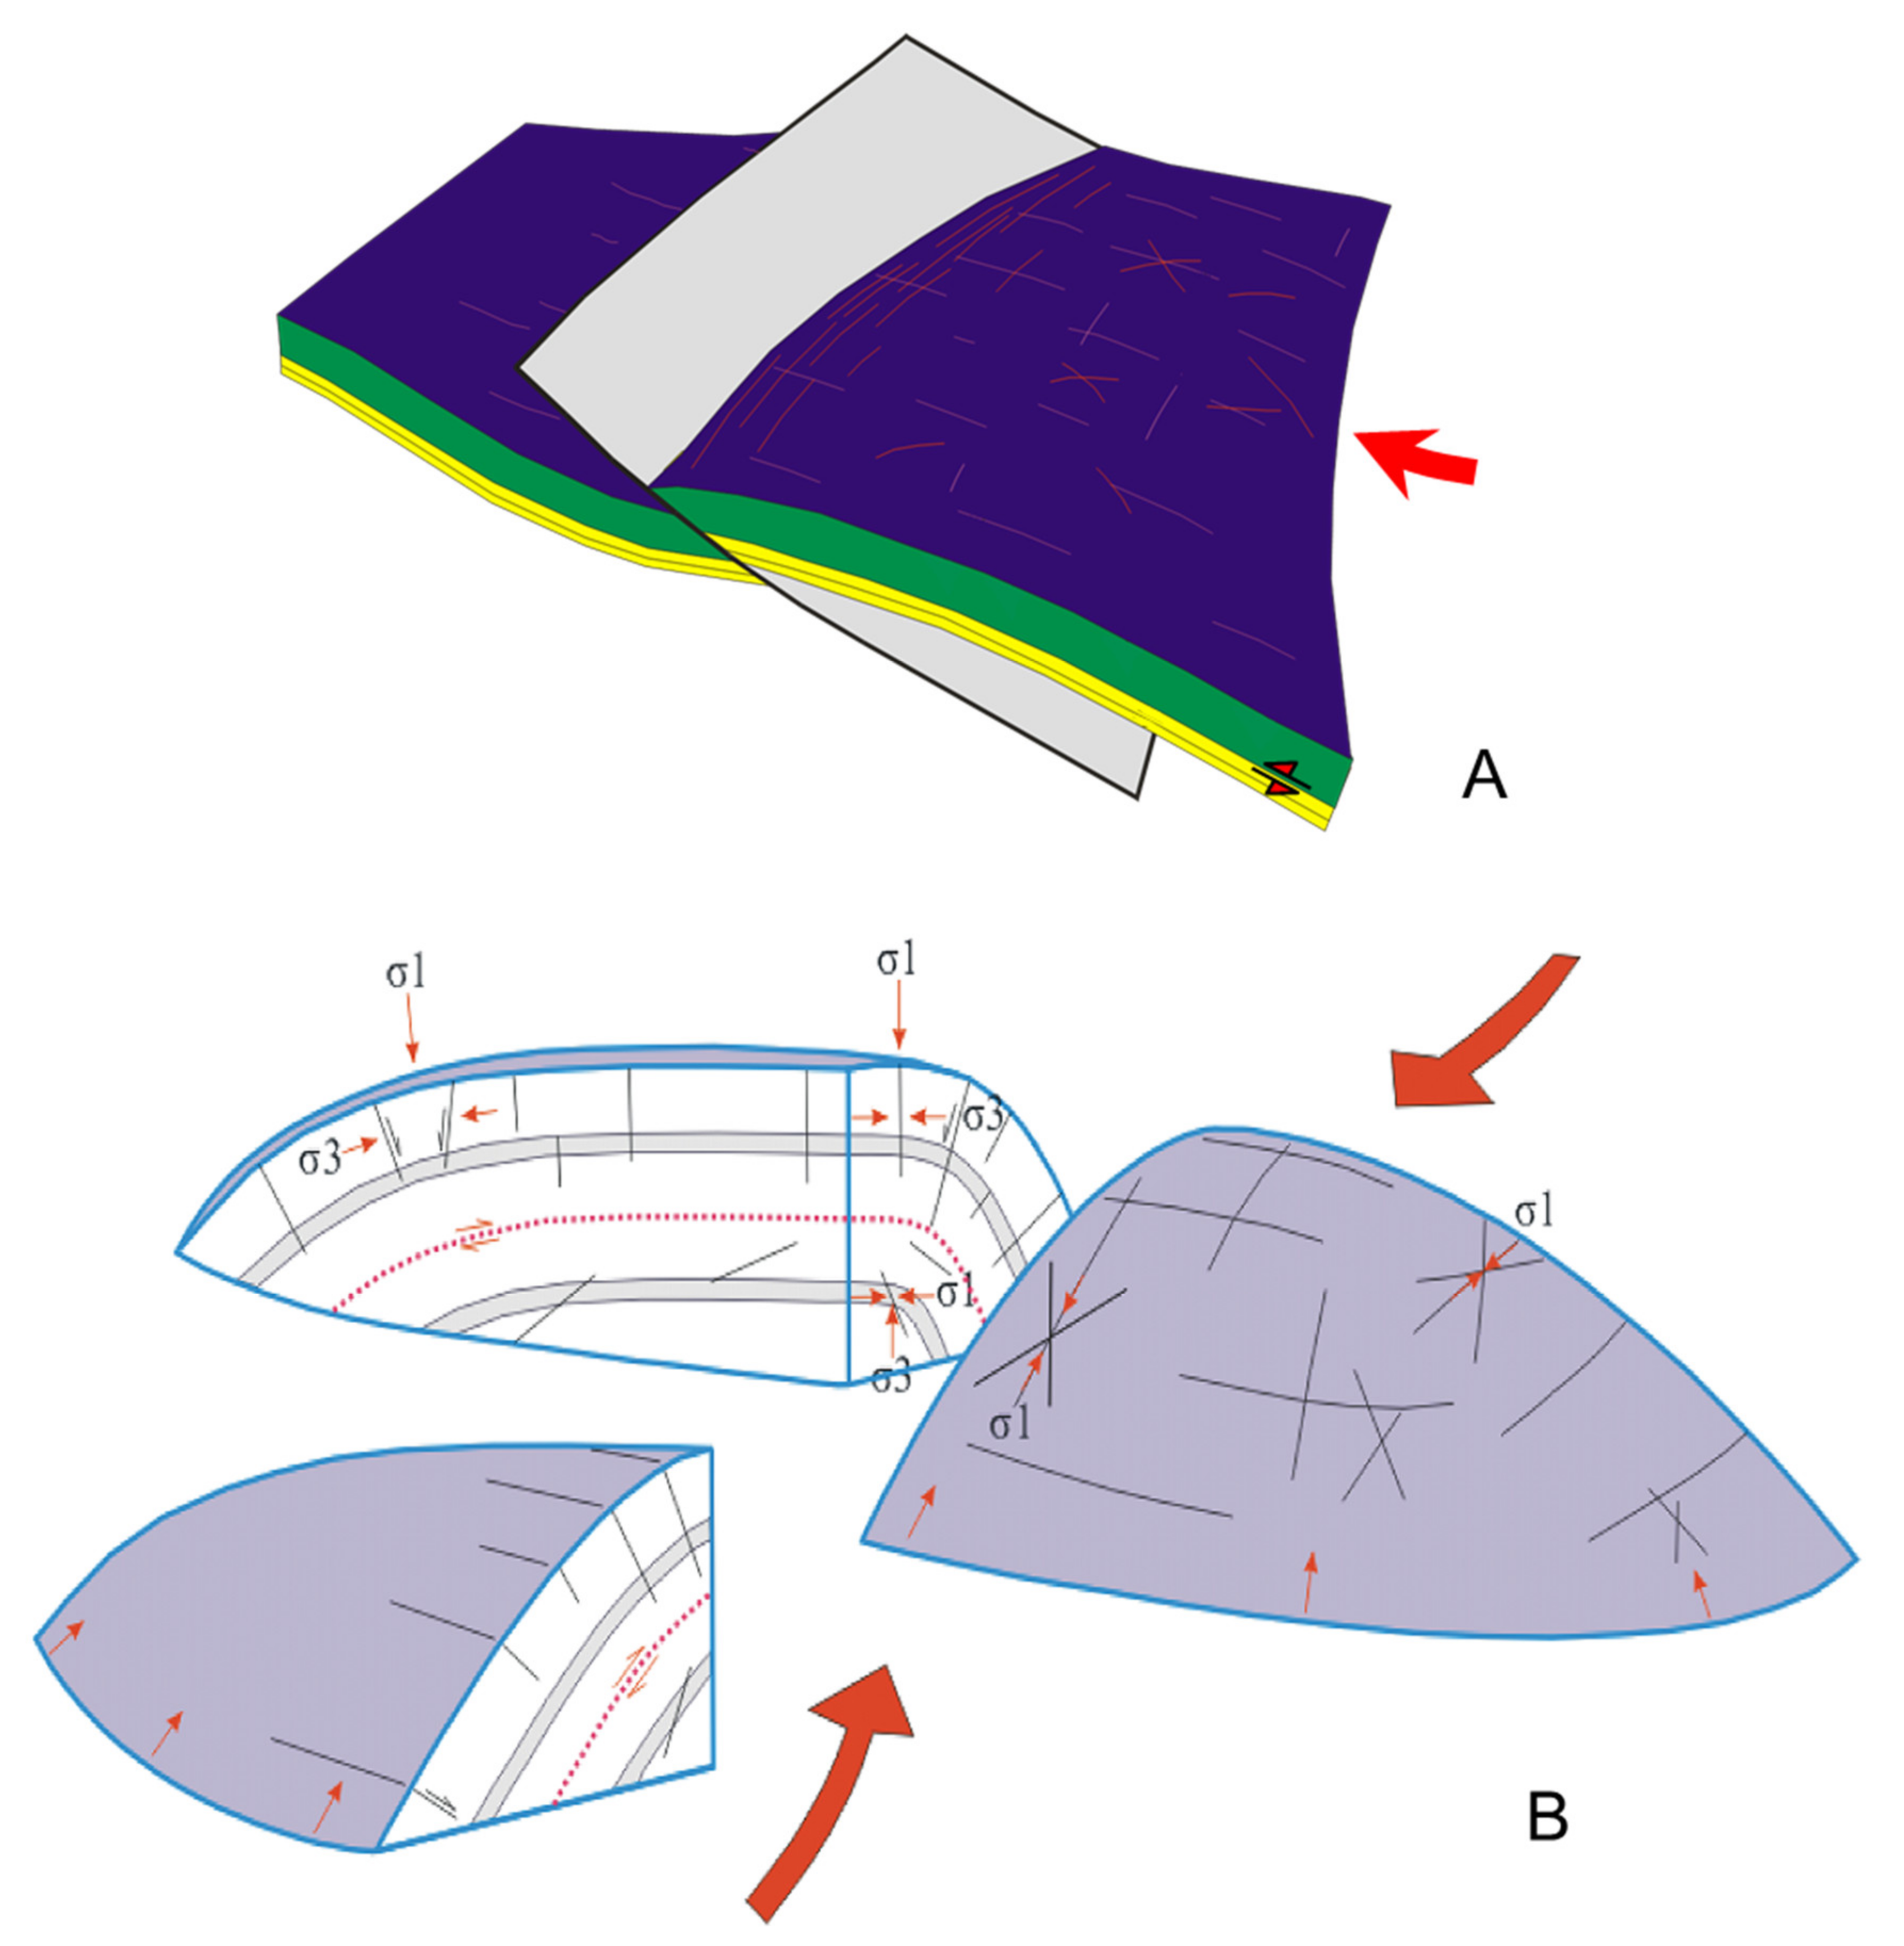
5.2. Arch Scale
5.3. Fold Scale
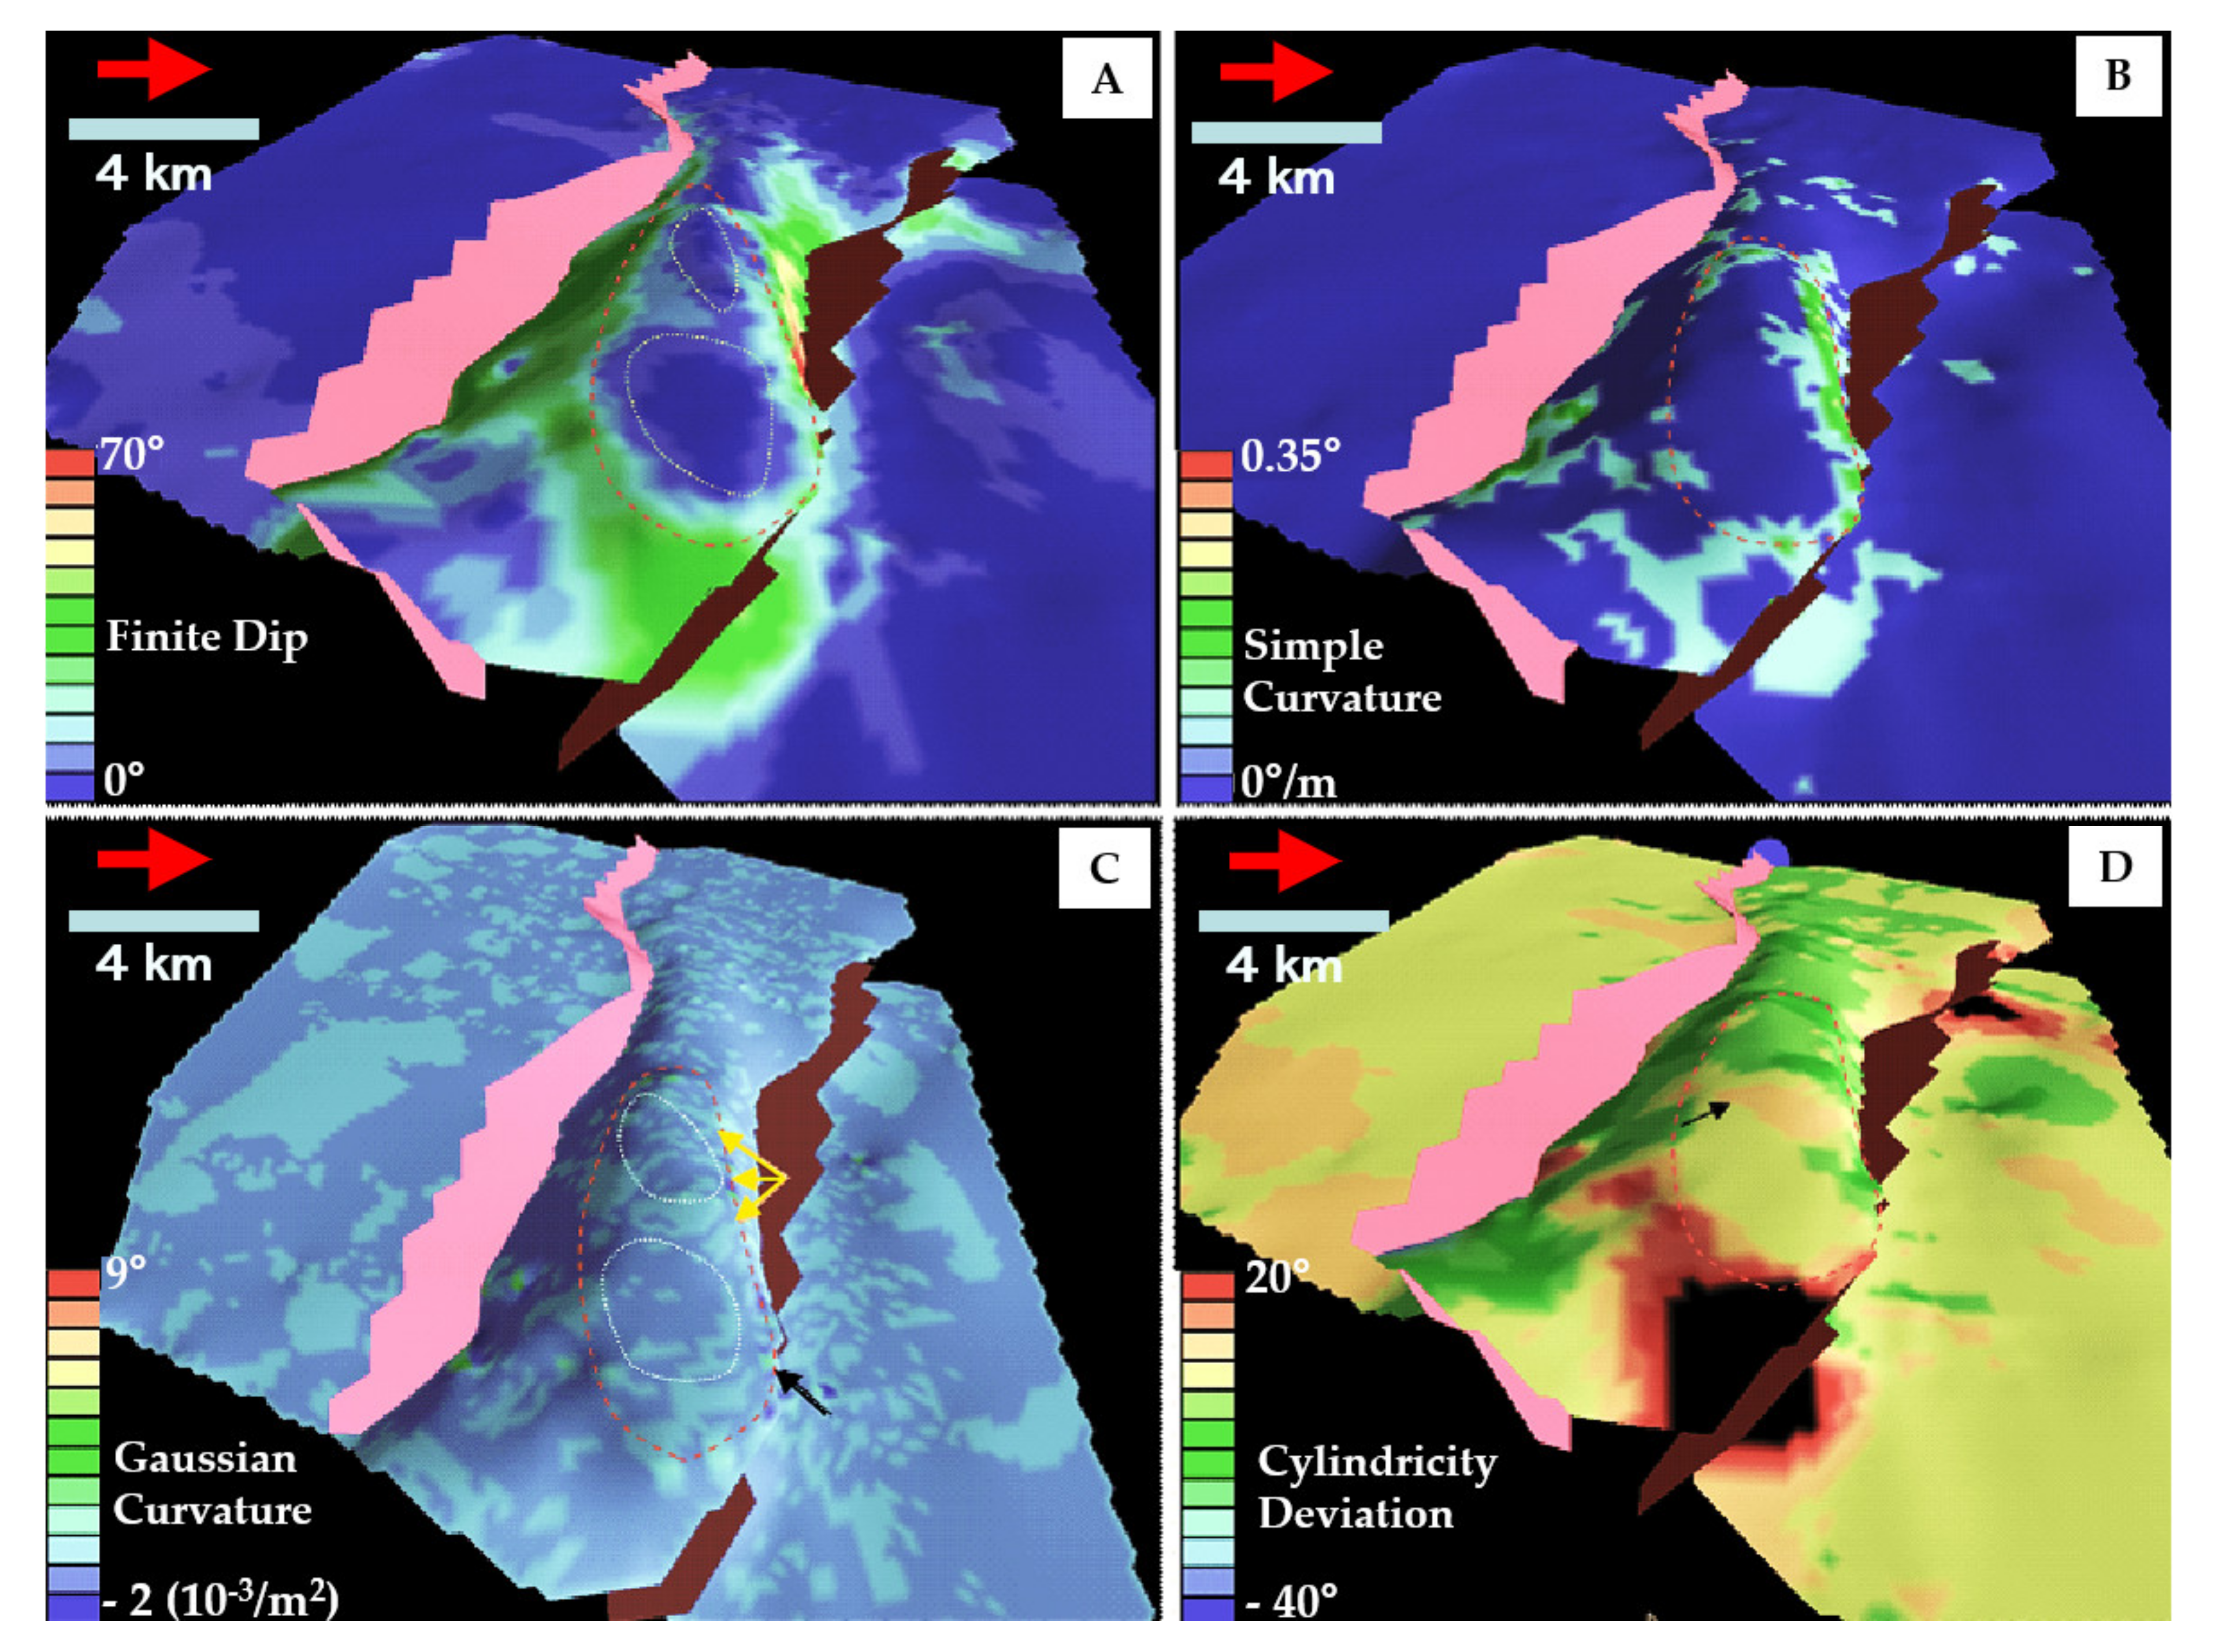
5.4. 3D Modeling and Outcrop Fracture Pattern at Jebel Qusaibah
5.5. Static Geometrical Analysis
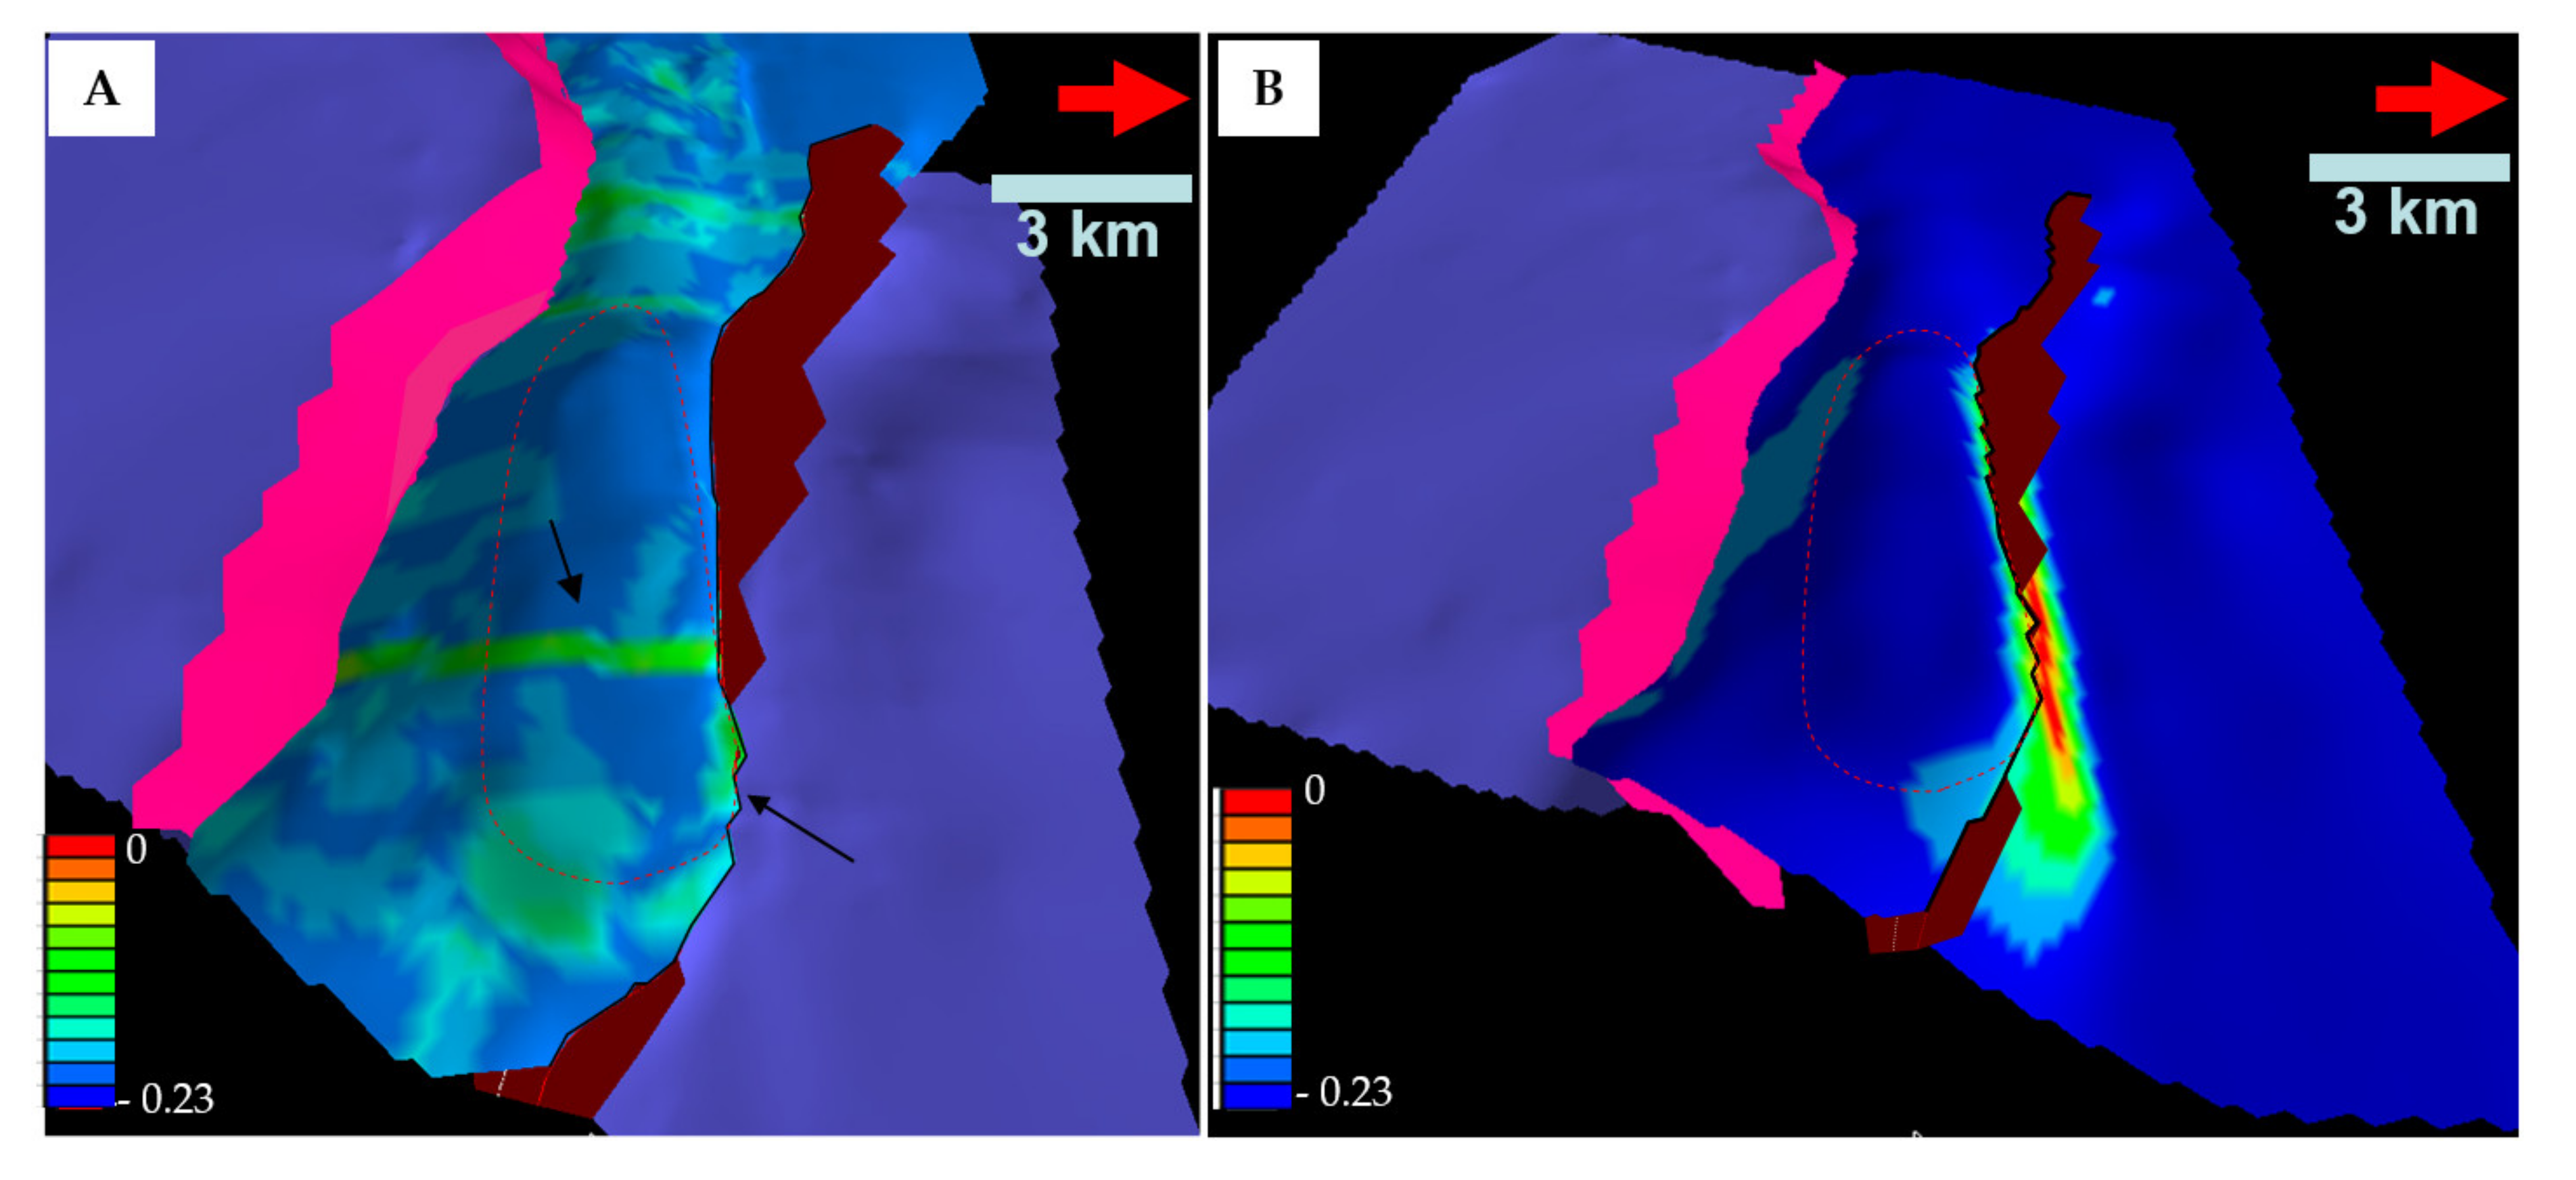
5.6. 3D Restoration
6. Discussion
6.1. 2D Fold Evolution Model vs. the Development of the Small Structures of the Salakh Arch
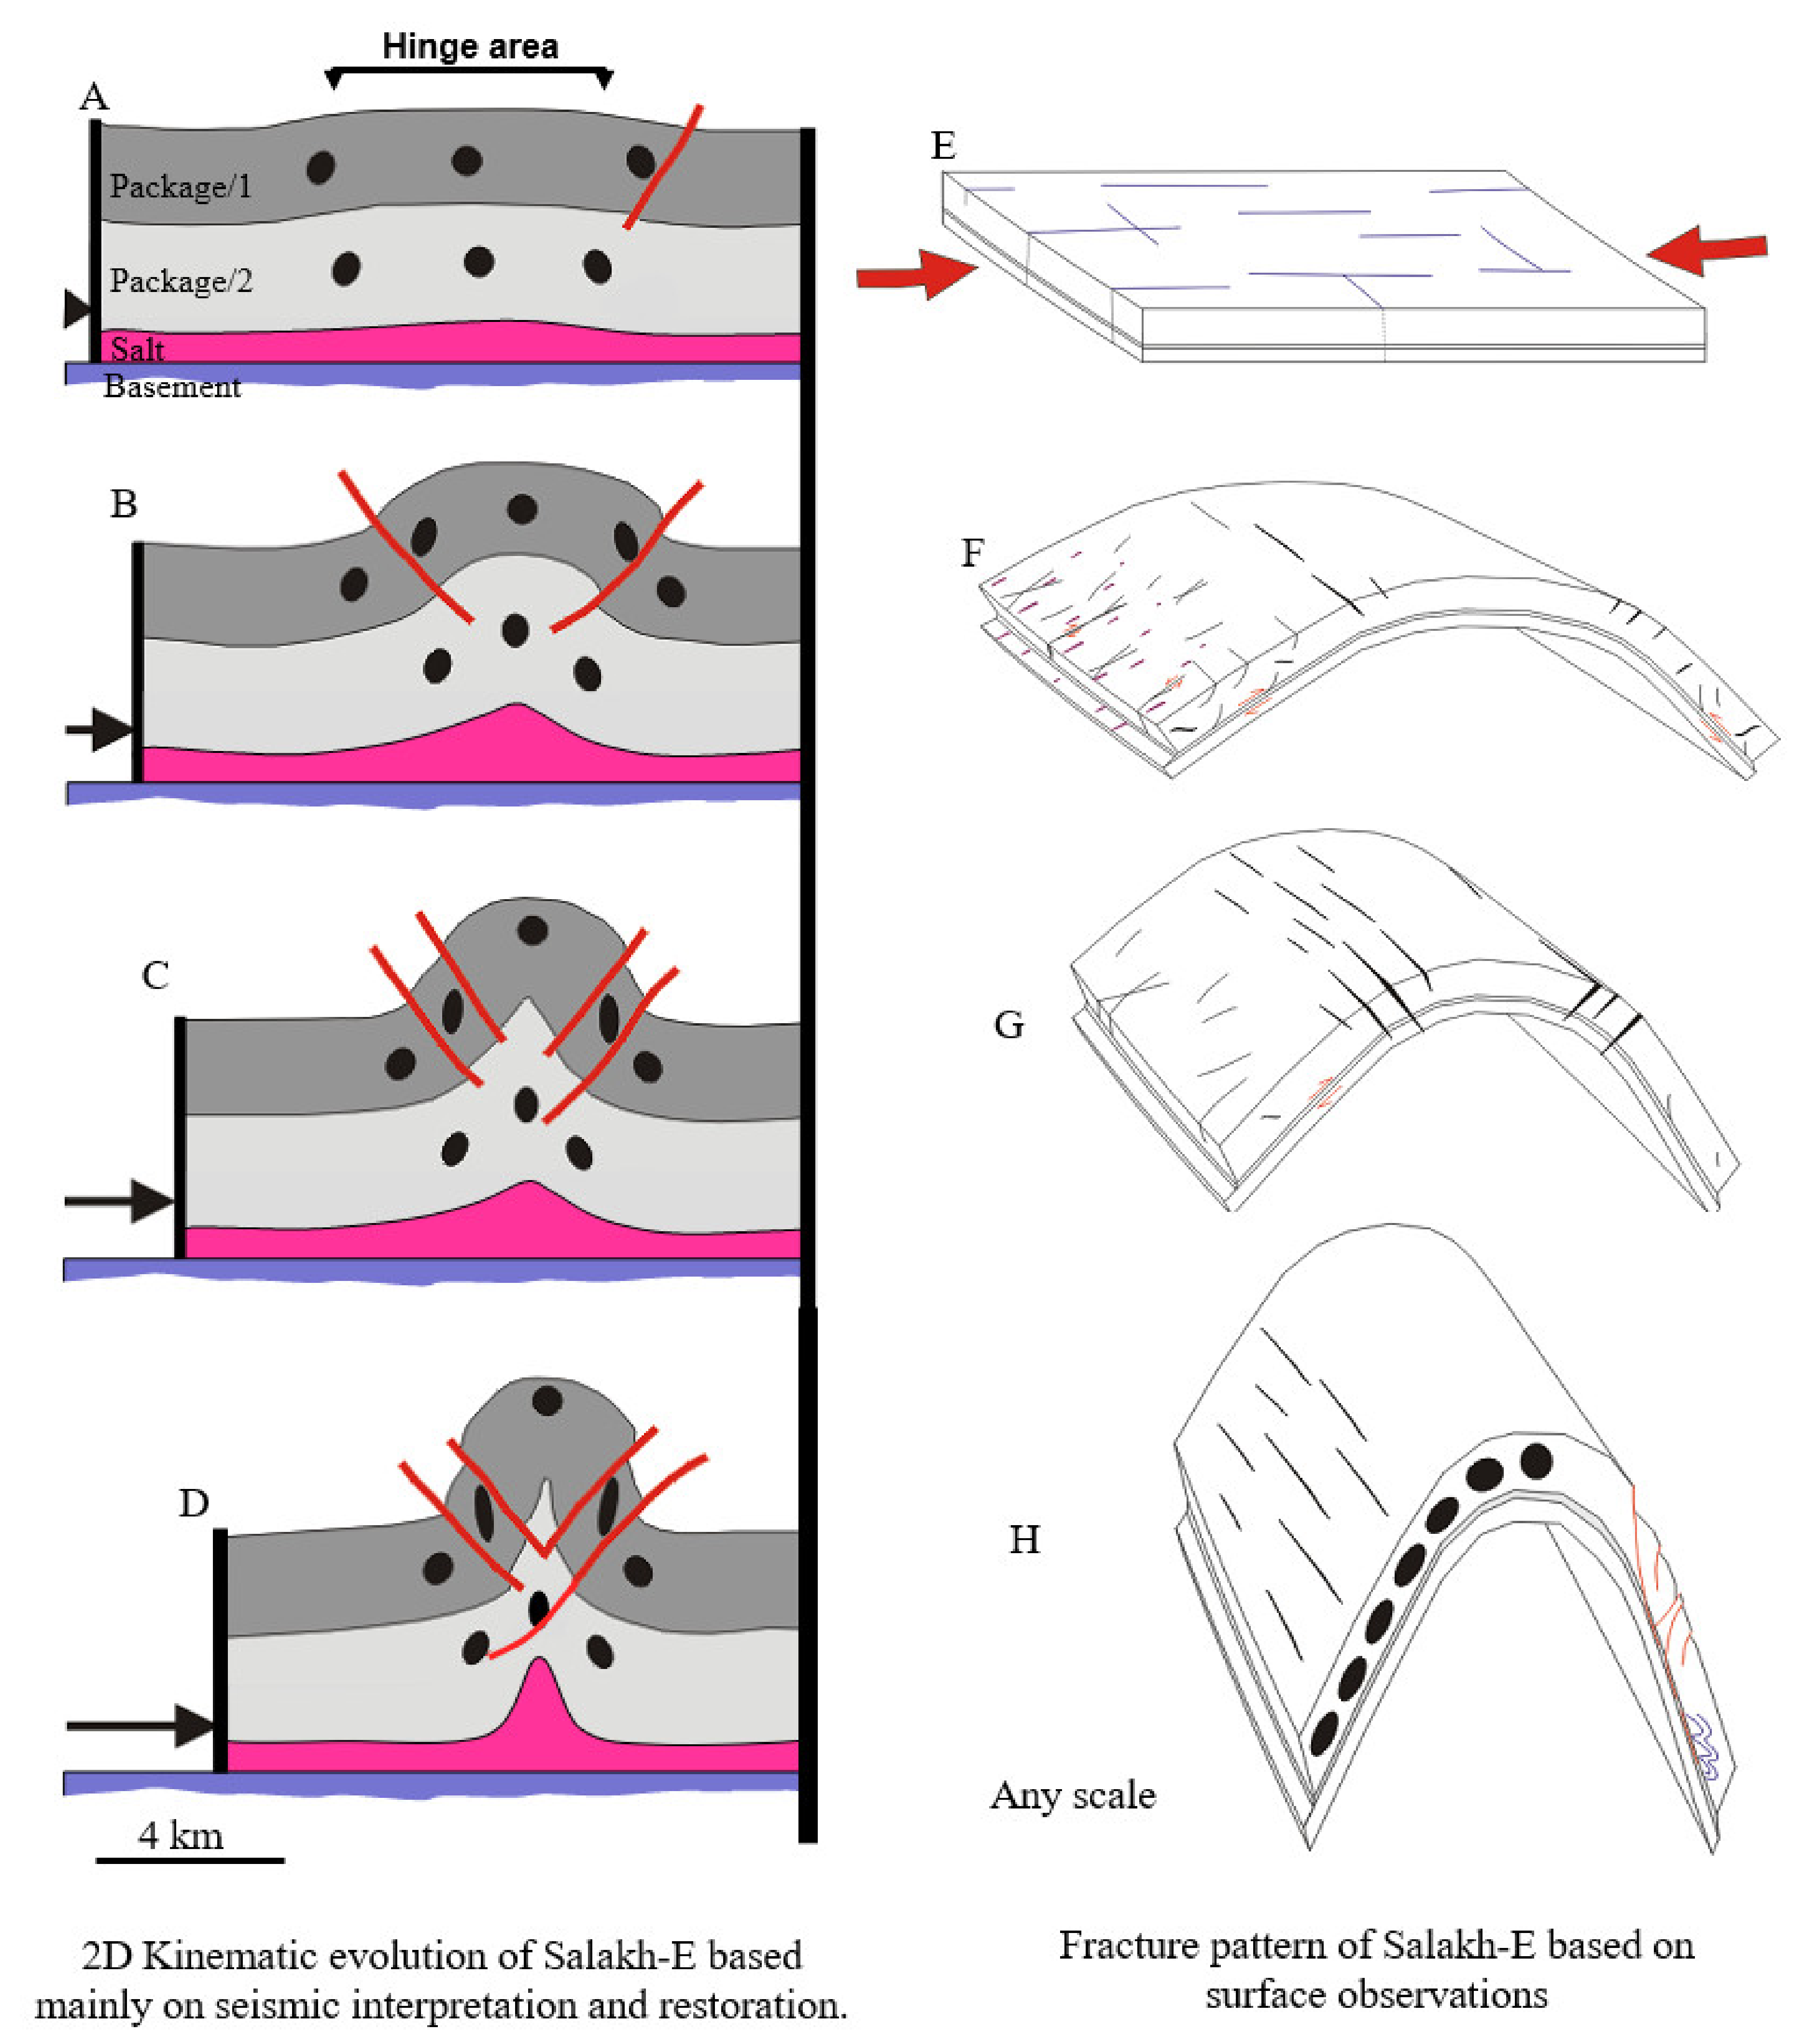
6.1.1. 2D Kinematic Evolution of Folds
6.1.2. Development of Outcrop Small Structures at Salakh Arch
6.1.3. Linking 2D Kinematic Evolution Models and Small-Scale Outcrop Structures
6.2. Testing Fracture Models Based on General Understanding of Fold Fracture Relationships at the Salakh Arch
7. Conclusions
Funding
Acknowledgments
Conflicts of Interest
References
- Hennings, P.; Olson, J.E.; Thompson, L.B. Combining Outcrop Data and Three-Dimensional Structural Models to Characterize Fractured Reservoirs: An Example from Wyoming. AAPG Bull. 2000, 84, 830–849. [Google Scholar] [CrossRef]
- Cosgrove, W.J.; Ameen, M.S. A comparison of the geometry, spatial organisation and fracture patterns associated with forced folds and buckle folds. In Forced Folds and Fractures; Cosgrove, J.W., Ameen, M.S., Eds.; Special Publication of the Geological Society of London: London, UK, 2000. [Google Scholar]
- Casey, M.; Butler, R.W.H. Modelling approaches to understanding fold development: Implications for hydrocarbon reservoirs. Mar. Pet. Geol. 2004, 21, 933–946. [Google Scholar] [CrossRef]
- Murray, J.G.H. Quantitative Fracture Study--Sanish Pool, Mckenzie County, North Dakota. AAPG Bull. 1968, 52, 57–65. [Google Scholar] [CrossRef]
- Ameen, M.S. Fractography and fracture characterization in the Permo-Triassic sandstones and the Lower Palaeozoic Basement, West Cumbria, UK. Geol. Soc. Lond. 1995, 92, 97–147. [Google Scholar] [CrossRef]
- Cooke, M.; Mollema, P.N.; Pollard, D.D.; Aydin, A. Interlayer slip and joint localization in the East Kaibab Monocline, Utah: Field evidence and results from numerical modelling. Geol. Soc. Lond. 1999, 169, 23–49. [Google Scholar] [CrossRef]
- Bergbauer, S.; Pollard, D.D. A new conceptual fold-fracture model including prefolding joints, based on the Emigrant Gap anticline, Wyoming. GSA Bull. 2004, 116, 294. [Google Scholar] [CrossRef]
- Li, Y.; Hou, G.; Hari, K.; Neng, Y.; Lei, G.; Tang, Y.; Zhou, L.; Sun, S.; Zheng, C. The model of fracture development in the faulted folds: The role of folding and faulting. Mar. Pet. Geol. 2018, 89, 243–251. [Google Scholar] [CrossRef]
- Jamison, W.R. Geometric analysis of fold development in overthrust terranes. J. Struct. Geol. 1987, 9, 207–219. [Google Scholar] [CrossRef]
- Florez-Niño, J.-M.; Aydin, A.; Mavko, G.; Antonellini, M.; Ayaviri, A. Fault and fracture systems in a fold and thrust belt: An example from Bolivia. AAPG Bull. 2005, 89, 471–493. [Google Scholar] [CrossRef]
- Hanks, J.L.C.L.; Krumhardt, A.P. Lithologic and Structural Controls on Natural Fracture Distribution and Behavior Within the Lisburne Group, Northeastern Brooks Range and North Slope Subsurface, Alaska. AAPG Bull. 1997, 81, 1700–1720. [Google Scholar] [CrossRef]
- Hanks, C. Character, relative age and implications of fractures and other mesoscopic structures associated with detachment folds: An example from the Lisburne Group of the northeastern Brooks Range, Alaska. Bull. Can. Pet. Geol. 2004, 52, 121–138. [Google Scholar] [CrossRef]
- Lisle, R.J. Detection of Zones of Abnormal Strains in Structures Using Gaussian Curvature Analysis. AAPG Bull. 1994, 78, 1811–1819. [Google Scholar] [CrossRef]
- Lisle, R.J. Predicting patterns of strain from three-dimensional fold geometries: Neutral surface folds and forced folds. Geol. Soc. Lond. 1999, 169, 213–221. [Google Scholar] [CrossRef]
- Lisle, R.J. Constant bed-length folding: Three-dimensional geometrical implications. J. Struct. Geol. 1992, 14, 245–252. [Google Scholar] [CrossRef]
- Fischer, M.P.; Wilkerson, M.S. Predicting the orientation of joints from fold shape: Results of pseudo–three-dimensional modeling and curvature analysis. Geology 2000, 28, 15–18. [Google Scholar] [CrossRef]
- Stearns, D. Faulting and forced folding in the Rocky Mountains foreland. In Laramide Folding Associated with Basement Block Faulting in the Western United States; Matthews, V., III, Ed.; Geological Society of America: Boulder, CO, USA, 1978; pp. 1–37. [Google Scholar]
- Price, N.J.; Cosgrove, J.W. Analysis of Geological Structures; Cambridge University Press: Cambridge, UK, 1990. [Google Scholar]
- Dercourt, J.; Zonenshain, L.; Ricou, L.-E.; Kazmin, V.; Le Pichon, X.; Knipper, A.; Grandjacquet, C.; Sbortshikov, I.; Geyssant, J.; Lepvrier, C.; et al. Geological evolution of the tethys belt from the atlantic to the pamirs since the LIAS. Tectonophysics 1986, 123, 241–315. [Google Scholar] [CrossRef]
- Searle, M. The Geology of the Oman Mountains—An Outline of Their Origin. J. Struct. Geol. 1996, 18, 861–862. [Google Scholar] [CrossRef]
- Hanna, S.S. The Alpine deformation of the Central Oman Mountains. Geol. Soc. Lond. 1990, 49, 341–359. [Google Scholar] [CrossRef]
- Glennie, K.W.; Boeuf, M.G.A.; Hughes-Clark, M.W.; Moody-Stuart, M.; Pillar, W.F.H.; Reinhardt, B.M. Geology of the Oman Mountains. Trans. R. Dutch Geol. Min. Soc. 1974, 31, 423. [Google Scholar] [CrossRef]
- Skelton, P.W.; Nolan, S.C.; Scott, R.W. The Maastrichtian transgression onto the northwestern flank of the Proto-Oman Mountains: Sequences of rudist-bearing beach to open shelf facies. Geol. Soc. Lond. 1990, 49, 521–547. [Google Scholar] [CrossRef]
- Warburton, J.; Burnhill, T.J.; Graham, R.H.; Isaac, K.P. The evolution of the Oman Mountains Foreland Basin. Geol. Soc. Lond. 1990, 49, 419–427. [Google Scholar] [CrossRef]
- Loosveld, R.J.; Bell, A.; Terken, J.J. The tectonic evolution of interior Oman. GeoArabia 1996, 1, 28–51. [Google Scholar]
- Al-Kindi, M.H.; Richard, P.D. The main structural styles of the hydrocarbon reservoirs in Oman. Geol. Soc. Lond. 2014, 392, 409–445. [Google Scholar] [CrossRef]
- Filbrandt, J.B.; Al-Dhahab, S.; Al-Habsy, A.; Harris, K.; Keating, J.; Al-Mahruqi, S.; Robertson, T. Kinematic interpretation and structural evolution of North Oman, Block 6, since the Late Cretaceous and implications for timing of hydrocarbon migration into Cretaceous reservoirs. GeoArabia 2006, 11, 97–140. [Google Scholar]
- Boote, D.R.D.; Mou, D.; Waite, R.I. Structural evolution of the Suneinah Foreland, Central Oman Mountains. Geol. Soc. Lond. 1990, 49, 397–418. [Google Scholar] [CrossRef]
- Mount, V.S.; Crawford, R.I.; Bergman, S.C. Regional structural style of the central and southern Oman Mountains: Jebel Akhdar, Saih Hatat, and the northern Ghaba Basin. GeoArabia 1998, 3, 475–490. [Google Scholar]
- Searle, M.P.; James, N.P.; Calon, T.J.; Smewing, J.D. Sedimentological and structural evolution of the Arabian continental margin in the Musandam Mountains and Dibba zone, United Arab Emirates. GSA Bull. 1983, 94, 1381. [Google Scholar] [CrossRef]
- Hansman, R.J.; Ring, U.; Thomson, S.N.; Brok, B.D.; Stübner, K. Late Eocene Uplift of the Al Hajar Mountains, Oman, Supported by Stratigraphy and Low-Temperature Thermochronology. Tectonics 2017, 36, 3081–3109. [Google Scholar] [CrossRef]
- Al-Kindi, M. Timing, Mechanics and Controls of the Evolution of the Southernmost Part of the Oman Mountains: The Salakh Arch. Geoscience 2020, 10, 95. [Google Scholar] [CrossRef]
- Aldega, L.; Carminati, E.; Scharf, A.; Mattern, F.; Al-Wardi, M. Estimating original thickness and extent of the Semail Ophiolite in the eastern Oman Mountains by paleothermal indicators. Mar. Pet. Geol. 2017, 84, 18–33. [Google Scholar] [CrossRef]
- Moraetis, D.; Scharf, A.; Mattern, F.; Pavlopoulos, K.; Forman, S.L. Quaternary Thrusting in the Central Oman Mountains—Novel Observations and Causes: Insights from Optical Stimulate Luminescence Dating and Kinematic Fault Analyses. Geoscience 2020, 10, 166. [Google Scholar] [CrossRef]
- Van Buchem, F.S.P.; Razin, P.; Homewood, P.W.; Oterdoom, W.H.; Philip, J. Stratigraphic organization of carbonate ramps and organic-rich intrashelf basins: Natih Formation (middle Cretaceous) of northern Oman. AAPG Bull. 2002, 86, 21–53. [Google Scholar] [CrossRef]
- Béchennec, F.; Wyns, R.; Roger, J.; Le Metour, J.; Chevrel, S. Geological Map of Nazwa NF40-07: Scale 1/250,000, Explanatory Notes; Directorate General of Minerals, Ministry of Petroleum and Minerals: Muscate, Oman, 1992. [Google Scholar]
- Storti, F.; Balsamo, F.; Clemenzi, L.; Mozafari, M.; Solum, J.; Swennen, R.; Taberner, C.; Tueckmantel, C.; Al-Kindy, M. Complex fault-fold interactions during the growth of the Jabal Qusaybah anticline at the western tip of the Salakh Arch, Oman. Tectonics 2015, 34, 488–509. [Google Scholar] [CrossRef]
- Corradetti, A.; Spina, V.; Tavani, S.; Ringenbach, J.; Sabbatino, M.; Razin, P.; Laurent, O.; Brichau, S.; Mazzoli, S. Late-stage tectonic evolution of the Al-Hajar Mountains, Oman: New constraints from Palaeogene sedimentary units and low-temperature thermochronometry. Geol. Mag. 2020, 157, 1031–1044. [Google Scholar] [CrossRef]
- Balsamo, F.; Clemenzi, L.; Storti, F.; Mozafari, M.; Solum, J.; Swennen, R.; Taberner, C.; Tueckmantel, C. Anatomy and paleofluid evolution of laterally restricted extensional fault zones in the Jabal Qusaybah anticline, Salakh arch, Oman. GSA Bull. 2016, 128, 957–972. [Google Scholar] [CrossRef]
- Al-Wardi, M.; Butler, R.W.H. Constrictional extensional tectonics in the northern Oman mountains, its role in culmination development and the exhumation of the subducted Arabian continental margin. Geol. Soc. Lond. 2007, 272, 187–202. [Google Scholar] [CrossRef]
- Twiss, R.J.; Moores, E.M. Structural Geology; Freeman: New York, NY, USA, 1992. [Google Scholar]
- Ozkaya, S.I.; Richard, P.D. Fractured Reservoir Characterization Using Dynamic Data in a Carbonate Field, Oman. SPE Reserv. Eval. Eng. 2006, 9, 227–238. [Google Scholar] [CrossRef]
- Donath, A.F.; Parker, R.B. Folds and folding. Geol. Soc. Am. Bull. 1964, 75, 45–62. [Google Scholar] [CrossRef]
- Ramsay, J.G. Folding and Fracturing of Rocks; Mc Graw Hill Book Company: New York, NY, USA, 1967; p. 568. [Google Scholar]
- Midland-Valley. 2DMoveV4.1 and 3DMoveV4.1; Tutorial Books; Midland-Valley: Aiken County, SC, USA, 2004. [Google Scholar]
- Poblet, K.M.J. Geometry and Kinematics of Single-Layer Detachment Folds. AAPG Bull. 1996, 80, 1085–1109. [Google Scholar] [CrossRef]
- Tanner, P.G. The flexural-slip mechanism. J. Struct. Geol. 1989, 11, 635–655. [Google Scholar] [CrossRef]
- Woodward, N.B. Low-amplitude evolution of break-thrust folding. J. Struct. Geol. 1997, 19, 293–301. [Google Scholar] [CrossRef]
- Gutierrez-Alonso, G.; Gross, M.R. Structures and mechanisms associated with development of a fold in the Cantabrian Zone thrust belt, NW Spain. J. Struct. Geol. 1999, 21, 653–670. [Google Scholar] [CrossRef]
- Hobbs, B. The analysis of strain in folded layers. Tectonophysics 1971, 11, 329–375. [Google Scholar] [CrossRef]
- Epard, J.L.; Groshong, R.H., Jr. Kinematic model of detachment folding including limb rotation, fixed hinges and layer-parallel strain. Tectonophysics 1995, 247, 85–103. [Google Scholar] [CrossRef]
- Mobasher, K.; Babaie, H.A. Kinematic significance of fold- and fault-related fracture systems in the Zagros mountains, southern Iran. Tectonophysics 2008, 451, 156–169. [Google Scholar] [CrossRef]
- Cooper, M. The analysis of fracture systems in subsurface thrust structures from the Foothills of the Canadian Rockies. In Thrust Tectonics; Chapman and Hall: London, UK, 1992; pp. 391–405. [Google Scholar]


| Area No. | Bedding Plane, Dip/Dip Direction | <Orientation> of Sets | No. of Fractures | <Aperture> mm | <Length> m of Some Sets | <Dip>/Dip Direction of Some Fracture Sets | Complete/Partial Filling |
|---|---|---|---|---|---|---|---|
| 1 | 04/111 | 205 | 80 | 6 | 10 | 84/W | Comp/part |
| 263 | 21 | 5 | Comp/part | ||||
| 2 | 05/123 | 235 | 36 | 4 | 6 | Comp | |
| 138 | 33 | 4 | 5 | 76/NE | Comp | ||
| 268 | 9 | 4 | Comp | ||||
| 3 | 05/161 | 141 | 24 | 11 | Comp/part | ||
| 257 | 4 | 5 | Comp/part | ||||
| 203 | 27 | 4 | Comp | ||||
| 4 | 07/092 | 213 | 71 | 6 | 8 | Comp | |
| 147 | 25 | 3 | 4 | Comp | |||
| 5 | 02/062 | 258 | 73 | 6 | 22 | 77/S | Comp |
| 211 | 21 | 7 | 9 | 81/W | Comp/part | ||
| 6 | 31/037 | 191 | 65 | 8 | 20 | 73/W | Comp/part |
| 266 | 144 | 6 | 63/S | Comp/part | |||
| 132 | 18 | 9 | Comp | ||||
| 7 | 07/060 | 182 | 82 | 5 | 66/W | Comp/part | |
| 266 | 31 | 3 | Comp | ||||
| 244 | 29 | 3 | Comp | ||||
| 8 | 01/054 | 216 | 28 | 5 | 70/W | Comp/part | |
| 274 | 19 | 3 | 78/S | Comp | |||
| 9 | 02/128 | 183 | 19 | 4 | 75/W | Comp | |
| 253 | 31 | 4 | 7 | 84/N | Comp | ||
| 139 | 5 | 4 | Comp | ||||
| 10 | 06/152 | 170 | 55 | 5 | 9 | Comp | |
| 240 | 35 | 3 | 8 | 81/W | Comp | ||
| 273 | 7 | 7 | Comp | ||||
| 11 | 09/169 | 226 | 7 | 5 | 58/NW | Comp | |
| 290 | 21 | 7 | 15 | 77/N | Comp | ||
| 158 | 22 | 4 | 75/W | Comp/part | |||
| 261 | 22 | 4 | 75/N | Comp | |||
| 12 | 05/142 | 188 | 65 | 4 | 12 | 74/W | Comp/part |
| 245 | 19 | 4 | 82/N | Comp | |||
| 130 | 7 | 3 | 77/N | Comp | |||
| 13 | 06/079 | 193 | 46 | 3 | 5 | 71/W | Comp |
| 252 | 16 | 3 | Comp | ||||
| 132 | 11 | 3 | 5 | Comp | |||
| 14 | 26/015 | 195 | 75 | 6 | 9 | 88/W | Comp |
| 287 | 60 | 5 | 11 | 57/S | Comp | ||
| 15 | 03/086 | 189 | 49 | 4 | 5 | 82/W | Comp |
| 252 | 39 | 4 | 12 | 77/N | Comp | ||
| 139 | 10 | 13 | Comp/part | ||||
| 16 | 09/184 | 187 | 79 | 6 | 8 | 84/E | Comp |
| 271 | 26 | 6 | 7 | 75/N | Comp/part | ||
| 17 | 16/185 | 182 | 60 | 5 | 8 | 80/E | Comp |
| 264 | 32 | 4 | 5 | 74/N | Comp | ||
| 18 | 19/201 | 146 | 33 | 9 | 5 | 72/E | Comp/part |
| 194 | 30 | 13 | 8 | 69/E | Comp/part | ||
| 229 | 29 | 6 | 7 | 79/NW | Comp | ||
| 19 | 10/219 | 159 | 70 | 5 | 10 | 79/NE | Comp |
| 196 | 17 | 5 | 75/E | Comp | |||
| 244 | 11 | 4 | 83/N | Comp | |||
| 20 | 13/235 | 235 | 37 | 6 | 17 | 86/NW | Comp/part |
| 113 | 26 | 6 | 11 | Comp/part | |||
| 174 | 33 | 8 | 83/E | Comp/part | |||
| 21 | 11/253 | 186 | 100 | 8 | 7 | 70/E | Comp/part |
| 289 | 18 | 6 | 70/N | Comp | |||
| 22 | 07/265 | 191 | 48 | 14 | 21 | 75/E | Comp/part |
| 252 | 8 | 4 | 6 | 84/N and S | Comp | ||
| 229 | 30 | 6 | 11 | 82/W | Comp | ||
| 23 | 12/320 | 197 | 99 | 9 | 74/E | Comp/part | |
| 261 | 53 | 5 | 66/S | Comp | |||
| 143 | 18 | 3 | 70/NE | Comp | |||
| 24 | 32/353 | 191 | 82 | 7 | 5 | 68/E | Comp/part |
| 277 | 39 | 6 | 55/S | Comp/part | |||
| 25 | 20/003 | 210 | 40 | 4 | 8 | 78/E | Comp |
| 266 | 54 | 5 | 8 | 68/S | Comp/part | ||
| 177 | 5 | 4 | 6 | 80/E | Comp | ||
| 26 | Dip is 0 | 241 | 26 | 3 | 83/S | Comp | |
| 157 | 10 | 3 | 8 | 80/E | Comp | ||
| 284 | 5 | 3 | 5 | 81/S | Comp | ||
| 27 | 09/205 | 169 | 34 | 5 | 83/E | Comp/part | |
| 260 | 21 | 4 | 78/N | Comp/part | |||
| 124 | 14 | 4 | 70/NE | Comp/part | |||
| 28 | 11/187 | 137 | 56 | 6 | 72/NE | Comp/part | |
| 198 | 13 | 11 | Comp/part | ||||
| 250 | 11 | 10 | 70/N | Comp/part | |||
| 29 | 07/194 | 172 | 34 | 8 | 75/E | Comp/part | |
| 260 | 26 | 4 | Comp/part | ||||
| 128 | 12 | 6 | 80/NE | Comp | |||
| 30 | 01/350 | 183 | 106 | 12 | 71/E | Comp/part | |
| 270 | 15 | 7 | Comp/part | ||||
| 31 | 14/010 | 189 | 45 | 4 | 9 | 81/S | Comp/part |
| 278 | 78 | 4 | 8 | Comp | |||
| 32 | 13/334 | 135 | 91 | 6 | 13 | 73/SW | Comp |
| 258 | 27 | 7 | 87/S | Comp/part | |||
| 33 | 03/347 | 155 | 92 | 8 | 13 | 80/E | Comp/part |
| 252 | 21 | 3 | Comp | ||||
| 34 | 07/241 | 148 | 56 | 7 | 74/NE | Comp/part | |
| 256 | 26 | 6 | 13 | 82/N | Comp/part | ||
| 35 | 18/323 | 150 | 110 | 7 | 10 | 85/E | Comp |
| 271 | 55 | 5 | 20 | 67/S | Comp |
Publisher’s Note: MDPI stays neutral with regard to jurisdictional claims in published maps and institutional affiliations. |
© 2020 by the author. Licensee MDPI, Basel, Switzerland. This article is an open access article distributed under the terms and conditions of the Creative Commons Attribution (CC BY) license (http://creativecommons.org/licenses/by/4.0/).
Share and Cite
Al-Kindi, M.H.N. Understanding the Relationship between Large-Scale Fold Structures and Small-Scale Fracture Patterns: A Case Study from the Oman Mountains. Geosciences 2020, 10, 490. https://doi.org/10.3390/geosciences10120490
Al-Kindi MHN. Understanding the Relationship between Large-Scale Fold Structures and Small-Scale Fracture Patterns: A Case Study from the Oman Mountains. Geosciences. 2020; 10(12):490. https://doi.org/10.3390/geosciences10120490
Chicago/Turabian StyleAl-Kindi, Mohammed H. N. 2020. "Understanding the Relationship between Large-Scale Fold Structures and Small-Scale Fracture Patterns: A Case Study from the Oman Mountains" Geosciences 10, no. 12: 490. https://doi.org/10.3390/geosciences10120490
APA StyleAl-Kindi, M. H. N. (2020). Understanding the Relationship between Large-Scale Fold Structures and Small-Scale Fracture Patterns: A Case Study from the Oman Mountains. Geosciences, 10(12), 490. https://doi.org/10.3390/geosciences10120490