Abstract
The earthquake environmental effects (EEEs) around the epicentral area of the Pohang earthquake (Mw-5.4) that occurred on 15 November 2017 have been collected and classified using the Environmental Seismic Intensity Scale (ESI-07 scale) proposed by the International Union for Quaternary Research (INQUA) focus group. The shallow-focus 15 November Pohang earthquake did not produce any surface rupture, but caused extensive secondary environmental effects and damage to life-line structures. This earthquake was one of the most damaging earthquakes during the instrumental seismic era of the Korean Peninsula. The EEEs included extensive liquefaction, ground cracks, ground settlement, localized rockfall, and variation of the water table. The main objective of this paper was to carry forward a comparative assessment of the Pohang earthquake’s intensity based on traditional macroseismic scales and the ESI-07 scale. With that objective, this study will also make a substantial contribution to any future revision of the ESI-07 scale, which mostly comprises case studies from Europe and South America. The comparison of the ESI-07 scale with traditional intensity scales similar to the intensity scale used by the Korean Meteorological Administration for the epicentral areas showed 1–2-degree differences in intensity. Moreover, the ESI scale provided a clearer picture of the intensity around the epicentral area, which is mostly agricultural land with a lack of urban units or buildings. This study urges the integration of the traditional and ESI-07 scale for such small magnitude earthquakes in the Korean Peninsula as well as around the world in future. This will predict seismic intensity more precisely and hence provide a more-effective seismic hazard estimation, particularly in areas of low seismic activity. The present study will also provide a useful and reliable tool for the seismic hazard assessment of similar earthquakes around the study area and land-use planning at a local scale considering the secondary effects.
1. Introduction
The 12-degree Environmental Seismic Intensity (ESI-07) scale was introduced by the International Union for Quaternary Research (INQUA) in 2007 and is mainly based on earthquake environmental effects (EEEs). The EEEs generated by moderate-to-large earthquakes can be classified as primary or secondary effects [1]. The ESI-07 scale mainly considers the size and aerial distribution of EEEs such as surface rupture, land subsidence or upliftment, tsunami, landslides, and ground failure, liquefaction, and hydrological anomalies [1,2,3,4,5,6]. The ESI-07 scale provides a novel approach to quantify the size of various EEEs during moderate-to-large magnitude earthquakes and can be used as an effective tool for assessing macroseismic intensities [1,7]. Several studies suggest that the use of the ESI-07 scale was introduced to cover the gap of some of the traditional intensity scales such as the European Macroseismic Scale (EMS-98), which generally excludes the EEEs in assessing seismic intensity [1,8,9]. Furthermore, the ESI-07 intensity scale can enhance the geologic time window in the order of several to tens of kyr by incorporating paleoseismic analysis into macroseismic studies [1,8,9,10]. The ESI-07 values are more accurate because of the scale’s quantitative nature and its consideration of the local geology, geotechnical, and morphological condition of the site to determine the intensity [8,11,12,13]. The ESI-07 scale has an additional advantage over other traditional intensity scales as the EEEs are not influenced by human-induced factors like damage to human-built structures. A traditional intensity scale such as the Modified Mercalli intensity scale (MM) [14], the European macroseismic scale (EMS-98) [15], or the intensity scale used by the Korea Meteorological Administration (KMA) [16] use damage to human-built structures to assess intensity, which mainly reflects the cultural and economic development of the area instead of the strength of the earthquake, which is one of the major setbacks for the use of traditional intensity scales in seismic hazard assessment for an area [12,17,18]. To overcome this problem in traditional intensity scales, several studies have compiled EEEs from diverse tectonic settings, geological settings, and earthquakes of diverse origin and proposed the ESI-07 intensity scale under the framework of INQUA [1,3,4,17,19,20,21]. Several case studies have been reported in the literature of estimating the seismic intensity for historical and modern seismic events around the globe [10,16,21,22,23,24,25,26]. Despite having the upper hand over traditional intensity scales, the ESI-07 scale only has a limited number of entries from Asia or Central Asia [9,25,27].
Nevertheless, the ESI-07 has some problems that remain unsolved to date, which can be overcome with a larger number of case studies from diverse tectonic settings, geological settings, earthquake mechanism, and distribution of EEEs [23,25,28,29,30]. In this respect, the applicability of the ESI-07 intensity scale has been tested for the most damaging earthquake during the modern seismic era of the Korean Peninsula. The ESI-07 scale has a similar basic structure as other 12-degree intensity scales like the Mercalli-Cancani-Sieberg scale (MCS), MM, Medvedev–Sponheuer–Karnik scale (MSK), KMA, and EMS-98. The ESI-07 scale allows one to estimate the intensity when the traditional intensity scale saturates (i.e., for intensity X-XII). To overcome this problem, in the present work, an attempt has been made to derive the ESI-07 intensity from the recorded secondary effects of the 15 November Pohang earthquake and compare it with the traditional intensity scale. This will be the first-ever case study from the Korean Peninsula. The results obtained indicate that the ESI-07 scale intensity is higher than the traditional intensity scale, which will help in making a more precise seismic hazard estimation, particularly in areas of low seismic activity.
2. Geological and Tectonic Framework
The southern part of the Korean Peninsula sits on the Eurasian Plate, whose tectonic activity is controlled by the ongoing subduction of the adjacent Pacific and Philippine Sea Plate and the collision of the Indian plate with the Eurasian plate (Figure 1). Most of the tectonic deformation during the Cenozoic Era is accommodated by the two major fault systems, the Yangsan and Ulsan Faults (Figure 1), along with crustal deformations along the eastern block of the Yangsan Ulsan Fault System.
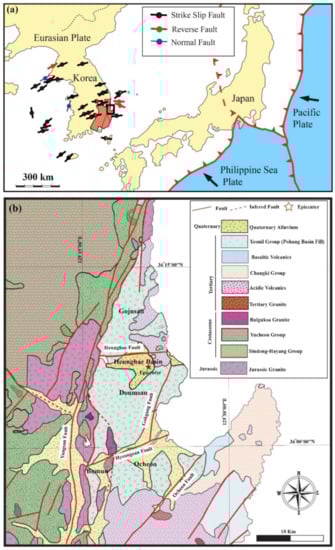
Figure 1.
(a) Regional tectonic map of the study area. Bars indicate the maximum stress directions with major faulting type using past earthquakes of Mw ˃ 3 (earthquake data taken from 1996 to 2014); black box shows the study area. (b) Geological and tectonic map of the study area showing the epicentral location of the 15 November 2017 Pohang earthquake with major fault lines (modified from [31]).
During the post Oligocene, the eastern block of the Yangsan–Ulsan Fault System drifted southeast and resulted in several NE–SW trending extensional faults with extensional basins [31,32,33]. The epicentral area of the Pohang earthquake is one of those basins, mostly composed of ~900-m-thick middle Miocene sedimentary rocks [34,35]. Since the Pliocene Epoch, the regional stress field has changed from extension to compression, resulting in the reactivation of preexisting normal faults to strike-slip or reverse faults [31,36]. In recent years, several (~60) instances of surface ruptured earthquakes have been documented along the Yangsan–Ulsan Fault System. The two recent damaging earthquakes along southeast Korea (i.e., the 2016 Gyeongju earthquake and the 2017 Pohang earthquake) also occurred along the Yangsan–Ulsan Fault System [35]. The seismically induced damage during these two earthquakes established a need for a proper seismic hazard assessment of the area.
3. 15 November 2017 Pohang Earthquake
The Pohang earthquake (Mw 5.4) was the second largest instrumentally recorded earthquake along southeast Korea. The earthquake occurred in Pohang (36.065° N, 129.269° E) at 2:29 p.m. local time on 15 November 2017. The mainshock was followed by two significant aftershocks of magnitude Mw 3.6 (on 19 November 2017) and Mw 4.6 (on 11 February 2018). The maximum peak ground acceleration (PGA) observed was about 0.58 g. The nearest seismic station (PHA2) located 9.3 km from the epicenter shows a recorded PGA of 0.268 g (Figure S1, Supplementary Materials), which is very large and almost equivalent to the MM of VIII to IX [15]. The earthquake originated along a NE–SW striking reverse dominant oblique-slip fault with a focal depth of about 4–6 km (Figure 2). The post-disaster loss estimation made by the Ministry of the Interior and Safety, South Korea, reported that the Pohang earthquake caused injuries to more than 90 people and caused damage to 2165 private houses, 227 school buildings, many roads, and 11 bridges. The estimated property damage was about US$75.8 million. This was the largest damaging earthquake reported since 1978. The instrumental intensity and intensity based on earthquake-induced damage reported by the KMA [15] suggest an intensity of V–VIII for the mainshock of the Pohang earthquake (Figure 3). There was no surface rupture reported during the Pohang earthquake, and several secondary effects such as liquefaction, lateral spreading, and ground cracks were reported. This was the first-ever earthquake in which EEEs were directly witnessed and assessed directly in the field and using high-resolution satellite images. This may serve as useful information in understanding the distribution of EEEs around the epicentral area and assessing the ESI-07 intensity for any earthquake from the Korean Peninsula and further use of the ESI-07 intensity scale for other historical earthquakes.
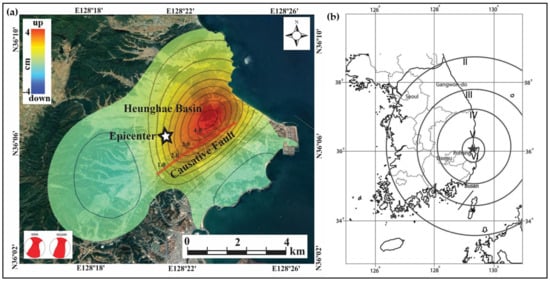
Figure 2.
InSAR data showing (a) the deformation caused by the Pohang earthquake along with the causative fault for the earthquake; (b) Modified Mercalli intensity scale (MM) map (source: https://earthquake.usgs.gov/earthquakes/eventpage/us2000bnrs/executive; last assessed: 15 October 2020) showing the intensity distribution for the Pohang earthquake (InSAR data are taken from http://sar.kangwon.ac.kr/pohang.htm).
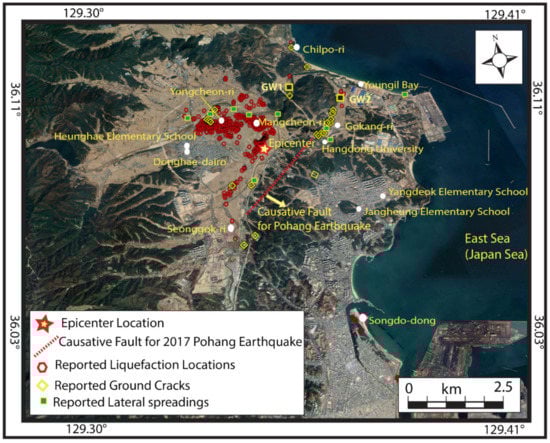
Figure 3.
Distribution of secondary effects caused by the Pohang earthquake. The red polygon indicates the reported liquefaction locations (taken from field survey and satellite images), whereas the yellow squares indicate the location of reported ground cracks/lateral spreading during the 2017 Pohang earthquake (modified from [33,35]).
4. Seismic Effects of Pohang Earthquake
Several EEEs were induced by the Pohang earthquake around the epicentral area, which is known as the Heunghae Basin. A significant part of the Heunghae Basin is mainly agricultural land used for rice farming. Most of the EEEs were observed around these rice farms. To avoid the destruction of the secondary effects due to post-earthquake farming or erosional processes, several researchers [33,35,37,38] observed and mapped those features. There was no evidence of primary surface rupture reported for the earthquake [35]. The InSAR data show about 4-cm uplift/easting displacement near the epicenter [35].
We have classified the other coseismic effects as secondary effects that include ground cracks, liquefaction, lateral spreading, and rockfall. Except for liquefaction and ground cracks, lateral spreading and rockfalls were more localized. In this paper, we mainly considered the liquefaction and ground cracks for the estimation of ESI-07 intensity based on guidelines provided by Michetti et al. [1]. Based on the total area affected by the secondary EEEs, the localized ESI-07 intensity was estimated for the Pohang earthquake.
4.1. Primary Effects
During the Pohang earthquake, no direct evidence of primary effects such as surface rupture was found. The InSAR data indicate that the hanging-wall side of the causative fault shows a 3–4-cm displacement for a length of 2–4 km (Figure 2, [35]).
4.2. Secondary Effects
The secondary effects were due to strong shaking and mostly include soft sediment deformations such as liquefaction, lateral spreading, and ground cracks, with occasional rockfalls in the mountainous region around the epicentral area [33,35,37,38] (Figure 3).
4.2.1. Liquefaction and Ground Settlement
Extensive liquefaction was observed around the epicentral area of the 2017 Pohang earthquake. Around 350 liquefaction features were mapped during the post-earthquake survey. The fact that most of the sand boils were confined to the rice farms between the Gokgang and Chogok Rivers may be due to the presence of loose saturated Quaternary deposits. The liquefaction features were mapped during the reconnaissance survey immediately after the earthquake, and some of the liquefaction features were mapped using high-resolution unmanned aerial vehicle (UAV) images.
The farthest observed liquefaction feature was located 15 km from the epicenter. Since it was not possible to cover all the areas experiencing liquefaction, several researchers [33,35] combined field-mapping techniques with high-resolution satellite images to map the liquefaction features. In total, around 600 liquefaction features were observed during the earthquake (Figure 3).
Two types of liquefaction features were observed during the post-earthquake field survey. During the field work, we measured the orientation, diameter, and length of the sand boils. Some of them were linear, whereas others were isolated and circular. The linear-pattern sand boils were between a few centimeters and more than 70 m in length, with the sand boil diameter varying from less than 10 cm to more than 1 m. The linear sand boils were subparallel to sub-perpendicular to the presumed causative fault of the Pohang earthquake [35,37]. The circular and isolated sand boils were between a few centimeters and more than 2 m in diameter. In general, the sand boils showed two preferable orientations: NNE–SSW and NE–SW. Figure 4 shows some of the typical liquefaction features observed in the field. Most of the liquefaction features were observed around the Youngcheon-ri and Mangcheon-ri area. Some locations such as near Yangdeok Elementary School, Jangheung Elementary School, Heunghae Elementary School grounds, and Youngil Bay 3rd Industrial Complex showed ground settlement varying from 5 to 40 cm (Figure 3).
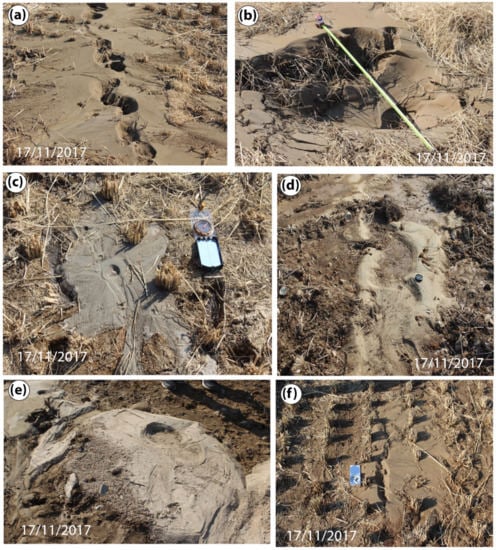
Figure 4.
Field photos from Youngcheon-ri and Mangcheon-ri showing (a) linear sand boils as a chain; (b) isolated sand boil of around 2-m diameter; (c) small isolated and circular sand boil of around 60–70-cm diameter; (d,e) lenticular and circular sand boil showing evidence of sand and gravel mixture ejection; and (f) ejected sand boils through the cracks.
4.2.2. Ground Cracks
Apart from extensive liquefaction, ground cracks were one of the other widespread secondary EEEs around a radius of 3 km from the epicenter. Most of the ground cracks were concentrated along the eastern part of the epicentral area. During our post-earthquake field survey, we observed that most of the cracks were concentrated along the mountainous areas and rice farms.
Some of the ground cracks in the rice farms were accompanied by coexistent liquefaction features. Several cases of ground cracks of varying dimensions were observed near Hangdong University, Gokgang 2-ri, Youngil Bay Industrial area, and Youngcheon-ri, Mangcheon-ri. Near Hangdong University (Figure 3), the rice farms showed an upliftment of 1.5 m, whereas several ground cracks varying from 2 cm to more than 5 cm in width were observed. One reclaimed land site near Hangdong University showed ground cracks of several meters in length, 20–30 cm in width, and vertical displacement of 20 cm with a preferred orientation of NE–SW. Similarly, near Gogang-ri and Youngil Bay Industrial area, ground cracks of more than 10 m long and 1–3 cm wide were observed. Around Youngcheon-ri and Mangcheon-ri (Figure 3), several ground cracks were observed in the rice farms as well as contact between the concrete water passage and rice farms of varying dimensions. Most of the cracks were a few tens of meters long and 1–5 cm wide. Some of the typical ground cracks observed during the Pohang earthquake around the epicentral area are shown in Figure 5.
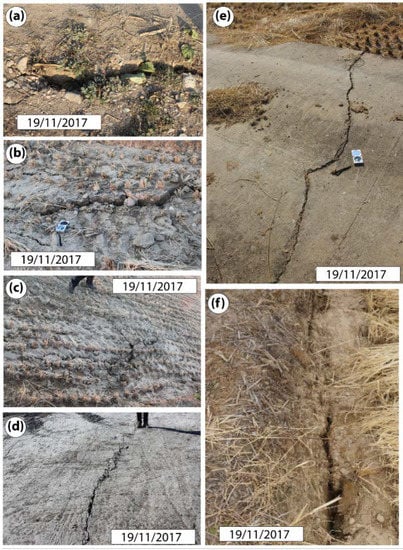
Figure 5.
Field photos showing the observed ground cracks during the 2017 Pohang earthquake; (a) observed ground crack along the embankment of rice field around Yongjeon-ri; (b–d) ground cracks observed near Hangdong University. The ground cracks were around several meters in length, with a few centimeters to more than 20-cm vertical displacement; (e) crack 2–7-cm wide observed along a concrete road near Mangcheon-ri; (f) observed ground cracks in the rice farm around Mangcheon-ri.
4.2.3. Lateral Spreading
Several cases of lateral spreading were observed after the Pohang earthquake around the epicentral area. Most of the lateral spreading was confined to the levees, shorelines, and reclaimed lands for construction purposes, road embankments with soft soil, and some portions of agricultural land (Figure 6).
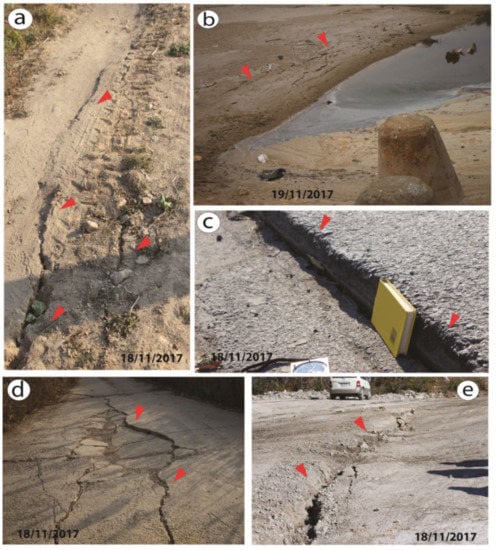
Figure 6.
Field photographs showing evidence of lateral spreading observed around the epicentral area of the Pohang earthquake; (a) lateral spreading observed along an embankment of a canal near Yongjeon-ri; (b) evidence of lateral spreading along a sandy beach near Youngil Bay Port; (c) differential settlement due to lateral spreading along a pavement road near Hangdong University; opening of cracks of an embankment near Mangcheon-ri; (d) series of cracks due to slope failure along a concrete road in Mangcheon-ri; and (e) wide openings due to lateral spreading along a reclaimed land site near Hangdong University.
The observed ground cracks and lateral spreading were directly associated with ground shaking and site effects. During the post-earthquake survey, we observed the lateral spreading of varying dimensions around Youngcheon-ri, Mangcheon-ri, Gokgang 2-ri, Handong University, and Youngil Bay Port (Figure 6). In general, the size of the lateral spreading varied from the meter scale to tens of meters. The lateral spreading around Youngil Bay port caused vertical displacement of about 6 cm with horizontal displacement of 7–8 cm. The horizontal displacement of lateral spreading was about 4–6 cm around Gokgang-ri, whereas lateral spreading caused horizontal displacement of about 3 cm near Hangdong University. Near Youngcheon-ri and Mangcheon-ri (Figure 3), lateral spreading was about 2–10 m long with 3–5 cm horizontal displacement.
4.2.4. Rockfall
Several cases of rockfall and land creeping were observed around Heungan-ri, Deoksu Dong, and Yongheung-dong, which were located 3–9 km from the epicenter. Although the volume of sliding material was small (≤103 m3), the eyewitness and post-earthquake field survey suggested that it was caused by the ground shaking. The creep meter installed by the Korea Forest Service near Yongheung-dong suggested that the land creep was about 6.67 cm during the earthquake.
4.2.5. Water-Level Fluctuations
During our post-earthquake field survey, we noted that several rice farms were filled with water between Gokgang River and Chogok River [33]. The waterlogging at several rice farms lasted for several days after the earthquake. Some studies reported a rise/fall in water level of about 0.3–0.5 m recorded by the ground water monitoring station located within 3–4 km radius of the epicenter soon after the earthquakes [33]. The ground water monitoring stations are maintained by www.groundwater.or.kr. Field photographs showing waterlogged rice farms soon after the earthquake are presented in Figure 7.
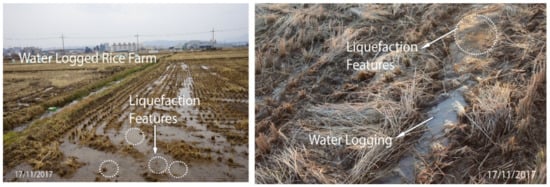
Figure 7.
Field photographs showing evidence of waterlogging along the rice farms around Mangcheon-ri near the 2017 Pohang earthquake epicentral area soon after the earthquake.
5. Estimation of ESI-07 Intensity and Comparison with KMA and MM Intensity Scales
To determine the intensity of the earthquake and determine the ESI-07 intensity for the epicentral area of the 2017 Pohang earthquake, we considered all the secondary EEEs, which covered an area of 200 km2. The ESI-07 intensities were estimated using the INQUA ESI-07 intensity scale guidelines [1]. Local ESI-07 intensities were assessed for 282 localities (Tables S1 and S2, Supplementary Materials), which shows different types of EEEs (liquefaction, ground cracks, rockfalls, and rise in water level) of varying dimensions. Using these features, an ESI-07 intensity map was developed for the study area that showed that the ESI-07 intensity varied from VI to VIII. On the basis of dimensions measured in the field and from high-resolution UAV images taken soon after the earthquake, areas within the Heunghae Basin such as Namsong Ri, Mangcheon-ri, Heungan-ri, and Yongcheon-ri had ESI-07 intensity values of VI–VIII, whereas areas such as Yakseong-ri, Masan-ri, Chilpo-ri, Gokang-ri, Namsong-ri, Yangdeok-dong, Jangseong-dong, Hangdong University, and Youngil Bay port had an ESI-07 intensity of VI–VII (Figure 8). The estimated ESI-07 intensity values for the 2017 Pohang earthquake were compared with the KMA intensity values (Figure S1, Supplementary Materials), which are based on damage to human-built structures, as with other traditional intensity scales adopted by other countries. The KMA intensity values were similar to the intensity values derived from reported EEEs, whereas MM intensity values were 1–2 degrees lower than the ESI-07 intensity values for the Pohang earthquake (Figures S2 and S3, Tables S1 and S2, Supplementary Materials). This may be because the MM intensity used here was taken from the USGS, which is estimated from the estimated PGA and PGV and is not calibrated according to the damage survey, whereas KMA intensity is calibrated to the local geology and damage observed during the earthquake. This could be one of the main reasons why MM intensity values were lower than the ESI-07 and the KMA intensity values. Although the general KMA intensity scale and ESI-07 intensity estimates for each area were almost in agreement, the geographical distribution of the assessed sites was different. The intensity estimation indicates that MM intensity was lower than the KMA intensity, which may be because the structures in Korea are more vulnerable to a similar earthquake magnitude to the structures in the United States. This result confirms the validity of the ESI scale and its value to obtain a more complete and reliable picture of intensity distribution, especially for an intraplate earthquake where earthquake recurrence is very long and the historical records are incomplete, and for the areas with a smaller population and limited structural damage data. The present study supports the idea that KMA intensity values combined with ESI-07 intensity can be used for a better seismic hazard estimation for the study area and adjoining areas with similar earthquake hazard potential than MM intensity.
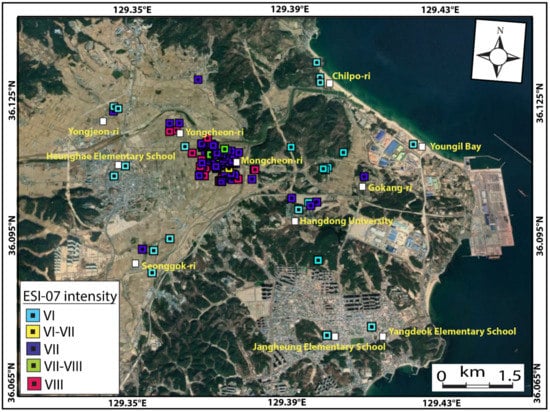
Figure 8.
ESI (environmental seismic intensity) scale map for the epicentral region of the 2017 Pohang earthquake which shows ESI-07 scale value, which ranges from VI to VIII. Different colored squares show the different ESI-07 values derived from the recorded earthquake environmental effects (EEEs).
6. Discussion and Conclusions
The earthquake induced ground effects caused by the 15 November 2017 Pohang earthquake on the natural environment were characterized and documented. From the distribution of EEEs, it was clear that the local geology plays a major role in damage distribution. This raises concerns for areas with unconsolidated soil deposits and potential areas for liquefaction or areas having potential for slope failure. Therefore, the compilation and documentation of ground effects emerge as a very useful tool in seismic hazard assessment, particularly in land-use planning for sites for future urban centers or areas with critical life-line facilities [27,39,40,41].
There was no manifest surface primary rupture that occurred during this earthquake. The InSAR data showed an upliftment of 3–4 cm along the causative fault, which might have caused the Pohang earthquake. The secondary effects include widespread liquefaction, ground cracks, and lateral spreading associated with the Pohang earthquake. Other localized ground effects were rockfall and hydrological anomalies including the temporary rise or fall in ground water level and waterlogging of rice farms of local character.
The seismic intensity determined by the KMA (Supplementary Materials, Figure S2) for the Pohang earthquake, which is mainly based on structural damage, as with other traditional intensity scales such as MM, MMI, and EMS98 suggests that the maximum intensity was V–VIII. The ESI-07 intensity using the secondary effects predicts a maximum intensity of VI–VIII, which is similar to the KMA seismic intensity, whereas the ESI-07 intensity shows 1–2-degree higher intensity values than MM intensity. This may be due to the traditional scale depending on structural damage, whereas the epicentral area is mainly covered by agricultural land and a lack of human-built structures.
By reassessment of the Pohang earthquake with the ESI-07 scale, we introduced a scale that is solely based on EEEs along with the traditional intensity scales to better assess seismic hazard in the Korean Peninsula.
From the above, it became apparent that the ESI-07 scale worked toward reducing the discrepancies between intensity estimation based on environmental effects and structural damage based on seismic intensity estimation, which is mainly influenced by human parameters such as effects on human environments. Thus, the integration of the ESI-07 scale with traditional intensity scales such as KMA provided a complete picture of the strength and effects of the 2017 Pohang earthquake on natural and human environments of the epicentral area. Moreover, the ESI-07 intensity scale has contributed to a better picture of earthquake damage and represents a useful tool for seismic hazard assessment, land-use planning, community preparedness, and response planning for managing a future event of similar or higher intensity.
Furthermore, the application of the ESI-07 intensity scale to the Pohang earthquake contributes to testing the relevance of the ESI-07 scale to small-magnitude earthquakes in an intraplate region and provides a comparison not only of earthquakes of different tectonic settings but also of future, recent, and historical earthquakes that are already known to occur along the southeast of the Korean Peninsula. The use of the ESI-07 intensity scale and EEEs for seismic intensity estimation offers a higher spatial resolution and application to historical earthquakes, providing that they share the same space and geology. In future, this could be applied to other historical earthquakes that occurred around the southern region of the Korean Peninsula. This approach will improve the Korean earthquake catalogue, and the inclusion of paleo EEEs will expand the timeframe for analyzing damaging earthquakes and their intensity along the southern region of the Korean Peninsula. Hence, the paleoseismology and re-evaluation of ground effects of historical damaging earthquakes should be thoroughly studied to improve the seismic hazard estimation of the Korean Peninsula and other intraplate regions that do not have a complete record of historical seismicity.
Supplementary Materials
The following are available online at https://www.mdpi.com/2076-3263/10/11/471/s1, Figure S1: The recorded ground motion data at PHA2 seismic station from the epicenter which shows PGA value of 0.268 g. The seismic station was located at 9.3 km north of the epicenter. Figure S2: Korean Meteorological Administration (KMA) Intensity map showing the observed seismic intensity around the epicentral area of 2017 Pohang earthquake (Modified from [15]). Figure S3. Map showing the ESI-07 intensity derived from observed EEEs and MM intensity contours for the 2017 Pohang earthquake. Table S1: Estimation of ESI-07 intensity based on EEEs such as liquefaction features (mainly liquefaction) for the 2017 Pohang earthquake. Table S2. Estimation of ESI-07 intensity based on EEEs such as ground cracks and rockfall for the 2017 Pohang earthquake. The MM intensity contours were taken from USGS (https://earthquake.usgs.gov/earthquakes/eventpage/us2000bnrs/executive; Last assessed: 15 October 2020), whereas the InSAR data were taken from Prof. Hoonyol Lee, Division of Geology and Geophysics, Kangwon National University (http://sar.kangwon.ac.kr/pohang.htm; last assessed 15 October 2020).
Author Contributions
In the present research, S.P.N., O.G., K.P., K.J. and J.-B.K. analyzed the field data; S.P.N. and S.P. developed the idea and prepared the manuscript. Y.-S.K. encouraged us and supervised the findings of this work with continuous technical inputs during the preparation of the manuscript. All authors have read and agreed to the published version of the manuscript.
Funding
This research was supported by Korea Institute of Energy Technology Evaluation and Planning (KETEP) and the Ministry of Trade, Industry & Energy (MOTIE) of the Republic of Korea (No. 20201510100020).
Acknowledgments
The authors are grateful to the Ministry of Interior and Safety (MOIS, Korea) for supporting the post-earthquake field survey to collect the liquefaction data. We are thankful to Hoonyol Lee, Department of Geophysics, Kangwon National University, Korea for providing us with the InSAR data.
Conflicts of Interest
The authors declare no conflict of interest.
References
- Michetti, A.M.; Esposito, E.; Guerrieri, L.; Porfido, S.; Serva, L.; Tatevossian, R.; Vittori, E.; Audemard, F.; Azuma, T.; Clague, J.; et al. Environmental Seismic Intensity Scale 2007—ESI 2007. In Memorie Descrittive Della Carta Geologica d’Italia, Servizio Geologico d’Italia—Dipartimento Difesa del Suolo; APAT: Roma, Italy, 2007; Volume 74, pp. 7–54. Available online: http://www.isprambiente.gov.it/en/publications/technical-periodicals/descriptive-memories-of-the-geological-map-of/intensity-scale-esi-2007?set_language=en (accessed on 8 July 2020).
- Michetti, A.M.; Esposito, E.; Gurpinar, A.; Mohammadioun, B.; Mohammadioun, J.; Porfido, S.; Rogozhin, E.; Serva, L.; Tatevossian, R.; Vittori, E.; et al. The INQUA scale: An innovative approach for assessing earthquake intensities based on seismically induced ground effects in natural environment. Sp. Pap. Mem. Descr. Carta Geol. da’ Ital. 2004, LXVII, 118. [Google Scholar]
- Porfido, S.; Esposito, E.; Guerrieri, L.; Vittori, E.; Tranfaglia, G.; Pece, R. Seismically induced ground effects of the 1805, 1930 and 1980 earthquakes in the Southern Apennines, Italy. Boll. Della Soc. Geol. Ital. 2007, 126, 333–346. [Google Scholar]
- Serva, L.; Esposito, E.; Guerrieri, L.; Porfido, S.; Vittori, E.; Comerci, V. Environmental effects from some historical earthquakes in Southern Apennines (Italy) and macroseismic intensity assessment. Contribution to INQUA EEE scale project. Quat. Int. 2007, 173–174, 30–44. [Google Scholar] [CrossRef]
- Serva, L.; Vittori, E.; Comerci, V.; Esposito, E.; Guerrieri, L.; Michetti, A.M.; Mohammadioun, B.; Mohammadioun, G.C.; Porfido, S.; Tatevossian, R.E. Earthquake Hazard and the Environmental Seismic Intensity (ESI) Scale. Pure Appl. Geophys. 2015, 173, 1479–1515. [Google Scholar] [CrossRef]
- Papathanassiou, G.; Valkaniotis, S.; Ganas, A.; Grendas, N.; Kollia, E. The November 17th, 2015 Lefkada (Greece) strike-slip earthquake: Field mapping of generated failures and assessment of macroseismic intensity ESI-07. Eng. Geol. 2017, 220, 13–30. [Google Scholar] [CrossRef]
- Guerrieri, L.; Tatevossian, R.; Vittori, E.; Comerci, V.; Esposito, E.; Michetti, A.M.; Porfido, S.; Serva, L. Earthquake environmental effects (EEE) and intensity assessment: The INQUA scale project. Boll. Soc. Geol. Ital. 2007, 126, 375. [Google Scholar]
- Tatevossian, R.E.; Rogozhin, E.A.; Arefiev, S.S.; Ovsyuchenko, A.N. Earthquake intensity assessment based on environmental effects: Principles and case studies. Geol. Soc. Lond. 2009, 316, 73–91. [Google Scholar] [CrossRef]
- Ota, Y.; Azuma, T.; Lin, Y.N.N. Application of the INQUA Environmental Seismic Intensity scale to recent earthquakes in Japan and Taiwan. In Paleoseismology: Historical and Prehistorical Records of Earthquake Ground Effects for Seismic Hazard Assessment; Reicherter, K., Michetti, A.M., Silva, P.G., Eds.; Geological Society London Special Publications: London, UK, 2009; Volume 316, pp. 55–71. [Google Scholar]
- Audemard, F.; Azuma, T.; Baiocco, F.; Baize, S.; Blumetti, A.M.; Brustia, E.; Clague, J.; Comerci, V.; Esposito, E.; Guerrieri, L.; et al. Earthquake Environmental Effects for Seismic Hazard Assessment: The ESI Intensity Scale and the EEE Catalogue; ISPRA: Rome, Italy, 2015; Volume 97, ISBN 978-88-9311-007-5.
- Ali, Z.; Qaisar, M.; Mahmood, T.; Shah, M.A.; Iqbal, T.; Serva, L.; Michetti, A.M.; Burton, P.W. The Muzaffarabad, Pakistan earthquake of 8 October 2005: Surface faulting, environmental effects, and macroseismic intensity. In Paleoseismology: Historical and Prehistorical Records of Earthquake Ground Effects for Seismic Hazard Assessment; Reicherter, K., Michetti, A.M., Silva, P.G., Eds.; Geological Society London Special Publications: London, UK, 2009; Volume 316, pp. 155–172. [Google Scholar]
- Lekkas, E. The 12 May 2008 Mw 7.9 Wenchuan, China, Earthquake: Macroseismic Intensity Assessment using the EMS-98 and ESI 2007 Scales and their correlation with the geological structure. Bull. Seismol. Soc. Am. 2010, 100, 2791–2804. [Google Scholar] [CrossRef]
- Papanikolaou, I.D. Uncertainty in intensity assignment and attenuation relationships: How seismic hazard maps can benefit from the implementation of the Environmental Seismic Intensity scale (ESI 2007). Quat. Int. 2011, 242, 42–51. [Google Scholar] [CrossRef]
- Dowrick, D.J.; Hancox, G.T.; Perrin, N.D.; Dellow, G.D. The Modified Mercalli intensity scale. Bull. N. Z. Soc. Earthq. Eng. 2008, 41, 193–205. [Google Scholar] [CrossRef]
- Grünthal, G. European Macroseismic Scale 1998; European Seismological Commission (ESC): Valletta, Malta, 1998. [Google Scholar]
- Korean Meteorological Administration. KMA Report on Pohang Earthquake (Korean); Korean Meteorological Administration: Seoul, Korea, 2018; pp. 1–41. [Google Scholar]
- Papanikolaou, I.; Melaki, M. The Environmental Seismic Intensity Scale (ESI 2007) in Greece, addition of new events and its relationship with magnitude in Greece and the Mediterranean; preliminary attenuation relationships. Quat. Int. 2017, 451, 37–55. [Google Scholar] [CrossRef]
- Guerrieri, L.; Blumetti, A.M.; Esposito, E.; Michetti, A.M.; Porfido, S.; Serva, L.; Tondi, E.; Vittori, E. Capable faulting, environmental effects and seismic landscape in the area affected by the 1997 Umbria–Marche (Central Italy) seismic sequence. Tectonophysics 2009, 476, 269–281. [Google Scholar] [CrossRef]
- Comerci, V.; Vittori, E.; Blumetti, A.M.; Brustia, E.; Di Manna, P.; Guerrieri, L.; Lucarini, M.; Serva, L. Environmental effects of the December 28, 1908, Southern Calabria–Messina (Southern Italy) earthquake. Nat. Hazards 2015, 76, 1849–1891. [Google Scholar] [CrossRef]
- Ferrario, M.F.; Serva, L.; Bonadeo, L. Assessing the Reliability of Earthquake Environmental Effects in Historical Events: Insights from the Southern Apennines, Italy. Geosciences 2020, 10, 332. [Google Scholar] [CrossRef]
- Papanikolaou, I.D.; Papanikolaou, D.I.; Lekkas, E.L. Advances and limitations of the Environmental Seismic Intensity scale (ESI 2007) regarding near-field and far-field effects from recent earthquakes in Greece: Implications for the seismic hazard assessment. Geol. Soc. Lond. 2009, 316, 11–30. [Google Scholar] [CrossRef]
- Sanchez, J.J.; Maldonado, R.F. Application of the ESI 2007 scale to two large earthquakes: South Island, New Zealand (2010 Mw 7.1), and Tohoku, Japan (2011 Mw 9.0). Bull. Seismol. Soc. Am. 2016, 106, 1151–1161. [Google Scholar] [CrossRef]
- King, T.R.; Quigley, M.C.; Clark, D. Earthquake environmental effects produced by the Mw 6.1, 20th May 2016 Petermann earthquake, Australia. Tectonophysics 2018, 747, 357–372. [Google Scholar] [CrossRef]
- Nappi, R.; Gaudiosi, G.; Alessio, G.; De Lucia, M.; Porfido, S. The environmental effects of the 1743 Salento earthquake (Apulia, southern Italy): A contribution to seismic hazard assessment of the Salento Peninsula. Nat. Hazards 2017, 86, 295–324. [Google Scholar] [CrossRef]
- Huayong, N.; Hua, G.; Yanchao, G.; Blumetti, A.M.; Comerci, V.; Di Manna, P.; Guerrieri, L.; Vittori, E. Comparison of Earthquake Environmental Effects and ESI intensities for recent seismic events in different tectonic settings: Sichuan (SW China) and Central Apennines (Italy). Eng. Geol. 2019, 258, 105149. [Google Scholar] [CrossRef]
- Porfido, S.; Alessio, G.; Gaudiosi, G.; Nappi, R. New Perspectives in the Definition/Evaluation of Seismic Hazard through Analysis of the Environmental Effects Induced by Earthquakes. Geosciences 2020, 10, 58. [Google Scholar] [CrossRef]
- Grützner, C.; Walker, R.; Ainscoe, E.; Elliott, A.; Abdrakhmatov, K. Earthquake Environmental Effects of the 1992 MS7. 3 Suusamyr Earthquake, Kyrgyzstan, and Their Implications for Paleo-Earthquake Studies. Geosciences 2019, 9, 271. [Google Scholar] [CrossRef]
- Chunga, K.; Livio, F.; Mulas, M.; Ochoa-Cornejo, F.; Besenzon, D.; Ferrario, M.F.; Michetti, A.M. Earthquake Ground Effects and Intensity of the 16 April 2016 Mw 7.8 Pedernales, Ecuador, Earthquake: Implications for the Source Characterization of Large Subduction Earthquakes. Bull. Seismol. Soc. Am. 2018, 108, 3384–3397. [Google Scholar] [CrossRef]
- Caccavale, M.; Sacchi, M.; Spiga, E.; Porfido, S. The 1976 Guatemala Earthquake: ESI Scale and Probabilistic/Deterministic Seismic Hazard Analysis Approaches. Geosciences 2019, 9, 403. [Google Scholar] [CrossRef]
- Naik, S.P.; Mohanty, A.; Porfido, S.; Tuttle, M.; Gwon, O.; Kim, Y.S. Intensity estimation for the 2001 Bhuj earthquake, India on ESI-07 scale and comparison with historical 16th June 1819 Allah Bund earthquake: A test of ESI-07 application for intraplate earthquakes. Quat. Int. 2020, 536, 127–143. [Google Scholar] [CrossRef]
- Choi, J.H.; Kim, Y.S.; Choi, S.J. Identification of a suspected Quaternary fault in eastern Korea: Proposal for a paleoseismic research procedure for the mapping of active faults in Korea. J. Asian Earth Sci. 2015, 113, 897–908. [Google Scholar] [CrossRef]
- Son, M.; Song, C.W.; Kim, M.C.; Cheon, Y.; Cho, H.; Sohn, Y.K. Miocene tectonic evolution of the basins and fault systems, SE Korea: Dextral, simple shear during the East Sea (Sea of Japan) opening. J. Geol. Soc. 2015, 172, 664–680. [Google Scholar] [CrossRef]
- Naik, S.P.; Kim, Y.-S.; Kim, T.; Su-Ho, J. Geological and Structural Control on Localized Ground Effects within the Heunghae Basin during the Pohang Earthquake (MW 5.4, 15th November 2017), South Korea. Geosciences 2019, 9, 173. [Google Scholar] [CrossRef]
- Song, Y.; Stepashko, A.A.; Ren, J. The Cretaceous climax of compression in Eastern Asia: Age 87–89 Ma (late Turonian/Coniacian), Pacific cause, continental consequences. Cretac. Res. 2015, 55, 262–284. [Google Scholar] [CrossRef]
- Choi, J.H.; Ko, K.; Gihm, Y.S.; Cho, C.S.; Lee, H.; Song, S.G.; Bang, E.S.; Lee, H.J.; Bae, H.K.; Kim, S.W.; et al. Surface Deformations and Rupture Processes Associated with the 2017 Mw 5.4 Pohang, Korea, Earthquake. Bull. Seismol. Soc. Am. 2019, 109, 756–769. [Google Scholar] [CrossRef]
- Kim, Y.S.; Park, J.Y. Cenozoic deformation history of the area around Yangnam-Yangbuk, SE Korea and its tectonic significance. J. Asian Earth Sci. 2006, 26, 1–20. [Google Scholar] [CrossRef]
- Gihm, Y.S.; Kim, S.W.; Ko, K.; Choi, J.H.; Bae, H.; Hong, P.S.; Lee, Y.; Lee, H.; Jin, K.; Choi, S.J.; et al. Paleoseismological implications of liquefaction-induced structures caused by the 2017 Pohang earthquake. Geosci. J. 2018, 22, 871–880. [Google Scholar] [CrossRef]
- Kang, S.; Kim, B.; Bae, S.; Lee, H.; Kim, M. Earthquake-Induced Ground Deformations in the Low-Seismicity Region: A Case of the 2017 M5.4 Pohang, South Korea, Earthquake. Earthq. Spectra 2019, 35, 1235–1260. [Google Scholar] [CrossRef]
- Grützner, C.; Barba, S.; Papanikolaou, I.; Pérez López, R. Earthquake geology: Science, society and critical facilities. Ann. Geophys. 2013, 56, S0683. [Google Scholar] [CrossRef]
- Heddar, A.; Beldjoudi, H.; Authemayou, C.; SiBachir, R.; Yelles-Chaouche, A.; Boudiaf, A. Use of the ESI-2007 scale to evaluate the 2003 Boumerdès earthquake (North Algeria). Ann. Geophys. 2016, 59, 0211. [Google Scholar]
- Tuttle, M.P.; Hartleb, R.; Wolf, L.; Mayne, P.W. Paleoliquefaction Studies and the Evaluation of Seismic Hazard. Geosciences 2019, 9, 311. [Google Scholar] [CrossRef]


Publisher’s Note: MDPI stays neutral with regard to jurisdictional claims in published maps and institutional affiliations. |
© 2020 by the authors. Licensee MDPI, Basel, Switzerland. This article is an open access article distributed under the terms and conditions of the Creative Commons Attribution (CC BY) license (http://creativecommons.org/licenses/by/4.0/).