Article

Elevated CO2 Emissions during Magmatic-Hydrothermal Degassing at Awu Volcano, Sangihe Arc, Indonesia

1
Laboratoire Magmas et Volcans, Université Blaise Pascal-CNRS-IRD, OPGC, 63170 Aubière, France
2
Institut de Physique du Globe de Paris, 1 rue Jussieu, 75238 Paris, France
3
Center for Volcanology and Geological Hazard Mitigation (CVGHM), Jl. Diponegoro No. 57, Bandung 40122, Indonesia
4
Dipartimento DiSTeM, Università di Palermo, 90123 Palermo, Italy
*
Author to whom correspondence should be addressed.
Geosciences 2020, 10(11), 470; https://doi.org/10.3390/geosciences10110470
Submission received: 19 August 2020 / Revised: 2 November 2020 / Accepted: 17 November 2020 / Published: 20 November 2020
(This article belongs to the Special Issue Magma Degassing from Magma at Depth to the Surface)

Abstract

:
Awu is a remote and little known active volcano of Indonesia located in the northern part of Molucca Sea. It is the northernmost active volcano of the Sangihe arc with 18 eruptions in less than 4 centuries, causing a cumulative death toll of 11,048. Two of these eruptions were classified with a Volcanic Explosivity Index (VEI) of 4. Since 2004, a lava dome has occupied the centre of Awu crater, channelling the fumarolic gas output along the crater wall. A combined Differential Optical Absorption Spectroscopy (DOAS) and Multi-component Gas Analyzer System (Multi-GAS) study highlight a relatively small SO2 flux (13 t/d) sustained by mixed magmatic–hydrothermal emissions made-up of 82 mol.% H2O, 15 mol.% CO2, 2.55 mol.% total S (ST) and 0.02 mol.% H2. The CO2 emission budget, as observed during a short observation period in 2015, corresponds to a daily contribution to the atmosphere of 2600 t/d, representing 1% of the global CO2 emission budget from volcanoes. The gas CO2/ST ratio of 3.7 to 7.9 is at the upper limit of the Indonesian gas range, which is ascribed to (i) some extent of S loss during hydrothermal processing, and perhaps (ii) a C-rich signature of the feeding magmatic gas phase. The source of this high CO2 signature and flux is yet to be fully understood; however, given the peculiar geodynamic context of the region, dominated by the arc-to-arc collision, this may result from either the prolonged heating of the slab and consequent production of carbon-rich fluids, or the recycling of crustal carbon.

1. Introduction

The Indonesian archipelago is one of the Earth’s most active volcanic arc segments, but yet one whose volcanic gas contribution into the atmosphere remains poorly constrained due to access difficulties. Volcanic gas emissions were measured only at a few volcanoes, initially using conventional techniques such as Giggenbach bottles and Correlation Spectrometer (COSPEC). This was the case for Merapi, Tangkuban Perahu, Papandayan, Dieng, Lewotolo and Bromo [1,2,3,4]. Thanks to the advent of new portable and less-energy-demanding instruments, including DOAS [5] UV-Camera [6] and Multi-GAS [7,8], gas measurements in Indonesia have later been extended to several other volcanoes over the last decade, including Semeru [9], Krakatau [10], Kawah Ijen [11], Sirung [12], Dukono [13], Sinabung [14] and Gamkonora [15]. Initial Indonesian arc-scale volcanic SO2 emission budget estimates were based on the interpolation of sparse field measurements [2,16,17,18], resulting in large emission ranges between 0.07 and 2.6 Tg/yr. Recent measurements are based primarily on satellite observations (which are unbiased by measurement locations) but limited to volcanoes with large SO2 emissions that can be detected by satellites. Hence, according to [19], the SO2 emission budget from the entire Indonesian archipelago corresponds to ~2.2 Tg/yr, representing 9% of the global volcanic SO2 emission budget. Based on these SO2 satellite data, [20] established the CO2 emission budget of 3.6 Tg/yr from Indonesian volcanoes, using the CO2/ST ratio when the gas composition was known, and the whole rock trace elements (e.g., Ba/La) as a proxy for CO2/ST ratio when the gas composition was not measured. However, only 17 volcanoes were considered in these works whilst Indonesia hosts a total of at least 127 active volcanoes. [21] report a higher CO2 emission budget, of 7.5 Tg/yr, from Indonesian volcanoes, classified into three degassing categories, including strong degassing sources (4.1 Tg/yr), whose emission can be detected by satellites, weak emitters (0.2 Tg/yr) and hydrothermal–magmatic source (3.2 Tg/yr). To achieve estimations for these latter two categories, authors utilize new data on C/S ratios and a classification into magmatic and hydrothermal categories based on visual observations, volcano databases, field reports, and observations made by authors. Such a holistic approach can enhance a very uncertain estimate for Indonesian volcanoes given the access difficulties and the variability of the C/S ratio on hydrothermal–magmatic systems that are strongly dependent on geodynamic settings and local magmatic and hydrothermal processes.
Here, we report on degassing features of little known and remote Awu volcano and emphasize its elevated CO2 fluxes. Awu, one among the least studied volcanoes in Indonesia, is situated in the northern part of the Molucca Sea, and is the northernmost active volcano of Sangihe arc (Figure 1). It is a large volcano with an aerial volume of ~27 km3, with a summit altitude of 1318 m above sea level. The 700 m-wide crater with a depth of 380 m from the rim is currently occupied by a cooling lava dome of 30 m in height and 200 m in diameter. Note that over its historical activity, the crater also hosted a crater lake. Rock samples collected since 1966 indicate a basaltic andesite magmatic source [22,23,24,25] with the phenocrysts composed mainly of plagioclase, olivine, orthopyroxene, and hornblende [25].
The Sangihe forearc is currently overriding the Halmahera forearc creating a unique present-day example of arc-to-arc collision [26]. This particular geodynamic context results from a double-subduction of the Molucca Sea plate that existed between the two arcs and is now dipping east under the Halmahera arc and west under the Sangihe arc [26,27]. In nearly four centuries, Awu went through 18 eruptions (Table 1), including two with VEI 4 (Volcanic Explosivity Index [28]). Nine of these eruptive events were tagged as phreatic whilst nine others were considered as phreatomagmatic and magmatic [29,30]. Several studies have pointed to significant global impacts of past largest-scale Awu eruptions [31,32,33,34,35,36,37,38]. The 1812 Awu’s eruption has induced a global abnormal correlation between the dust load in the atmosphere and solar activity [37]. In 1856, the volatiles released by another eruption on Awu have increased the stratospheric aerosol optical depth, leading to a decrease in sea surface temperature and subsequently less tropical cyclone events in the following year [38]. More recently, in 1966, a strong eruption on Awu induced a warmer eastern tropical Pacific Ocean over three consecutive seasons with a strong influence on El Nino type events [33]. At the regional scale, two recorded tsunamis were triggered by the 1856 and 1892 eruptions [39,40]. These intense eruptive events have claimed a total of 11,048 victims on the island of Sangihe [24], mainly through lahars and pyroclastic flows [30,41,42,43,44]. Awu is thus one of the deadliest volcanoes on Earth [24] (Bani et al., 2020).

2. Methodology

To evaluate the gas composition on Awu volcano, a compact and portable Multi-GAS system built at the University of Palermo (as used by [12,13,45] was deployed in July 2015. The instrument was positioned at three degassing points in the crater (Figure 2) and simultaneously acquired at 0.5 Hz the concentrations of H2O, CO2, SO2, H2S, and H2 in the fumaroles’ atmospheric plumes. CO2 was detected by non-dispersive infrared spectroscopy (GasCard NGII; 0–3000 ppm range) whilst relative humidity (Galltec sensor) was used to calculate H2O following Buck [46]:
H2O = 6.1121∗(1.0007+3.46∗P-6)∗exp((17.502∗T)/240.97+T)∗Rh∗104∗P-1)
H2O is the water vapor content in ppm, P is the surface pressure in mbar, T is the air temperature in °C, and Rh is relative humidity (%). SO2, H2S, and H2 were detected via specific electrochemical sensors (respectively, models 3ST/F, EZ3H, and EZT3HYT “Easy Cal”, all from City Technology with calibration range of 0–200 ppm. Data were processed using the Ratiocalc program [47].
To quantify the SO2 output, we performed DOAS measurements in a fixed scanning mode in the crater (Figure 2). Measurements were performed at an angle of 45° from a horizontal plane to increase the chances of catching each of the degassing sources, thus, the scanning profile was just above the crater rim. Twenty-four distinct scans were carried out from 8:30 a.m. to 10:40 a.m. (local time) and 23–24 spectra were collected during each scan. The spectrometer used was an Ocean Optics USB2000+ with a spectral range of 290–440 nm and a spectral resolution of 0.5 full width at half maximum. The SO2 column amounts (ppm m) were retrieved using DOAS calibration and standard analysis procedures [48]. Reference spectra included in the non-linear fit were obtained by convolving high resolution SO2 [49] and O3 [50] cross-sections with the instrument line shape. A Fraunhofer reference spectrum and ring spectrum, calculated in DOAS Intelligent System), were also included in the fit. The total column amount of the plume cross-section was then multiplied by the mean plume rise speed (estimated at 1.3 m/s using a thermal camera) to derive the SO2 emission rate.

3. Results

3.1. SO2 Emission Rate

Out of the 24 scans carried out within 2 h of the DOAS recording, only eight scans, acquired in the first part of the measurements, were considered representative (Table 2). They were acquired in clear sky conditions, whilst the other 2/3 of the scans were strongly affected by the rapid formation of cloud coverage. The scanning profiles 1 and 6 did not entirely cover the plume and thus they are also omitted from the mean calculation. Based on the eight assumed representative scans, a mean daily SO2 emission rate of 13±6 tons was obtained, highlighting the small emission budget relative to other Indonesian volcanoes, such as Dukono, (800 t d−1; [13]), Bromo (> 160 t d−1; [45]) or Krakatau (190 t d−1; [10]), but higher than the magmatic degassing at Gamkonora (3.4 t d−1; [15]) and the hydrothermal system of Papandayan (1.4 t d−1; [51]).

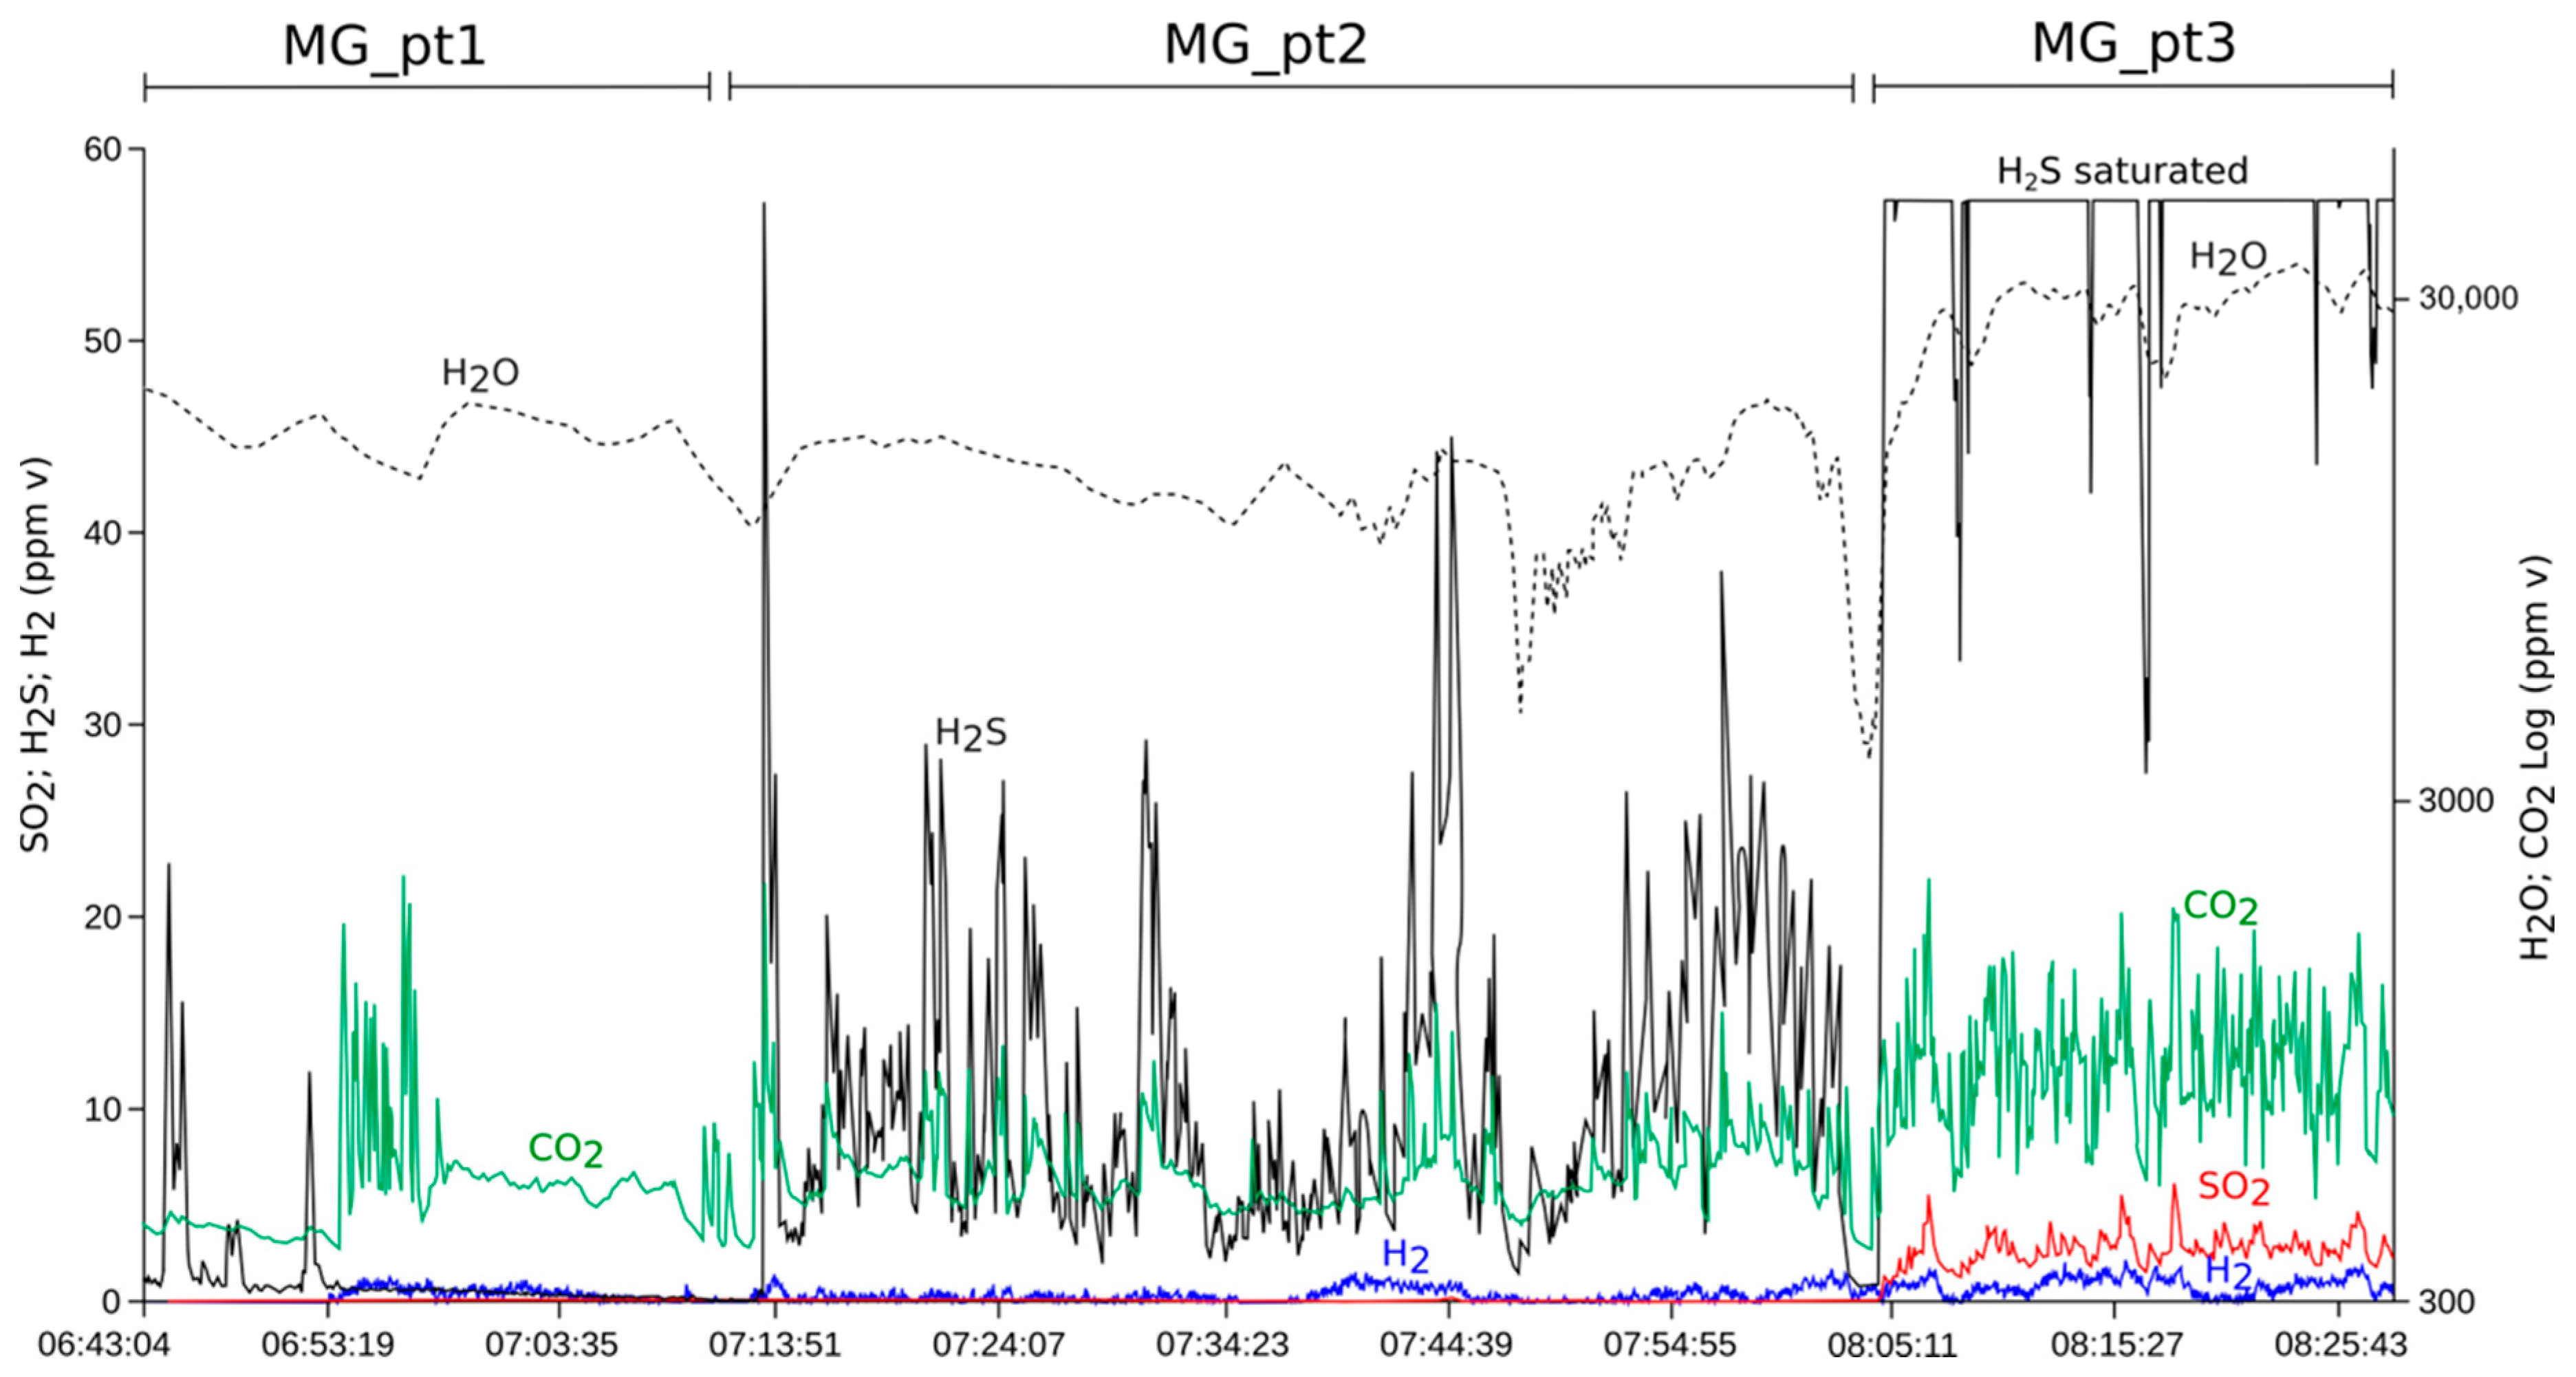
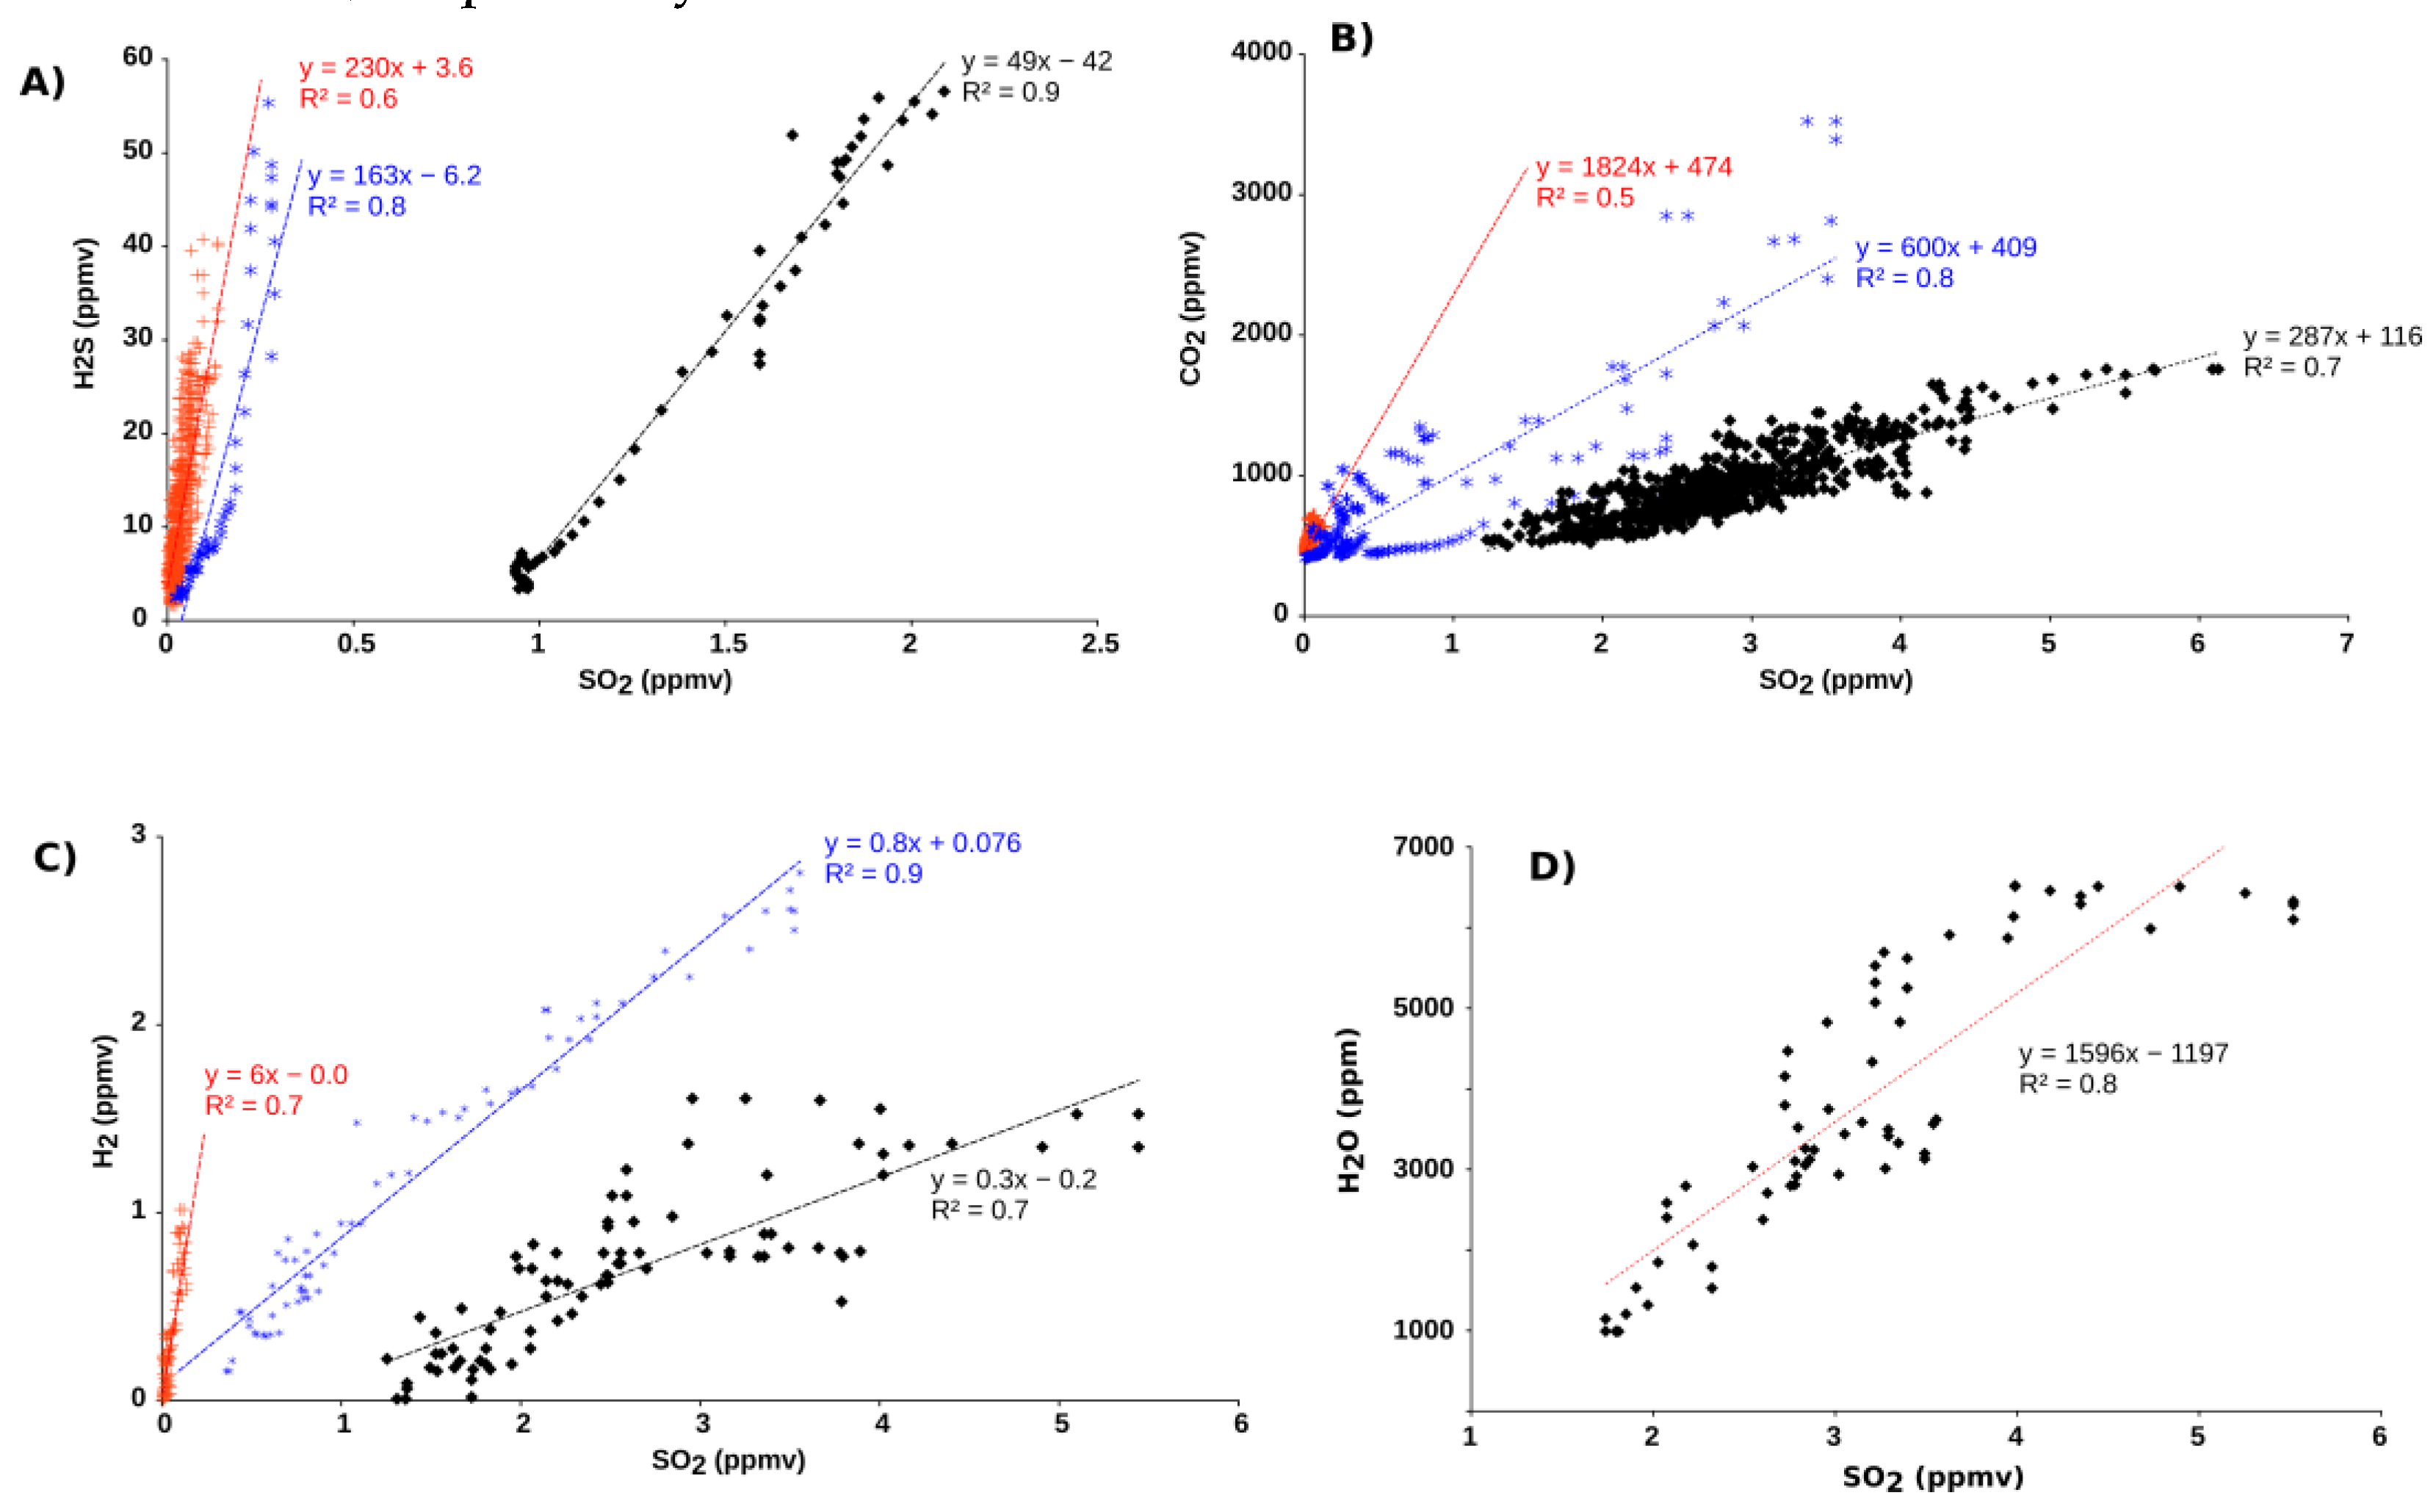
3.2. Gas Composition

Multi-GAS recordings highlight distinct gas composition at the three measured degassing points (Figure 3, Table 3). The H2O concentration fluctuates between 10,000–20,000 ppm v, 5000–18,000 ppm v and 20,000–30,000 ppm v above the background value (~30,000 ppm v) at the recording points MG_pt1, MG_pt2 and MG_pt3, respectively. The CO2 concentration varies between 400 (background level) and 2100 ppm v, 450–2050 ppm v and 400–2050 ppm v at MG_pt1, MG_pt2 and MG_pt3, respectively. The SO2 concentration is less than 0.1 ppm v at MG_pt1 while varies from <0.1 to 1.5 ppm v at MG_pt2 and from 1 to 6 ppm v at MG_pt3. The H2 concentration fluctuates between 0.1–1.2 ppm v, 0.1–1.5 and 0.1–2.2 ppm v at MG_pt1, MG_pt2 and MG_pt3, respectively. Finally, the H2S concentration fluctuates around 0.5–22 ppm v, 2–>57 ppm v and 27–>57 ppm v at MG_pt1, MG_pt2 and MG_pt3, respectively. The differences in gas composition at the recording points are well discriminated by the gas to SO2 ratios with H2S/SO2 ratios of 230, 163 and 49, CO2/SO2 ratios of 1824, 600 and 297, H2/SO2 ratios of 6, 0.8 and 0.1, respectively, for MG_Pt1, MG_Pt2, and MG_Pt3 (Figure 4). Note that at MG_Pt3, the H2S/SO2 ratio is obtained only from the unsaturated values of H2S. The water to sulphur ratio (H2O/SO2 of 1596) was only retrieved at the MG_Pt3 sampling point, where the H2O could be correlated to SO2. The water content at MG_pt3 is higher (up to >30,000 ppm v) than the concentrations at MG-pt1 and Mg_Pt2 (~15,000 ppm v on average). Overall, the gas concentration increase, and H2S/SO2, CO2/SO2, and H2/SO2 ratios decrease, in the sequence MG_Pt1, MG_Pt2, and MG_Pt3 (Table 3). The MG_pt1 located at the eastern edge of the main degassing area has the highest gas (H2, CO2, and H2S) to SO2 ratios, whilst the MG_pt3 situated just next to the lava dome exhibits the highest gas concentrations. The strongest degassing point on Awu (Mg_pt3) displayed a much high SO2 gas content, and the lowest H2S/SO2 (49) and CO2/SO2 (297) ratios relative to MG_Pt1 and MG_Pt2.
The gas composition at Mt_pt3 (situated at the northern end of the crater) is visibly the main degassing area (Figure 2) and is therefore considered as the most representative of the Awu magmatic system. Moreover, being the most SO2-rich, Mt_pt3 displays the most magmatic signature (e.g., it is less affected by hydrothermal processing) relative to other fumaroles. Based on the measured volatile ratios, its composition is inferred at 82 mol. % H2O, 15 mol. % CO2, 2 mol. % H2S, 0.05 mol. % SO2 and 0.02 mol. % H2 (Table 3), assuming no other representative gas is present in the plume. Associating this gas composition with the DOAS-derived SO2 flux, the H2O, CO2, H2S, and H2 emission rates from Awu are estimated at 5800 ± 2400 t d−1, 2600 ± 1200 t d−1, 340 ± 150 t d−1, and 0.1 ± 0.04 t d-1, respectively.

4. Discussion

Our relatively short duration gas flux measurements at Awu highlight daily mean emission rates of 13 t/d, 5800 t/d, 2600 t/d, 340 t/d, and 0.1 t/d for SO2, H2O, CO2, H2S, and H2, respectively. If put in the context of the recent global volcanic SO2 catalog of [19], Awu’s SO2 flux falls below the lower end (32 t/d) of the time-averaged SO2 emissions from the 91 top degassing volcanoes during the period 2005–2015. Thus, in its current activity level, Awu only contributes ~0.02% of the daily global volcanic SO2 emission budget of ~63 kt [19]. In contrast, with a daily release of 2600 t of CO2, and assuming a representative of the system, Awu would rank in the upper range of the global volcanic CO2 sources representing ~1% (0.9 Tg) of the global CO2 annual output from volcanoes (71–87 Tg/yr; [20,21,52]). In Indonesia, such a CO2 contribution from Awu is higher than the combined CO2 contribution from Bromo and Semeru (2184 t/d) which appears as the strongest CO2 degassing source in Indonesia [20]. If we consider the entire archipelago, the Awu CO2 emission represents 12% of the total volcanic CO2 degassing budget of Indonesia and nearly 1/3 of the combined weak and magmatic–hydrothermal sources [21]. We caution that these fluxes are based on using the SO2-richest gas composition from the strongest degassing point (MG_Pt3). As such, our derived fluxes potentially underestimate the CO2 (and H2S and H2) emissions from several weakly degassing fumaroles nearby (exemplified by MG_Pt1 and MG_Pt2) that, albeit contributing little SO2 (< 1.5 ppm v were measured in their atmospheric plumes), are characterized by high X/SO2 ratios (Figure 2, Figure 3 and Figure 4).
The decreasing gas concentrations, and the increases in the H2S/SO2, CO2/SO2 and H2/SO2 ratios, in the sequence MG_Pt3, MG_Pt2, and MG_Pt1, are likely due to increasing extents of subsurface magmatic gas scrubbing. During hydrothermal processing in the fumaroles’ ascent chimneys, and upon interaction with any hydrothermal system present in the subsurface, magmatic SO2 would be consumed by hydrolysis reactions such as [53]:
4SO2 (g) + 4H2O (aq) = H2S (aq) + 3H2SO4 (aq)
3SO2 (g) + 2H2O (aq) = S° + 2H2SO4 (aq)
These reactions shift strongly to the right with gas ascent and cooling below 400 °C [54], while in contrast, S scrubbing becomes progressively negligible at magmatic temperatures [54,55]. In 2015, the fumaroles outlet temperature on Awu was ~100 °C (Figure 5) with a typical hydrothermal CO2-rich composition. The most “magmatic” (SO2-richest) gas at MG_Pt3 fumarole is also influenced by hydrothermal processes, highlighted by the prevalence of H2S over SO2 (H2S/SO2 ratio of 49, Table 3). However, these outlet temperatures only reflect residual heat transfer to the surface at fluid discharge conditions, when most of the thermal energy has already been lost to the surrounding rock. In fact, the combined modelling of SO2/H2S and H2/H2O redox couples [56] in MG_pt3 fumarole implies an equilibrium temperature of ~475°C, thus supporting a sustained fluid contribution from a deep-seated magmatic source (see below).
A CO2-rich gas signature was inferred previously (in 2001) for Awu by [57] (Table 3) and was interpreted as evidence of the hydrothermal character of the Awu system. Indeed, the 2001 Awu gas plots along the H2O–CO2 axis in the CO2–ST–H2O ternary diagram [55] (Figure 6), as typical for hydrothermal gases. Similarly, in the CO2–SO2–H2S diagram [58] (Figure 6), the 2001 gas compositions plot in the field of systems dominated by S-loss via scrubbing processes [54]. The CO2/ST vs. gas temperature plot [55] (Figure 7) (ST is SO2+H2S and gas temperature is either measured or calculated from the redox equilibria) further indicates this hydrothermal nature for the 2001 gas, with equilibrium temperatures ranging 138 to 330 °C, and therefore, well below the ~475 °C 2015 equilibrium temperature.
Overall, the results (Figure 6 and Figure 7 and Table 3) suggest distinct gas compositions, and more reduced hydrothermal processing, in 2015 relative to 2001. Indeed, no lava dome existed in 2001 and the crater was occupied by a crater lake. The presence of a crater lake is likely to have caused more extensive gas–water interactions and scrubbing, ultimately leading to the more hydrous and S-depleted composition observed at that time (water-soluble S species are rapidly dissolved during gas transit through volcanic lakes [59]. In 2015, there was no lake and degassing occurred at the margins of a lava dome, similar to what observed at Rokatenda [60], Lascar [61] or Soufriere Hills [62]. When plotting the 2015 Awu’s gas composition within the CO2–H2O–ST diagram, it falls at the upper range of the magmatic field, whilst the CO2–SO2–H2S diagram indicates hydrothermal influence (Figure 6).
Taken together, the observations above suggest that the Awu gas composition has evolved from manifestly hydrothermal in 2001 to mixed magmatic–hydrothermal (e.g., those typically of hydrothermal systems patently fed by magmatic volatiles) in 2015. In the time interval between the two gas surveys, Awu went through a VEI 2 eruption that ended with the formation of a lava dome [29,30]. This latter reached its current size in less than two weeks then it completely stopped growing and progressively cooled down until its 5.6 MW radiant flux in 2015 [24]. Such cooling has subsequently allowed the progressive development of a hydrothermal system highlighted by the 2015 gas results (Table 3).
Carbon dioxide (CO2) and total sulphur (ST) constitute, along with the water, the major components of the arc volcanic gases. By looking at their relative abundances (e.g., the CO2/ST ratio), one can infer information on their origin and recycling efficiency through subduction [55,63]. For Indonesia, a “magmatic” gas CO2/ST ratio range of 3–6 has been proposed by [61], with a best-guess value of 4.3 quoted by [4], at the upper range of arc volcanic gases [55,64] (Figure 7). The 2015 Awu gas CO2/ST ratios (Table 3) stand at the upper limit of the Indonesian range, in a compilation (Figure 6 and Figure 7) that includes both hydrothermal and magmatic gases. In consideration of the above, it is thus very possible that, in addition to hydrothermal processing, the high CO2/SO2 ratios reflect the degassing of a carbon-rich melt source at depth. Such magmatic C-rich source is especially needed to sustain the CO2 fluxes at Awu.
A C-rich magmatic source would be consistent with the results of [57,65] who found high CO2/3He (64–180·109) and δ13C (≥ −2‰) values (in addition to a nitrogen isotope signature of −3.3‰) at Awu and Karangetang, the two volcanoes at the northern part of the Sangihe arc. Such positive C isotope compositions (and C excesses relative to 3He) are likely indicators for the involvement of C-rich, slab sediment-derived fluids in the mantle source. The thickness of the slab induced by the arc-to-arc collision [13,26,65] (Figure 1) and the slow-down of collision evidenced by seismic recording [66,67,68] have likely enhanced the heating of the slab [69] thereby promoting the greater production of C-rich melts and/or fluids beneath the Awu volcano [65]. The involvement of recycled crustal C, from the assimilation of limestones [55,70] in the Sangihe arc crustal section, cannot be excluded. The hypothesis of a C-rich magmatic source will require testing from analyses of volatiles stored in crystal-hosted melt inclusions and investigate the possibility of skarn formation [70,71,72], and if verified, may imply sizeable CO2 emissions during the relatively frequent explosive (up to VEI 4) Awu eruptions [73]. The warmer eastern tropical Pacific Ocean with subsequent influence on El Nino type events over three consecutive seasons following the 1966 VEI 4 eruption of Awu was considered as the result of a notable amount of aerosols in the stratosphere and asymmetric stratospheric heating [33,74]. Our findings thus suggest that there may be a significant role of CO2-rich gas in these climatic processes.

5. Conclusions

Gas measurement results on Awu volcano obtained in 2015, compared with results obtained nearly 20 years ago on the same volcano, demonstrate a high-CO2 gas signature for this volcano. By combining Multi-GAS and DOAS measurements, we estimate daily mean fluxes of 13 t/d, 5800 t/d, 2600 t/d, 340 t/d, and 0.1 t/d for SO2, H2O, CO2, H2S, and H2, respectively. These gas flux estimates are derived from a short period of SO2 flux measurements. Long-term gas flux measurements are needed to further constrain the gas contribution from Awu into the atmosphere. Nevertheless, the C-rich signature of gas and the subsequent elevated CO2 emission rate, compared to other gases, reflects a combination of (i) the hydrothermal processing of the feeding magmatic gas source and (ii) possibly a C-rich melt source. The latter could result from the slowing down of arc-to-arc collision and subsequent slab heating, ultimately leading to a larger delivery of C-rich fluids/melts. Other mechanisms such as the recycling of crustal C from the assimilation of limestones or the CO2 release from skarn processes need to be investigated, as they could contribute to this C-rich gas. More work is thus required to further constrain this potential CO2-rich source, knowing that the relatively frequent explosive (up to VEI 4) eruptions on Awu may have injected sizeable CO2 mass into the atmosphere—a possible contributing factor to the observed worldwide impacts of Awu eruptive activity.

Author Contributions

P.B. conducted the field survey and wrote the whole paper with A.A.; K. and D.K.S. contributed to the construction of the historical activity of Awu volcano and facilitated the field investigation with the local observatory; E.L.G. participated in the data analyses and M.B. carried out the instrumental calibrations and provided the technical support for the field investigation. All authors have read and agreed to the published version of the manuscript.

Funding

This research was supported by IRD under the JEAI-COMMISSION program in collaboration with CVGHM. Alessandro Aiuppa acknowledges funding support from the Deep Carbon Observatory (UniPa-CiW subcontract 10881-1262) and from MIUR (under grant n. PRIN2017-2017LMNLAW).

Acknowledgments

We thank all the staffs of Awu observatory for their support in organizing the expedition to the crater of Awu. We sincerely acknowledge M. Gaeta and the two anonymous reviewers for their detailed reviews that substantially improved this paper. We highly appreciate and thank the academic editor for the text review.

Conflicts of Interest

The authors declare no conflict of interest.

References

  1. Poorter, R.; Varekamp, J.; Poreda, R.; Van Bergen, M.; Kreulen, R. Chemical and isotopic compositions of volcanic gases from the east Sunda and Banda arcs, Indonesia. Geochim. Cosmochim. Acta 1991, 55, 3795–3807. [Google Scholar] [CrossRef]
  2. Andres, R.J.; Kasgnoc, A.D. A time-averaged inventory of subaerial volcanic sulfur emissions. J. Geophys. Res. Space Phys. 1998, 103, 25251–25261. [Google Scholar] [CrossRef]
  3. Giggenbach, W.; Tedesco, D.; Sulistiyo, Y.; Caprai, A.; Cioni, R.; Favara, R.; Fischer, T.; Hirabayashi, J.-I.; Korzhinsky, M.; Martini, M.; et al. Evaluation of results from the fourth and fifth IAVCEI field workshops on volcanic gases, Vulcano island, Italy and Java, Indonesia. J. Volcanol. Geotherm. Res. 2001, 108, 157–172. [Google Scholar] [CrossRef]
  4. Hilton, D.; Fischer, T.P.; Marty, B. Noble Gases and Volatile Recycling at Subduction Zones. Rev. Miner. Geochem. 2002, 47, 319–370. [Google Scholar] [CrossRef]
  5. Galle, B.; Oppenheimer, C.; Geyer, A.; Mcgonigle, A.J.S.; Edmonds, M.; Horrocks, L. A miniaturised ultraviolet spectrometer for remote sensing of SO2 fluxes: A new tool for volcano surveillance. J. Volcanol. Geotherm. Res. 2003, 119, 241–254. [Google Scholar] [CrossRef]
  6. Mori, T.; Burton, M. The SO2 camera: A simple, fast and cheap method for ground-based imaging of SO2 in volcanic plumes. Geophys. Res. Lett. 2006, 33, 24804. [Google Scholar] [CrossRef]
  7. Aiuppa, A.; Federico, C.; Giudice, G.; Gurrieri, S. Chemical mapping of a fumarolic field: La Fossa Crater, Vulcano Island (Aeolian Islands, Italy). Geophys. Res. Lett. 2005, 32. [Google Scholar] [CrossRef] [Green Version]
  8. Shinohara, H. A new technique to estimate volcanic gas composition: Plume measurements with a portable multi-sensor system. J. Volcanol. Geotherm. Res. 2005, 143, 319–333. [Google Scholar] [CrossRef]
  9. Smekens, J.-F.; Clarke, A.B.; Burton, M.R.; Harijoko, A.; Wibowo, H.E. SO2 emissions at Semeru volcano, Indonesia: Characterization and quantification of persistent and periodic explosive activity. J. Volcanol. Geotherm. Res. 2015, 300, 121–128. [Google Scholar] [CrossRef]
  10. Bani, P.; Normier, A.; Bacri, C.; Allard, P.; Gunawan, H.; Hendrasto, M.; Surono; Tsanev, V. First measurement of the volcanic gas output from Anak Krakatau, Indonesia. J. Volcanol. Geotherm. Res. 2015, 302, 237–241. [Google Scholar] [CrossRef]
  11. Gunawan, H.; Caudron, C.; Pallister, J.; Primulyana, S.; Christenson, B.; McCausland, W.; Van Hinsberg, V.; Lewicki, J.; Rouwet, D.; Kelly, P.; et al. New insights into Kawah Ijen’s volcanic system from the wet volcano workshop experiment. Geol. Soc. London Speéc. Publ. 2016, 437, 35–56. [Google Scholar] [CrossRef]
  12. Bani, P.; Alfianti, H.; Aiuppa, A.; Oppenheimer, C.; Sitinjak, P.; Tsanev, V.; Saing, U.B. First study of the heat and gas budget for Sirung volcano, Indonesia. Bull. Volcanol. 2017, 79. [Google Scholar] [CrossRef]
  13. Bani, P.; Tamburello, G.; Rose-Koga, E.F.; Liuzzo, M.; Aiuppa, A.; Cluzel, N.; Amat, I.; Syahbana, D.K.; Gunawan, H.; Bitetto, M. Dukono, the predominant source of volcanic degassing in Indonesia, sustained by a depleted Indian-MORB. Bull. Volcanol. 2018, 80, 5. [Google Scholar] [CrossRef]
  14. Primulyana, S.; Kern, C.; LerneriD, A.; Saing, U.B.; Kunrat, S.L.; Alfianti, H.; Marlia, M.; Marlia, M. Gas and ash emissions associated with the 2010–present activity of Sinabung Volcano, Indonesia. J. Volcanol. Geotherm. Res. 2019, 382, 184–196. [Google Scholar] [CrossRef]
  15. Saing, U.B.; Bani, P.; Haerani, N.; Aiuppa, A.; Primulyana, S.; Alfianti, H.; Syahbana, D.K. Kristianto First characterization of Gamkonora gas emission, North Maluku, East Indonesia. Bull. Volcanol. 2020, 82, 1–11. [Google Scholar] [CrossRef]
  16. Le Guern, F. Les débits de CO2 et de SO2 volcaniques dans l’atmosphère. Bull. Volcanol. 1982, 45, 197–202. [Google Scholar] [CrossRef]
  17. Spiro, P.A.; Jacob, D.J.; Logan, J.A. Global inventory of sulfur emissions with 1°×1° resolution. J. Geophys. Res. Space Phys. 1992, 97, 6023–6036. [Google Scholar] [CrossRef]
  18. Halmer, M.M.; Schmincke, H.-U.; Graf, H.-F. The annual volcanic gas input into the atmosphere, in particular into the stratosphere: A global data set for the past 100 years. J. Volcanol. Geotherm. Res. 2002, 115, 511–528. [Google Scholar] [CrossRef]
  19. Carn, S.A.; Fioletov, V.E.; McLinden, C.A.; Li, C.; Krotkov, N.A. A decade of global volcanic SO2 emissions measured from space. Sci. Rep. 2017, 7, srep44095. [Google Scholar] [CrossRef] [Green Version]
  20. Aiuppa, A.; Fischer, T.P.; Plank, T.; Bani, P. CO2 flux emissions from the Earth’s most actively degassing volcanoes, 2005–2015. Sci. Rep. 2019, 9, 5442. [Google Scholar] [CrossRef]
  21. Fischer, T.P.; Arellano, S.; Carn, S.; Aiuppa, A.; Galle, B.; Allard, P.; Lopez, T.; Shinohara, H.; Kelly, P.; Werner, C.; et al. The emissions of CO2 and other volatiles from the world’s subaerial volcanoes. Sci. Rep. 2019, 9, 1–11. [Google Scholar] [CrossRef] [Green Version]
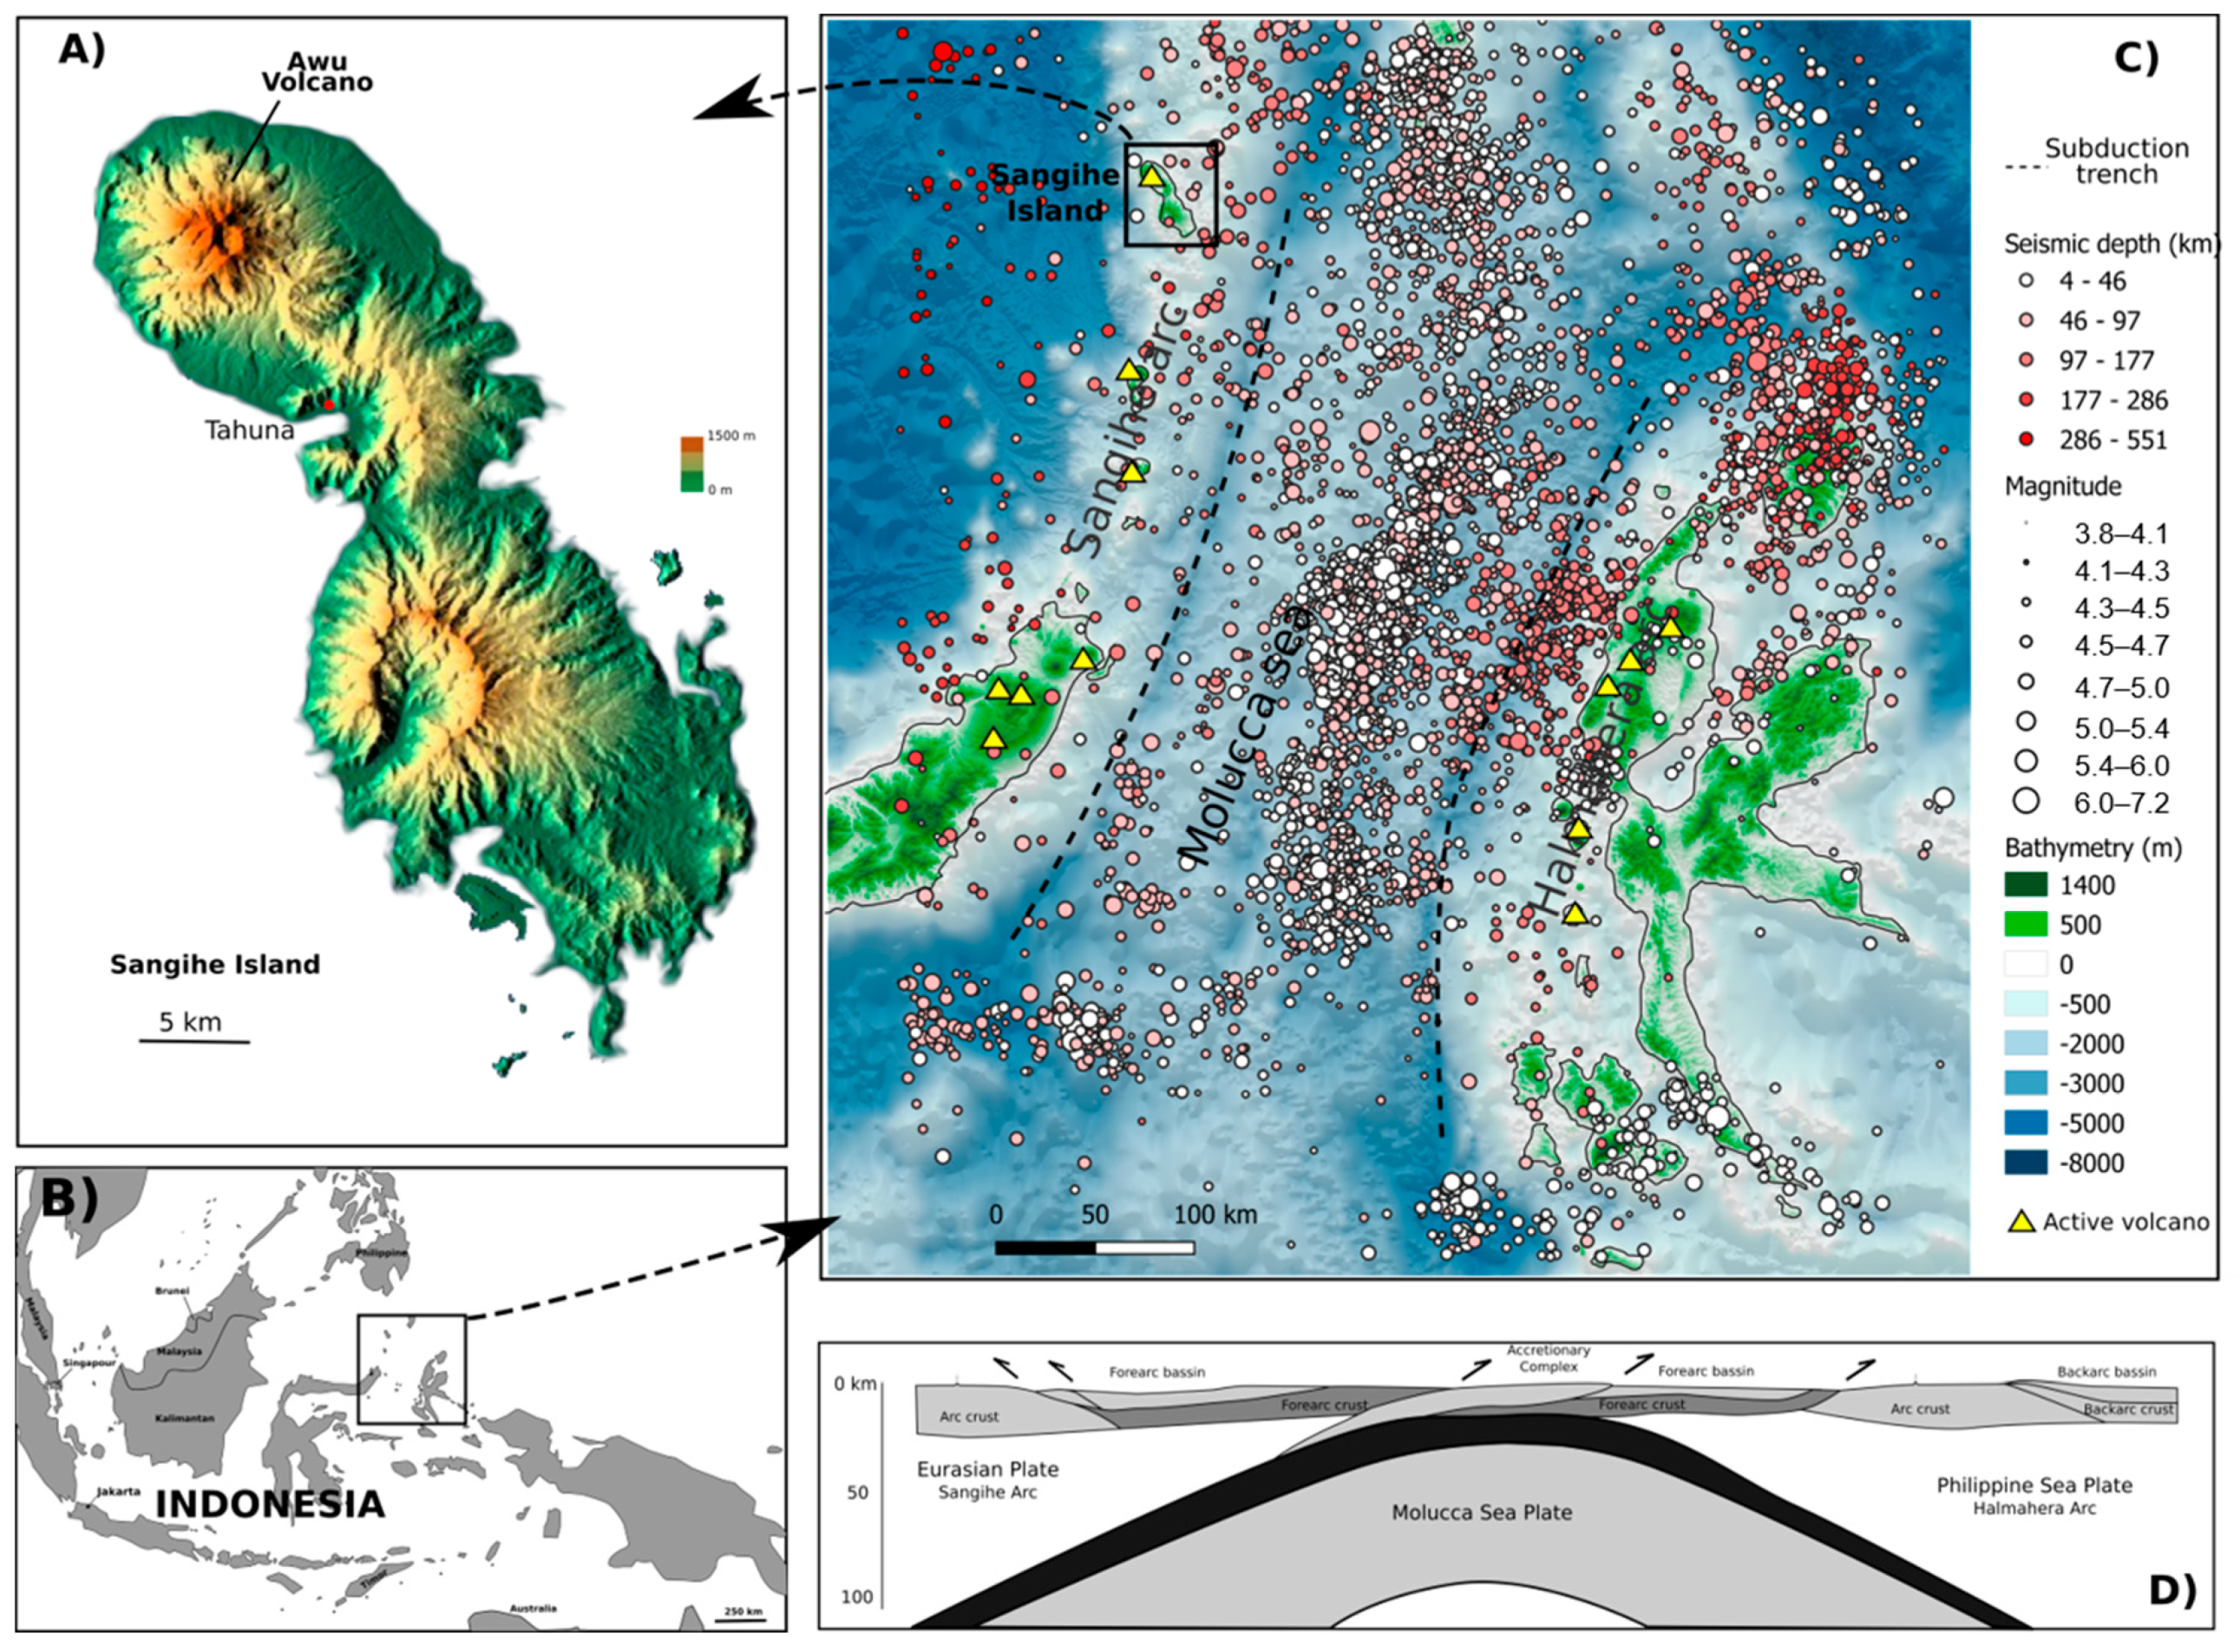
  22. Morrice, M.; Jezek, P.; Gill, J.; Whitford, D.; Monoarfa, M. An introduction to the Sangihe arc: Volcanism accompanying arc—Arc collision in the Molucca Sea, Indonesia. J. Volcanol. Geotherm. Res. 1983, 19, 135–165. [Google Scholar] [CrossRef]
  23. Hanyu, T.; Gill, J.; Tatsumi, Y.; Kimura, J.-I.; Sato, K.; Chang, Q.; Senda, R.; Miyazaki, T.; Hirahara, Y.; Takahashi, T.; et al. Across- and along-arc geochemical variations of lava chemistry in the Sangihe arc: Various fluid and melt slab fluxes in response to slab temperature. Geochem. Geophys. Geosystems 2012, 13. [Google Scholar] [CrossRef] [Green Version]
  24. Bani, P.; Kunrat, S.; Syahbana, D.K. Kristianto Insights into the recurrent energetic eruptions that drive Awu, among the deadliest volcanoes on Earth. Nat. Hazards Earth Syst. Sci. 2020, 20, 2119–2132. [Google Scholar] [CrossRef]
  25. Gill, J. Compilation of Whole Rock Geochemistry and Petrography of Samples from the Sangihe Arc, Northern Sulawesi, Indonesia, Version 1.0. Interdisciplinary Earth Data Alliance (IEDA). Available online: https://doi.org/10.26022/IEDA/111503 (accessed on 24 September 2020).
  26. Hall, R.; Wilson, M. Neogene sutures in eastern Indonesia. J. Asian Earth Sci. 2000, 18, 781–808. [Google Scholar] [CrossRef]
  27. Cardwell, R.K.; Isacks, B.L.; Karig, D.E. The spatial distribution of earthquakes, focal mechanism solutions and subducted lithosphere in the Philippine and northeast Indonesian islands. Am. Geophys. Union Geophys. Monogr. 1980, 23, 1–36. [Google Scholar]
  28. Newhall, C.G.; Self, S. The volcanic explosivity index (VEI) an estimate of explosive magnitude for historical volcanism. J. Geophys. Res. Space Phys. 1982, 87, 1231–1238. [Google Scholar] [CrossRef]
  29. Global Volcanism Program. Awu (267040), in Volcanoes of the World, v.4.9.1 (17 Sep 2020). Smithsonian Institution. Available online: https://volcano.si.edu/volcano.cfm?vn=267040 (accessed on 17 November 2020).
  30. Badan-Geologi. Data Dasar Gunung Api, Wilaya Timur, 2nd ed.; Kementerian Energi dan Sumber Daya Mineral: Jakarta, Indonesia, 2011; pp. 1–450. [Google Scholar]
  31. Robock, A. A latitudinally dependent volcanic dust veil index, and its effect on climate simulations. J. Volcanol. Geotherm. Res. 1981, 11, 67–80. [Google Scholar] [CrossRef]
  32. Robock, A. Volcanic eruptions and climate. Rev. Geophys. 2000, 38, 191–219. [Google Scholar] [CrossRef]
  33. Handler, P. Possible association of stratospheric aerosols and El Nino type events. Geophys. Res. Lett. 1984, 11, 1121–1124. [Google Scholar] [CrossRef]
  34. Zielinski, G.A.; Fiacco, R.J.; Whitlow, S.; Twickler, M.S.; Germani, M.S.; Endo, K.; Yasui, M. Climatic impact of the AD 1783 eruption of Asama (Japan) was minimal: Evidence from the GISP2 ice core. Geophys. Res. Lett. 1994, 21, 2365–2368. [Google Scholar] [CrossRef] [Green Version]
  35. Jones, P.D.; Briffa, K.R.; Schweingruber, F.H. Tree-ring evidence of the widespread effects of explosive volcanic eruptions. Geophys. Res. Lett. 1995, 22, 1333–1336. [Google Scholar] [CrossRef] [Green Version]
  36. Palmer, A.S.; Van Ommen, T.; Curran, M.A.J.; Morgan, V.; Souney, J.M.; Mayewski, P.A. High-precision dating of volcanic events (A.D. 1301-1995) using ice cores from Law Dome, Antarctica. J. Geophys. Res. Space Phys. 2001, 106, 28089–28095. [Google Scholar] [CrossRef] [Green Version]
  37. Donarummo, J.; Ram, M.; Stolz, M.R. Sun/dust correlations and volcanic interference. Geophys. Res. Lett. 2002, 29, 1–75. [Google Scholar] [CrossRef]
  38. Guevara-Murua, A.; Hendy, E.J.; Rust, A.C.; Cashman, K.V. Consistent decrease in North Atlantic Tropical Cyclone frequency following major volcanic eruptions in the last three centuries. Geophys. Res. Lett. 2015, 42, 9425–9432. [Google Scholar] [CrossRef] [Green Version]
  39. Latter, J.H. Tsunamis of volcanic origin: Summary of causes, with particular reference to Krakatoa, 1883. Bull. Volcanol. 1981, 44, 467–490. [Google Scholar] [CrossRef]
  40. Paris, R.; Switzer, A.D.; Belousova, M.; Belousov, A.; Ontowirjo, B.; Whelley, P.L.; Ulvrova, M. Volcanic tsunami: A review of source mechanisms, past events and hazards in Southeast Asia (Indonesia, Philippines, Papua New Guinea). Nat. Hazards 2013, 70, 447–470. [Google Scholar] [CrossRef] [Green Version]
  41. Van Padang, N. History of volcanology in the former Netherlands East Indies. Scripta Geol. 1983, 71, 1–76. [Google Scholar]
  42. Tanguy, J.-C.; Ribière, C.; Scarth, A.; Tjetjep, W.S. Victims from volcanic eruptions: A revised database. Bull. Volcanol. 1998, 60, 137–144. [Google Scholar] [CrossRef]
  43. Witham, C.S. Volcanic disasters and incidents: A new database. J. Volcanol. Geotherm. Res. 2005, 148, 191–233. [Google Scholar] [CrossRef]
  44. Lagmay, A.M.F.; Rodolfo, K.S.; Siringan, F.P.; Uy, H.; Remotigue, C.; Zamora, P.; Lapus, M.; Rodolfo, R.; Ong, J. Geology and hazard implications of the Maraunot notch in the Pinatubo Caldera, Philippines. Bull. Volcanol. 2007, 69, 797–809. [Google Scholar] [CrossRef]
  45. Aiuppa, A.; Bani, P.; Moussallam, Y.; Di Napoli, R.; Allard, P.; Gunawan, H.; Hendrasto, M.; Tamburello, G. First determination of magma-derived gas emissions from Bromo volcano, eastern Java (Indonesia). J. Volcanol. Geotherm. Res. 2015, 304, 206–213. [Google Scholar] [CrossRef] [Green Version]
  46. Buck, A.L. New equations for computing vapor pressure and enhancement factor. J. Appl. Meteorol. 1981, 20, 1527–1532. [Google Scholar] [CrossRef] [Green Version]
  47. Tamburello, G. Ratiocalc: Software for processing data from multicomponent volcanic gas analyzers. Comput. Geosci. 2015, 82, 63–67. [Google Scholar] [CrossRef] [Green Version]
  48. Platt, U.; Stutz, J. Differential Optical Absorption Spectroscopy; Springer Science and Business Media LLC: New York, NY, USA, 2008; p. 597. [Google Scholar]
  49. Bogumil, K.; Orphal, J.; Homann, T.; Voigt, S.; Spietz, P.; Fleischmann, O.C.; Vogel, A.; Harmann, M.; Kromminga, H.; Bovensmann, H.; et al. Measurements of molecular absorption spectra with SCIAMACHY preflight model: Instrument characterization and reference data for atmospheric remote sensing in the 230–2380 nm region. J. Photochem. Photobiol. Chem. 2003, 157, 167–184. [Google Scholar] [CrossRef]
  50. Voigt, S.; Orphal, J.; Bogumil, K.; Burrows, J.P. The temperature dependence (203–293 K) of the absorption cross-sections of O3 in the 230–850 nm region measured by Fourier-transform spectroscopy. J. Photochem. Photobiol. 2001, 143, 1–9. [Google Scholar] [CrossRef]
  51. Bani, P.; Hendrasto, M.; Gunawan, H.; Primulyana, S.; Surono, M. Sulfur dioxide emissions from Papandayan and Bromo, two Indonesian volcanoes. Nat. Hazards Earth Syst. Sci. 2013, 13, 2399–2407. [Google Scholar] [CrossRef] [Green Version]
  52. Werner, C.; Fischer, T.P.; Aiuppa, A.; Edmonds, M.; Cardellini, C.; Carn, S.; Chiodini, G.; Cottrell, E.; Burton, M.; Shinohara, H.; et al. Carbon Dioxide Emissions from Subaerial Volcanic Regions. In Deep Carbon; Cambridge University Press (CUP): Cambridge, UK, 2019; pp. 188–236. [Google Scholar]
  53. Holland, H.D. Some applications of thermochemical data to problems of ore deposits II. Mineral assemblages and the composition of ore-forming fluids. Econ. Geol. 1965, 60, 1101–1166. [Google Scholar] [CrossRef]
  54. Symonds, R.; Gerlach, T.; Reed, M. Magmatic gas scrubbing: Implications for volcano monitoring. J. Volcanol. Geotherm. Res. 2001, 108, 303–341. [Google Scholar] [CrossRef]
  55. Aiuppa, A.; Fischer, T.P.; Plank, T.; Robidoux, P.; Di Napoli, R. Along arc, inter-arc and arc-to-arc variations in volcanic gas SO2/ST ratios reveal dual source of carbon in arc volcanism. Earth Sci. Rev. 2017, 168, 24–47. [Google Scholar] [CrossRef]
  56. Aiuppa, A.; Shinohara, H.; Tamburello, G.; Giudice, G.; Liuzzo, M.; Moretti, R. Hydrogen in the gas plume of an open-vent volcano, Mount Etna, Italy. J. Geophys. Res. Space Phys. 2011, 116. [Google Scholar] [CrossRef] [Green Version]
  57. Clor, L.E.; Fischer, T.; Hilton, D.R.; Sharp, Z.D.; Hartono, U. Volatile and N isotope chemistry of the Molucca Sea collision zone: Tracing source components along the Sangihe Arc, Indonesia. Geochem. Geophys. Geosystems 2005, 6. [Google Scholar] [CrossRef]
  58. Stix, J.; De Moor, J.M. Understanding and forecasting phreatic eruptions driven by magmatic degassing. Earth Plan. Space 2018, 70, 1–19. [Google Scholar] [CrossRef] [PubMed] [Green Version]
  59. Christenson, B.; Németh, K.; Rouwet, D.; Tassi, F.; Vandemeulebrouck, J.; Varekamp, J.C. Volcanic Lakes. In Advances in Volcanology; Springer Science and Business Media LLC: New York, NY, USA, 2015; pp. 1–20. [Google Scholar]
  60. Primulyana, S.; Bani, P.; Harris, A. The effusive-explosive transitions at Rokatenda 2012–2013: Unloading by extrusion of degassed magma with lateral gas flow. Bull. Volcanol. 2017, 79, 22. [Google Scholar] [CrossRef]
  61. Matthews, S.J.; Gardeweg, M.C.; Sparks, R.S.J. The 1984 to 1996 cyclic activity of Lascar Volcano, northern Chile: Cycles of dome growth, dome subsidence, degassing and explosive eruptions. Bull. Volcanol. 1997, 59, 72–82. [Google Scholar] [CrossRef]
  62. Sparks, R.S.J. Dynamics of magma degassing. Geol. Soc. London Speéc. Publ. 2003, 213, 5–22. [Google Scholar] [CrossRef]
  63. Plank, T.; Manning, C.E. Subducting carbon. Nat. Cell Biol. 2019, 574, 343–352. [Google Scholar] [CrossRef] [Green Version]
  64. Fischer, T.P. Fluxes of volatiles (H2O, CO2, N2, Cl, F) from arc volcanoes. Geochem. J. 2008, 42, 21–38. [Google Scholar] [CrossRef] [Green Version]
  65. Jaffe, L.; Hilton, D.; Fischer, T.; Hartono, U. Tracing magma sources in an arc-arc collision zone: Helium and carbon isotope and relative abundance systematics of the Sangihe Arc, Indonesia. Geochem. Geophys. Geosyst. 2004, 5. [Google Scholar] [CrossRef]
  66. Morris, J.D.; Jezek, P.A.; Hart, S.R.; Hill, J.B.; Hayes, D.E. The Halmahera Island Arc, Molucca Sea collision zone, Indonesia: A geochemical survey. In Sea Ice; American Geophysical Union (AGU): Washington, DC, USA, 1983; Volume 27, pp. 373–387. [Google Scholar]
  67. McCaffrey, R. Seismic wave propagation beneath the Molucca Sea arc-arc collision zone, Indonesia. Tectonophysics 1983, 96, 45–57. [Google Scholar] [CrossRef]
  68. Pubellier, M.; Quebral, R.; Rangin, C.; Deffontaines, B.; Muller, C.; Butterlin, J.; Manzano, J. The Mindanao collision zone: A soft collision event within a continuous Neogene strike-slip setting. J. Asian Earth Sci. 1991, 6, 239–248. [Google Scholar] [CrossRef]
  69. Peacock, S.M.; Rushmer, T.; Thompson, A.B. Partial melting of subducting oceanic crust. Earth Planet. Sci. Lett. 1994, 121, 227–244. [Google Scholar] [CrossRef]
  70. Deegan, F.M.; Troll, V.R.; Freda, C.; Misiti, V.; Chadwick, J.P.; McLeod, C.L.; Davidson, J.P. Magma–Carbonate Interaction Processes and Associated CO2 Release at Merapi Volcano, Indonesia: Insights from Experimental Petrology. J. Pet. 2010, 51, 1027–1051. [Google Scholar] [CrossRef] [Green Version]
  71. Di Rocco, T.; Freda, C.; Gaeta, M.; Mollo, S.; Dallai, L. Magma chamber emplacement in carbonate substrate: Petrologenesis of skarn and cumulate rocks and implication fpr CO2 degassing in volcanic areas. J. Petrol. 2012, 53, 2307–2332. [Google Scholar] [CrossRef] [Green Version]
  72. Whitley, S.; Gertisser, R.; Halama, R.; Preece, K.; Troll, V.R.; Deegan, F.M. Crustal CO2 contribution to subduction zone degassing recorded through calc-silicate xenoliths in arc lavas. Sci. Rep. 2019, 9, 1–11. [Google Scholar] [CrossRef]
  73. Kodera, K.; Hori, M.E.; Yukimoto, S.; Sigmond, M. Solar modulation of the Northern Hemisphere winter trends and its implications with increasing CO2. Geophys. Res. Lett. 2008, 35. [Google Scholar] [CrossRef]
  74. Haywood, J.M.; Jones, A.; Bellouin, N.; Stephenson, D.B. Asymmetric forcing from stratospheric aerosols impacts Sahelian rainfall. Nat. Clim. Chang. 2013, 3, 660–665. [Google Scholar] [CrossRef]
Figure 1. Awu volcano constitutes the northern portion of Sangihe Island (A) in the northern part of Molucca Sea, northeast Indonesia (B). The geodynamic context at the Molucca Sea is dominated by the double subduction of the same Molucca Sea plate that deepens to the east under the Halmahera arc, and to the west under the Sangihe arc, as materialized by the depth of seismic events (C). The high number of located earthquakes in the middle of Molucca Sea emphasizes the current ongoing arc–arc collision, highlighted by the Sangihe forearc overriding the Halmahera forearc (D).
Geosciences 10 00470 g001
Figure 2. Awu crater hosts a cooling lava dome (left picture) of 30 m height and 200 m in diameter, surrounded by numerous fumaroles. The MultiGAS was deployed at 3 different locations, namely MG_pt1, MG_pt2, and MG_pt3 (left and central pictures). The strongest degassing site (MG_pt3) is located in the northern part of the crater (right picture). The position of the thermal camera is provided on the left and right pictures.
Geosciences 10 00470 g002
Figure 3. Gas composition recorded at 3 degassing points (MG_pt1, MG_pt2, MG_pt3) with H2O in a dotted line whilst H2S, CO2, SO2, and H2 in black, green, red and blue, respectively. H2S result is saturated at the point MG_pt3.
Geosciences 10 00470 g003
Figure 4. Linear correlation between H2S and SO2 (A), CO2 and SO2 (B), H2 and SO2 (C) and H2O and SO2 (D) from MG_Pt1 (red), MG_Pt2 (blue) and MG_Pt3 (black). For H2S, the saturated points were excluded whilst the correlation between H2O and SO2 was obtained only at MG_pt3 (D).
Geosciences 10 00470 g004
Figure 5. Heat distribution in Awu’s crater highlighting the heated surfaces around the lava dome (A). The surface temperature obtained from a continuous thermal recording is ~100 °C (B). The most heated surface is situated in the northern part of the crater.
Geosciences 10 00470 g005
Figure 6. The CO2–H2O–ST ternary diagram highlighting the hydrothermal gas composition at Awu in 2001 (A) with strong S-loss by scrubbing processes (B). In contrast, in 2015 Awu’s gas had a magmatic signature (A) influenced by a hydrothermal manifestation (B). The gas compositions of other Indonesian active volcanoes available in the literature are plotted for comparison.
Geosciences 10 00470 g006
Figure 7. (A) Variation of the CO2/ST ratios as a function of temperature for the Indonesian volcanoes. The diagram discriminates the magmatic gas signature (Merapi, Bromo, Dukono, Sirung, Wurlali, and Lewotolo) from the hydrothermal (low-temperature fumarole at Awu and Soputan) and mixed gases composition (Papandayan, Dieng, Tangkuban Parahu, Ruang, and the high-temperature gas from Awu). (B) The CO2/ST ratios highlight the strong CO2 signature of Awu above the means value of Indonesian volcanoes and above the arc volcanic gases. Awu CO2 signature is also higher than the Java arc, considered as the CO2-enriched arc [4,55].
Geosciences 10 00470 g007
Table 1. History of Awu eruptive activity.
YearEruptive Events
1640Magmatic eruption.
1641Phreatic eruption, lahar event.
1677Phreatic eruption.
1711Violent eruption (VEI 3) triggered a pyroclastic flow and hot lahar claiming about 3000 victims.
1812Large phreatomagmatic eruption (VEI 4). Lahar and pyroclastic events. Villages destroyed, 963 victims.
1856Large phreatomagmatic eruption (VEI 3). Pyroclastic and lahar flows killed 2806 inhabitants.
1875Phreatic eruption (VEI 2) was reported with no further detail.
1883Possible phreatic eruption (VEI 2) was reported with no further detail.
1885Phreatic eruption (VEI 2) was reported with no further detail.
1892Large phreatomagmatic eruption (VEI 3) with lahar events claiming 1532 victims.
1893Phreatic eruption (VEI 2).
1913Phreatic eruption (VEI 2).
1921Phreatic eruption—crater lake activity.
1922Phreatic eruption—crater lake activity.
1931Lava dome developed through a crater lake.
1966Large VEI 4 eruption. Violent blast, heavy ashfall, pyroclastic flow, lahars events. 39 victims and 11,000 inhabitants evacuated.
1992Phreatic eruption (VEI 1).
2004Magmatic eruption (VEI 2), 18,648 inhabitants evacuated.
Table 2. SO2 flux obtained from two hours of scanning DOAS.
Start Time (LT)Scan Step (m)Nber of SpectraMean CA (mg/m2)SO2 Flux
kg/st/d
Scan 108:381533620.044
Scan 208:444724740.119 ± 4
Scan 308:5247241890.2723 ± 10
Scan 409:004724800.1110 ± 4
Scan 509:084724890.1311 ± 5
Scan 609:124724480.056
Scan 709:164724960.1412 ± 5
Scan 809:1947241180.1715 ± 7
Scan 909:2547241020.1513 ± 6
Scan 1009:3347241040.1513 ± 5
Scan 1109:414724240.033
Scan 1209:534791700.033
Scan 1309:591523230.011
Scan 1410:021523300.011
Scan 1510:051523630.032
Scan 1610:071523480.022
Scan 1710:101523460.022
Scan 1810:141523540.022
Scan 1910:181523880.054
Scan 2010:231523580.033
Scan 2110:241523520.033
Scan 2210:271523640.043
Scan 2310:301523660.043
Scan 2410:331523530.032
Mean SO2 emission rate: 13 ± 6 t/day
Notes: only scans 2, 3, 4, 5, 7, 8, 9, and 10 were considered in the mean emission rate. Other scans are underestimating the emission due to the initialization of the scanning system (scan 1, 6) and the rapid cloud build-up (scans 11–24).
Table 3. Gas ratios, gas composition and gas fluxes from Awu volcano.
Sampling Date28 July 2015 3 August 2001 *
Sample. IDMG_Pt1MG_Pt2MG_Pt3 IND-15IND-16IND-17
Vent typeFumaroleFumaroleFumarole FumaroleFumaroleSpring
H2O (ppm v)10,000–20,000
mean val. 16091
5000–18,000
mean val. 13395
20,000–30,000
mean val. 27080
CO2 (ppm v)400–2100
mean val. 510
450–2050
mean val. 549
400–2050
mean val. 867
SO2 (ppm v)<0.1
mean val. 0.017
<0.1–1.5
mean val. 0.027
1–6
mean val. 2.43
H2S (ppm v)0.5–22
mean val. 1.03
2–57
mean val. 10.34
27–57 (saturation)
mean val. 51.21
H2 (ppm v)0.1–1.2
mean val. 0.27
0.1–1.5
mean val. 0.31
0.1–2.2
mean val. 0.84
H2S/SO2230 ± 110163 ± 6249 ± 20 H2S/SO20.810.930.81
CO2/SO21824 ± 850600 ± 230287 ± 164 CO2/SO21151132175
H2/SO26 ± 40.8 ± 0.10.3 ± 0.1 H2/SO20.0030.0020.91
H2O/SO2--1596 ± 670 H2O/SO262349623562175
CO2/ST7.9 ± 3.73.6 ± 1.45.7 ± 3.2 CO2/ST63581199
Composition (mol %)Flux (t/d) * Composition (mol %)
H2O 82.5 ± 34.15800 ± 2400H2O99.8099.8195.55
CO2 14.8 ± 6.82600 ± 1200CO20.180.184.44
SO2 0.05 ± 0.0213 ± 6SO20.0020.0020.002
H2S 2.5 ± 1.1340 ± 150H2S0.0010.0020.002
H2 0.02 ± 0.010.1 ± 0.04H20.0000.0000.002
HCl0.0180.0090.002
* Data from Clor et al., 2005. IND-16 is a duplicate sample from IND-15.
Publisher’s Note: MDPI stays neutral with regard to jurisdictional claims in published maps and institutional affiliations.

