Article

An Unsaturated/Saturated Coupled Hydrogeological Model for the Llamara Salt Flat, Chile, to Investigate Prosopis tamarugo Survival

1
Departamento de Ingeniería Hidráulica y Ambiental, Pontificia Universidad Católica de Chile, Santiago 7820436, Chile
2
Centro de Desarrollo Urbano Sustentable (CEDEUS), Santiago 7820436, Chile
3
Centro de Excelencia en Geotermia de los Andes (CEGA), Santiago 7820436, Chile
*
Author to whom correspondence should be addressed.
Geosciences 2020, 10(1), 1; https://doi.org/10.3390/geosciences10010001
Submission received: 3 December 2019 / Revised: 11 December 2019 / Accepted: 17 December 2019 / Published: 19 December 2019
(This article belongs to the Special Issue Groundwater in arid and semiarid areas)

Abstract

:
The Propopis tamarugo Phil, also known as Tamarugo, is an endemic and protected tree that survives in the Atacama Desert—a hyper arid and highly saline environment. The Tamarugo is threatened because of groundwater overexploitation, and its preservation depends on the soil moisture in the vadose zone, as many of the tree roots do not reach the current water table levels. To improve the estimation of soil moisture available for the Tamarugo trees, we applied a hydrogeological model that couples the unsaturated and saturated zones. The model was used to represent different groundwater exploitation and recharge scenarios between February 2006 and September 2030 to predict simultaneously groundwater levels and soil moisture. The model results show that even at locations where water table depletion is relatively small (~1–1.5 m), soil moisture can drastically decrease (0.25–0.30 m3/m3). Therefore, Tamarugo survival can be better addressed, as the applied model provides a management tool to estimate response of Tamarugo trees to changing soil moisture. To further improve the model and its use to assess Tamarugo survival, more field data, such as soil hydrodynamic properties and soil moisture, should be collected. Additionally, relationships between the state of the Tamarugo trees and soil moisture should be further constructed. In this way, the developed model will be able to predict future conditions associated to the Tamarugo’s health state.

1. Introduction

Arid and semi-arid regions cover approximately 32.4% of the world’s land area and are inhabited by more than 2500 million people [1]. In these regions, groundwater-dependent environments endangered by natural or anthropogenic causes are common [2,3,4,5]. The Prosopis tamarugo Phil, also known as Tamarugo tree, is found in groundwater-dependent ecosystems, and are adapted to extreme arid environments [3]. It is one of the few species that lives in the Atacama Desert, Chile, in a zone comprised by many salt flats that is known as Pampa del Tamarugal [6,7,8].
The Tamarugo tree is one of the 44 Prosopis species in the world [9]. This legume tree is an endemic and protected flora that survives in hyper arid and highly saline environments [10]. It lives in zones where the water table is relatively shallow (4–20 m depth) [3], and near areas where groundwater is extracted for mining purposes [10,11]. The preservation of the Tamarugo tree depends on the soil moisture in the vadose zone, because in many of these trees, the roots do not reach the water table levels [12,13]. The Tamarugo root system is composed by a root mat at less than a meter depth from the soil and by long pivoting roots that reach the water table [10]. To protect the forests of Tamarugo, the Chilean government imposes environmental monitoring plans where different parameters must be periodically measured to ensure the sustainability of these systems. For instance, in the Resolution N° 890/2010 of the Chilean Environmental Assessment System, the moisture profile in the Llamara salt flat basin near the Tamarugo trees is among the six biophysical parameters that must be monitored in the following decades. Different studies have quantified the environmental risk to which the Pampa del Tamarugal is exposed due to the exploitation of aquifers and how this affects the survival of the Tamarugo tree [3,10,14,15].
In 2012, in the Pampa del Tamarugal and its surroundings, a total water withdrawal equivalent to four times the estimated natural recharge of the aquifer was registered [3]. This aquifer overexploitation constitutes a real threat to the survival of the Tamarugo and the local flora. Hydrogeological models that simulate the groundwater flow in the Pampa del Tamarugal have been developed primarily for environmental assessment studies [11,14,15], and recent studies have updated the conceptual hydrogeological model of the Pampa del Tamarugal aquifer [6,7]. Furthermore, it has been demonstrated that anthropogenic pressures are the dominant factor of the affecting water table fluctuations, which has resulted in an overuse of the aquifer [8]. A relationship between the water table depth and the vital state of the trees has been proposed by [15], in which the water table depth below the trees in the Llamara salt flat was obtained from monitoring wells, and the state of the Tamarugo trees was estimated using high-resolution satellite images. Based on a statistical analysis, it has been determined that water table depths of more than 13.3 m increase the probability of finding an ill-conditioned Tamarugo tree [15]. Satellite indices, such as the green canopy fraction (GCF) [16] and the normalized difference vegetation index (NDVI) [17], have been used for analyzing the health of the Tamarugo trees. The GCF is the ratio between the volumes of green canopy and total canopy and corresponds to an indirect measurement of the photosynthetic activity of the trees [16], whereas the NDVI represents the fraction of photosynthetically active radiation absorbed by the vegetation [17]. Chávez et al. [18] proposed a relationship between water table depth and the vital state of the Tamarugo tree in which the GCF is integrated along with the NDVI, the 18O isotope enrichment in foliar tissue and the twig growth to determine a range of tree damage as a function of water table depth. In this way, they estimated that for a water table depth of 6 m, the Tamarugo tree begins to suffer damage that increases until the water table depth reaches 20 m, where the tree dies [13]. Decuyper et al. [3] studied two Tamarugo plantations that were exposed for 25 years to a decrease in the water table level in the Pampa del Tamarugal. Plantation A had an approximate decline of 3 m in 25 years (high descent) in the water table level, whereas plantation B experienced a decrease of 0.4 m in the same 25 years (low decline). The effect on trees of this groundwater depletion was quantified using the GCF. Their results showed that plantations A and B had 60% and 47% of the trees in poor condition, respectively. Despite the large difference in water table depletion observed between the plantations, the percentage of trees in poor condition did not differ substantially. This suggests that depth to groundwater may not be the best proxy for assessing soil water status for Tamarugo trees. Therefore, in order to correctly assess the amount of water that the Tamarugo trees will have due to a decrease in the groundwater level, it is essential to further simulate the evolution of the volumetric water content (or the suction) in the unsaturated zone, which is what supplies water to the roots of these trees [13,19,20].
The aim of this work was to improve the estimation of the volumetric water content available for the Tamarugo trees in an arid basin through the development of a hydrogeological model that couples the unsaturated and saturated zones. The model combines a three-dimensional MODFLOW model to simulate the saturated flow with a one-dimensional model developed in HYDRUS to represent the unsaturated flow. This hydrogeological model represents the response of the aquifer to an intensive exploitation or to fluctuations in groundwater recharge and, at the same time, it predicts the evolution of the volumetric water content in the vadose zone. Thus, with a better understanding of the behavior of the entire system in which the Tamarugo trees subsist, more informed decisions could be made for its sustainable exploitation.

2. Study Zone

The study was conducted in the Llamara basin, in the southern section of the Pampa del Tamarugal, located in the Atacama Desert, northern Chile (Figure 1). According to the Köepen climatic classification, the study site is a subtropical marine desert [21] with almost absolute absence of precipitation, low relative humidity and a large daily thermal amplitude. For the warmest and coolest months, the minimum absolute temperatures are of −5 and −12 °C, the maximum absolute temperatures are of 35 and 36 °C, and the mean temperatures are of 32 and 0 °C, respectively [13]. Annual evaporation in the Llamara basin is of ~2.680 mm [15].
The delineation of the basin was kept from that presented in an environmental impact study carried out at the study site [15]. The Tamarugo forest is located at the north of the study area, as shown in Figure 1. The location of the four monitoring sites used in the calibration of the unsaturated model is also presented in Figure 1. These sites correspond to the soil that is beneath the canopy of the T1, T2, T3, and T4 Tamarugo trees [15]. The location of the pumping wells in the study area is also shown in Figure 1.

3. Materials and Methods

3.1. Description of the Unsaturated/Saturated Coupled Hydrogeological Model

MODFLOW-2000 [22] was used to represent water flow under saturated conditions. MODFLOW is a widely used numerical model that represents groundwater flow [23,24]. MODFLOW is a three-dimensional model that uses finite-difference equations to solve mass conservation in confined and unconfined aquifers [22,25]:
d d x ( K x d H d x ) + d d y ( K y d H d y ) + d d z ( K z d H d z ) W = S s d H d z ,
where Kx, Ky, and Kz [L T−1] are the hydraulic conductivities in the x, y, and z directions, respectively; H [L] is the hydraulic head; W [T−1] is a volumetric sink/source term; Ss [L−1] is the specific storage; and t [T] is the time.
HYDRUS 1D [26] was employed to represent the vertical movement, i.e., z direction, of water through the vadose zone. HYDRUS 1D solves the Richards’ [27] equation in the vertical direction:
d θ d t = d d z [ K ( h ) d h d z K ( h ) ] S ,
where θ [L3 L−3] is the volumetric water content; h [L] is the soil water pressure head; S [T-−1] is a volumetric sink/source terms that is typically used to represent root water uptake [26]; K(h) [L T−1] is the unsaturated hydraulic conductivity curve; and all the other parameters were previously defined. Using the Richards’ [27] equation to represent water movement in the vadose zone allows incorporating processes such as precipitation, infiltration and evapotranspiration, among others [26,28]. To solve Equation (2), it is required to know the soil hydrodynamic characteristics. In this work, we used the water retention curve, h(θ) (Equation (3)), proposed by van Genuchten [29], and the K(h) (Equation (4)) described by Mualem [30]:
θ ( h ) = { θ r + θ s θ r ( 1 + | a h | n ) m h < 0 θ s h 0 ,
K ( h ) = K s S e l [ 1 ( 1 S e 1 m ) m ] 2 ,
where θs and θr [L3 L−3] are the saturated and residual volumetric water contents, respectively; α [L−1] is the inverse of the bubbling pressure; l [-] is the pore-connectivity parameter, assumed to be 0.5 [30]; n and m [-] are empirical parameters; Ks [L T−1] is the saturated hydraulic conductivity; and Se = (θθr)/(θsθr) [-] is the saturation degree.
The HYDRUS package [26,28] was used to couple MODFLOW as a variable-flow boundary condition imposed at the vadose zone of each MODFLOW cell, at each time-step. As these models are fully coupled, the HYDRUS package provides MODFLOW with recharge fluxes into the aquifer, whereas MODFLOW provides HYDRUS with the position of the water table. Note that there are other MODFLOW packages that have been developed to couple the flow in the vadose and saturated zones, such as the Unsaturated Zone Flow (UZF1) [31] and the Variably Saturated Flow (VSF) [32] packages, but the HYDRUS package was selected as it is highly applicable to represent the water flow through the vadose zone in arid and semiarid areas, with moderate computational efforts [28].

3.2. Model Implementation in the Llamara Salt Flat Basin

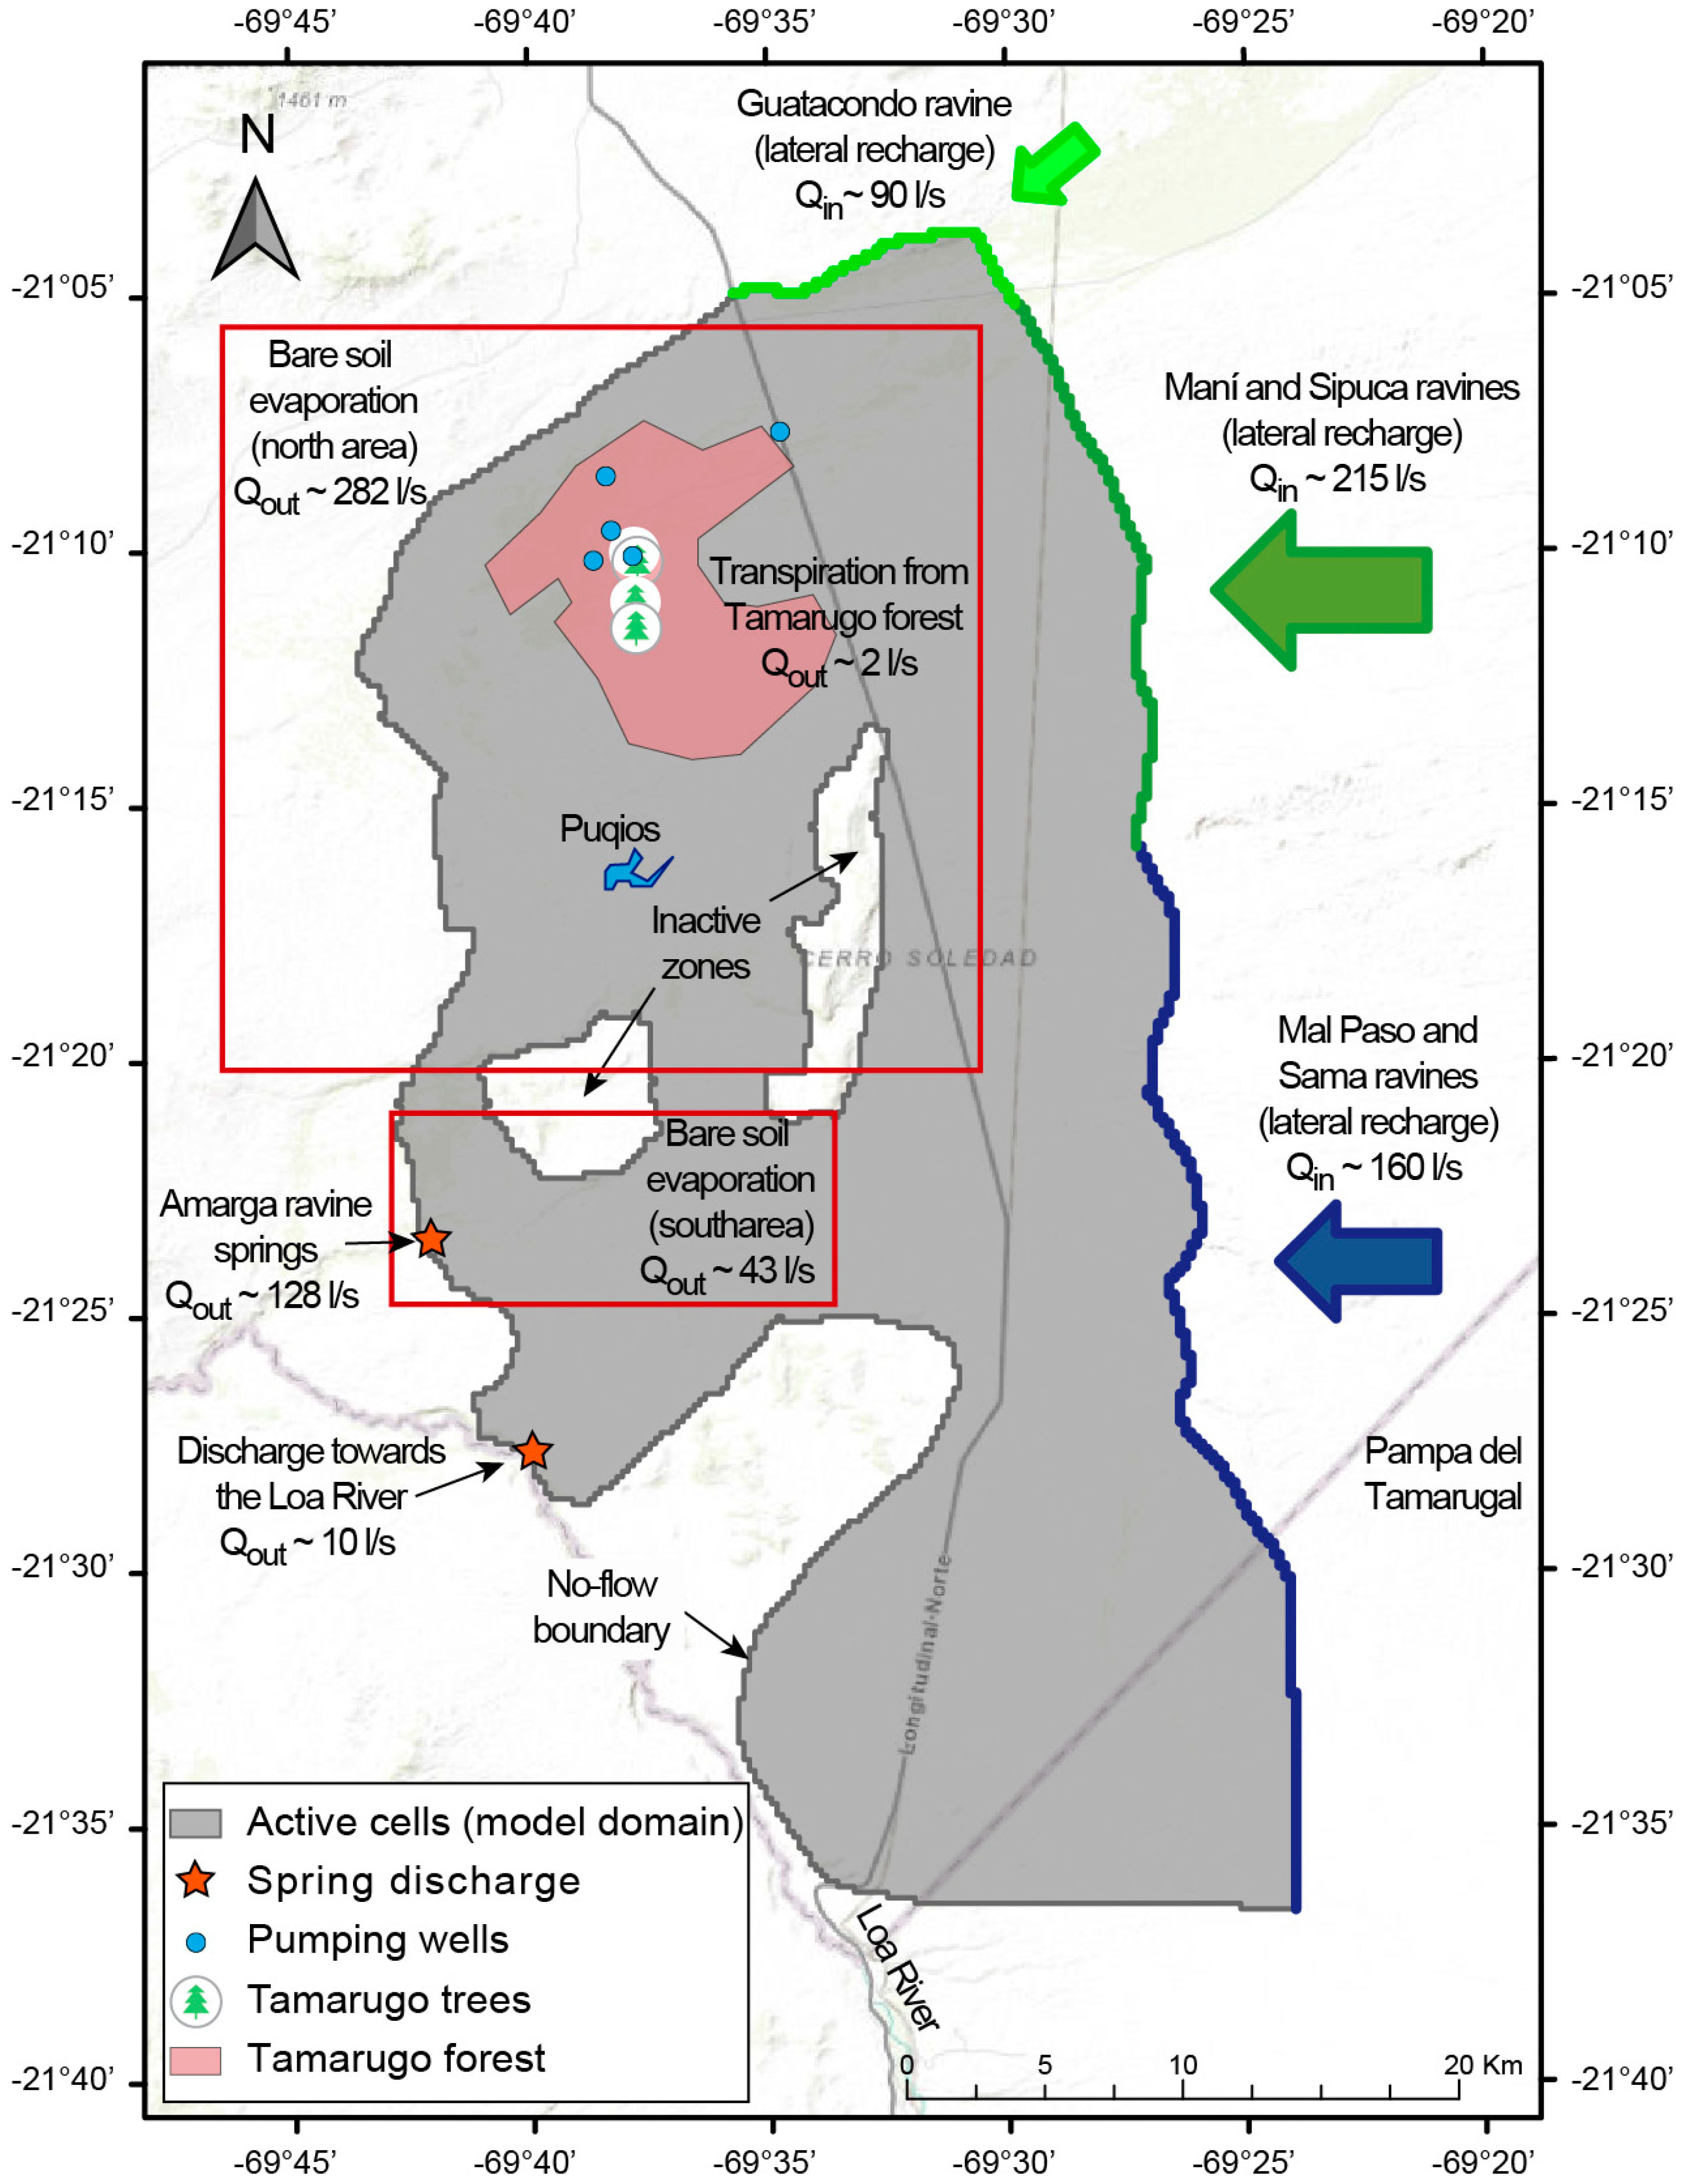
The flow in the saturated zone was represented using a previously developed MODFLOW numerical model freely available for the Llamara salt flat basin [15]. This numerical model was approved by the National Water Authority; hence, it is the model that should be used by stakeholders interested in groundwater characterization in the area. For this reason, the conceptual model to represent the flow in the saturated zone was based on the information included in the approved numerical model (Figure 2) and on publicly available information [15]. A horizontal spatial discretization of 250 × 150 cells (236 m × 236 m) and a vertical distribution of two strata of variable thicknesses were defined. The hydrogeological properties of the model, such as saturated hydraulic conductivities and storage coefficients, were also obtained from the MODFLOW model. Nonetheless, as described below, the model was completely reviewed, and the hydraulic conductivities were recalibrated to improve its initial calibration.
Groundwater recharge was estimated using a hydrological model based on the soil moisture accounting (SMA) algorithm [33]. This hydrological model was carried out for an environmental impact study of the study area [15]. The hydrological model represents precipitation, runoff, actual evapotranspiration, infiltration and deep percolation using the hydrological response units of the basin. The historical hydrological data to estimate model recharge were available between January 1978 and January 2006 [15]. The groundwater recharge comes mainly from precipitation that falls into the neighboring basins of Guatacondo, Maní, Sipuca, Mal Paso and Sama (Figure 2). This recharge enters the study zone as a lateral groundwater input and corresponds to a total of 465 L/s (estimated average recharge based on the historical data). Since there is almost absolute absence of precipitation in the study area, there is no recharge from the top of the model domain. The groundwater discharge of the aquifer is comprised by 2 L/s of transpiration from the Tamarugo forest; 325 L/s of bare soil evaporation, which is calculated using the potential evaporation rate (4.6 mm/day on average over the historical time period); a spring discharge of 128 L/s in the Amarga ravine, and an estimated discharge of 10 L/s towards the Loa river; and an extinction depth that varies between 1.5 and 6.0 m depending on the soil texture, as estimated by [15]. The extinction depth corresponds to the depth below land surface below which groundwater evapotranspiration does not occur. When the water table is above the extinction depth, groundwater evapotranspiration is represented in an exponential way, ranging between zero (at the extinction depth) and the potential evapotranspiration rate (at the soil surface). When the water table is deeper than the extinction depth, the groundwater evapotranspiration flux is set to zero.
The MODFLOW model was built to simulate 300 stress periods. The first stress period corresponded to a steady state simulation using the historical groundwater recharge. The groundwater levels obtained in the first stress period were used as initial conditions for the following stress periods, in which a transient simulation between February 2006 and September 2030 was performed. In absence of available hydrological data between October 2012 and September 2030, the historical groundwater recharge was used for this time period, although different simulations were performed to account for this issue (this is described below).
The model calibration was performed in two stages. The first stage consisted in the recalibration the saturated zone model developed by [15], which was performed for the time-period between January 2006 and March 2012, whereas the second calibration used the saturated/unsaturated coupled model for the period May–July 2006. The validation period for the saturated zone model was between February 2006 and March 2007; whereas the validation period for the saturated/unsaturated model was between November 2007 and January 2008.
In the recalibration of the saturated zone model, the saturated hydraulic conductivity distribution of the study zone was adjusted by comparing simulated and observed groundwater levels at 75 observation wells located in the aquifer (Figure 1). An isotropic aquifer was assumed in the horizontal directions, whereas the hydraulic conductivity in the vertical direction was assumed to be 10% of the horizontal hydraulic conductivity, i.e., Kz = 0.1 Kx = Ky [34]. The calibration process was performed using the PEST software [35]. PEST is a public domain code that uses an uncertainty analysis for parameter estimation [35]. Note that the recalibration only modified saturated hydraulic conductivities as it is considered that the specific storage distribution estimated by [15] is representative of the aquifer, as the obtained values were consistent among the different pumping tests performed throughout the basin. PEST develops a calibration process that minimizes the sum of the squared errors between simulated and observed groundwater levels, i.e., the objective function (Equation (5)), as a function of the model response to a value of the hydraulic conductivity:
min ε i 2 = ( X ( p i ) O i ) 2 ,
where εi is the difference between the observed and simulated value of a variable at position i in the model domain, X(pi) is the function that represents the model (i.e., the simulated hydraulic head), pi is the parameter that will be calibrated at position i (i.e., the saturated hydraulic conductivity), and Oi is the observation performed at position i (i.e., the observed hydraulic head). The initial hydraulic conductivity distribution was that reported by [15] and it was improved using the pilot points approach [36]. In this approach, instead of creating a homogeneous zone and finding its hydraulic conductivity using inverse modeling, the value of the parameter is interpolated from the pilot points (locations where the parameter values are known). Then, an inverse model is used to adjust the hydraulic conductivity at the pilot points, and the surface defining the variation of hydraulic conductivity throughout the domain is warped until the objective function (Equation (5)) is minimized. Note that PEST interpolates the hydraulic conductivity distribution using the Kriging method [35]. In this way, the regions of the model with more groundwater level observations had a continuous distribution of the hydraulic conductivity.
The calibration process in the unsaturated/saturated coupled model was performed manually and aimed to replicate the observed volumetric water content profile beneath the canopy of the T1, T2, T3 and T4 Tamarugo trees (Figure 1). The calibration consisted in adjusting the θs, θr, α, and n parameters of the van Genuchten [29] water retention model, and assuming m = 1 − 1/n [29]. The observed volumetric water contents were measured between May and July 2006, as part of the environmental monitoring plan. These data are public and can be found in the Chilean Environmental Assessment Service (https://bit.ly/31fOeFe). Additionally, the soil hydrodynamic characteristics were validated using volumetric water contents measured between November 2007 and January 2008. Unfortunately, the data available for calibration and validation of the unsaturated model were collected for a very brief period (6 months). For simplicity, we considered a uniform distribution of the water retention parameters throughout the model domain. Additionally, at each cell of the model, the vertical hydraulic conductivity, Kz, obtained from the calibration of the saturated zone model, was used as the saturated hydraulic conductivity in the vadose zone, i.e., Ks = Kz. Therefore, the relative hydraulic conductivity, K(h)/Ks, was determining by using the calibrated water retention curve parameters and Equation (4).

3.3. Impact of Groundwater Withdrawal and Recharge Rates on Water Table Levels and Soil Moisture Beneath the Tamarugo Trees

To investigate the impact of groundwater withdrawal on the survival of the Tamarugo trees, the coupled model was used to simulate the water flow in both the unsaturated and the saturated zones of the study site between February 2006 and September 2030. Specifically, the model was used to assess the impact of groundwater extraction from five pumping wells, as well as of groundwater recharge, on the water table level and the volumetric water content profile in the Tamarugo forest.
Four simulations were performed with the aim of observing the aquifer response to different water scarcity scenarios. Simulation 1 considers the impact of the five pumping wells located in the study site and their corresponding groundwater withdrawal rates, according to the water rights granted by the Chilean water authority. Simulation 2 considers that the groundwater withdrawal rates increase in 25% with respect to the water rights granted. Simulation 3 uses the groundwater withdrawal rates of simulation 1, but with a 20% reduction in the groundwater recharge that enters the model domain, i.e., a total of 372 L/s, between October 2012 and September 2030. Finally, simulation 4 also uses the groundwater withdrawal rates of simulation 1, but the groundwater recharge imposed in the model for the period October 2012 and September 2030 was that estimated using the last year with reliable data for the calculation of groundwater recharge, i.e., the monthly groundwater recharge time series estimated between October 2011 and September 2012 was repeated until September 2030. Simulations 3 and 4 provide possible future climate scenarios. The groundwater withdrawal rates and the groundwater recharge used in each simulation are presented in Table 1.

4. Results

4.1. Model Calibration and Validation

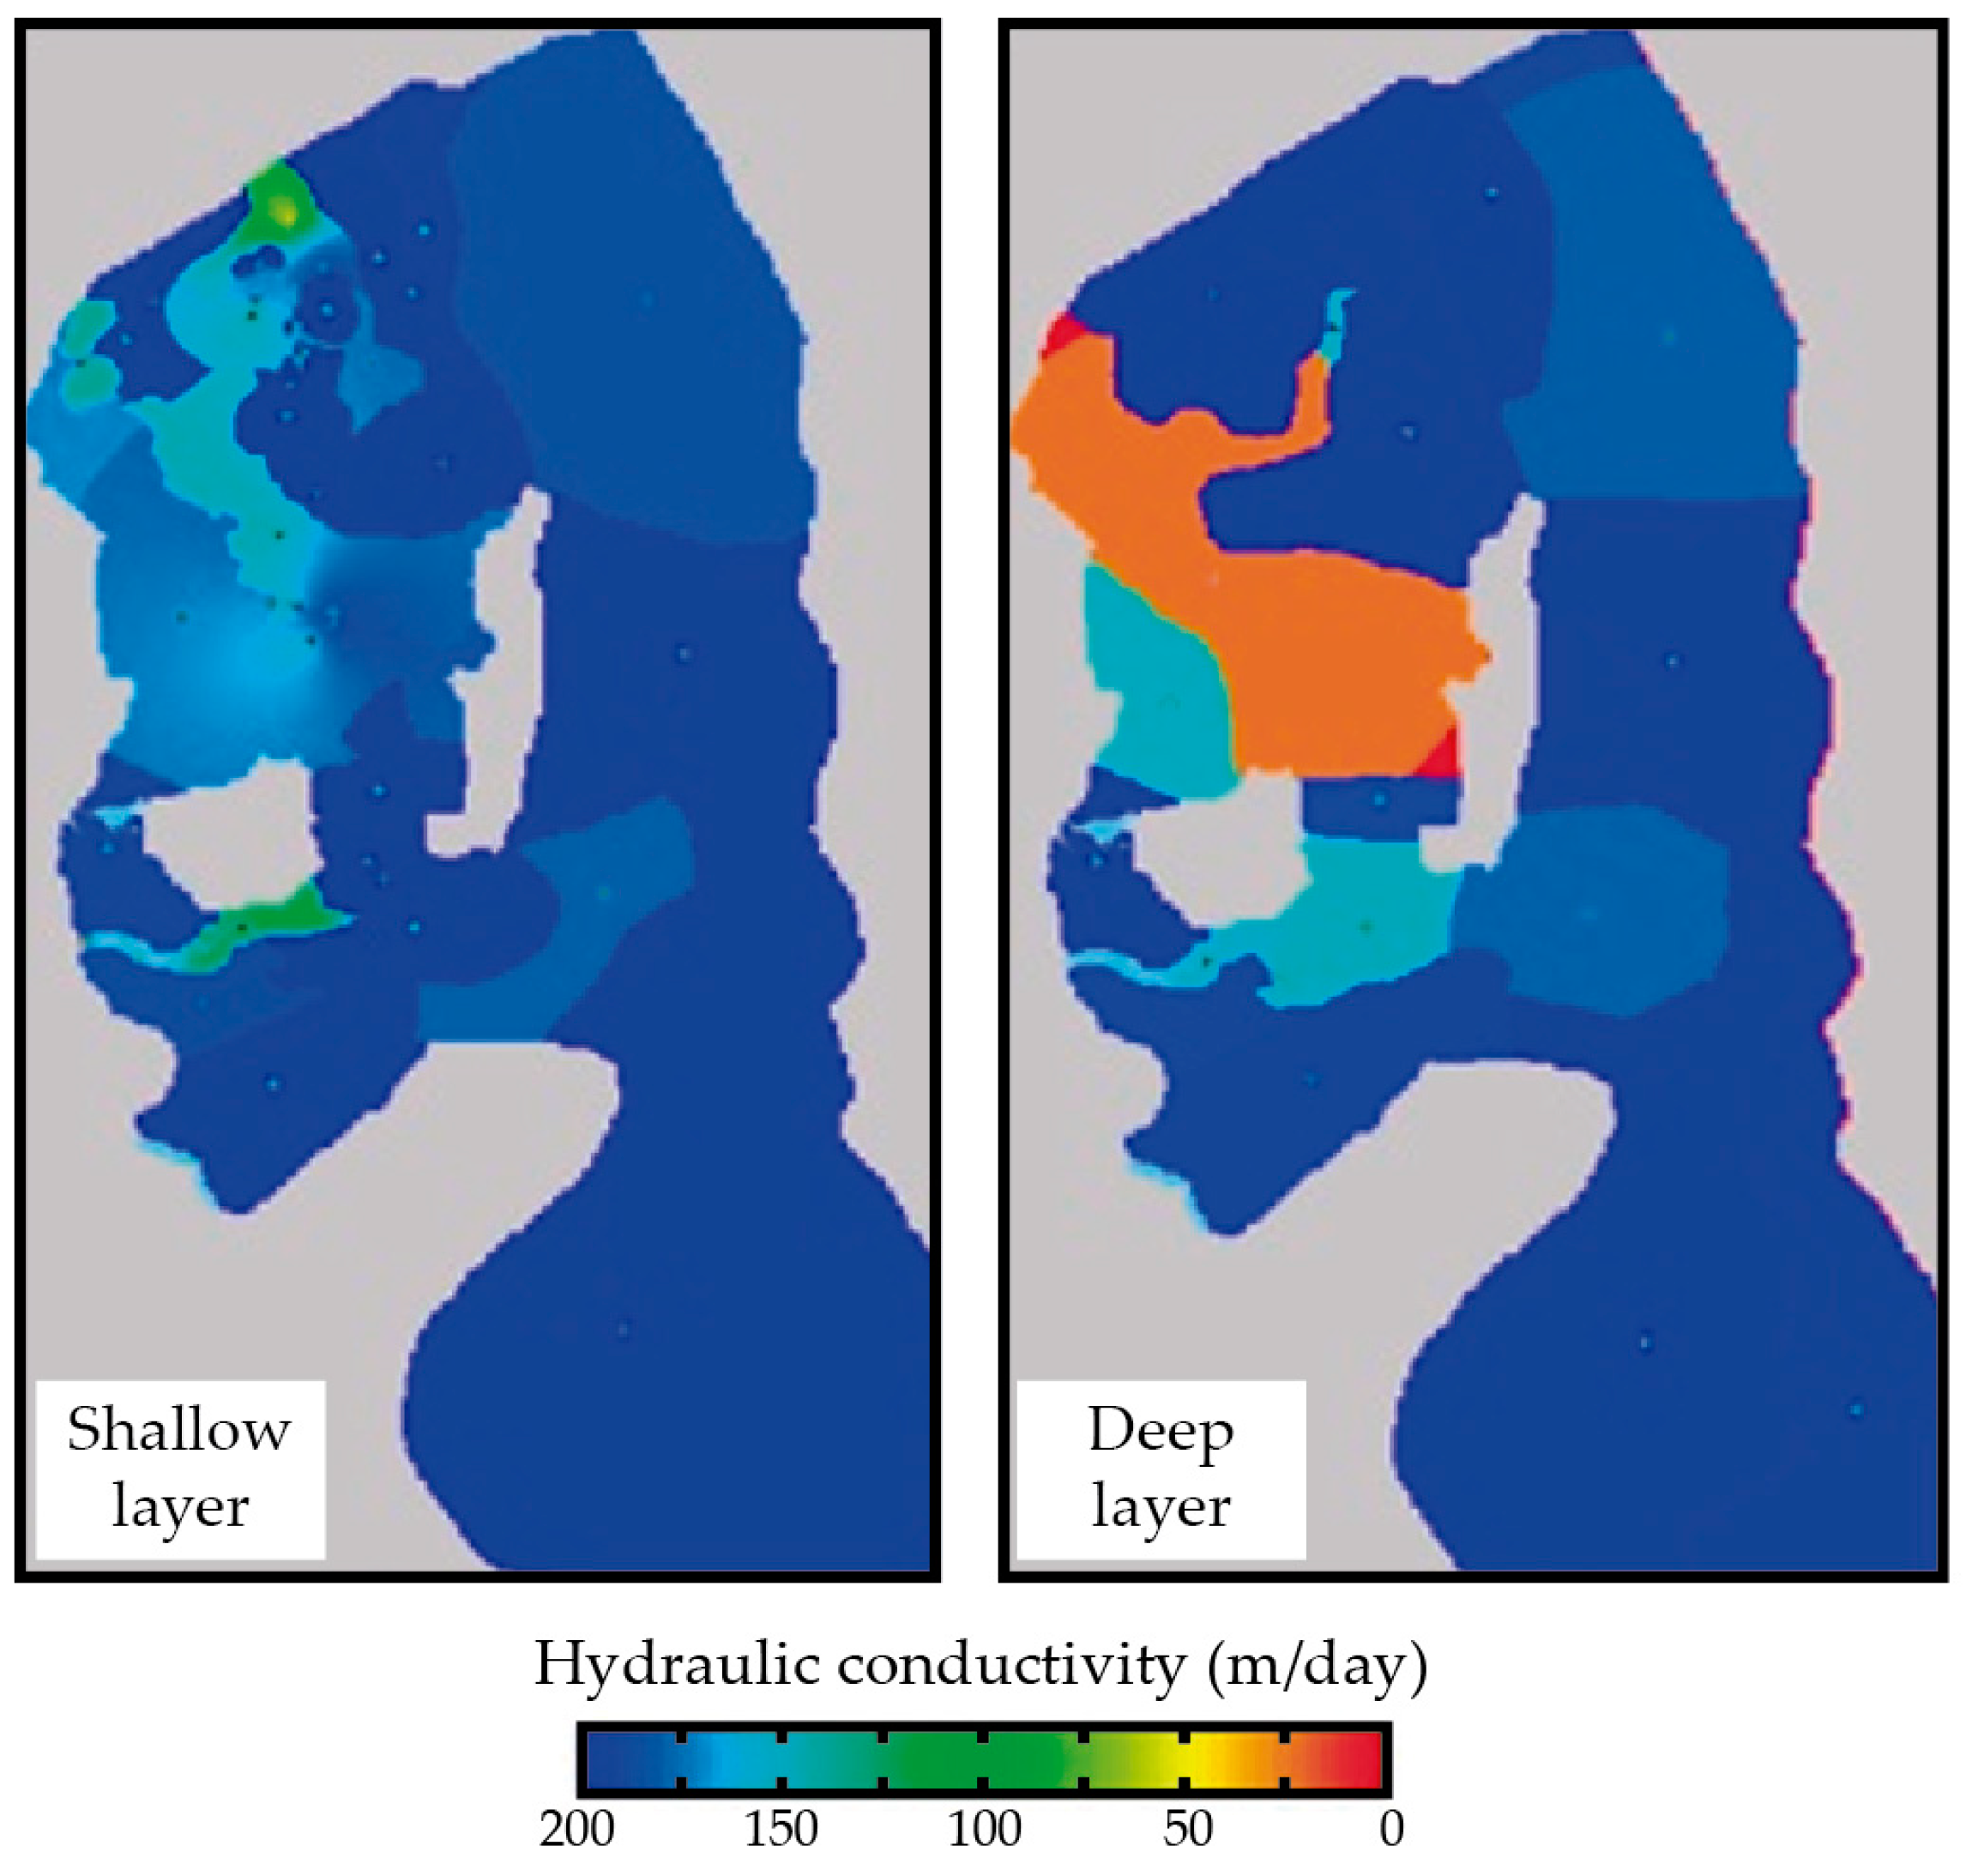
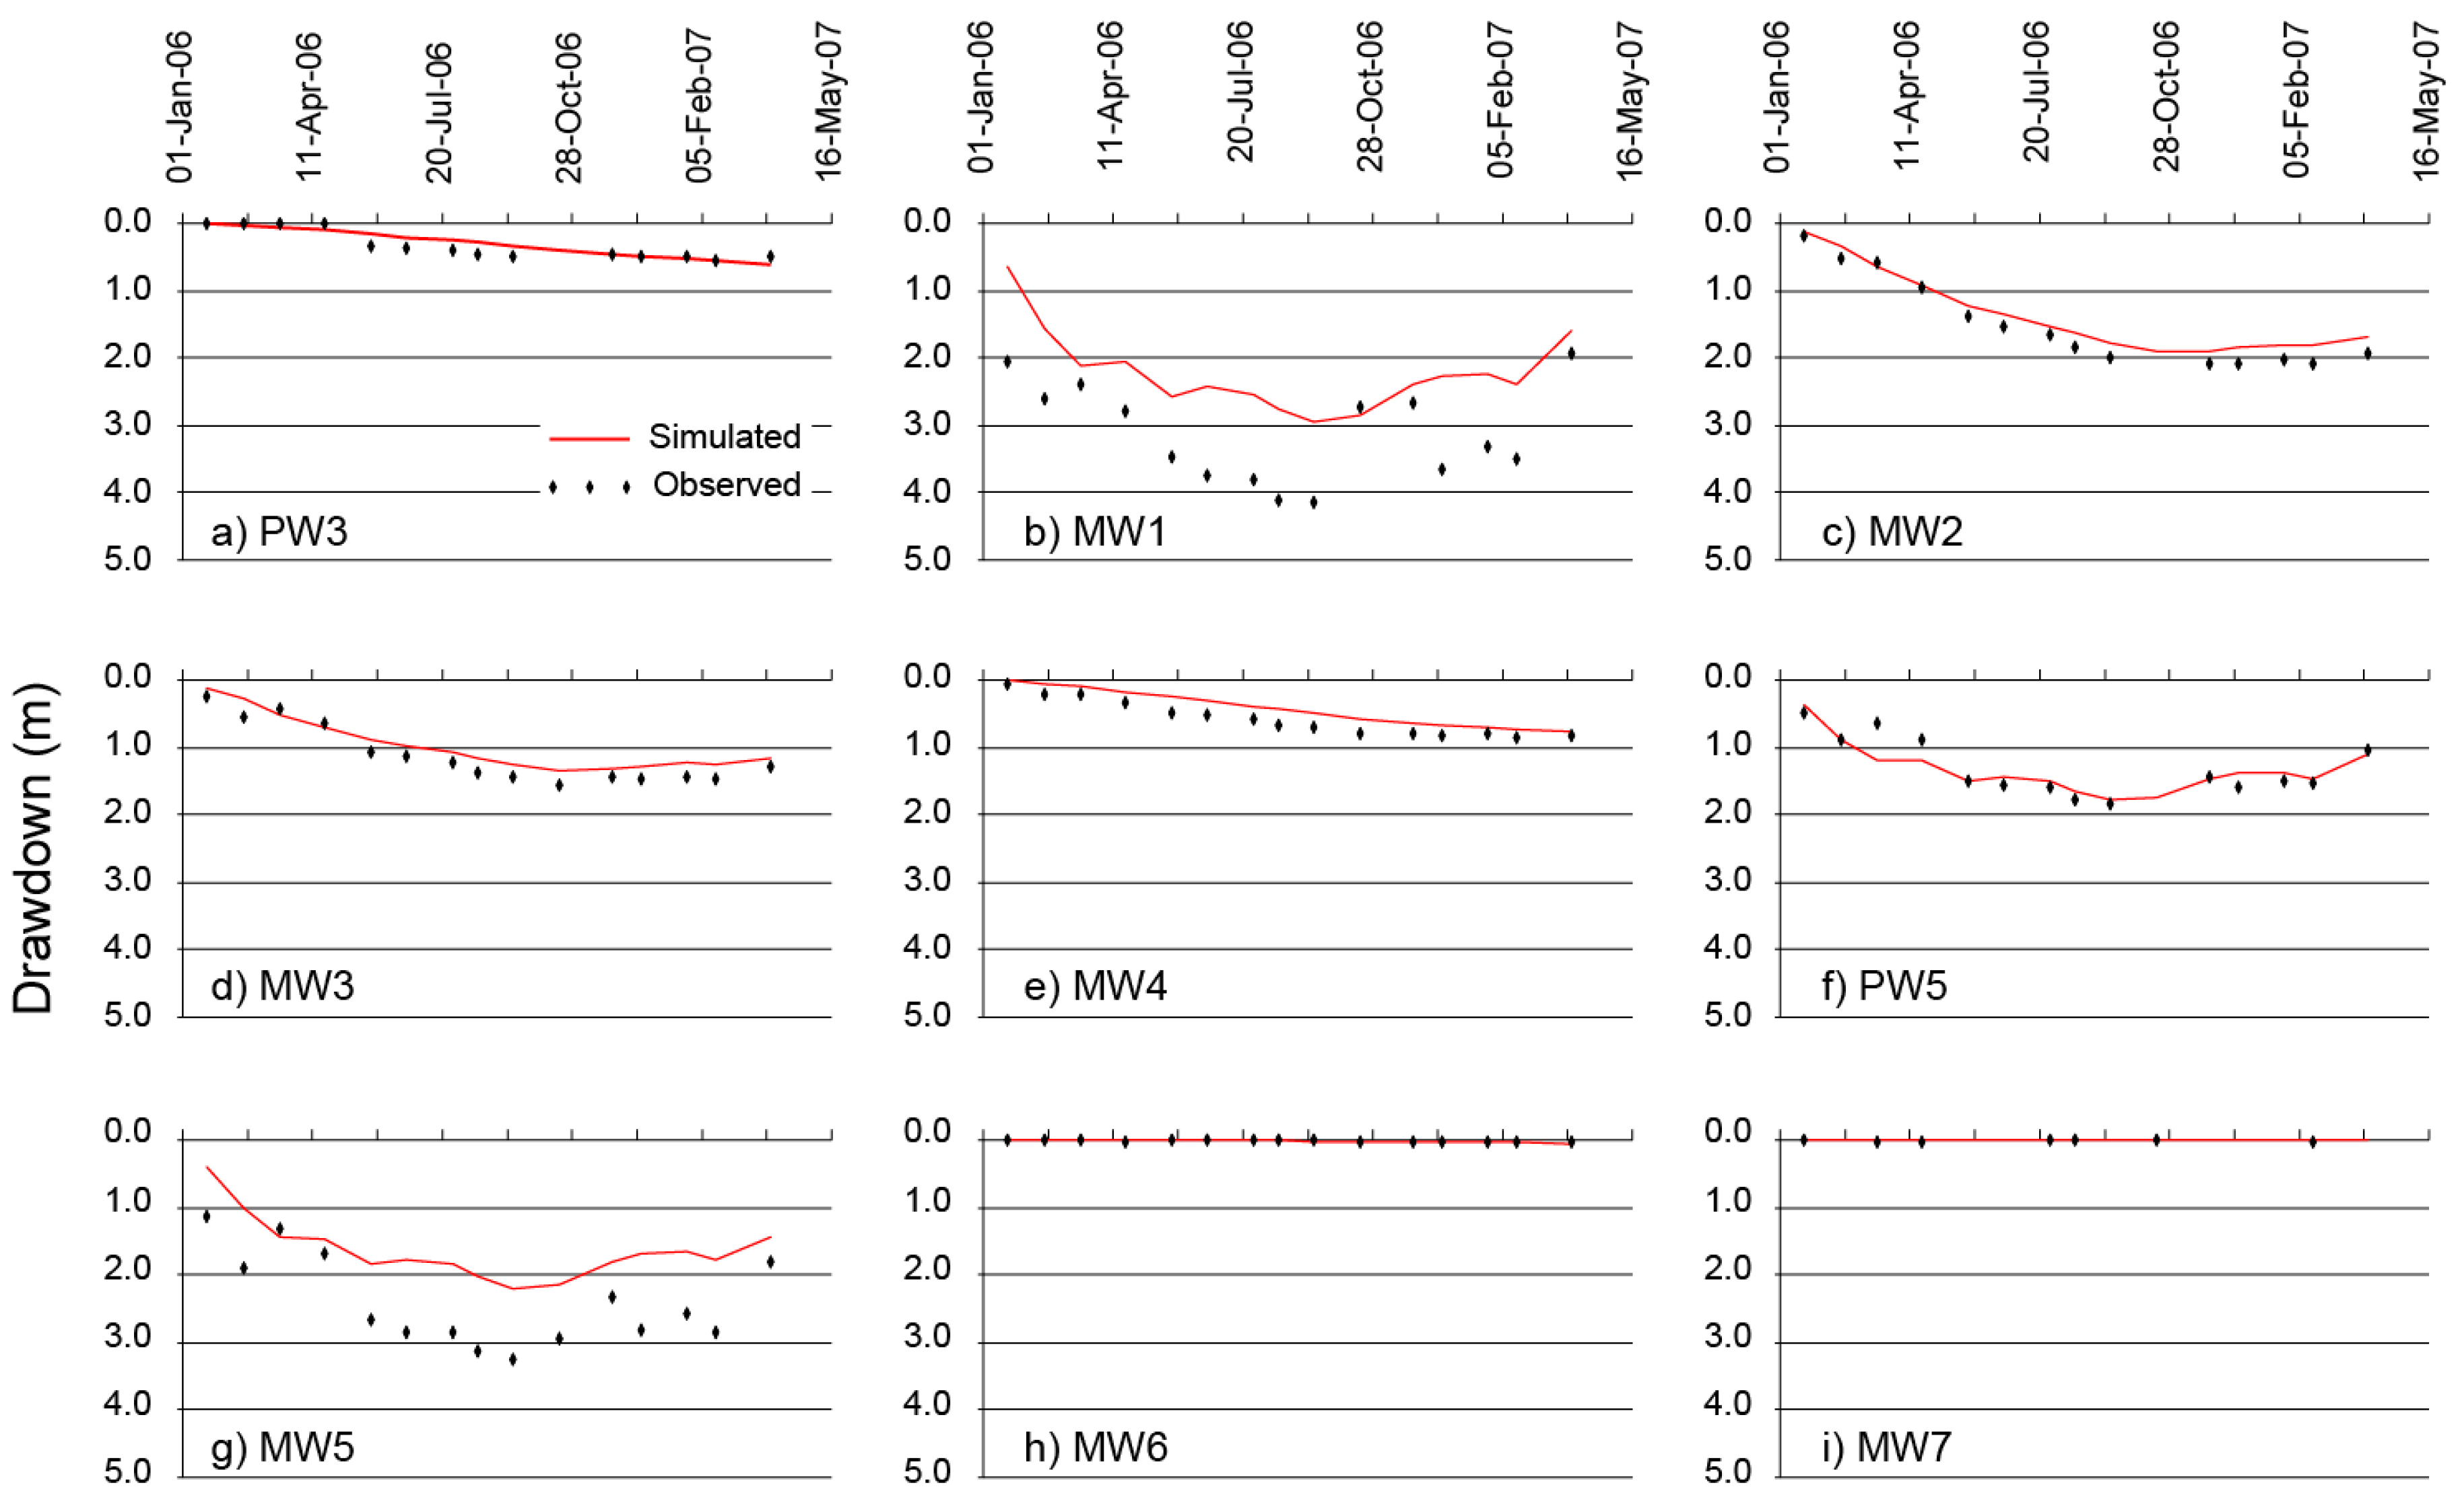
To assess model calibration and validation, among many calibration metrics, we selected the root mean squared error (RMSE) [37]. For the saturated zone model, the RMSE between the simulated and observed groundwater levels of the initial distribution of the hydraulic conductivity in the study site was of 19.9 m, and the hydraulic conductivity was represented in approximately 40 zones that had uniform hydraulic conductivity [15]. These zones were based on the geological characteristics of the study site [15]. After the calibration of the saturated zone model, the RMSE between simulated and observed groundwater levels was of 15.2 m (24% reduction). The final hydraulic conductivity distribution of the study site is shown in Figure 3 and the drawdown at selected monitoring wells for the validation period is presented in Figure 4. The worse representation of the water table was observed at MW1 and MW4 (Figure 1), which are located north of the selected Tamarugo trees. In general, in all the other locations in the aquifer, the water table levels were represented fairly well. Moreover, the simulated flows at the Amarga ravine springs and at the discharge towards the Loa River were of 128.6 and 10.6 L/s, respectively, which are very similar to those observed (see Figure 2).
The results of the unsaturated/saturated model calibration are shown in Table 2 and Figure 5. Table 2 presents the calibrated parameters of the van Genuchten [29] water retention curve, whereas the simulated and observed volumetric water contents beneath the canopy of the Tamarugo trees are shown in Figure 5. The simulated and observed moisture profiles agree well with root-mean squared errors (RMSEs) ranging between 0.007 and 0.026 m3/m3, with an average value of 0.014 m3/m3 for the 12 volumetric water content profiles used in the calibration process. The break in the soil moisture profile of the T3 tree at a depth of ~0.2–0.5 m is due to root water uptake from the zone where the highest root density was defined. Note also that the variations in soil moisture at the Tamarugo trees are small. As the period of available data to calibrate/validate the unsaturated conditions of the model was short, caution must be taken when interpreting the transient behavior of the flow in the vadose zone.
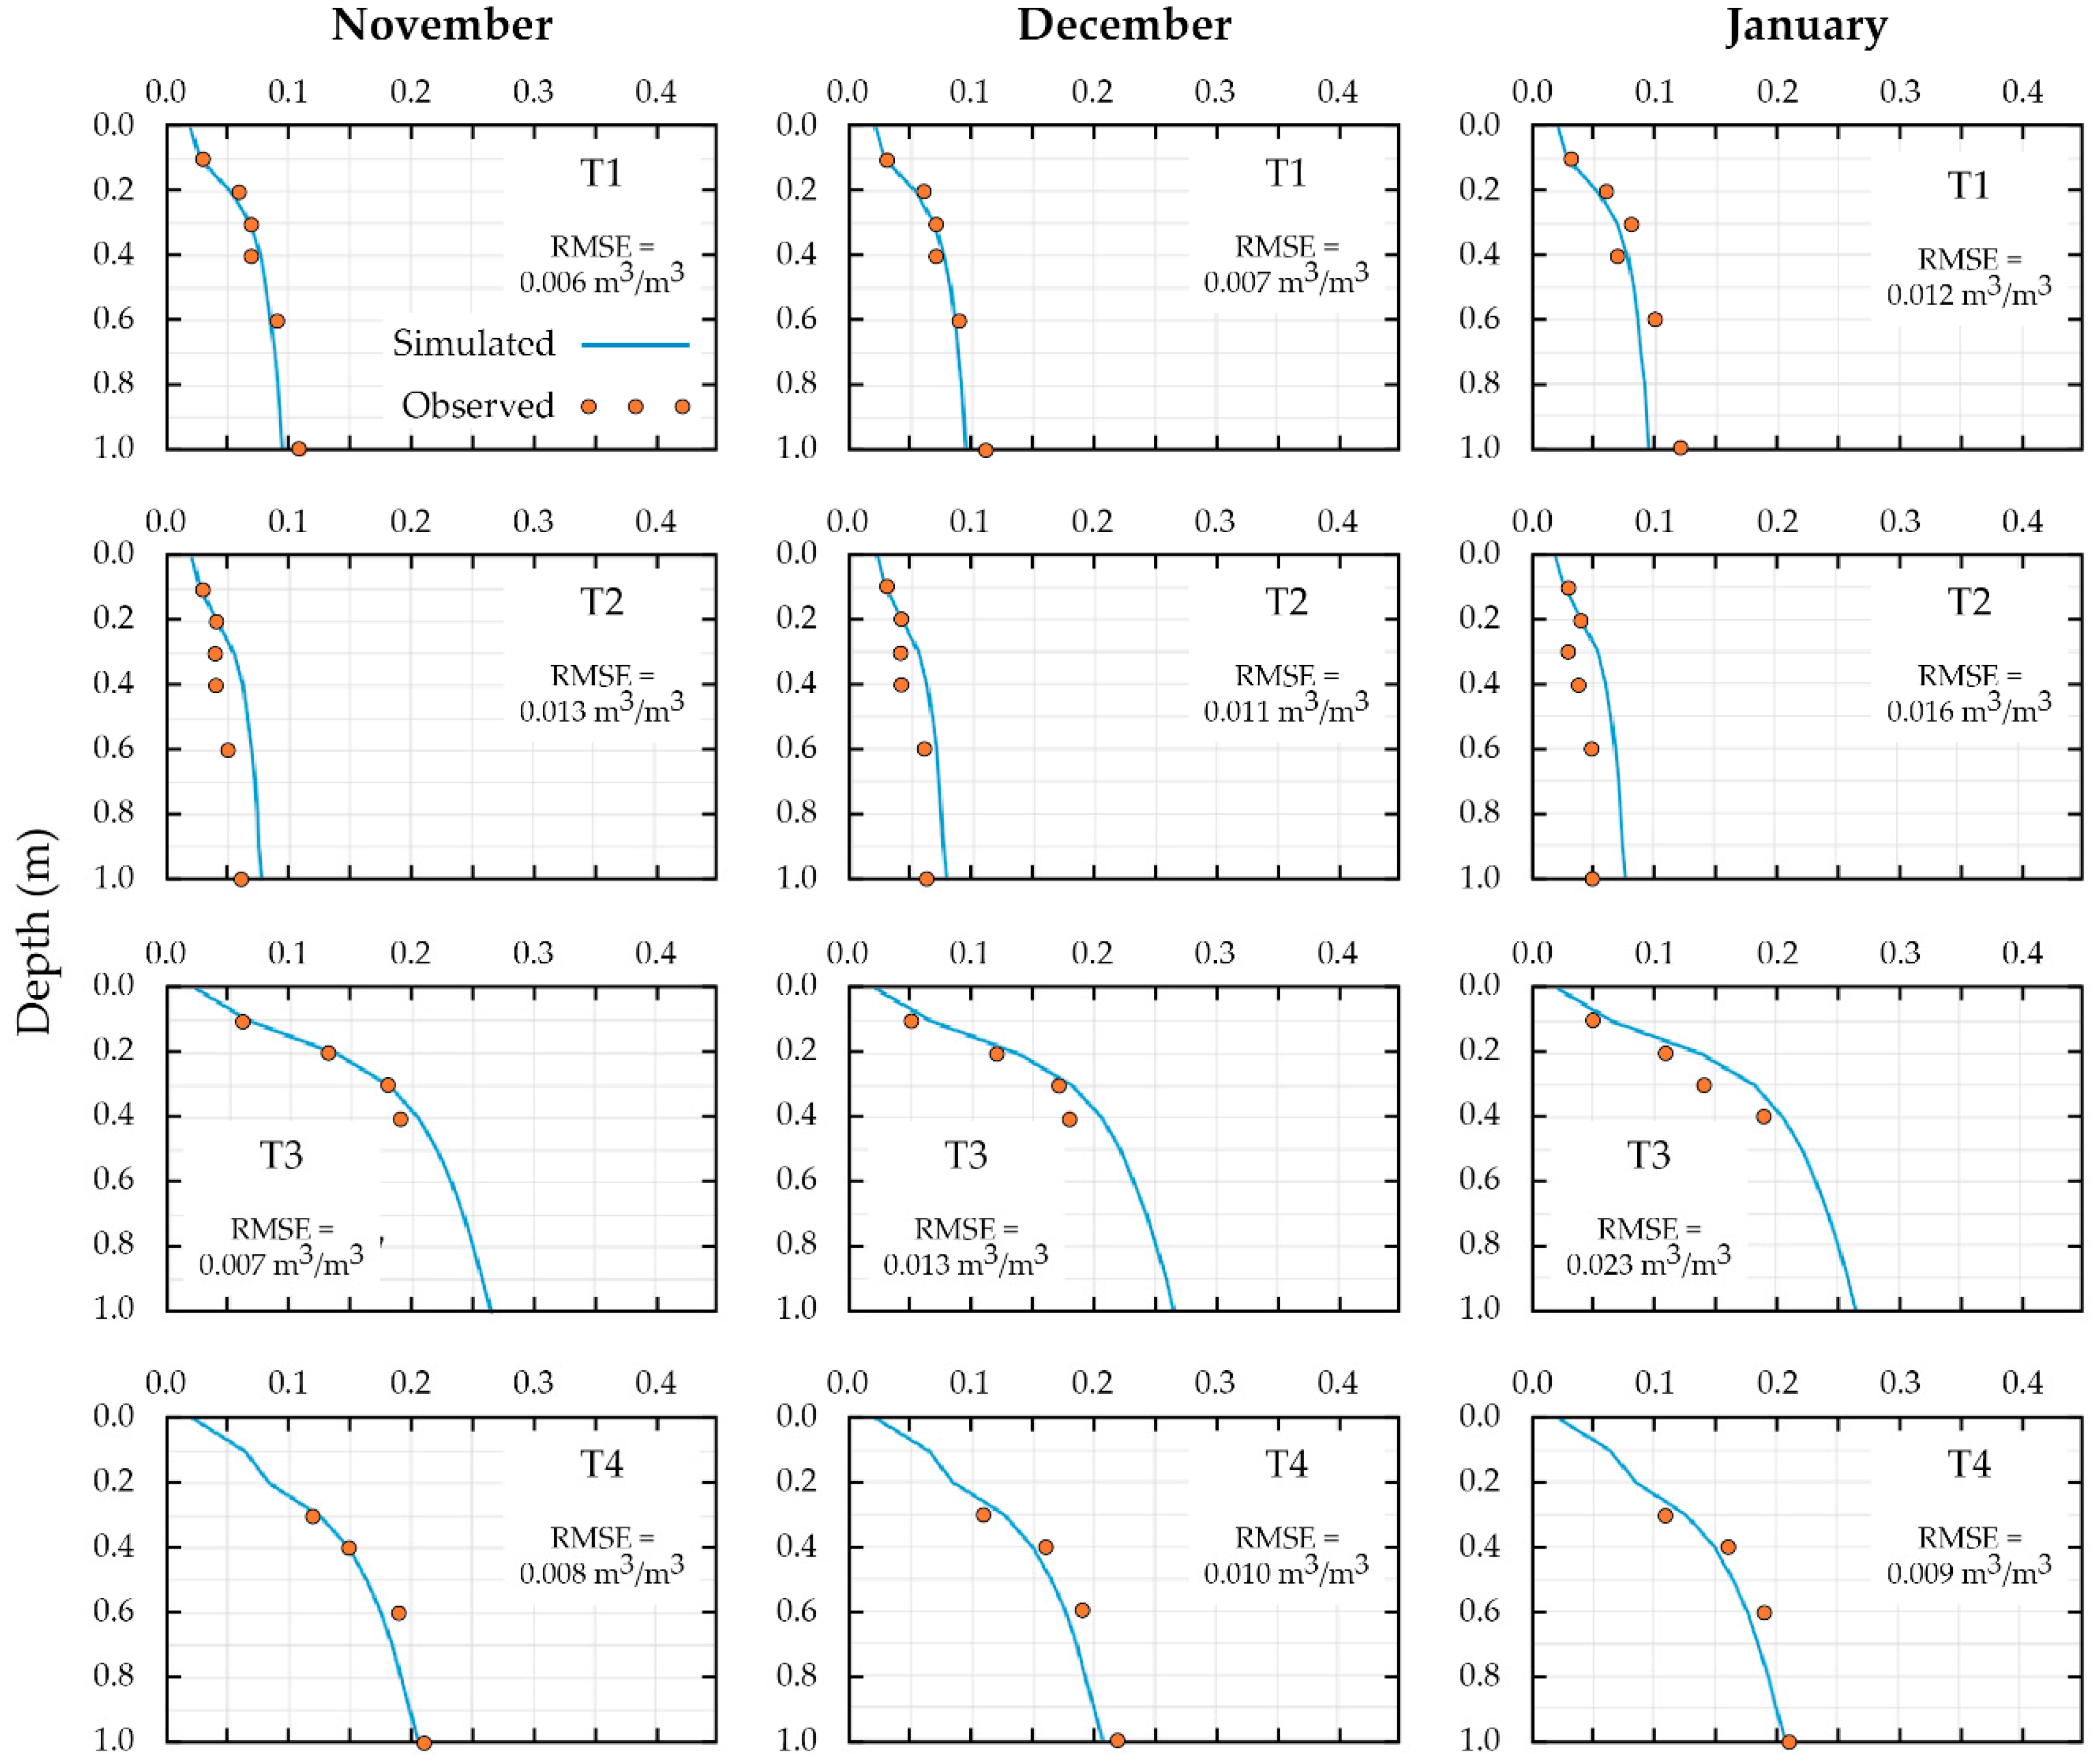
The simulated and observed volumetric water contents beneath the canopy of the Tamarugo trees agree well for the validation period (Figure 6). Therefore, the calibrated hydrodynamic properties found in the calibration process are adequate to represent the soil processes. The RMSE in the validation period ranges between 0.006 and 0.023 m3/m3, with an average value of 0.011 m3/m3 for the 12 volumetric water content profiles used in the validation.

4.2. Impact of Groundwater Withdrawal and Recharge Rates on Water Table Levels and Soil Moisture Beneath the Tamarugo Trees

4.2.1. Water Table Depth Evolution

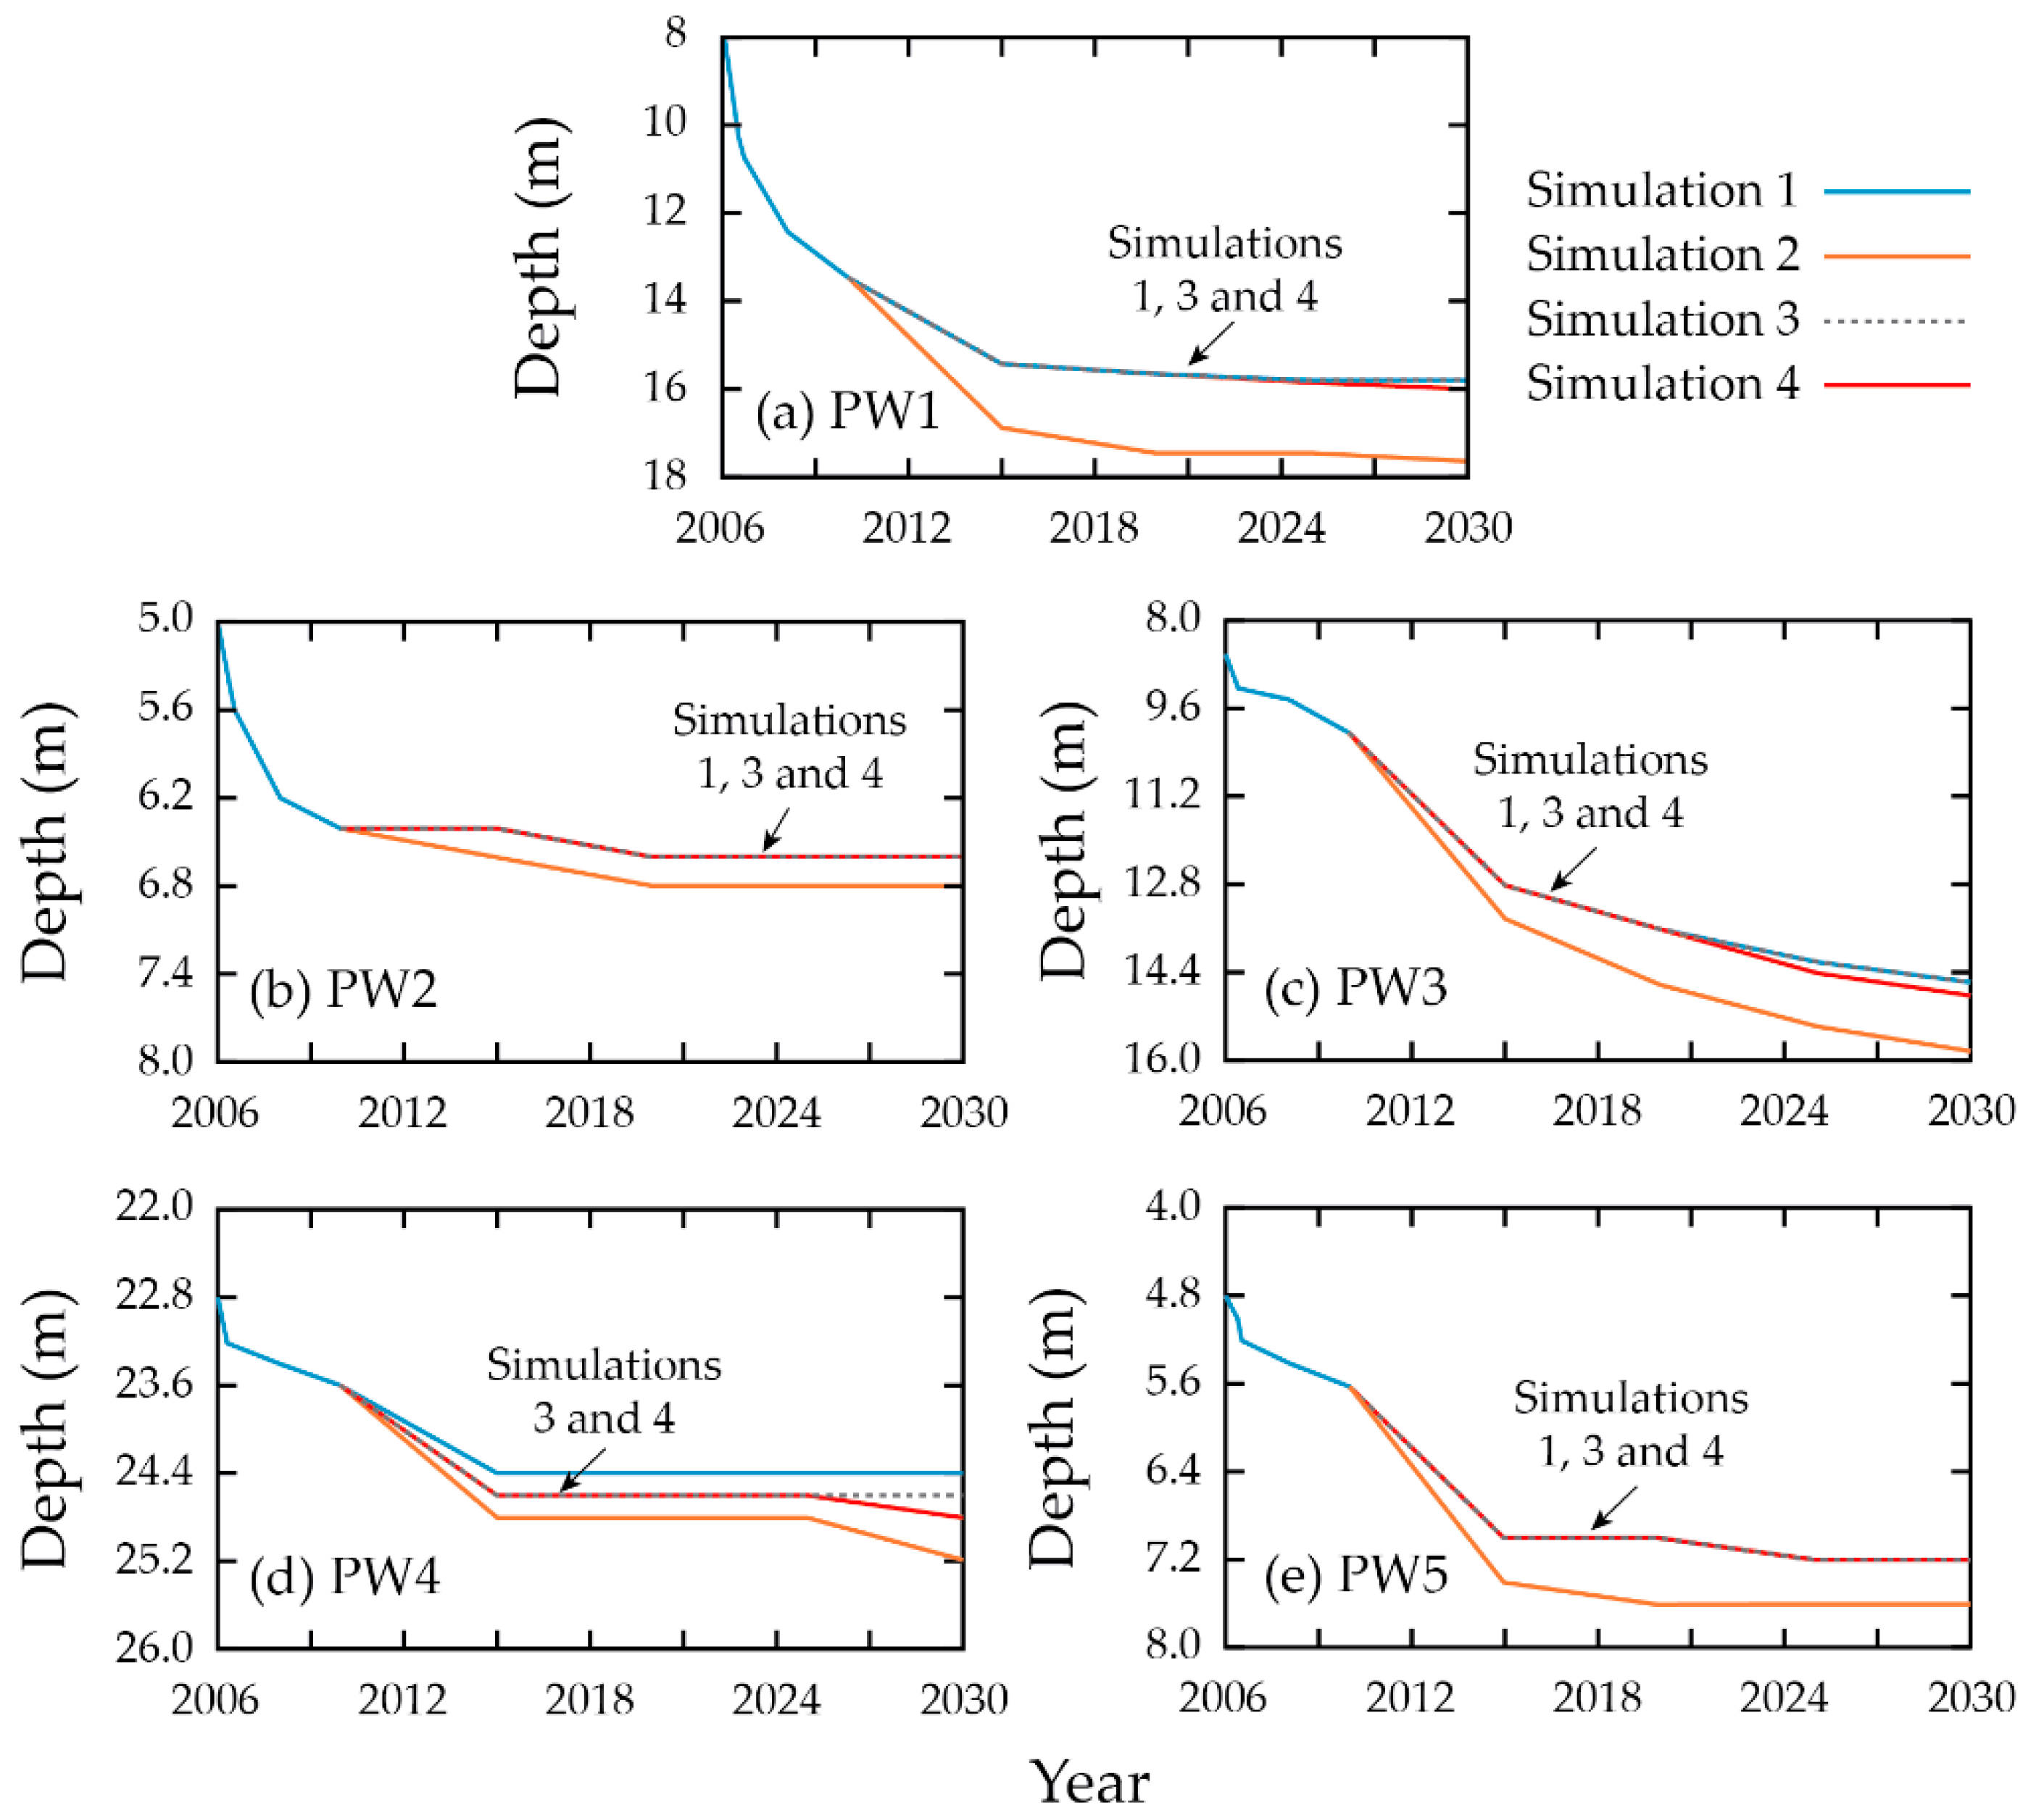
The evolution of the water level depth at each pumping well for all the simulations is presented in Figure 7. All the simulations show a water table depletion that ranges between 2 and 10 m at the different pumping wells. In general, towards the end of the simulations, the water table levels stabilize, except for those occurring at the 3X-14A pumping well. In addition, when the groundwater withdrawal rates are increased in 25% (simulation 2), the water depletion is larger than that observed for the other simulations.
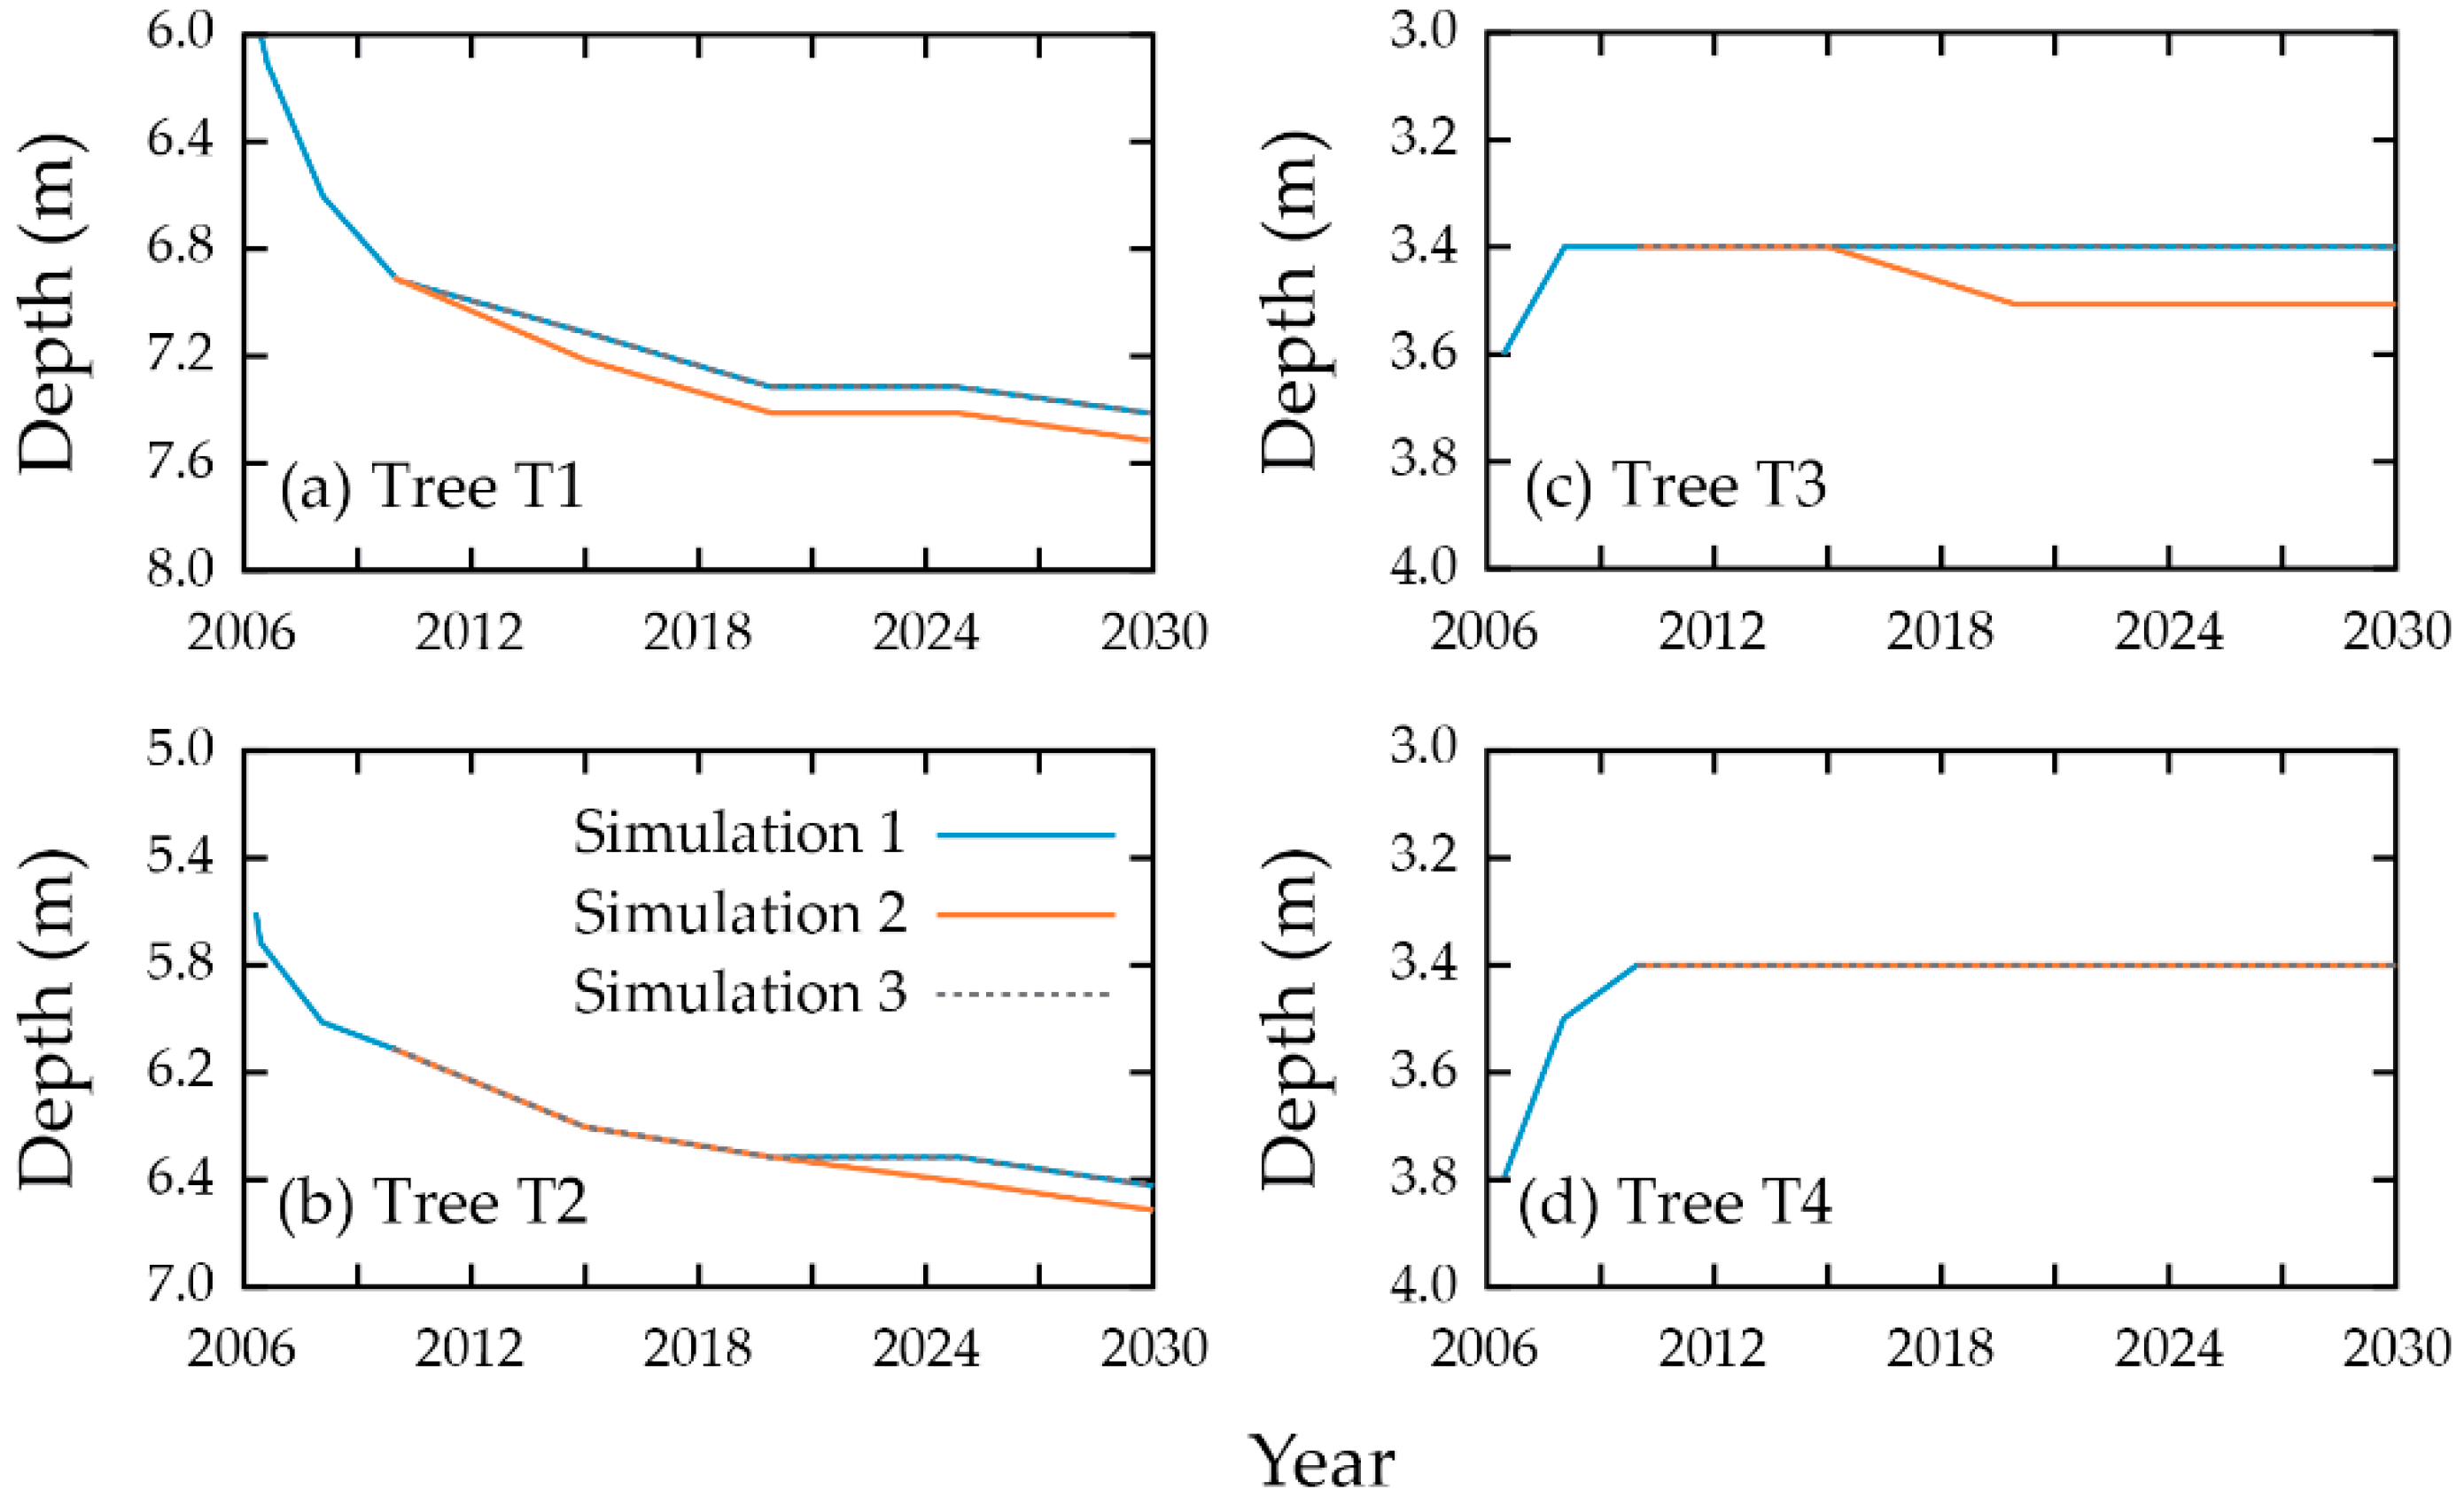
Figure 8 shows the temporal evolution of the simulated water table depth at the T1, T2, T3 and T4 Tamarugo trees. In general, no significant differences of the water table levels are observed between the simulations. When the groundwater withdrawal rates are increased (simulation 2), the water levels in the Tamarugo forest are slightly lower than those simulated for the current water rights granted (simulation 1). Note also that the trees T3 and T4 exhibit a recovery on the water table level that occurs because the average groundwater recharge is larger than that estimated at October, 2006. However, this behavior is not seen at trees T1 and T2 because they are located much closer to the pumping wells of the study site (Figure 1).
Table 3 shows the simulated drawdown at PW1 and at the T1, T2, T3 and T4 Tamarugo trees for simulation 1 (baseline), and the distance of each Tamarugo tree to PW1. On the one hand, after 6 months of pumping, only the T1 and T2 trees are within the radius of influence of the pumping wells. On the other hand, the T3 and T4 trees are exposed to a water table level recovery for the years 2010 and 2030. As explained before, this recovery is due to the groundwater recharge considered in the simulations.

4.2.2. Volumetric Water Content Evolution Beneath the Canopy of the Tamarugo Trees

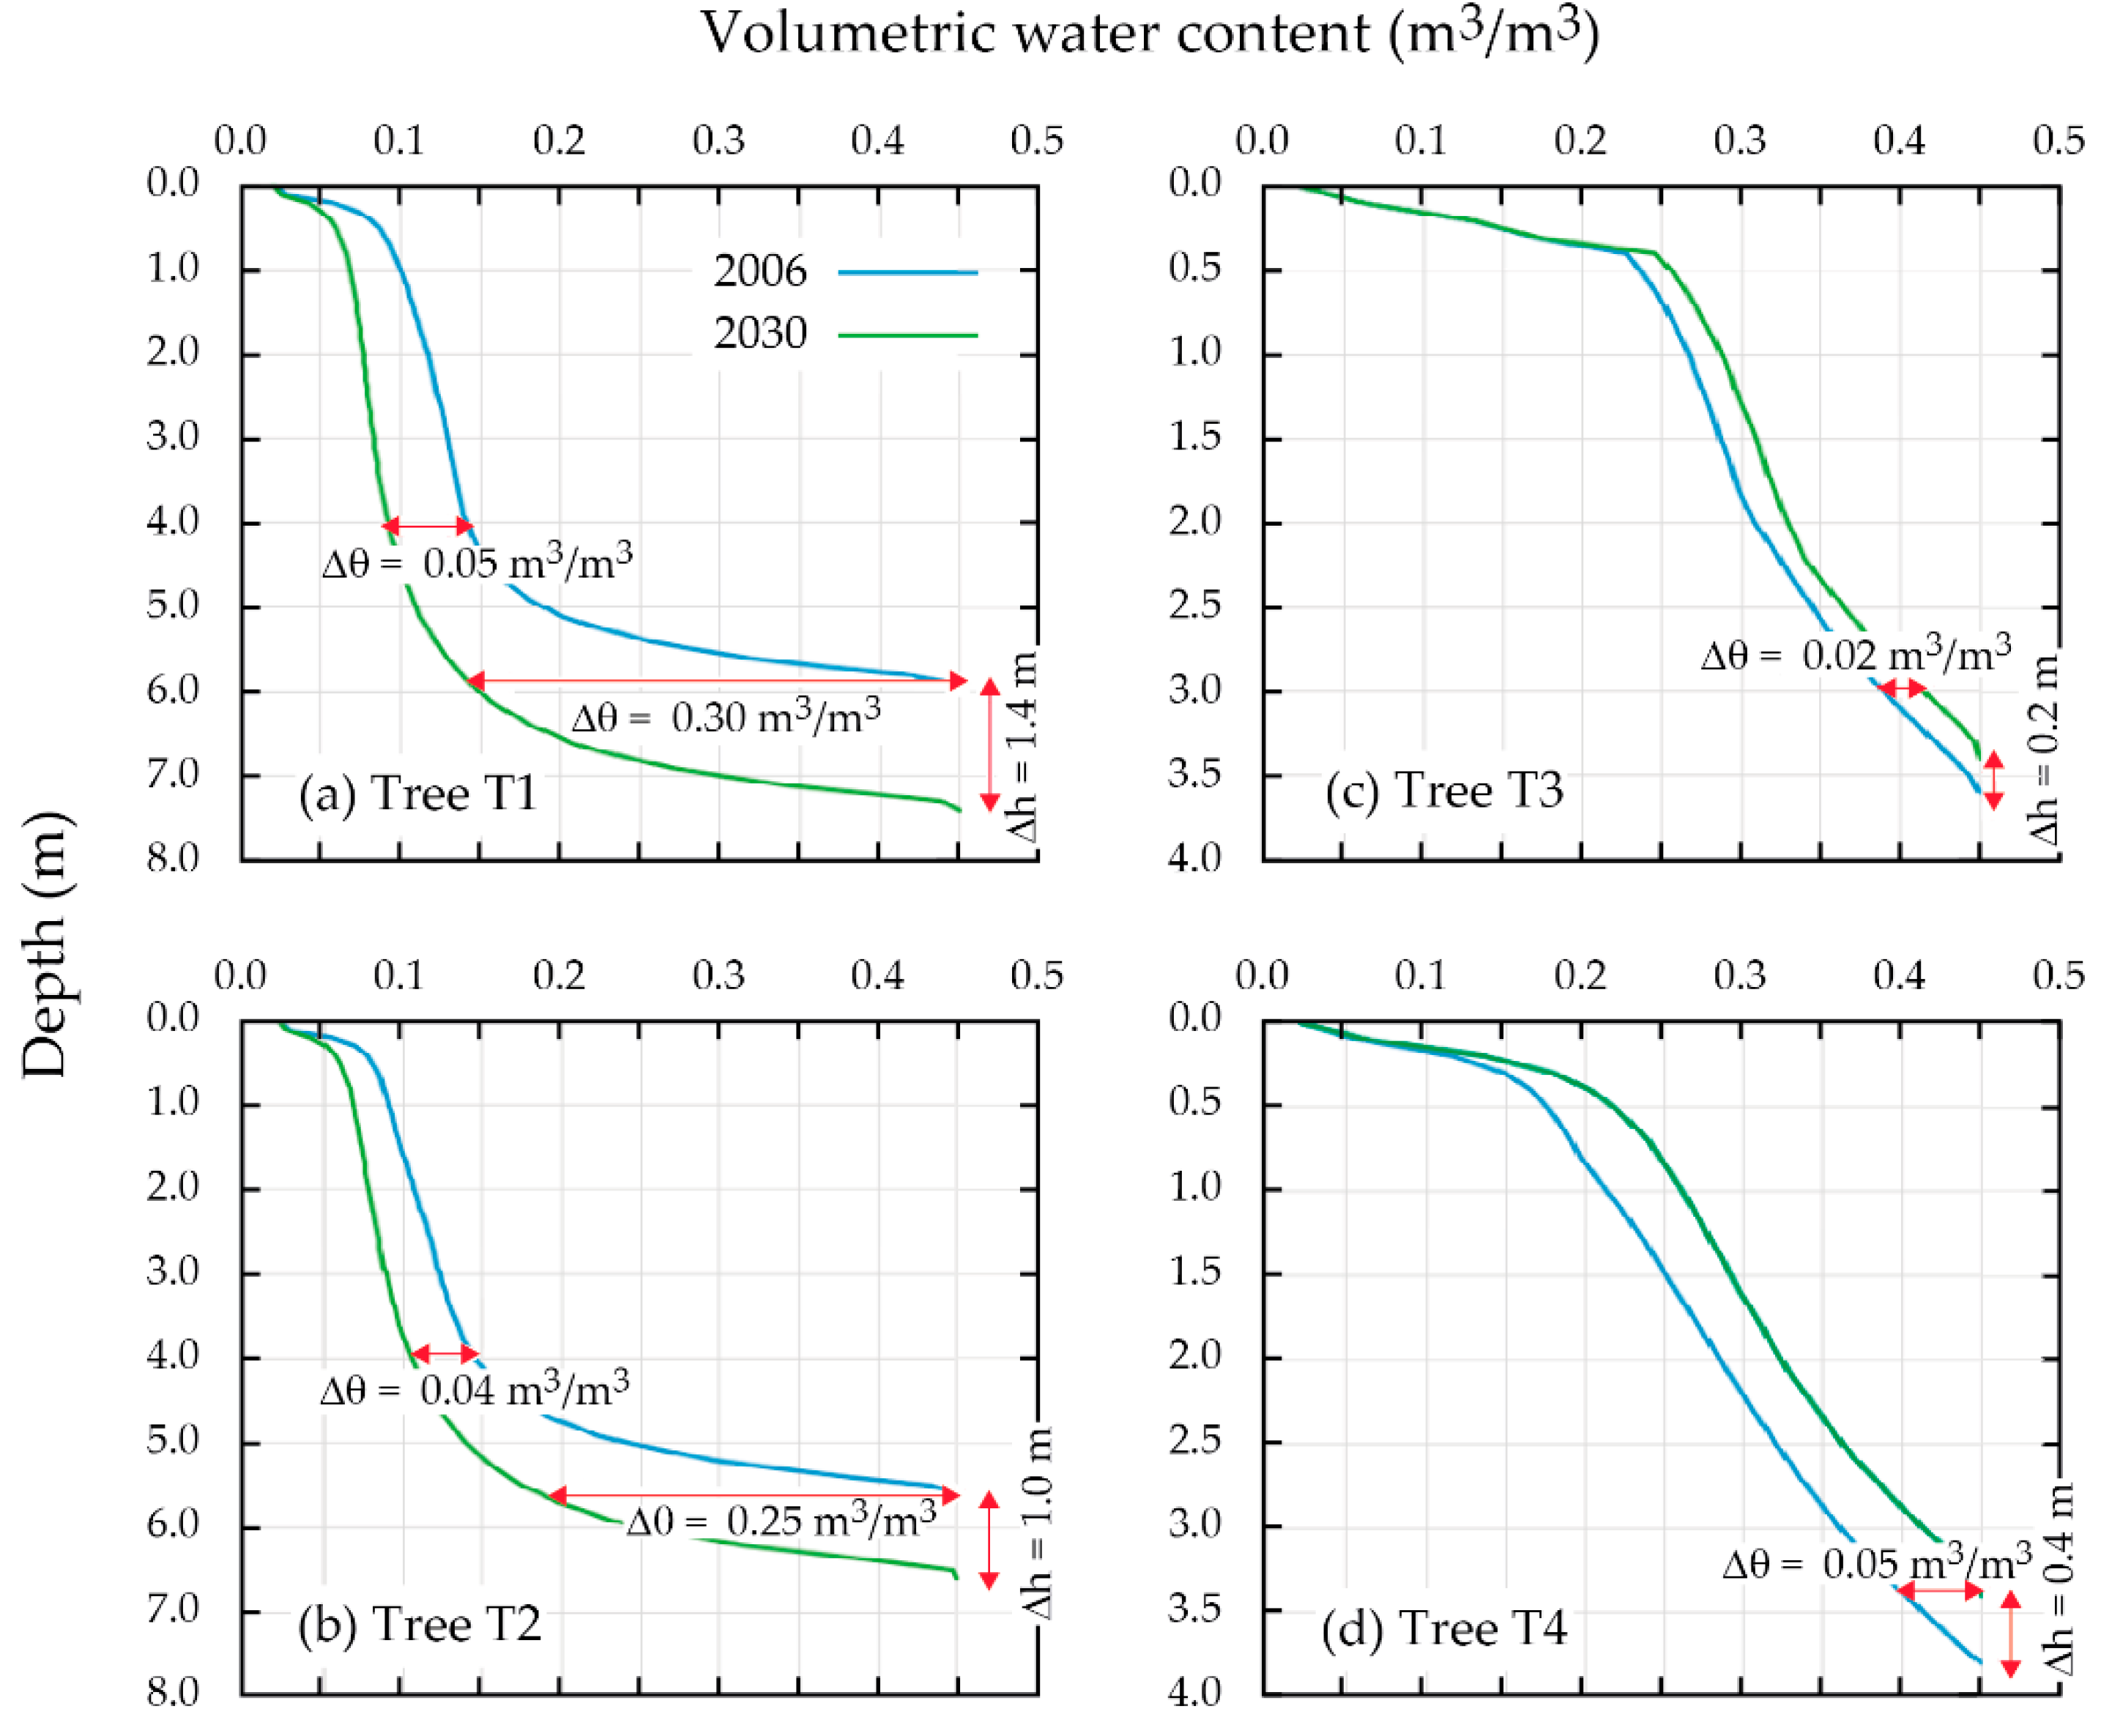
Using the HYDRUS package, the soil moisture evolution in the model domain was simulated. A comparison between the volumetric water content profiles at the T1, T2, T3 and T4 Tamarugo trees for the beginning (2006) and for the end (2030) of simulation 1 is presented in Figure 8 (baseline). The T3 and T4 trees, which are further away from PW1 (Figure 1), show a larger volumetric water content at depths deeper than 0.5 m, compared to the T1 and T2 Tamarugo trees (that are closer to PW1), which exhibit a similar volumetric water content (~0.25 m3/m3) at depths of 5 m. At trees T1 and T2, the difference in volumetric water contents between the beginning and the end of the baseline simulation does not exceed 0.05 m3/m3 up to 4 m deep. However, at a depth of 6 m in the T1 Tamarugo tree, the difference between the volumetric water content at the beginning and at the end of the baseline simulation is more important (~0.3 m3/m3). Similarly, at a 6 m depth in the T2 Tamarugo tree, at the beginning of the simulation, the soil is fully saturated (0.45 m3/m3), whereas at the end of the simulation, the volumetric water content reached ~0.20 m3/m3.

5. Discussion

The Tamarugo trees are subject to multiple abiotic and biotic stress factors that affect plant productivity. When a stress factor surpasses the physiological performance threshold, plant survival is threatened [10]. Groundwater overexploitation is one factor that can damage the Tamarugos trees, not only because as the water table drops, the roots of the Tamarugo cannot reach the saturated zone, but also because less water is available in the unsaturated zone for root water uptake [13]. Water stress can result in biomass reduction for an individual tree, but also in a reduction of the tree population. Hence, the ecosystem dynamics can be permanently modified [10]. For this reason, it is important to monitor the impacts of groundwater extraction on different variables that can be used to assess the survival of the Tamarugo tree, as well as to develop predictive tools for water resource management that incorporate ecological constrains.
Nowadays, there are mining projects in the study area that have water rights granted to extract groundwater for decades. Consequently, there are environmental monitoring plans that aim for Tamarugo survival. The state of the Tamarugo trees is being monitored using relationships that combine the GFC, NDVI, 18O enrichment in the foliar tissue, twig growth with the water table depth. Soil moisture is also being monitored beneath the canopy of the trees. Unfortunately, continuous measurement of soil moisture using time-domain reflectometry or other methods is extremely complex due to the soil’s high salinity [38] so there are only discrete observations of this key variable. The gravimetric method, which is highly destructive and time consuming, has been used to get insights of volumetric water content levels near the Tamarugo trees. The latter reinforces the need for tools, such as the coupled unsaturated/saturated model presented in this work, to predict variables that are directly associated to water stress, i.e., the soil’s volumetric water content.
Our results show that an increase in groundwater withdrawal rates results in additional drawdown of water table levels near the selected Tamarugo trees. However, changes in future groundwater recharge do not have a notorious influence on modeled groundwater levels near the pumping wells or beneath the selected Tamarugo trees (Figure 7 and Figure 8), i.e., the water table evolution in this area of the model is similar in the four simulations investigated in this work. This behavior is explained by the large distance between the eastern recharge boundary and the pumping wells and trees, as well as because the simulated groundwater extraction rates are generally smaller than the groundwater recharge. Consequently, changes in groundwater recharge and in withdrawal rates are mainly balanced by changes in bare soil evaporation and groundwater storage. However, when groundwater extraction rates are larger than groundwater recharge, water table levels will drop, and groundwater storage will be depleted [34]. In simulation 4 (recharge maintained), which has a groundwater recharge that is smaller than the overall pumping rates, the groundwater levels modeled were similar to those simulated in the other scenarios (Figure 8). Nonetheless, near the model boundaries groundwater storage and water table levels were slowly decreasing, which is consistent with the field evidence that the flow at the Amarga ravine springs has been decreasing over time [15]. Therefore, caution must be taken to ensure that the groundwater rights that have been granted do not surpass groundwater recharge. This issue is of extremely importance in the study area because during the last 30 years, there has been a sustained increase in groundwater withdrawal rates in the Pampa del Tamarugal aquifer [3,8,14], and it is likely that climate change will reduce even more the groundwater recharge.
Even when the water table levels decreased up to ~10 m at PW1 for the different simulations, water table levels at the selected Tamarugo trees did not reach the depth that, according to [15], damages the trees (i.e., 13.3 m). However, according to [13], the T1 and T2 could be damaged because the water table levels are below 6 m. This depth corresponds to the first physiological threshold of the damage scale reported in [13], in which the Tamarugo tree keeps its water status by decreasing water demand through partial defoliation and decreased twig growth. Given the differences between these methods to assess Tamarugo survival, which only use the water table depth to infer tree damage, other key variables, such as volumetric water content, must be included in this analysis.
The evolution of the soil’s volumetric water content was achieved by incorporating the HYDRUS package in the MODFLOW model. Our results show that the T3 and T4 sites show a rapid increase with depth in the volumetric water content at shallow depths. The moisture content increase deeper into the soil is more gradual, reaching saturation values at depths of 3–4 m (Figure 9). The difference between the initial (2006) and final (2030) soil moisture profile for these sites does not surpass 0.05 and 0.02 m3/m3, for T4 and T3, respectively. At T2, a water table drop of 1.0 m results in a moisture reduction of ~0.25 m3/m3 at ~5.5 m depth between 2006 and 2030. Therefore, even if the water table depletion is relatively small, soil moisture can drastically decrease. These results help explaining what was observed by Decuyper et al. [3], in which small water table drops greatly reduced the water available for the Tamarugo tree at a state where half of a Tamarugo forest exhibits damages.
As described previously, the applied model was based on a previously developed MODFLOW model available for the Llamara salt flat basin, and on public information [15]. This model was approved by the national water authority. For this reason, we did not change boundary conditions or groundwater recharge or discharge; however, as the water table evolution near the pumping wells and trees was similar in all the simulations, the groundwater recharge rates should be further explored to ensure that there are no flaws in their estimation. Our focus, instead, was to improve the hydraulic conductivity distribution and the couple the unsaturated model to provide a management tool to estimate the response of the Tamarugo tree to soil moisture fluctuations. Therefore, the applied model has limitations that can be overcome so there are many opportunities to improve it. First, to avoid structural errors of the model, a new calibration can be implemented using lateral head differences instead of absolute heads [39,40]. It has been recognized that as a result of uncertainties and simplifications in the model, some parameters most likely will have values that compensate for structural defects in the model and that are biased by incorrect model boundaries [39]. Secondly, a new type of observational data can be used to improve the calibration. For instance, the method proposed by Schilling et al. [41], which reduces uncertainty in model parametrization, uses tree ring growth data and transpiration to calibrate a hydrogeological model that represents interactions between surface water, vadose zone, groundwater, and vegetation. In our case, the Schilling et al. [41] method could be modified to use tree distribution as another target in the model validation.
Future research should focus on improving the current unsaturated/saturated model and its input parameters. The following are some future research directions that we foresee: (1) update of hydrological, hydrogeological and ecological data to improve the model prediction capability; (2) perform a new calibration that ensures minimization of structural errors of the model by using lateral head differences [39,40]; (3) incorporate a new type of experimental data for improved calibration. For instance, methods such as that proposed by Schilling et al. [41] could be used to reduce uncertainty in model parametrization. In our case, this method can be modified to use tree distribution for model validation; (4) perform an uncertainty analysis to better understand the groundwater dynamics in the study site, which is a remote location with scarce data; (5) collect samples to improve the spatial distribution of the soil hydrodynamic properties, as currently our model assumes that these properties are constant; (6) maintain a monitoring program that can be used for both the Tamarugo survival and the improvement of the coupled hydrogeological model; (6) investigate relationships between the state of Tamarugo trees and soil moisture; and (7) integrate the different stakeholders so an integrated water resource management that incorporates ecological constrains can be achieved.

Author Contributions

Formal analysis, A.S. and N.B.; Funding acquisition, J.F.M. and F.S.; Investigation, J.F.M. and F.S.; Methodology, J.F.M. and F.S.; Project administration, J.F.M.; Supervision, J.F.M. and F.S.; Visualization, N.B.; Writing—original draft, A.S., J.F.M. and F.S.; Writing—review & editing, A.S., N.B., J.F.M. and F.S. All authors have read and agreed to the published version of the manuscript.

Funding

This research and the APC were funded by the Comisión Nacional de Investigación Científica y Tecnológica (CONICYT), by grants CONICYT/FONDECYT/1130522 and CONICYT/FONDECYT/1170850.

Acknowledgments

The authors thank the Centro de Desarrollo Urbano Sustentable (CEDEUS—CONICYT/FONDAP/15110020) and the Centro de Excelencia en Geotermia de los Andes (CEGA—CONICYT/FONDAP/15090013) for supporting this investigation.

Conflicts of Interest

The authors declare no conflict of interest and declare that the funders had no role in the design of the study; in the collection, analyses, or interpretation of data; in the writing of the manuscript, or in the decision to publish the results.

References

  1. Gaur, M.K.; Squires, V.R. Geographic Extent and Characteristics of the World’s Arid Zones and Their Peoples. In Climate Variability Impacts on Land Use and Livelihoods in Drylands; Gaur, M.K., Squires, V.R., Eds.; Springer International Publishing: Cham, UK, 2018; pp. 3–20. ISBN 978-3-319-56681-8. [Google Scholar]
  2. Eamus, D.; Zolfaghar, S.; Villalobos-Vega, R.; Cleverly, J.; Huete, A. Groundwater-dependent ecosystems: Recent insights from satellite and field-based studies. Hydrol. Earth Syst. Sci. 2015, 19, 4229–4256. [Google Scholar] [CrossRef] [Green Version]
  3. Decuyper, M.; Chávez, R.O.; Copini, P.; Sass-Klaassen, U. A multi-scale approach to assess the effect of groundwater extraction on Prosopis tamarugo in the Atacama Desert. J. Arid. Environ. 2016, 131, 25–34. [Google Scholar] [CrossRef]
  4. Rohde, M.M.; Froend, R.; Howard, J. A Global Synthesis of Managing Groundwater Dependent Ecosystems Under Sustainable Groundwater Policy. Ground Water 2017, 55, 293–301. [Google Scholar] [CrossRef] [PubMed]
  5. Khair, S.M.; Mushtaq, S.; Reardon-Smith, K.; Ostini, J. Diverse drivers of unsustainable groundwater extraction behaviour operate in an unregulated water scarce region. J. Environ. Manag. 2019, 236, 340–350. [Google Scholar] [CrossRef]
  6. Viguier, B.; Jourde, H.; Yáñez, G.; Lira, E.S.; Léonardi, V.; Moya, C.E.; Pérez, T.G.; Maringue, J.; Lictevout, E. Multidisciplinary study for the assessment of the geometry, boundaries and preferential recharge zones of an overexploited aquifer in the Atacama Desert (Pampa del Tamarugal, Northern Chile). J. S. Am. Earth Sci. 2018, 86, 366–383. [Google Scholar] [CrossRef]
  7. Viguier, B.; Daniele, L.; Jourde, H.; Leonardi, V.; Yáñez, G. Changes in the conceptual model of the Pampa del Tamarugal Aquifer: Implications for Central Depression water resources. J. S. Am. Earth Sci. 2019, 94, 102217. [Google Scholar] [CrossRef]
  8. Viguier, B.; Jourde, H.; Leonardi, V.; Daniele, L.; Batiot-Guilhe, C.; Favreau, G.; De Montety, V. Water table variations in the hyperarid Atacama Desert: Role of the increasing groundwater extraction in the pampa del tamarugal (Northern Chile). J. Arid. Environ. 2019, 168, 9–16. [Google Scholar] [CrossRef]
  9. Burkart, A. A monograph of the genus prosopis (leguminosae subfam. Mimosoideae). J. Arnold Arbor. 1976, 57, 450–525. [Google Scholar]
  10. Calderon, G.; Garrido, M.; Acevedo, E. Prosopis tamarugo Phil.: A native tree from the Atacama Desert groundwater table depth thresholds for conservation. Rev. Chil. de Hist. Nat. 2015, 88, 317. [Google Scholar] [CrossRef] [Green Version]
  11. Rojas, R.; Dassargues, A. Groundwater flow modelling of the regional aquifer of the Pampa del Tamarugal, northern Chile. Hydrogeol J 2007, 15, 537–551. [Google Scholar] [CrossRef] [Green Version]
  12. Sudzuki, F. Absorción foliar a humedad atmosférica en Tamarugo, Prosopis tamarugo Phil. Boletín Técnico Estación Experimental Agronómica Universidad de Chile. Bol. Tec. 1969, 30, 23. [Google Scholar]
  13. Relaciones Hídricas de Prosopis Tamarugo PhilUso de Isótopos Estables; Acevedo, E.; Ortíz, M.; Frank, N.; Sanguineti, P. (Eds.) Universidad de Chile: Santiago, Chile, 2007. [Google Scholar]
  14. Rojas, R.; Batelaan, O.; Feyen, L.; Dassargues, A. Assessment of conceptual model uncertainty for the regional aquifer Pampa del Tamarugal—North Chile. Hydrol. Earth Syst. Sci. 2010, 14, 171–192. [Google Scholar] [CrossRef] [Green Version]
  15. SQM Estudio de Impacto Ambiental Pampa Hermosa. 2008. Available online: http://bit.ly/2sATuYH (accessed on 18 December 2019).
  16. Chávez, R.O.; Clevers, J.G.P.W.; Herold, M.; Acevedo, E.; Ortiz, M. Assessing Water Stress of Desert Tamarugo Trees Using in situ Data and Very High Spatial Resolution Remote Sensing. Remote. Sens. 2013, 5, 5064–5088. [Google Scholar] [CrossRef] [Green Version]
  17. Novillo, C.J.; Arrogante-Funes, P.; Romero-Calcerrada, R. Recent NDVI Trends in Mainland Spain: Land-Cover and Phytoclimatic-Type Implications. ISPRS Int. J. Geo-Inf. 2019, 8, 43. [Google Scholar] [CrossRef] [Green Version]
  18. Chávez, R.O.; Clevers, J.; Decuyper, M.; De Bruin, S.; Herold, M. 50 years of water extraction in the Pampa del Tamarugal basin: Can Prosopis tamarugo trees survive in the hyper-arid Atacama Desert (Northern Chile)? J. Arid. Environ. 2016, 124, 292–303. [Google Scholar] [CrossRef]
  19. Groundwater Recharge in a Desert Environment: The Southwestern United States. Available online: https://www.wiley.com/enus/Groundwater+Recharge+in+a+Desert+Environment%3A+The+Southwestern+United+States-p-9780875903583 (accessed on 18 December 2019).
  20. Chen, C.; Eamus, D.; Cleverly, J.; Boulain, N.; Cook, P.; Zhang, L.; Cheng, L.; Yu, Q. Modelling vegetation water-use and groundwater recharge as affected by climate variability in an arid-zone Acacia savanna woodland. J. Hydrol. 2014, 519, 1084–1096. [Google Scholar] [CrossRef]
  21. Kottek, M.; Grieser, J.; Beck, C.; Rudolf, B.; Rubel, F. World Map of the Köppen-Geiger climate classification updated. Meteorol. Z. 2006, 15, 259–263. [Google Scholar] [CrossRef]
  22. Harbaugh, A.W.; Banta, E.R.; Hill, M.C.; McDonald, M.G. MODFLOW-2000, The U.S. Geological Survey Modular Ground-Water Model—User Guide to Modularization Concepts and the Ground-Water Flow Process; U.S. Geological Survey: Reston, VA, USA, 2000.
  23. Barlow, P.M.; Harbaugh, A.W. USGS Directions in MODFLOW Development. Ground Water 2006, 44, 771–774. [Google Scholar] [CrossRef]
  24. Furman, A. Modeling Coupled Surface–Subsurface Flow Processes: A Review. Vadose Zone J. 2008, 7, 741. [Google Scholar] [CrossRef] [Green Version]
  25. McDonald, M.G.; Harbaugh, A.W. A Modular Three-Dimensional Finite-Difference Ground-Water Flow Model; Open-File Report 83-875; U.S. Geological Survey: Reston, VA, USA, 1988.
  26. Šimůnek, J.; Van Genuchten, M.T.; Šejna, M. Recent Developments and Applications of the HYDRUS Computer Software Packages. Vadose Zone J. 2016, 15, 15. [Google Scholar] [CrossRef] [Green Version]
  27. Richards, L.A. Capillary conduction of liquids through porous mediums. Physics 1931, 1, 318. [Google Scholar] [CrossRef]
  28. Twarakavi, N.K.C.; Šimůnek, J.; Seo, S. Evaluating Interactions between Groundwater and Vadose Zone Using the HYDRUS-Based Flow Package for MODFLOW. Vadose Zone J. 2008, 7, 757–768. [Google Scholar] [CrossRef] [Green Version]
  29. Van Genuchten, M.T. A Closed-form Equation for Predicting the Hydraulic Conductivity of Unsaturated Soils1. Soil Sci. Soc. Am. J. 1980, 44, 892. [Google Scholar] [CrossRef] [Green Version]
  30. Mualem, Y. A new model for predicting the hydraulic conductivity of unsaturated porous media. Water Resour. Res. 1976, 12, 513–522. [Google Scholar] [CrossRef] [Green Version]
  31. Niswonger, R.G.; Prudic, D.E.; Regan, R.S. Documentation of the Unsaturated-Zone Flow (UZF1) Package for modeling Unsaturated Flow Between the Land Surface and the Water Table with MODFLOW-2005; Techniques and Methods 6-A19; U.S. Geological Survey: Reston, VA, USA, 2006.
  32. Thoms, R.B.; Johnson, R.L.; Healy, R.W. User’s Guide to the Variably Saturated Flow (VSF) Process to MODFLOW; Techniques and Methods 6-A18; U.S. Geological Survey: Reston, VA, USA, 2006; p. 58.
  33. Bennett, T.H.; Peters, J.C. Continuous Soil Moisture Accounting in the Hydrologic Engineering Center Hydrologic Modeling System (HEC-HMS). In Proceedings of the Joint Conference on Water Resource Engineering and Water Resources Planning and Management 2000, Minneapolis, MN, USA, 30 July–2 August 2000. [Google Scholar]
  34. Applied Groundwater Modeling-2nd Edition. Available online: https://www.elsevier.com/books/applied-groundwater-modeling/anderson/978-0-08-091638-5 (accessed on 10 October 2019).
  35. Doherty, J.E.; Hunt, R.J.; Tonkin, M.J. Approaches to highly parameterized inversion: A guide to using PEST for model-parameter and predictive-uncertainty analysis; Scientific Investigations Report 2010-5211; U.S. Geological Survey: Reston, VA, USA, 2010; p. 82.
  36. Doherty, J. Ground water model calibration using pilot points and regularization. Ground Water 2003, 41, 170–177. [Google Scholar] [CrossRef]
  37. Bennett, N.D.; Croke, B.F.; Guariso, G.; Guillaume, J.H.; Hamilton, S.H.; Jakeman, A.J.; Marsili-Libelli, S.; Newham, L.T.; Norton, J.P.; Perrin, C.; et al. Characterising performance of environmental models. Environ. Model. Softw. 2013, 40, 1–20. [Google Scholar] [CrossRef]
  38. Cristi, F.; Fierro, V.; Suárez, F.; Muñoz, J.F.; Hausner, M.B. A TDR-waveform approach to estimate soil water content in electrically conductive soils. Comput. Electron. Agric. 2016, 121, 160–168. [Google Scholar] [CrossRef]
  39. Doherty, J.; Welter, D. A short exploration of structural noise. Water Resour. Res. 2010, 46. [Google Scholar] [CrossRef]
  40. Moeck, C.; Molson, J.; Schirmer, M. Pathline Density Distributions in a Null-Space Monte Carlo Approach to Assess Groundwater Pathways. Ground Water 2019. [Google Scholar] [CrossRef]
  41. Schilling, O.S.; Doherty, J.; Kinzelbach, W.; Wang, H.; Yang, P.; Brunner, P. Using tree ring data as a proxy for transpiration to reduce predictive uncertainty of a model simulating groundwater–surface water–vegetation interactions. J. Hydrol. 2014, 519, 2258–2271. [Google Scholar] [CrossRef]
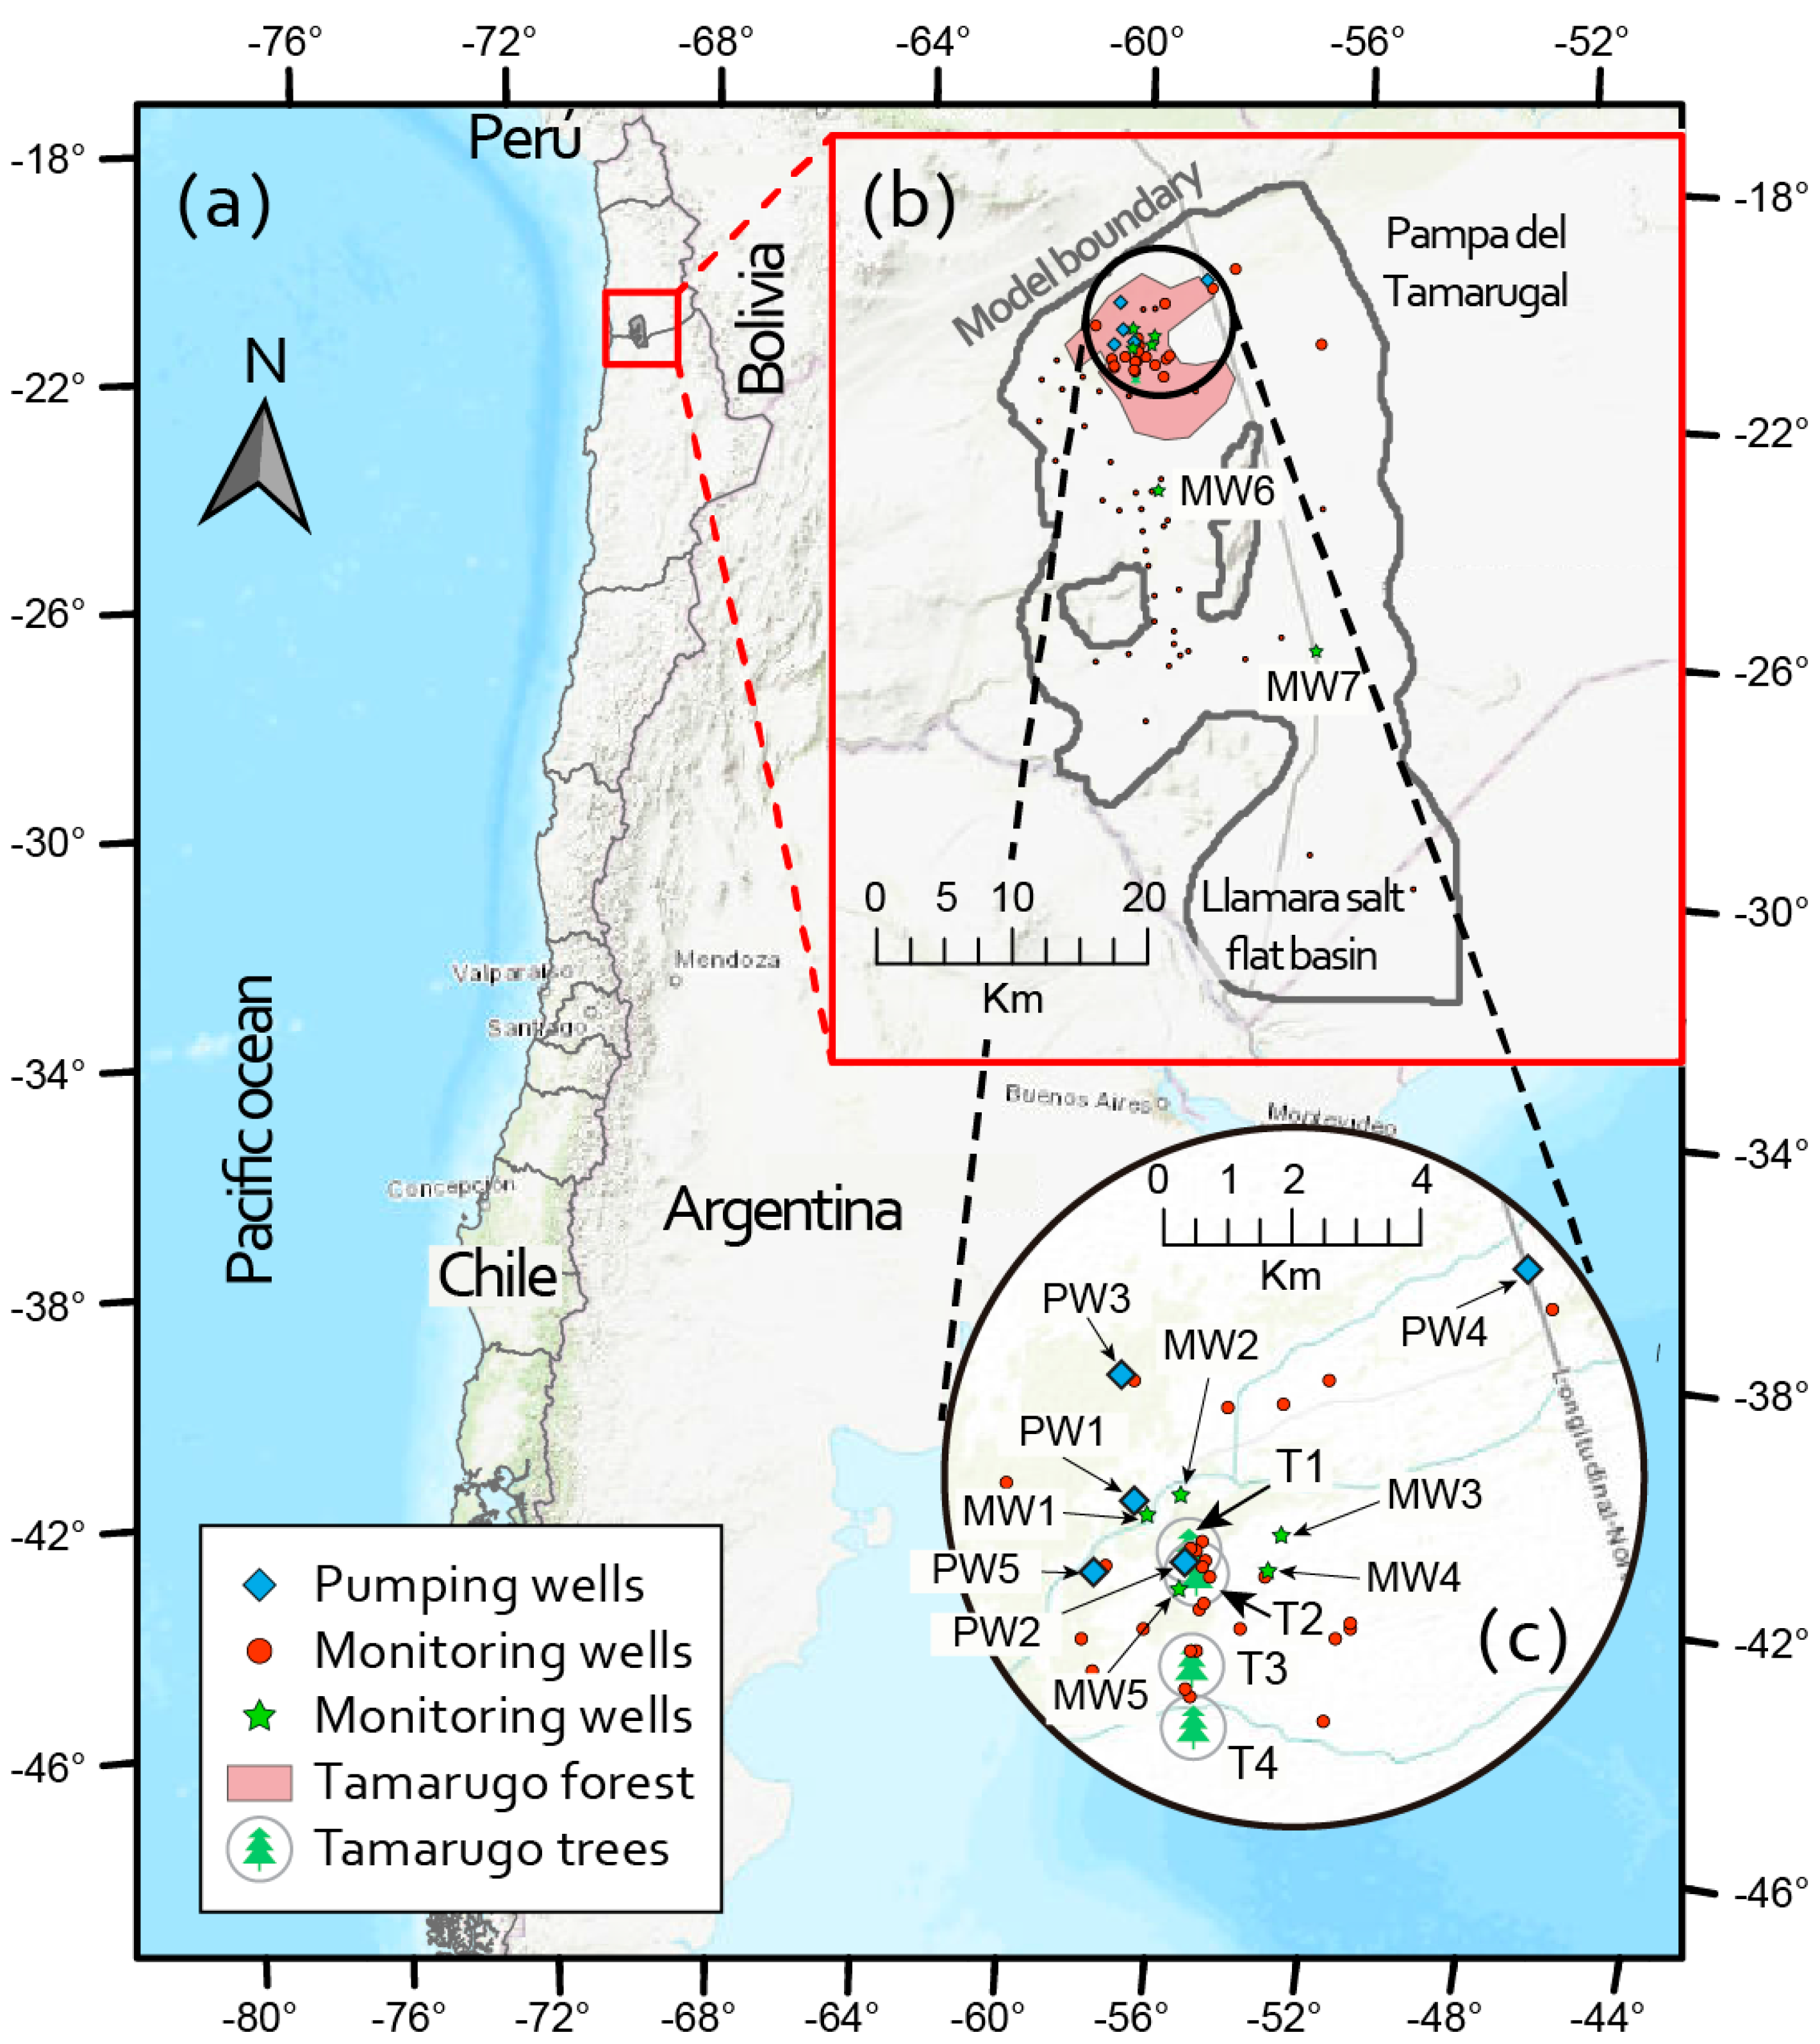
Figure 1. (a) General location of the study site. (b) Boundaries of the model developed for the Llamara salt flat basin, location of pumping (PW1, PW2, PW3, PW4 and PW5) and monitoring wells (MW1, MW2, MW3, MW4 and MW5) and of the Tamarugo forest. The location of the selected trees (T1, T2, T3 and T4) are also shown. (c) Zoom into the Tamarugo forest to show the location of the selected trees and of the pumping and monitoring wells. The green stars depict monitoring wells in which water levels are presented throughout this paper and the red circles are other monitoring wells that were used to calibrate/validate the hydrogeological model.
Geosciences 10 00001 g001
Figure 2. Conceptual hydrogeological model of the Llamara salt flat basin. The water balance corresponds to the conditions prior to pumping. Modified from [15].
Geosciences 10 00001 g002
Figure 3. Hydraulic conductivity distribution for the shallow (left) and deep (right) layers obtained after calibration of the saturated zone model.
Geosciences 10 00001 g003
Figure 4. Drawdown at selected monitoring wells for the validation period: (a) PW3, (b) MW1, (c) MW2, (d) MW3, (e) MW4, (f) PW5, (g) MW5, (h) MW6, and (i) MW7. The location of these wells is shown in Figure 1.
Geosciences 10 00001 g004
Figure 5. Comparison of the simulated and observed volumetric water content profiles beneath the canopy of the Tamarugo trees, for the calibration period (May–July, 2006). The root mean squared error (RMSE) of each volumetric water content profile is also shown. The Field data are public and were obtained from the Chilean Environmental Assessment Service (https://bit.ly/31fOeFe).
Geosciences 10 00001 g005
Figure 6. Comparison of the simulated and observed volumetric water content profiles beneath the canopy of the Tamarugo trees, for the validation period (November, 2007–January, 2008). The root mean squared error (RMSE) of each volumetric water content profile is also shown. The Field data are public and were obtained from the Chilean Environmental Assessment Service (https://bit.ly/31fOeFe).
Geosciences 10 00001 g006
Figure 7. Temporal evolution of the simulated water table depth at the pumping wells PW1, PW2, PW3, and PW4.
Geosciences 10 00001 g007
Figure 8. Temporal evolution of the simulated water table depth at the T1 (a), T2 (b), T3 (c) and T4 (d) Tamarugo trees. Note that simulation 4 is not shown as its results are similar to those of simulations 1 and 3. Note the difference in the limits of the vertical axes of each panel.
Geosciences 10 00001 g008
Figure 9. Comparison between the simulated initial and final volumetric water content profile at the T1 (a), T2 (b), T3 (c) and T4 (d) Tamarugo trees for simulation 1 (baseline). Note the difference in the limits of the vertical axes of each panel.
Geosciences 10 00001 g009
Table 1. Groundwater withdrawal rates (L/s) in the pumping wells and groundwater recharge (L/s) used in the simulations.
Pumping WellSimulation 1 (Baseline)Simulation 2 (25% Increase in Withdrawal)Simulation 3 (20% Decrease in Withdrawal)Simulation 4 (Recharge Maintained)
PW160756060
PW265816565
PW335443535
PW430383030
PW531393131
Total221277221221
Groundwater recharge46546537280
Table 2. Calibrated water retention curve parameters of the van Genuchten model [29].
ParameterDescriptionValueUnits
θrResidual volumetric water content0.02m3/m3
θsSaturated volumetric water content0.45m3/m3
αInverse of the bubbling pressure3.70m−1
nEmpirical parameter1.68-
mEmpirical parameter0.40-
Table 3. Water level drawdown at PW1 and at selected trees of the Tamarugo forest for simulation 1 (baseline).
LocationDistance to PW1 (km)Drawdown (m) 6 Months 1Drawdown (m) Year 2010Drawdown (m) Year 2030
PW1 20.02.25.47.8
T1 31.10.10.91.4
T2 31.50.00.51.0
T3 32.70.0−0.1−0.1
T4 33.60.0−0.3−0.3
1 Time after pumping began; 2 Pumping well; 3 Tamarugo tree.