Exploring Differential Transcriptome between Jejunal and Cecal Tissue of Broiler Chickens


 ,
,
Simple Summary
Abstract
1. Introduction
2. Materials and Methods
2.1. Animals and Sampling
2.2. RNA Analysis
2.3. Data and Statistical Analysis
3. Results
4. Discussion
5. Conclusions
Supplementary Materials
Author Contributions
Funding
Conflicts of Interest
References
- Hoffmann, R.; Valencia, A. Life cycles of successful genes. Trends Genet. 2003, 19, 79–81. [Google Scholar] [CrossRef]
- Nature Briefing. Daily Briefing: Why Potentially Useful Human Genes Are Being Ignored by Science. Available online: https://www.nature.com/articles/d41586-018-06775-6 (accessed on 19 September 2018).
- Sinha, N.; Suarez-diez, M.; Van Schothorst, E.M.; Keijer, J.; Vitor, A.P.; Hooiveld, G.J.E.J. Predicting the murine enterocyte metabolic response to diets that differ in lipid and carbohydrate composition. Sci. Rep. 2017, 7, 8784. [Google Scholar] [CrossRef]
- Goebel, M.; Stengel, A.; Lambrecht, N.W.G.; Sachs, G. Selective gene expression by rat gastric corpus epithelium. Physiol. Genom. 2011, 43, 237–254. [Google Scholar] [CrossRef] [PubMed]
- Colombo, M.; Priori, D.; Trevisi, P.; Bosi, P. Differential Gene Expression in the Oxyntic and Pyloric Mucosa of the Young Pig. PLoS ONE 2014, 9, e11147. [Google Scholar] [CrossRef]
- Mach, N.; Mustapha, B.; Esquerre, D.; Chevaleyre, C.; Lemonnier, G.; Billon, Y.; Lepage, P.; Oswald, I.P.; Doré, J.; Rogel-gaillard, C.; et al. Extensive Expression Differences along Porcine Small Intestine Evidenced by Transcriptome Sequencing. PLoS ONE 2014, 9, e88515. [Google Scholar] [CrossRef] [PubMed]
- Choi, J.H.; Kim, G.B.; Cha, C.J. Spatial heterogeneity and stability of bacterial community in the gastrointestinal tracts of broiler chickens. Poult. Sci. 2014, 93, 1942–1950. [Google Scholar] [CrossRef]
- Zerbino, D.R.; Achuthan, P.; Akanni, W.; Amode, M.R.; Barrell, D.; Bhai, J.; Billis, K.; Cummins, C.; Gall, A.; Gil, L.; et al. Ensembl 2018. Nucleic Acids Res. 2018, 46, 754–761. [Google Scholar] [CrossRef] [PubMed]
- Huang, D.W.; Sherman, B.T.; Lempicki, R.A. Systematic and integrative analysis of large gene lists using DAVID bioinformatics resources. Nat. Protoc. 2009, 4, 44–57. [Google Scholar] [CrossRef]
- Kanehisa, M.; Goto, S. KEGG: Kyoto Encyclopedia of Genes and Genomes. Nucleic Acids Res. 2000, 28, 27–30. [Google Scholar] [CrossRef]
- Dawson, P.A.; Elliott, A.; Bowling, F.G. Sulphate in Pregnancy. Nutrients 2015, 7, 1594–1606. [Google Scholar] [CrossRef]
- Wong, T.P.; Debnam, E.S.; Leung, P.S. Involvement of an enterocyte renin–angiotensin system in the local control of SGLT1-dependent glucose uptake across the rat small intestinal brush border membrane. J. Physiol. 2007, 2, 613–623. [Google Scholar] [CrossRef] [PubMed]
- Garg, M.; Angus, P.W.; Burrell, L.M.; Herath, C.; Gibson, P.R.; Lubel, J.S. Alimentary Pharmacology and Therapeutics Review article: The pathophysiological roles of the renin–angiotensin system in the gastrointestinal tract. Aliment. Pharmacol. Ther. 2012, 35, 414–428. [Google Scholar] [CrossRef]
- Weidemann, B.J.; Voong, S.; Morales-santiago, F.I.; Kahn, M.Z.; Ni, J.; Littlejohn, N.K.; Claflin, K.E.; Burnett, C.M.L.; Pearson, N.A.; Lutter, M.L.; et al. Dietary Sodium Suppresses Digestive Efficiency via the Renin-Angiotensin System. Sci. Rep. 2015, 5, 1–10. [Google Scholar] [CrossRef] [PubMed]
- Mithieux, G.; Misery, P.; Magnan, C.; Pillot, B.; Gautier-Stein, A.; Bernard, C.; Rajas, F.; Zitoun, C.; Claude, U.; Lyon, B. Portal sensing of intestinal gluconeogenesis is a mechanistic link in the diminution of food intake induced by diet protein. Cell Metab. 2005, 2, 321–329. [Google Scholar] [CrossRef]
- Rajas, F.; Croset, M.; Zitoun, C.; Montano, S.; Mithieux, G. Induction of PEPCK Gene Expression in Insulinopenia in Rat Small Intestine. Diabetes 2000, 49, 1165–1168. [Google Scholar] [CrossRef]
- Yanez, A.J.; Nualart, F.; Droppelmann, C.; Bertinat, R.; Brito, M.; Concha, I.I.; Slebe, J.C. Broad Expression of Fructose-1,6-Bisphosphatase and Phosphoenolpyruvate Carboxykinase Provide Evidence for Gluconeogenesis in Human Tissues Other Than Liver and Kidney. J. Cell. Physiol. 2003, 197, 189–197. [Google Scholar] [CrossRef] [PubMed]
- Mithieux, G.; Rajas, F.; Gautier-stein, A. A Novel Role for Glucose 6-Phosphatase in the Small Intestine in the Control of Glucose Homeostasis. J. Biol. Chem. 2004, 1, 44231–44234. [Google Scholar] [CrossRef] [PubMed]
- Kirchner, S.; Seixas, P.; Kaushik, S.; Panserat, S. Effects of low protein intake on extra-hepatic gluconeogenic enzyme expression and peripheral glucose phosphorylation in rainbow trout (Oncorhynchus mykiss). Comp. Biochem. Physiol. Part B Biochem. Mol. Biol. 2005, 140, 333–340. [Google Scholar] [CrossRef] [PubMed]
- Croset, M.; Rajas, F.; Zitoun, C.; Hurot, J.; Montano, S.; Mithieux, G. Rat Small Intestine Is an Insulin-Sensitive Gluconeogenic Organ. Diabetes 2001, 50, 740–746. [Google Scholar] [CrossRef] [PubMed]
- Habold, C.; Foltzer-Jourdainne, C.; Le Maho, Y.; Lignot, J.-H.; Oudart, H. Intestinal gluconeogenesis and glucose transport according to body fuel availability in rats. J. Physiol. 2005, 2, 575–586. [Google Scholar] [CrossRef] [PubMed]
- Mithieux, G.; Gautier-stein, A.; Inserm, U.; Lyon, D. Intestinal glucose metabolism revisited. Diabetes Res. Clin. Pract. 2014, 105, 295–301. [Google Scholar] [CrossRef]
- Penhoat, A.; Mutel, E.; Amigo-Correig, M.; Pillot, B.; Stefanutti, A.; Rajas, F.; Mithieux, G. Physiology & Behavior Protein-induced satiety is abolished in the absence of intestinal gluconeogenesis. Physiol. Behav. 2011, 105, 89–93. [Google Scholar] [CrossRef] [PubMed]
- De Vadder, F.; Kovatcheva-datchary, P.; Zitoun, C.; Duchampt, A.; Bäckhed, F.; Mithieux, G. Microbiota-Produced Succinate Improves Glucose via Intestinal Gluconeogenesis. Cell Metab. 2016, 24, 151–157. [Google Scholar] [CrossRef]
- Lu, J.; Idris, U.; Harmon, B.; Hofacre, C.; Maurer, J.J.; Lee, M.D. Diversity and Succession of the Intestinal Bacterial Community of the Maturing Broiler Chicken. Appl. Environ. Mcrobiol. 2003, 69, 6816–6824. [Google Scholar] [CrossRef]
- Whittamore, J.M.; Hatch, M. Loss of the anion exchanger DRA (Slc26a3), or PAT1 (Slc26a6), alters sulfate transport by the distal ileum and overall sulfate homeostasis. Am. J. Physiol. Gastrointest. Liver Physiol. 2017, 313, G166–G179. [Google Scholar] [CrossRef] [PubMed]
- Trevisi, P.; Priori, D.; Jansman, A.J.M.; Luise, D.; Koopmans, S.-J.; Hynonen, U.; Palva, A.; van der Meulen, J.; Bosi, P. Molecular networks affected by neonatal microbial colonization in porcine jejunum, luminally perfused with enterotoxigenic Escherichia coli, F4ac fimbria or Lactobacillus amylovorus. PLoS ONE 2018, 13, 1–19. [Google Scholar] [CrossRef] [PubMed]
- Whittamore, J.M.; Freel, R.W.; Hatch, M. Sulfate secretion and chloride absorption are mediated by the anion exchanger DRA (Slc26a3) in the mouse cecum. Am. J. Physiol. Gastrointest. Liver Physiol. 2013, 305, G172–G184. [Google Scholar] [CrossRef] [PubMed]
- Berni Canani, R.; Buccigrossi, V.; Passariello, A. Mechanisms of action of zinc in acute diarrhea. Curr. Opin. Gastroenterol. 2011, 27, 8–12. [Google Scholar] [CrossRef]
- Kumar, A.; Hecht, C.; Priyamvada, S.; Anbazhagan, A.N.; Alakkam, A.; Borthakur, A.; Alrefai, W.A.; Gill, R.K.; Dudeja, P.K. Probiotic Bifidobacterium species stimulate human SLC26A3 gene function and expression in intestinal epithelial cells. Am. J. Physiol. Cell Physiol. 2014, 307, C1084–C1092. [Google Scholar] [CrossRef] [PubMed]
- Volf, J.; Polansky, O.; Sekelova, Z.; Velge, P.; Schouler, C.; Kaspers, B.; Rychlik, I. Gene expression in the chicken caecum is dependent on microbiota composition. Vet. Res. 2017, 48, 1–10. [Google Scholar] [CrossRef] [PubMed]
- Dawson, P.A.; Huxley, S.; Gardiner, B.; Tran, T.; Mcauley, J.L.; Grimmond, S.; Mcguckin, M.A.; Markovich, D. Reduced mucin sulfonation and impaired intestinal barrier function in the hyposulfataemic NaS1 null mouse. Gut 2009, 58, 910–919. [Google Scholar] [CrossRef] [PubMed]
- Deplancke, B.; Gaskins, H.R. Microbial modulation of innate defense: Goblet cells and the intestinal mucus layer. Am. J. Clin. Nutr. 2001, 73, 1131S–1141S. [Google Scholar] [CrossRef] [PubMed]
- Struwe, W.B.; Gough, R.; Gallagher, M.E.; Kenny, D.T.; Carrington, S.D.; Karlsson, N.G.; Rudd, P.M. Identification of O-glycan Structures from Chicken Intestinal Mucins Provides Insight into Campylobactor jejuni Pathogenicity. Mol. Cell. Proteomics 2015, 14, 1464–1477. [Google Scholar] [CrossRef]
- Zampiga, M.; Bertocchi, M.; Bosi, P.; Trevisi, P.; Meluzzi, A.; Sirri, F. Differences in productive performance and intestinal transcriptomic profile in two modern fast-growing chicken hybrids. J. Anim. Physiol. Anim. Nutr. 2018, 103, 125–134. [Google Scholar] [CrossRef]
- Fass, D.; Thorpe, C. Chemistry and Enzymology of Disulfide Cross-Linking in Proteins. Chem. Rev. 2018, 118, 1169–1198. [Google Scholar] [CrossRef]
- Stoll, B.; Henry, J.; Reeds, P.J.; Yu, H.; Jahoor, F.; Burrin, D.G. Catabolism Domin0ates the First-Pass Intestinal Metabolism of Dietary Essential Amino Acids in Milk Protein-Fed Piglets. J. Nutr. 1998, 128, 606–614. [Google Scholar] [CrossRef]
- Antonioli, L.; Fornai, M.; Blandizzi, C.; Pacher, P.; Haskó, G. Adenosine signaling and the immune system: When a lot could be too much. Immunol. Lett. 2018. [Google Scholar] [CrossRef]
- Bradford, K.L.; Moretti, F.A.; Carbonaro-sarracino, D.A.; Gaspar, H.B.; Kohn, D.B. Adenosine Deaminase (ADA) -Deficient Severe Combined Immune Deficiency (SCID): Molecular Pathogenesis and Clinical Manifestations. J. Clin. Immunol. 2017, 37, 626–637. [Google Scholar] [CrossRef] [PubMed]
- Chen, J.; Tellez, G.; Richards, J.D.; Escobar, J. Identification of Potential Biomarkers for Gut Barrier Failure in Broiler Chickens. Front. Vet. Sci. 2015, 2, 1–10. [Google Scholar] [CrossRef] [PubMed]
- De Kumar, B.; Krumlauf, R. HOX s and lincRNAs: Two sides of the same coin. Sci. Adv. 2016, 2, e1501402. [Google Scholar] [CrossRef] [PubMed]


| Fold Change Ratio 1 | p-Value | FDR p-Value 2 | Gene Symbol 3 | Description |
|---|---|---|---|---|
| 207.3 | 6.4 × 10⁻¹⁹ | 1.7 × 10⁻¹⁶ | APOB | apolipoprotein B |
| 151.2 | 1.7 × 10⁻¹⁵ | 1.7 × 10⁻¹³ | RBP2 | retinol binding protein 2, cellular |
| 143.7 | 1.5 × 10⁻²² | 3.8 × 10⁻¹⁹ | ENPEP | glutamyl aminopeptidase (aminopeptidase A) |
| 111.4 | 5.5 × 10⁻²¹ | 4.0 × 10⁻¹⁸ | MEP1A | meprin A, alpha (PABA peptide hydrolase) |
| 98.2 | 6.0 × 10⁻²¹ | 4.2 × 10⁻¹⁸ | SI | sucrase-isomaltase (alpha-glucosidase) |
| 90.2 | 4.9 × 10⁻²¹ | 3.7 × 10⁻¹⁸ | ACE2 | angiotensin I converting enzyme 2 |
| 88.0 | 2.2 × 10⁻²² | 4.1 × 10⁻¹⁹ | SLC6A19 | solute carrier family 6 (neutral amino acid transporter), member 19 |
| 74.2 | 9.2 × 10⁻²³ | 3.4 × 10⁻¹⁹ | MGAM | maltase-glucoamylase (alpha-glucosidase) |
| 73.2 | 9.5 × 10⁻¹⁹ | 2.3 × 10⁻¹⁶ | SLC7A9 | solute carrier family 7 (amino acid transporter light chain, bo, +system), member 9 |
| 66.3 | 1.5 × 10⁻²¹ | 1.6 × 10⁻¹⁸ | SLC15A1 | oligopeptide transporter, member 1 |
| 64.8 | 1.9 × 10⁻²² | 3.8 × 10⁻¹⁹ | SLC9A3 | (NHE3, cation proton antiporter 3), member 3 |
| 58.4 | 2.9 × 10⁻¹⁵ | 2.7 × 10⁻¹³ | ENPP7 | ectonucleotide pyrophosphatase/phosphodiesterase 7 |
| 57.9 | 1.7 × 10⁻²⁰ | 8.3 × 10⁻¹⁸ | CLDN10 | claudin 10 |
| 55.6 | 1.4 × 10⁻²² | 3.8 × 10⁻¹⁹ | MGAT4D | mannosyl (alpha-1,3-)-glycoprotein beta-1,4-N-acetylglucosaminyltransferase, isozyme B-like |
| 49.6 | 1.6 × 10⁻¹⁴ | 1.2 × 10⁻¹² | LCT | Lactase |
| 49.2 | 6.6 × 10⁻²² | 8.0 × 10⁻¹⁹ | CNOT2 | CCR4-NOT transcription complex, subunit 2 |
| 46.6 | 2.3 × 10⁻¹⁹ | 6.6 × 10⁻¹⁷ | TM4SF4 | transmembrane 4 L six family member 4 |
| 46.3 | 9.6 × 10⁻¹⁹ | 2.3 × 10⁻¹⁶ | MME | membrane metallo-endopeptidase |
| 45.8 | 5.1 × 10⁻²² | 7.1 × 10⁻¹⁹ | MEP1B | meprin A, beta |
| 45.0 | 3.7 × 10⁻¹⁶ | 4.3 × 10⁻¹⁴ | FABP2 | Fatty-acid binding protein 2, intestinal |
| Fold Change Ratio 1 | p-Value | FDR p-Value 2 | Gene Symbol 3 | Description |
|---|---|---|---|---|
| 244.4 | 6.17 × 10⁻²¹ | 4.18 × 10⁻¹⁸ | CBS | cystathionine-beta-synthase |
| 121.2 | 1.44 × 10⁻²¹ | 1.55 × 10⁻¹⁸ | ENSGALG00000021450 | C factor like |
| 78.4 | 1.19 × 10⁻²³ | 7.73 × 10⁻²⁰ | MAL | mal, T-cell differentiation protein |
| 40.8 | 1.42 × 10⁻¹⁹ | 4.34 × 10⁻¹⁷ | AQP8 | aquaporin 8 |
| 24.5 | 6.06 × 10⁻¹⁶ | 6.60 × 10⁻¹⁴ | NOXO1 | NADPH oxidase organizer 1 |
| 22.5 | 1.76 × 10⁻¹⁴ | 1.24 × 10⁻¹² | CA4 | carbonic anhydrase IV |
| 18.0 | 3.58 × 10⁻¹⁸ | 7.28 × 10⁻¹⁶ | HOXA10 | homeobox A10; homeobox protein Hox-A10-like |
| 17.9 | 3.44 × 10⁻²⁰ | 1.40 × 10⁻¹⁷ | SLC38A4 | solute carrier family 38, member 4 (SNAT4) |
| 15.8 | 2.11 × 10⁻¹⁵ | 2.01 × 10⁻¹³ | SLC26A4 | solute carrier family 26 (anion exchanger), member 4 |
| 15.1 | 5.97 × 10⁻²² | 7.80 × 10⁻¹⁹ | PON2 | paraoxonase 2 |
| 14.2 | 4.79 × 10⁻¹⁵ | 4.14 × 10⁻¹³ | TFCP2L1 | transcription factor CP2-like 1 |
| 14.2 | 2.93 × 10⁻²¹ | 2.55 × 10⁻¹⁸ | SELENBP1 | selenium binding protein 1; selenium-binding protein 1-A-like |
| 14.0 | 7.89 × 10⁻¹⁵ | 6.28 × 10⁻¹³ | ATP6V0D2 | ATPase, H+ transporting, lysosomal 38 kDa, V0 subunit d2 |
| 13.2 | 3.34 × 10⁻²⁰ | 1.39 × 10⁻¹⁷ | PADI3 | peptidyl arginine deiminase, type III |
| 12.9 | 5.97 × 10⁻¹⁵ | 4.99 × 10⁻¹³ | PLET1 | Placenta expressed transcript 1 |
| 12.9 | 3.03 × 10⁻¹⁴ | 2.05 × 10⁻¹² | GJB2 | gap junction protein, beta 2, 26 kDa |
| 12.0 | 8.16 × 10⁻¹⁸ | 1.57 × 10⁻¹⁵ | LY6E | lymphocyte antigen 6 complex, locus E-like |
| 11.7 | 1.74 × 10⁻¹⁶ | 2.28 × 10⁻¹⁴ | gga-mir-196-4 | microRNA 196-4 |
| 11.2 | 8.74 × 10⁻¹⁷ | 1.25 × 10⁻¹⁴ | GSTA4 | glutathione S-transferase alpha 4 |
| 11.0 | 2.26 × 10⁻²³ | 1.03 × 10⁻¹⁹ | B4GALNT3 | beta-1,4-N-acetyl-galactosaminyltransferase 3 |
| Categories and Functional Annotations 1 | % 2 | p-Value 1 | Benjamini Value 1 |
|---|---|---|---|
| KEGG_PATHWAY | |||
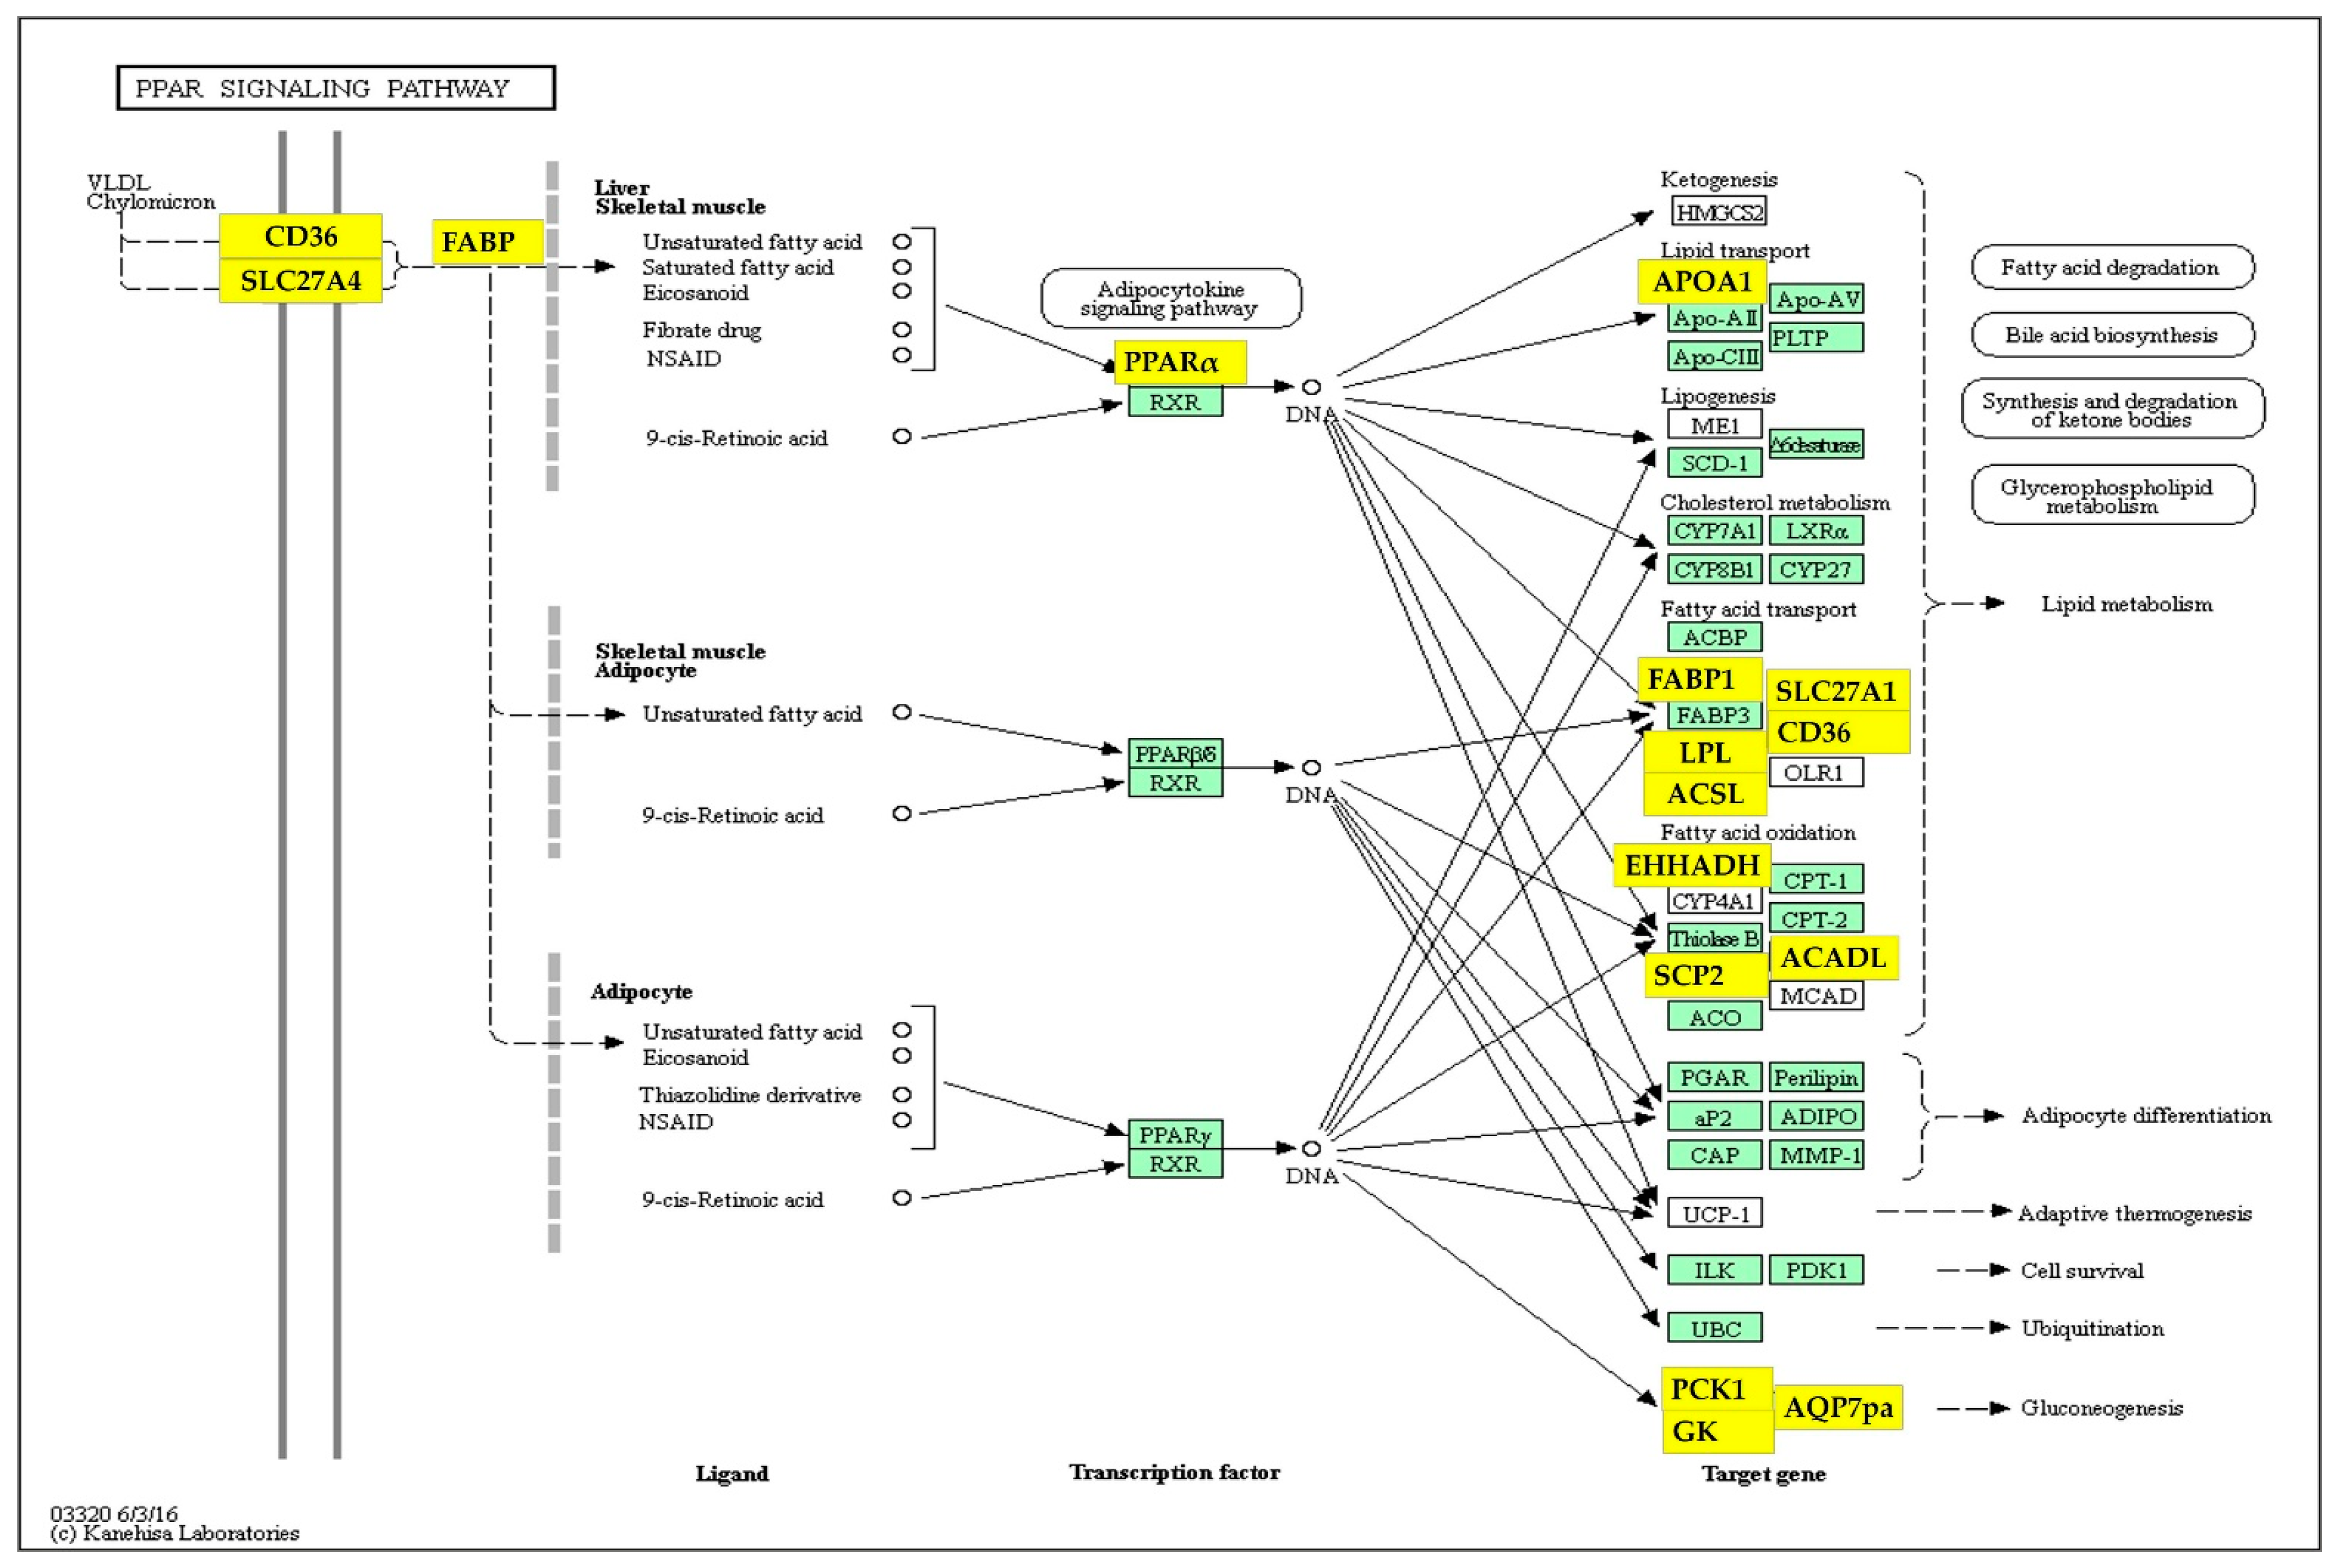
| PPAR signaling pathway | 3.4 | 9 × 10⁻¹¹ | 9 × 10⁻⁹ |
| Metabolic pathways | 14.9 | 3 × 10⁻⁸ | 1 × 10⁻⁶ |
| Peroxisome | 2.3 | 3 × 10⁻⁴ | 1 × 10⁻² |
| Glycerophospholipid metabolism | 2.3 | 1 × 10⁻³ | 3 × 10⁻² |
| Histidine metabolism | 1.1 | 1 × 10⁻³ | 3 × 10⁻² |
| Fatty acid degradation | 1.3 | 2 × 10⁻³ | 4 × 10⁻² |
| UP_KEYWORDS | |||
| Transmembrane helix | 33.0 | 1 × 10⁻¹¹ | 3 × 10⁻⁹ |
| Transmembrane | 33.0 | 2 × 10⁻¹¹ | 2 × 10⁻⁹ |
| Membrane | 34.2 | 9 × 10⁻¹⁰ | 6 × 10⁻⁸ |
| Transport | 7.4 | 5 × 10⁻⁴ | 2 × 10⁻² |
| GOTERM_BP_DIRECT | |||
| Cholesterol efflux | 1.3 | 2 × 10⁻⁵ | 3 × 10⁻² |
| GOTERM_CC_DIRECT | |||
| Apical plasma membrane | 3.8 | 2 × 10⁻⁸ | 5 × 10⁻⁶ |
| Integral component of membrane | 26.3 | 3 × 10⁻⁷ | 3 × 10⁻⁵ |
| Brush border membrane | 1.5 | 1 × 10⁻⁵ | 7 × 10⁻⁴ |
| Peroxisome | 1.9 | 9 × 10⁻⁵ | 4 × 10⁻³ |
| Categories and Functional Annotations 1 | % 2 | p-Value 1 | Benjamini Value 1 |
|---|---|---|---|
| KEGG_PATHWAY | |||
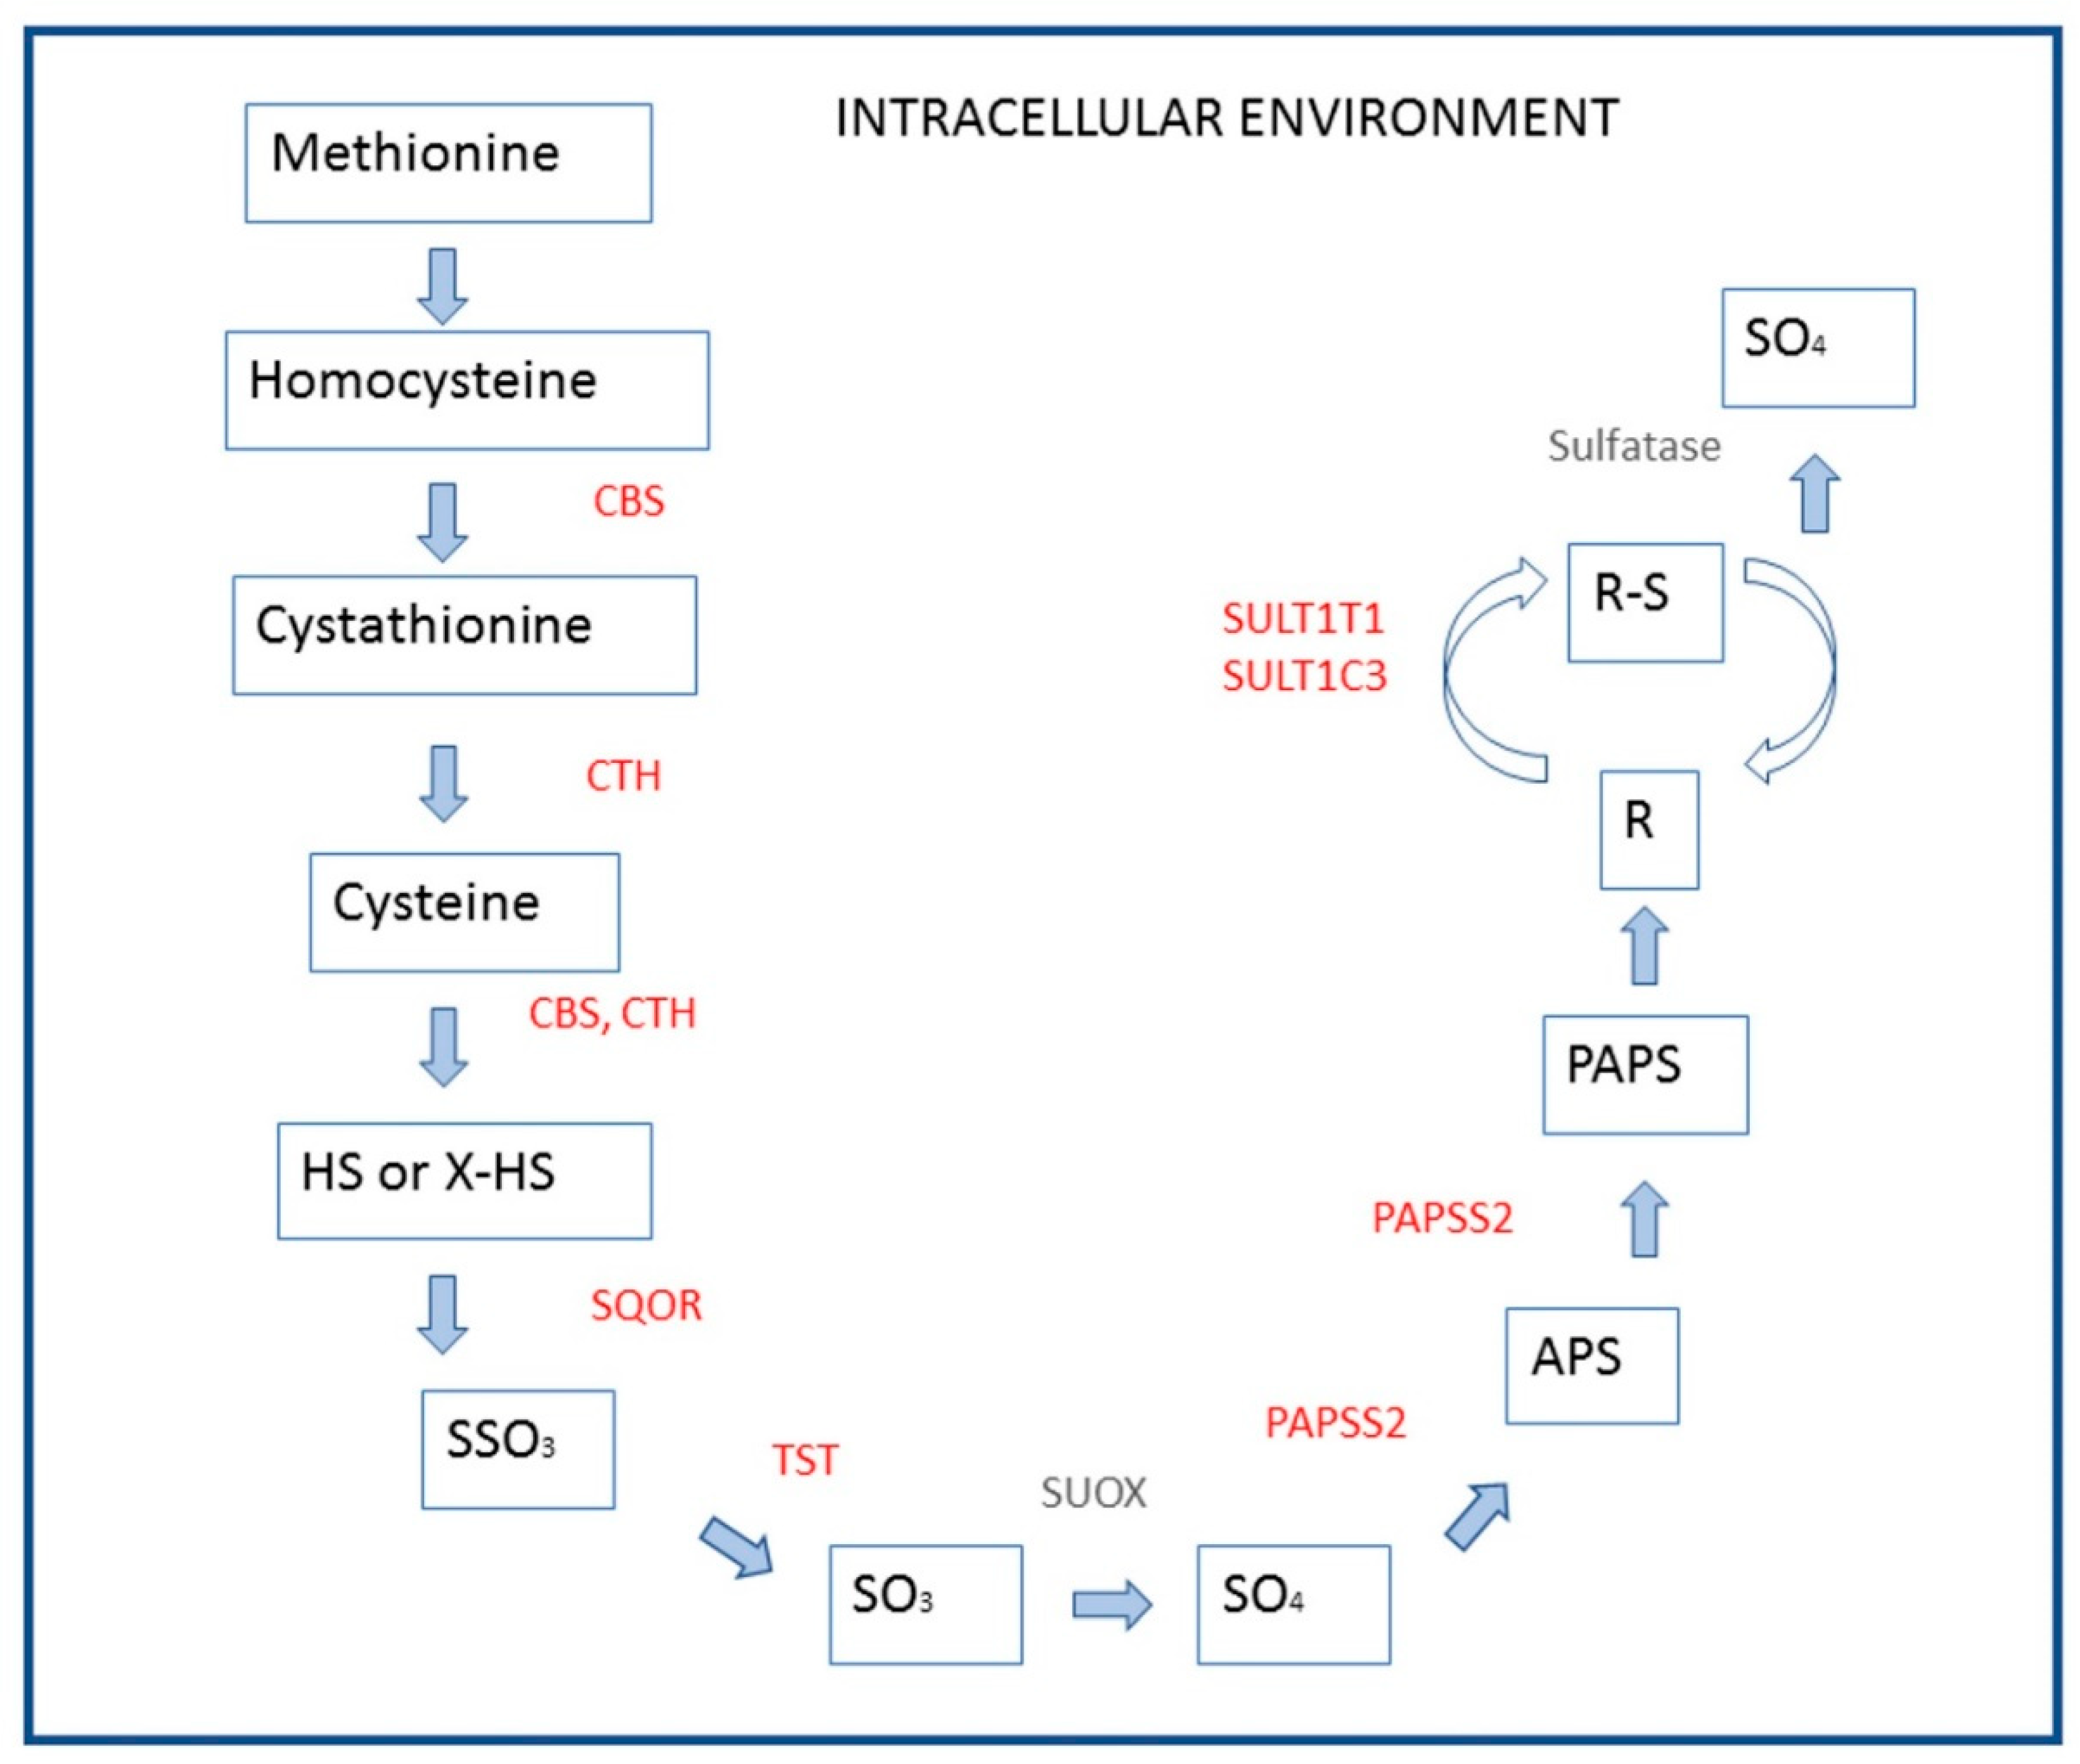
| Cysteine and methionine metabolism | 1.5 | 0.0001 | 0.012 |
| Cell cycle | 2.6 | 0.0001 | 0.009 |
| Focal adhesion | 3.3 | 0.0008 | 0.032 |
| UP_KEYWORDS | |||
| Disulfide bond | 11.3 | 0.0000 | 0.002 |
| Mitosis 3 | 2.0 | 0.0000 | 0.001 |
| Developmental protein | 4.8 | 0.0000 | 0.002 |
| Glycoprotein | 6.9 | 0.0000 | 0.002 |
| ATP-binding | 7.9 | 0.0002 | 0.008 |
| Secreted | 5.8 | 0.0002 | 0.007 |
| Alternative splicing | 3.0 | 0.0003 | 0.008 |
| Cytoskeleton | 2.8 | 0.0016 | 0.030 |
| Phosphoprotein | 4.3 | 0.0033 | 0.053 |
| GOTERM_BP_DIRECT | |||
| Chromosome segregation | 1.6 | 0.0000 | 0.044 |
| GOTERM_CC_DIRECT | |||
| Proteinaceous extracellular matrix 4 | 3.9 | 0.0000 | 0.000 |
| Midbody 5 | 2.0 | 0.0001 | 0.013 |
| Kinesin complex 6 | 1.5 | 0.0002 | 0.012 |
| GOTERM_MF_DIRECT | |||
| Heparin binding | 2.5 | 0.0000 | 0.001 |
| Chemoattractant activity | 1.2 | 0.0001 | 0.022 |
© 2019 by the authors. Licensee MDPI, Basel, Switzerland. This article is an open access article distributed under the terms and conditions of the Creative Commons Attribution (CC BY) license (http://creativecommons.org/licenses/by/4.0/).
Share and Cite
Bertocchi, M.; Sirri, F.; Palumbo, O.; Luise, D.; Maiorano, G.; Bosi, P.; Trevisi, P. Exploring Differential Transcriptome between Jejunal and Cecal Tissue of Broiler Chickens. Animals 2019, 9, 221. https://doi.org/10.3390/ani9050221
Bertocchi M, Sirri F, Palumbo O, Luise D, Maiorano G, Bosi P, Trevisi P. Exploring Differential Transcriptome between Jejunal and Cecal Tissue of Broiler Chickens. Animals. 2019; 9(5):221. https://doi.org/10.3390/ani9050221
Chicago/Turabian StyleBertocchi, Micol, Federico Sirri, Orazio Palumbo, Diana Luise, Giuseppe Maiorano, Paolo Bosi, and Paolo Trevisi. 2019. "Exploring Differential Transcriptome between Jejunal and Cecal Tissue of Broiler Chickens" Animals 9, no. 5: 221. https://doi.org/10.3390/ani9050221
APA StyleBertocchi, M., Sirri, F., Palumbo, O., Luise, D., Maiorano, G., Bosi, P., & Trevisi, P. (2019). Exploring Differential Transcriptome between Jejunal and Cecal Tissue of Broiler Chickens. Animals, 9(5), 221. https://doi.org/10.3390/ani9050221