Stocking Density Affects Stress and Anxious Behavior in the Laying Hen Chick During Rearing


Abstract
:Simple Summary
Abstract
1. Introduction
2. Materials and Methods
2.1. Welfare Note
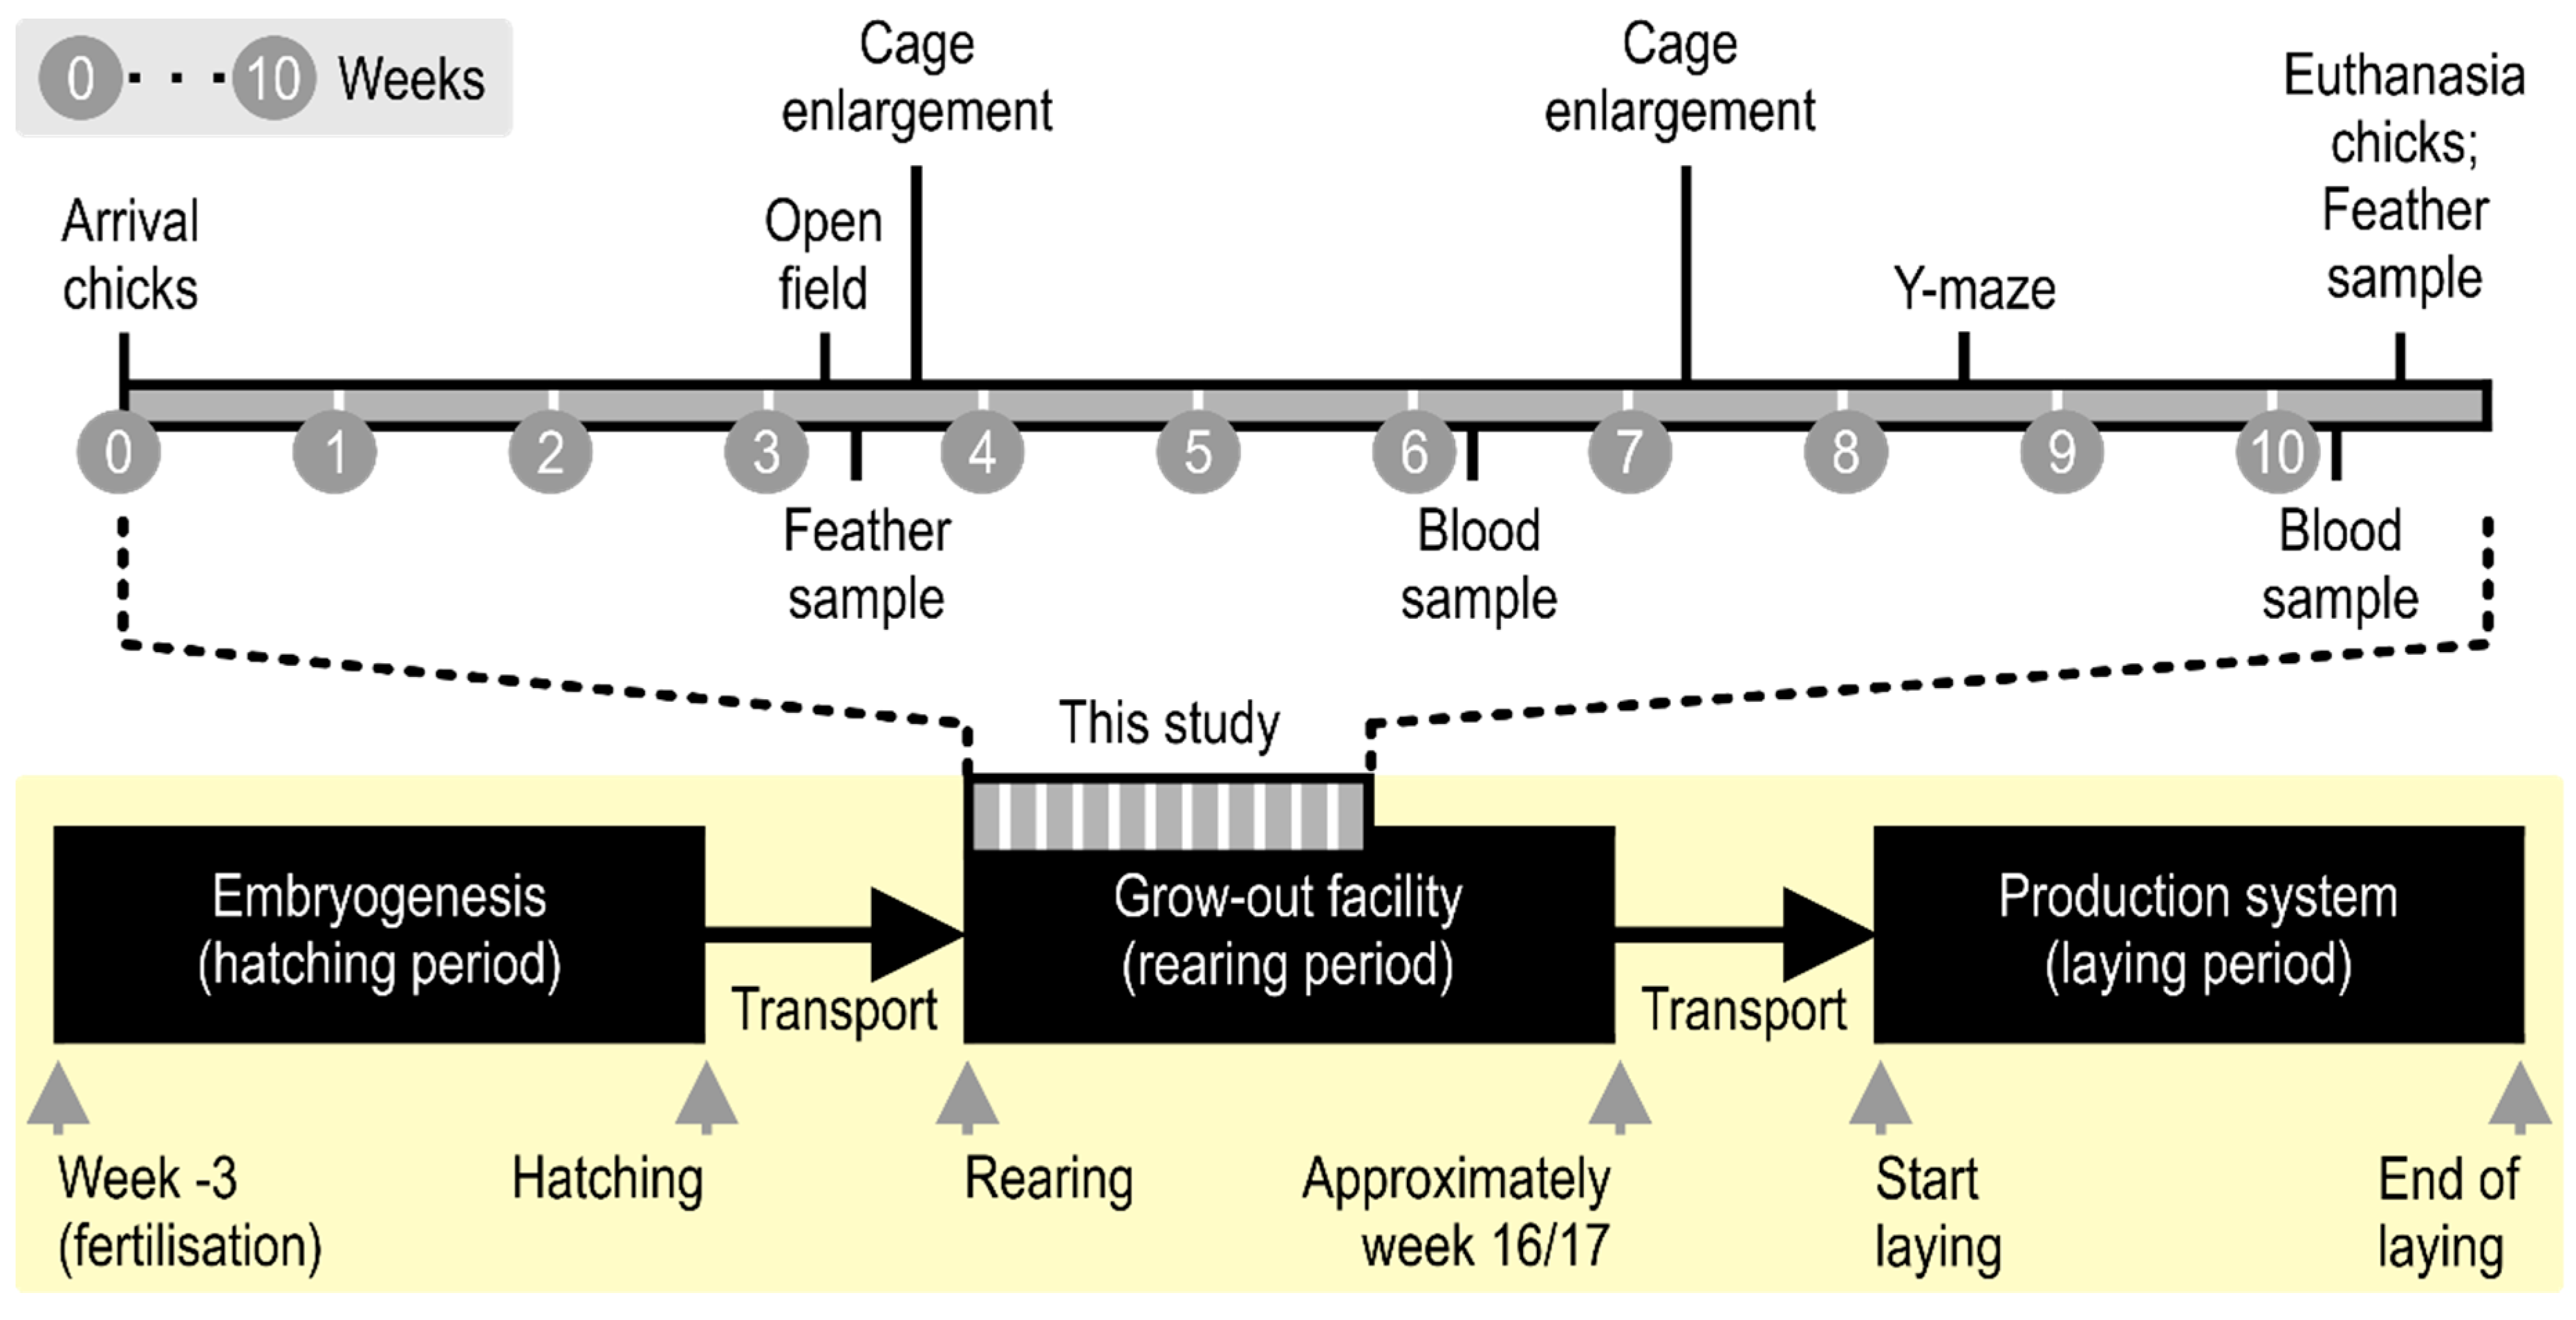
2.2. Animals
2.3. Housing
2.4. Behavioral Tests
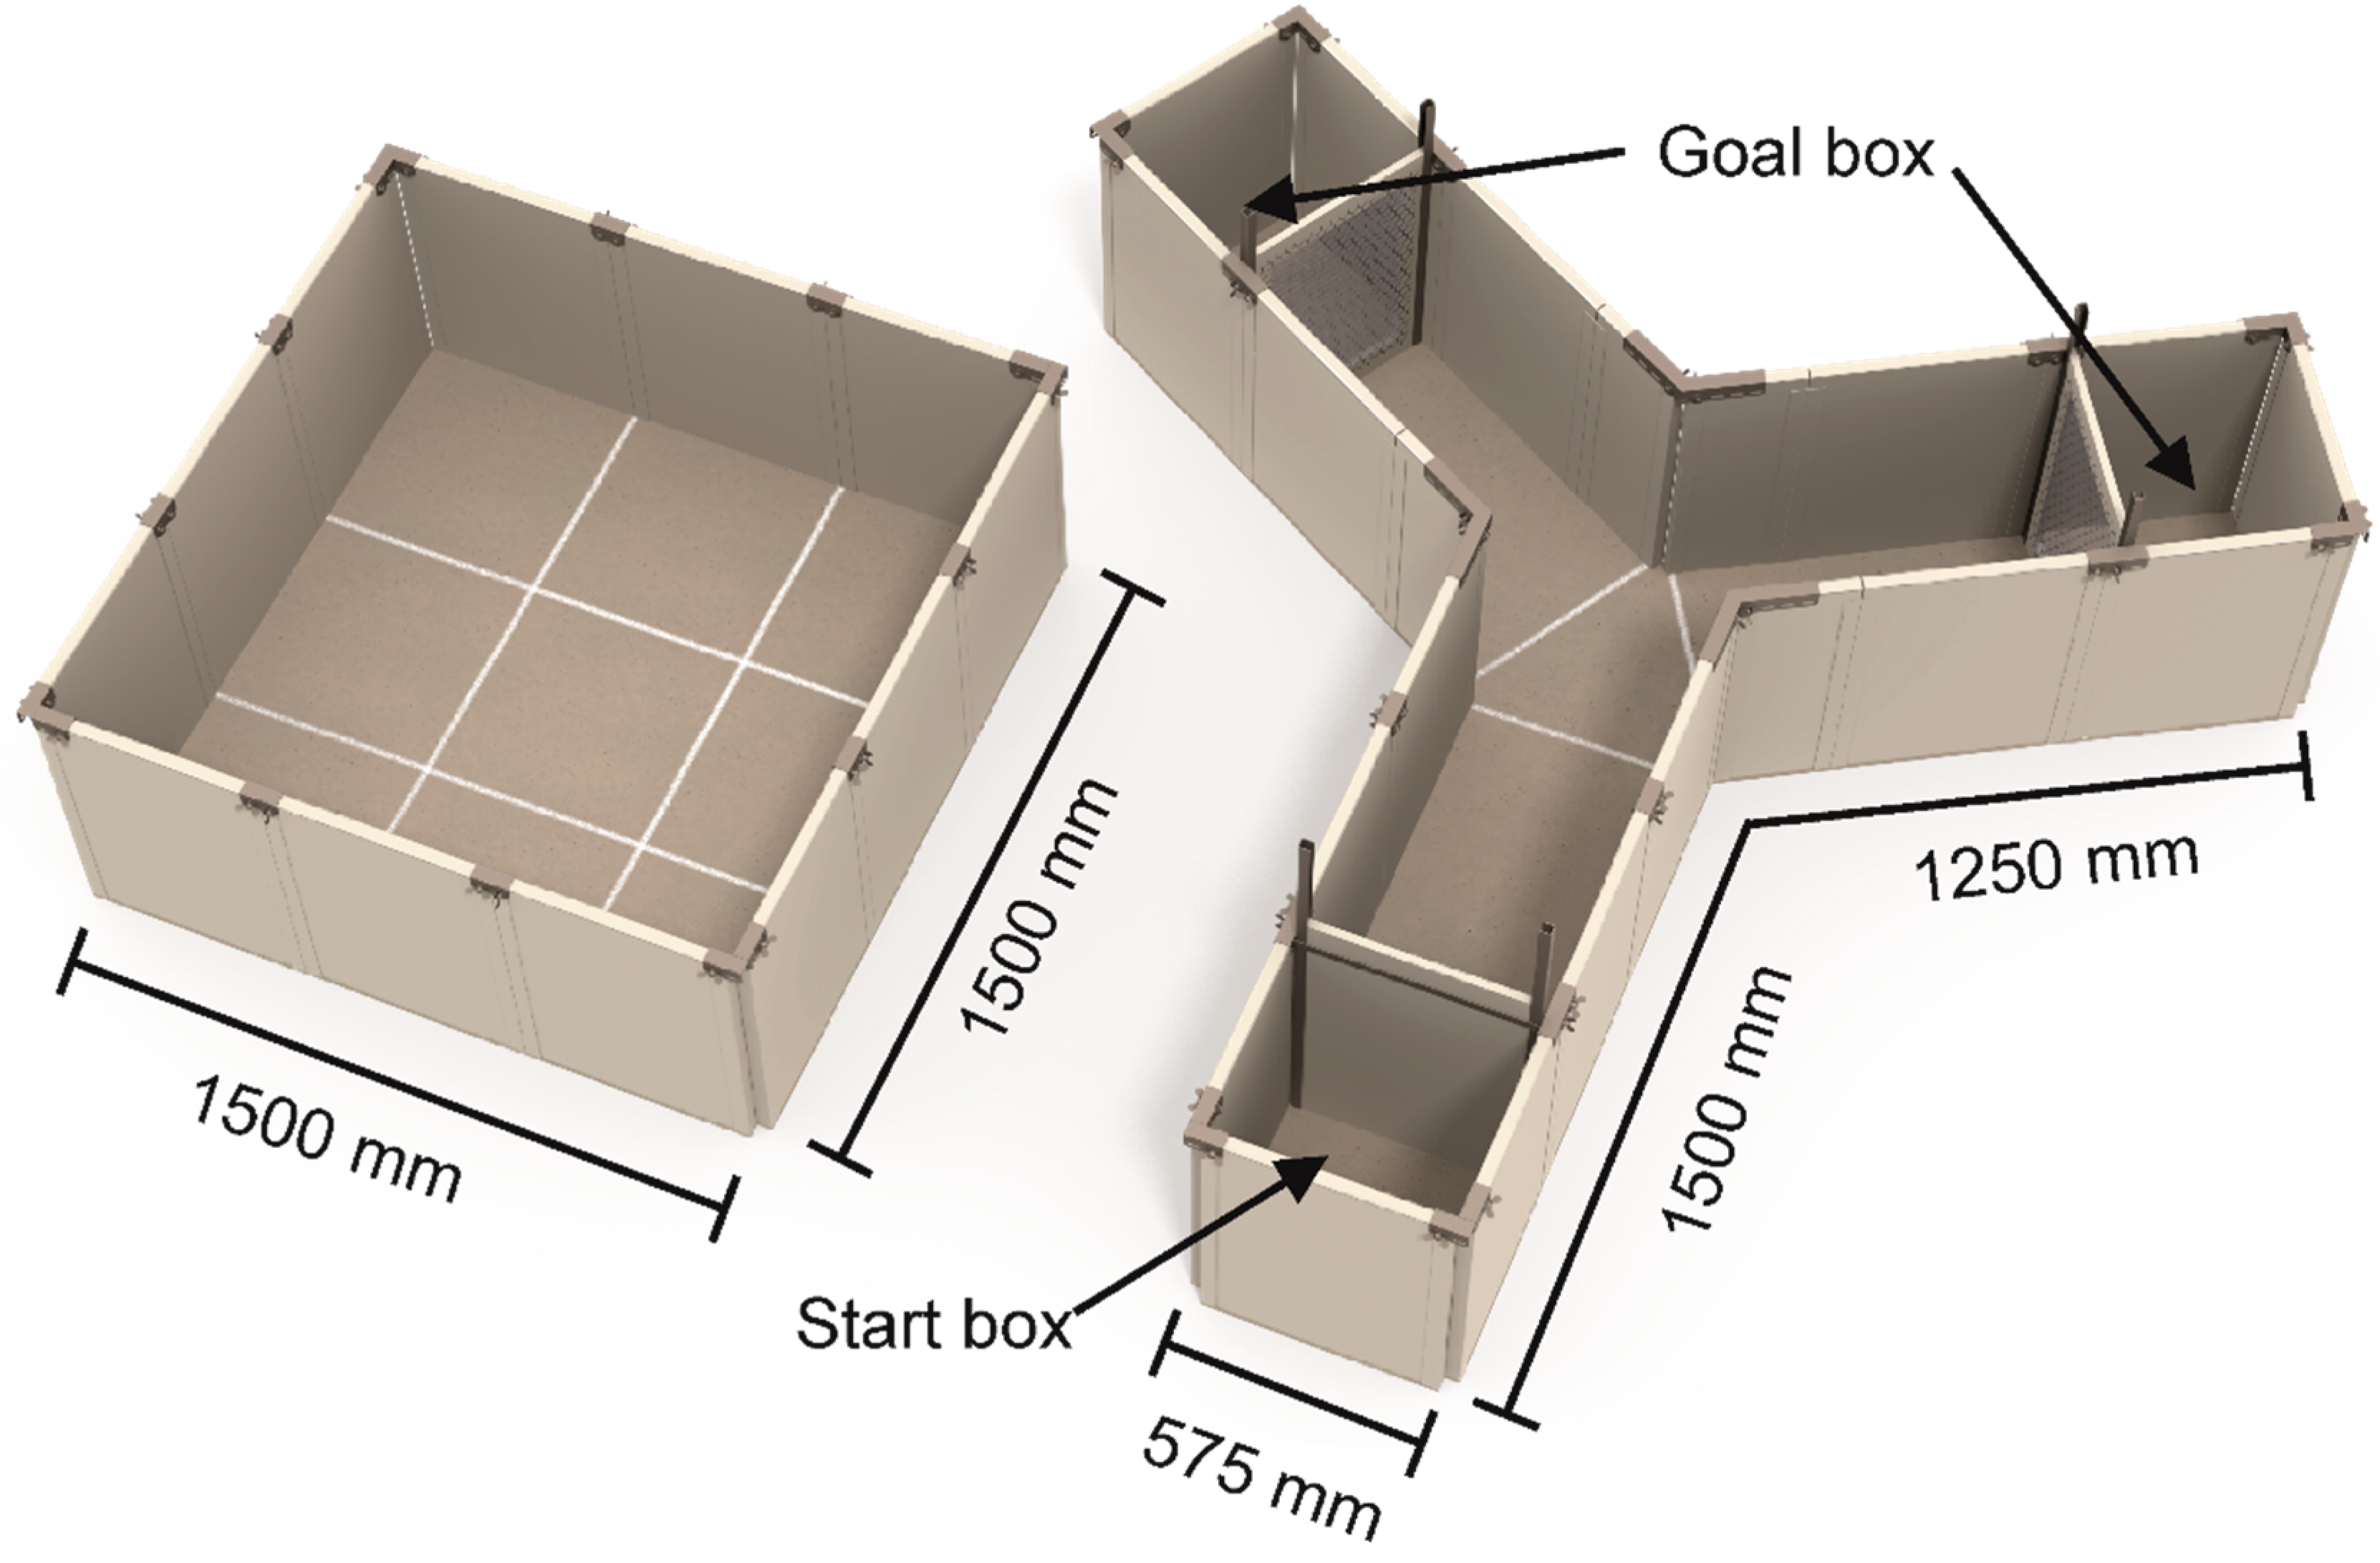
2.4.1. Open Field Test
Apparatus
Procedure
2.4.2. Y-Maze Test Social Versus Foraging
Apparatus
Procedure
2.5. Glucocorticoids
2.5.1. Plasma
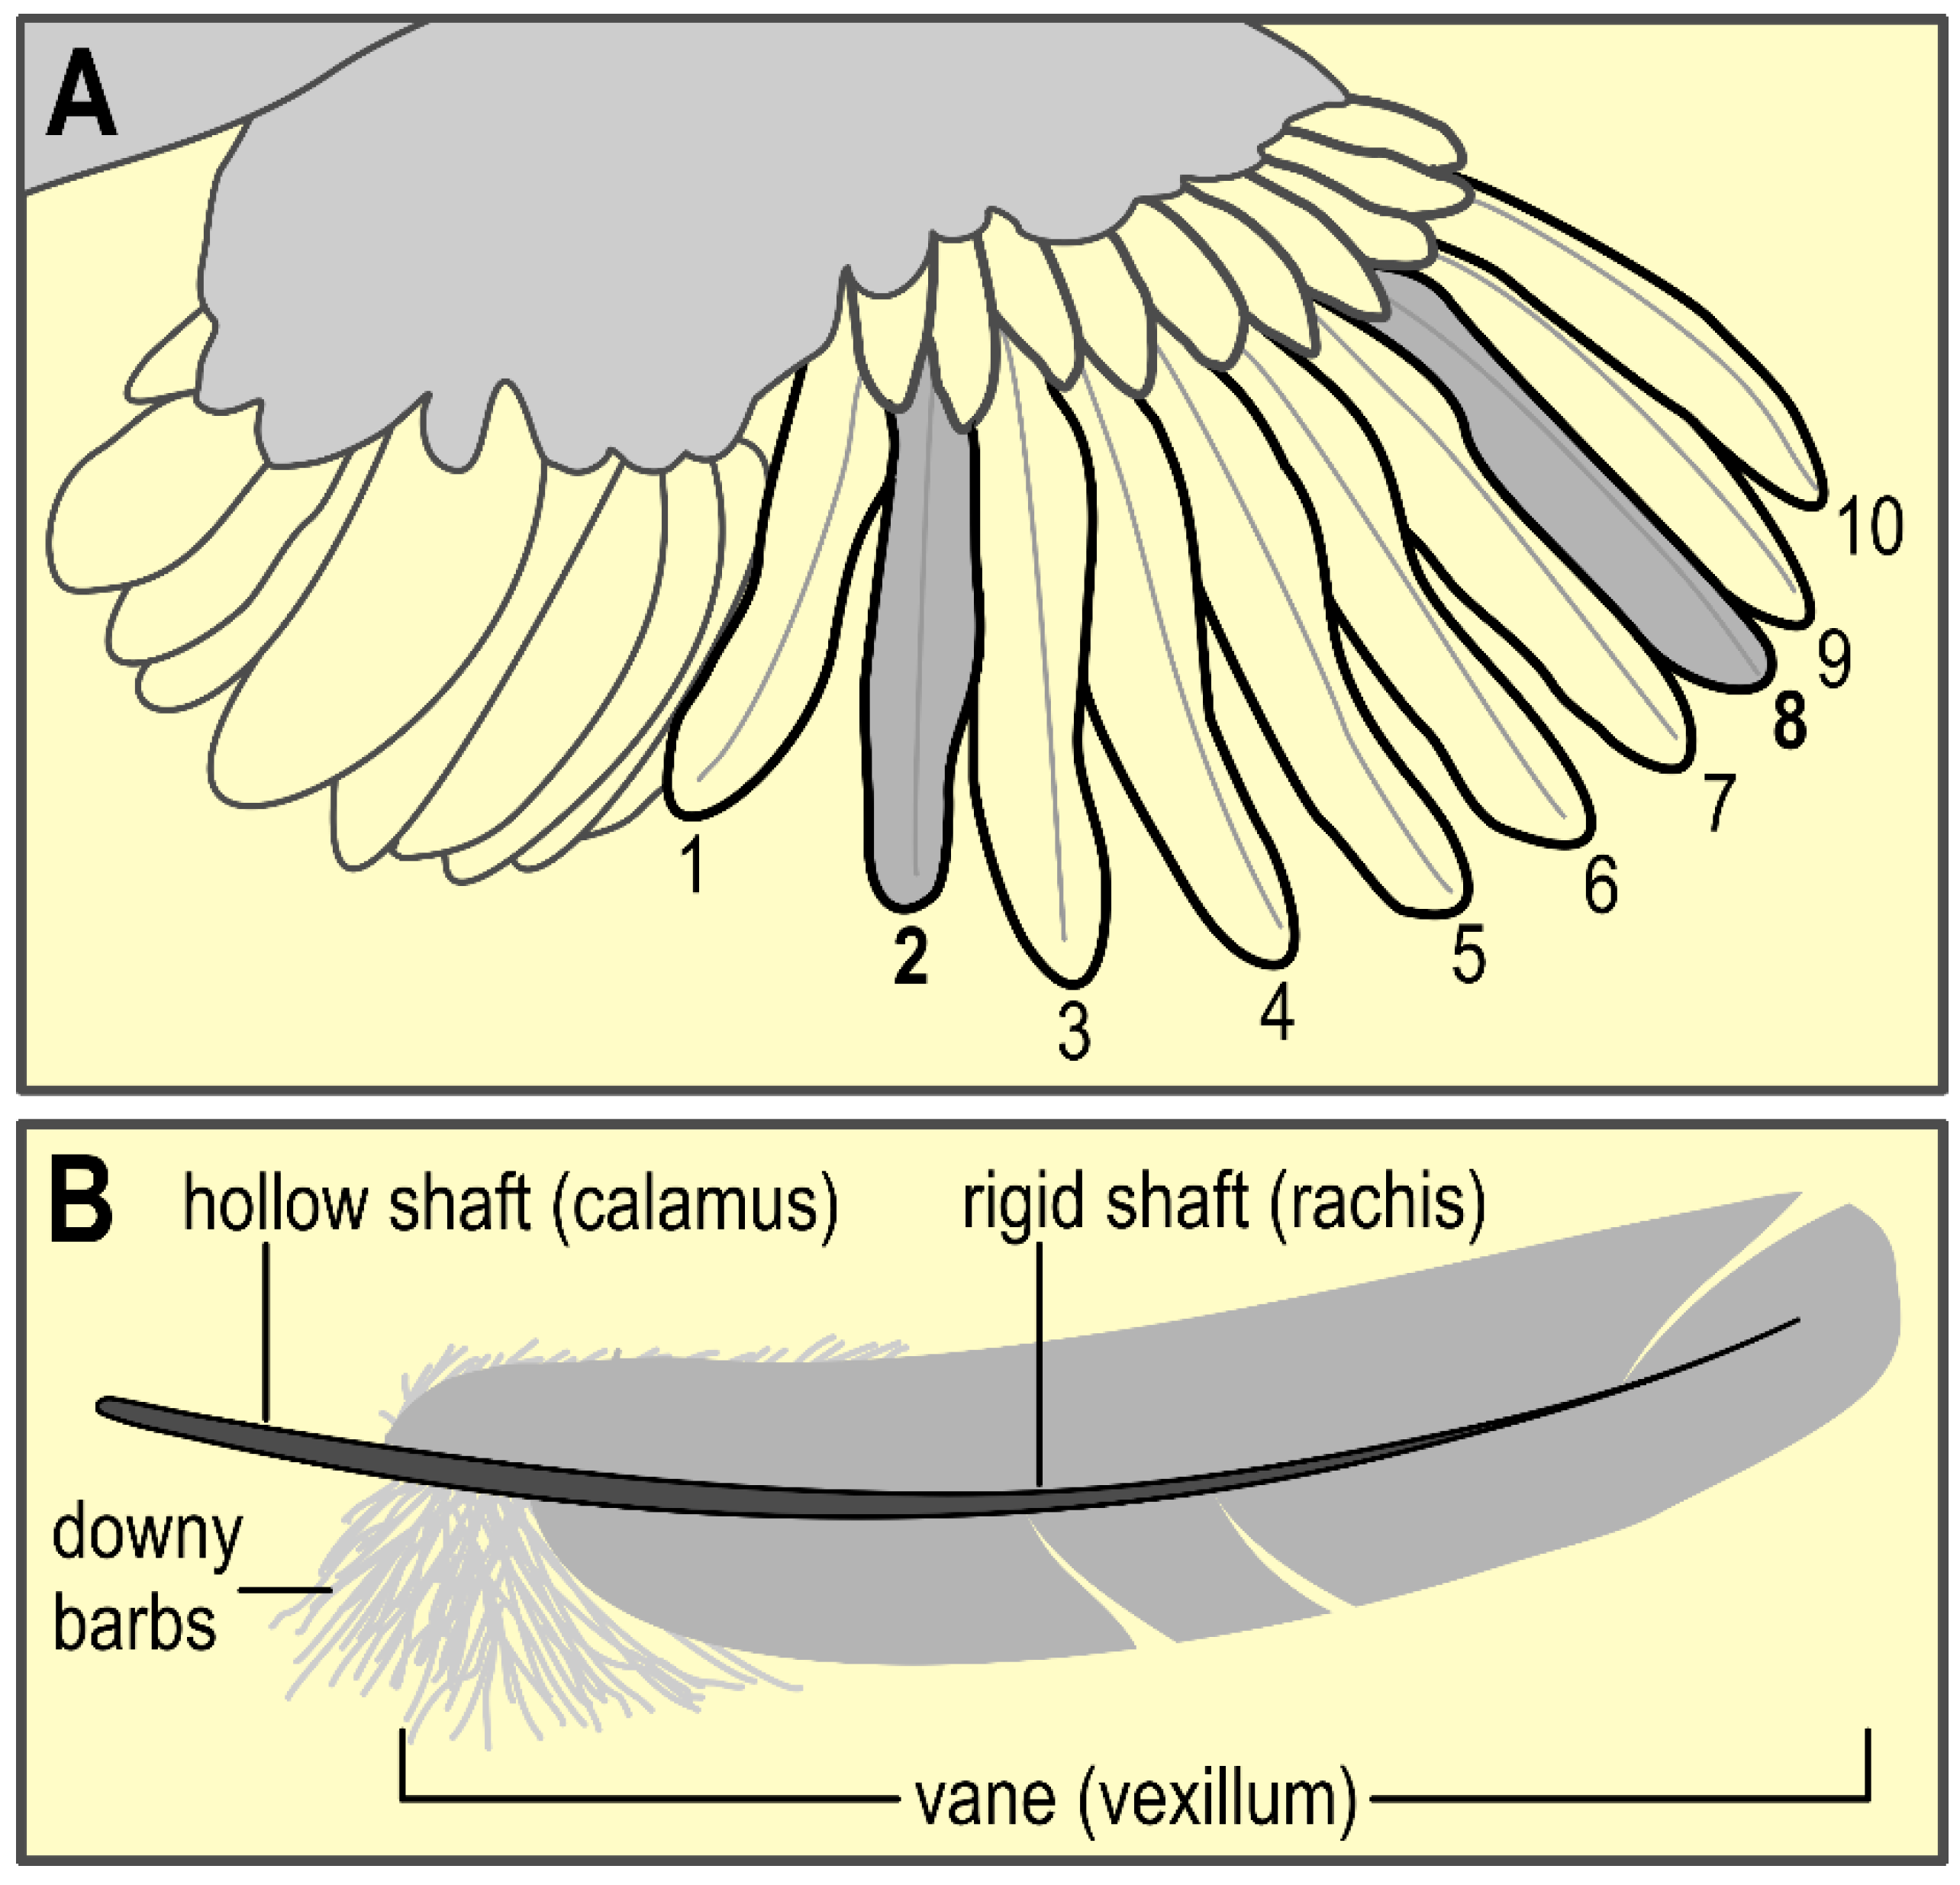
2.5.2. Feathers
2.6. Staistical Analysis
3. Results
3.1. Body Weight
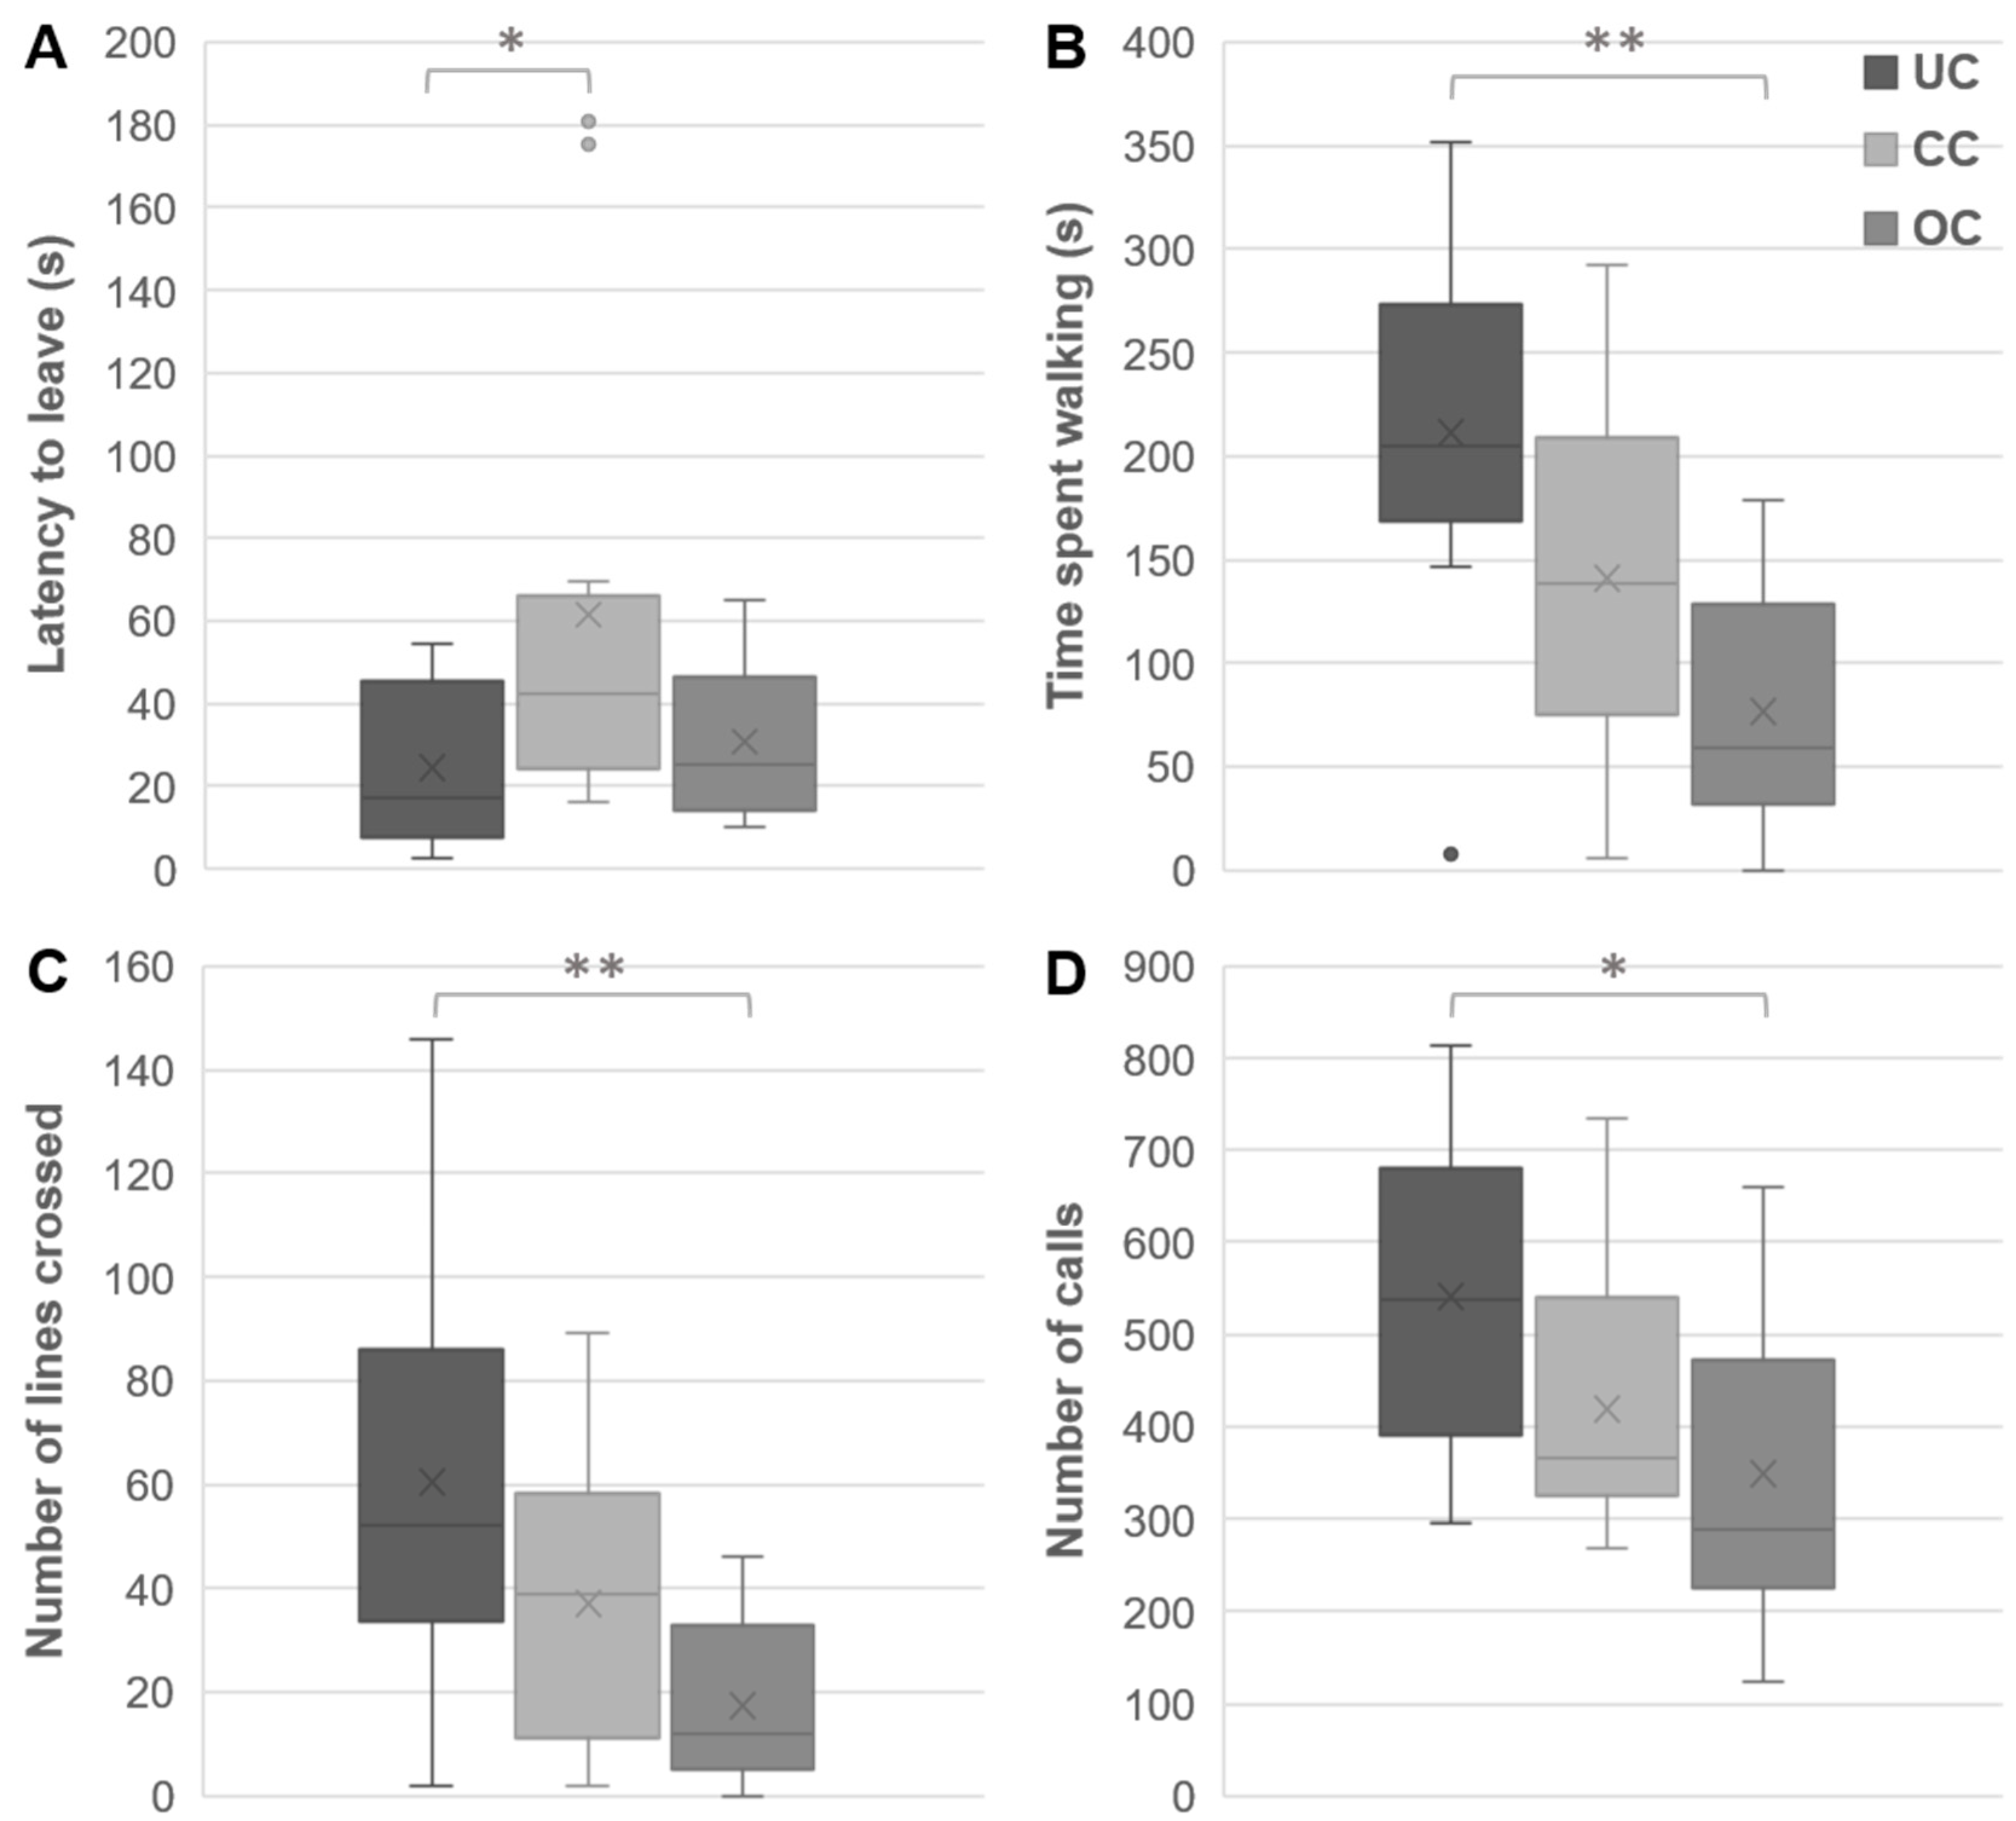
3.2. Open Field Behaviors
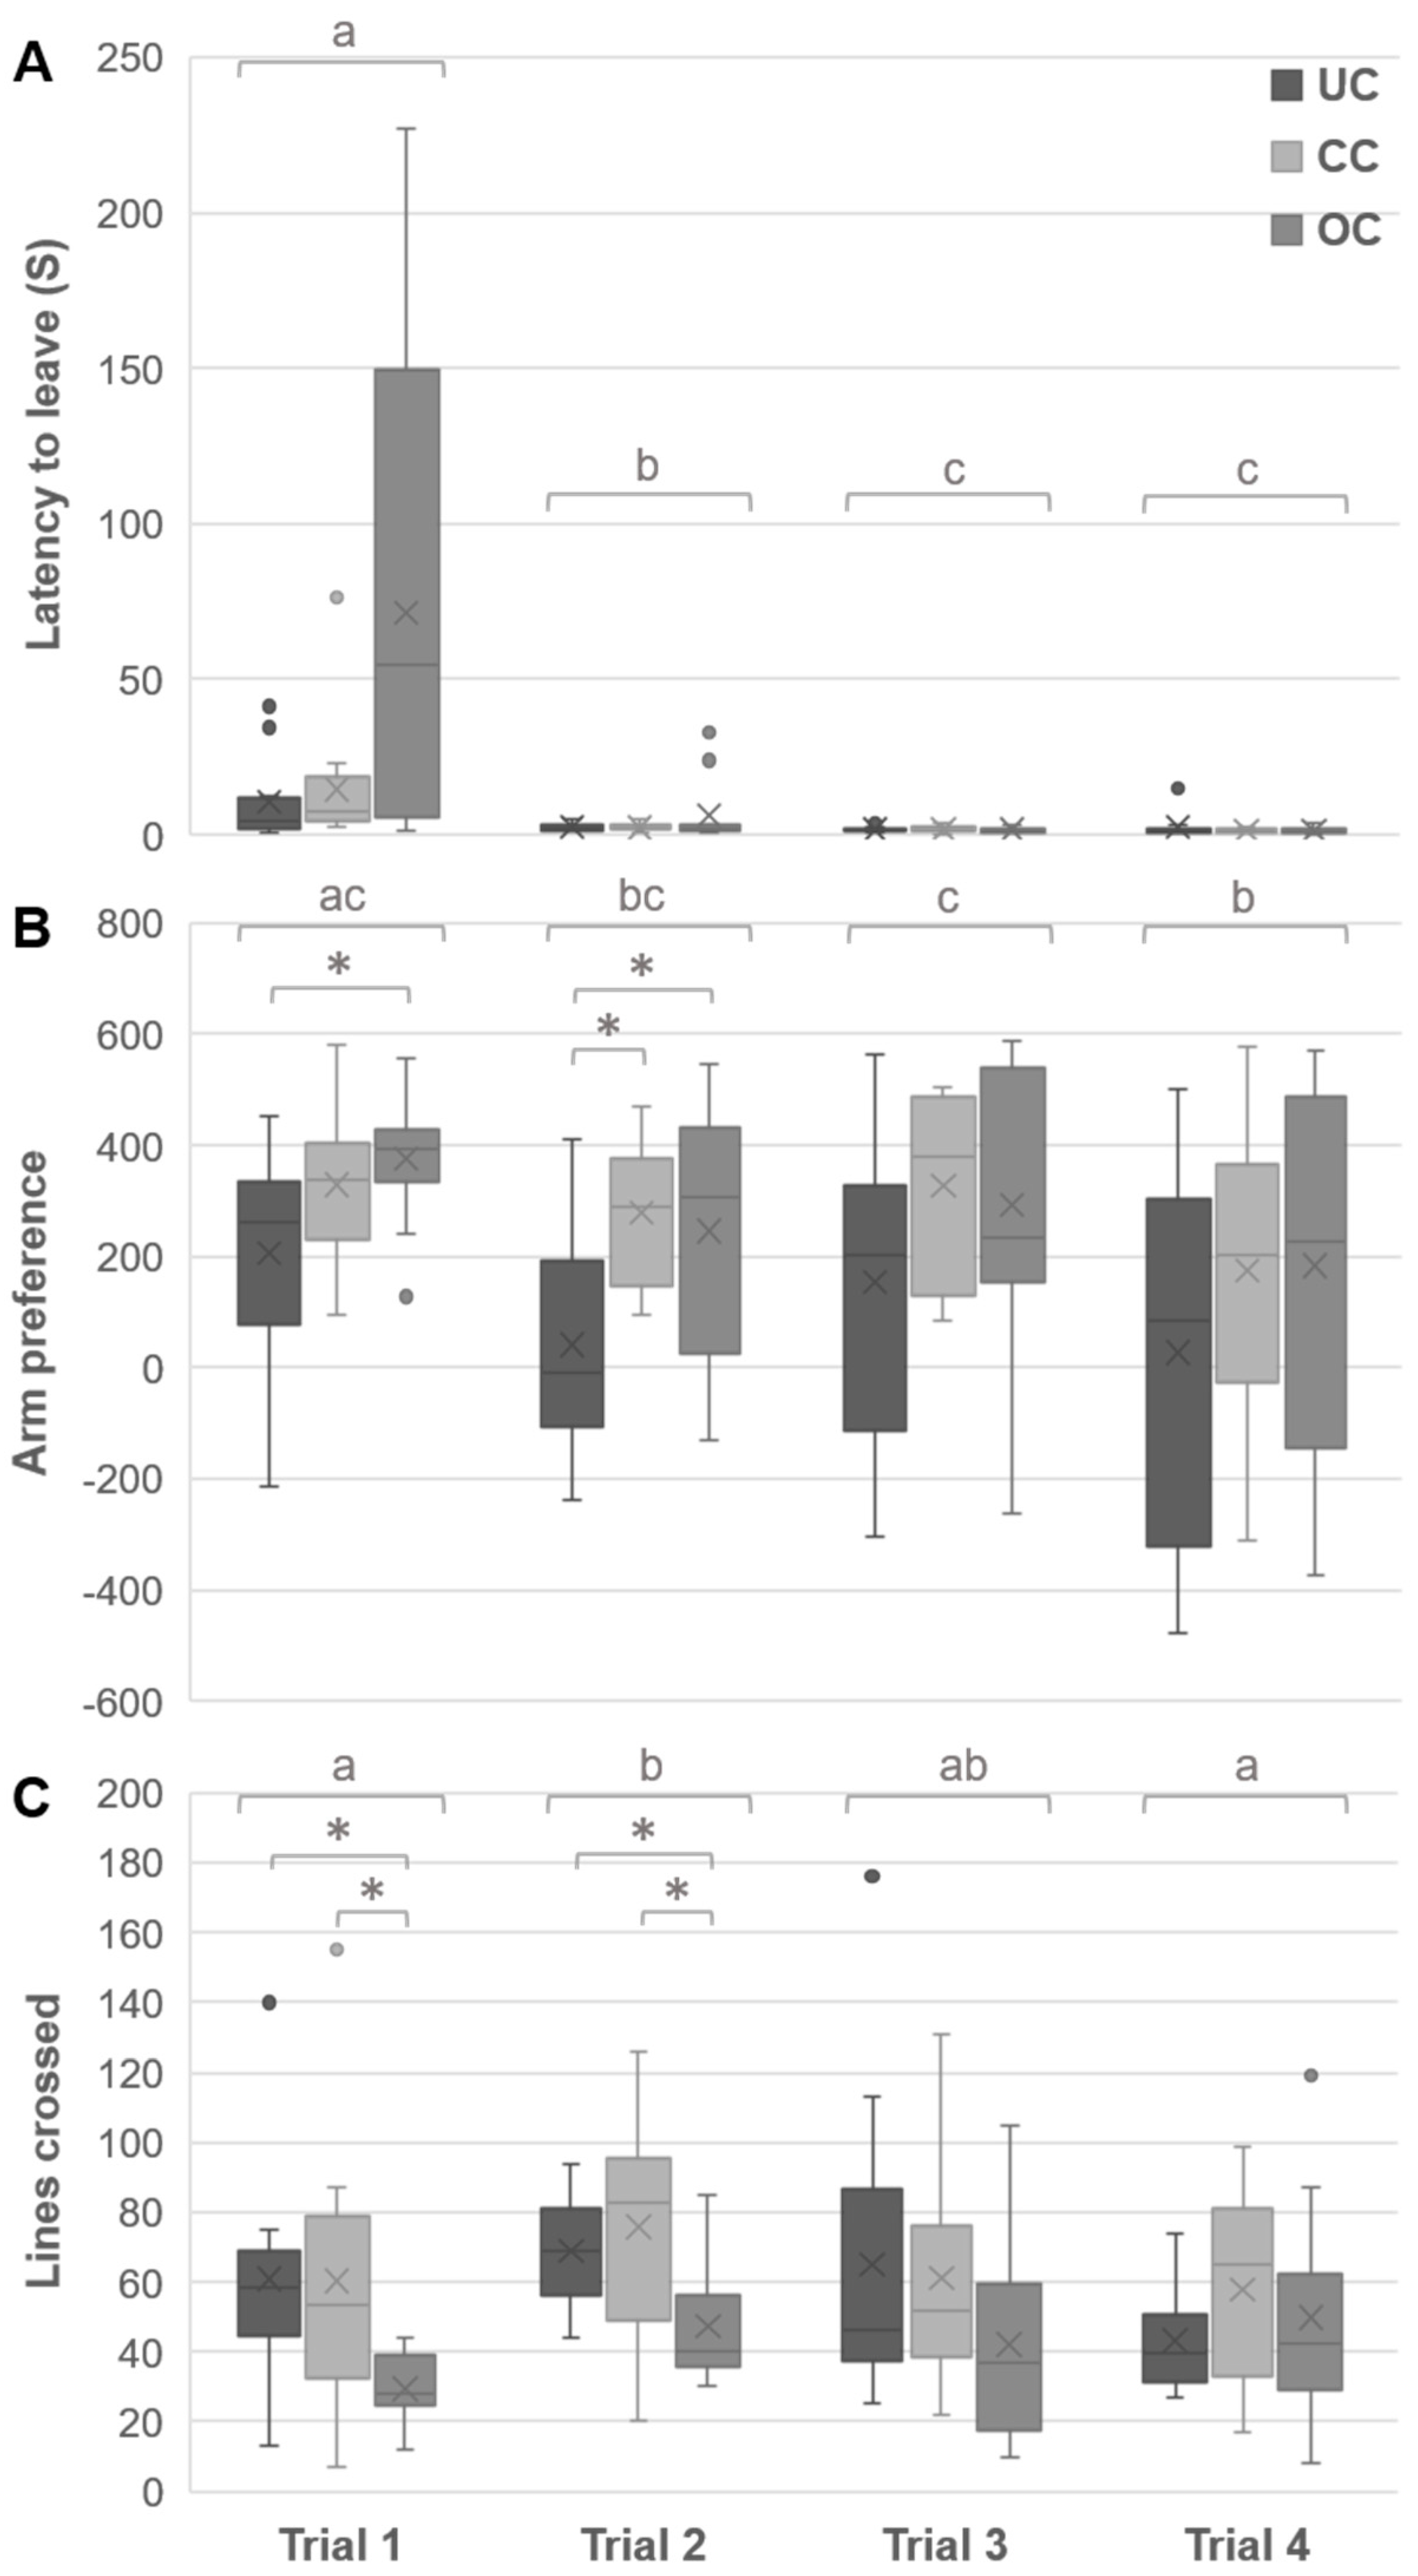
3.3. Y-Maze Behaviors
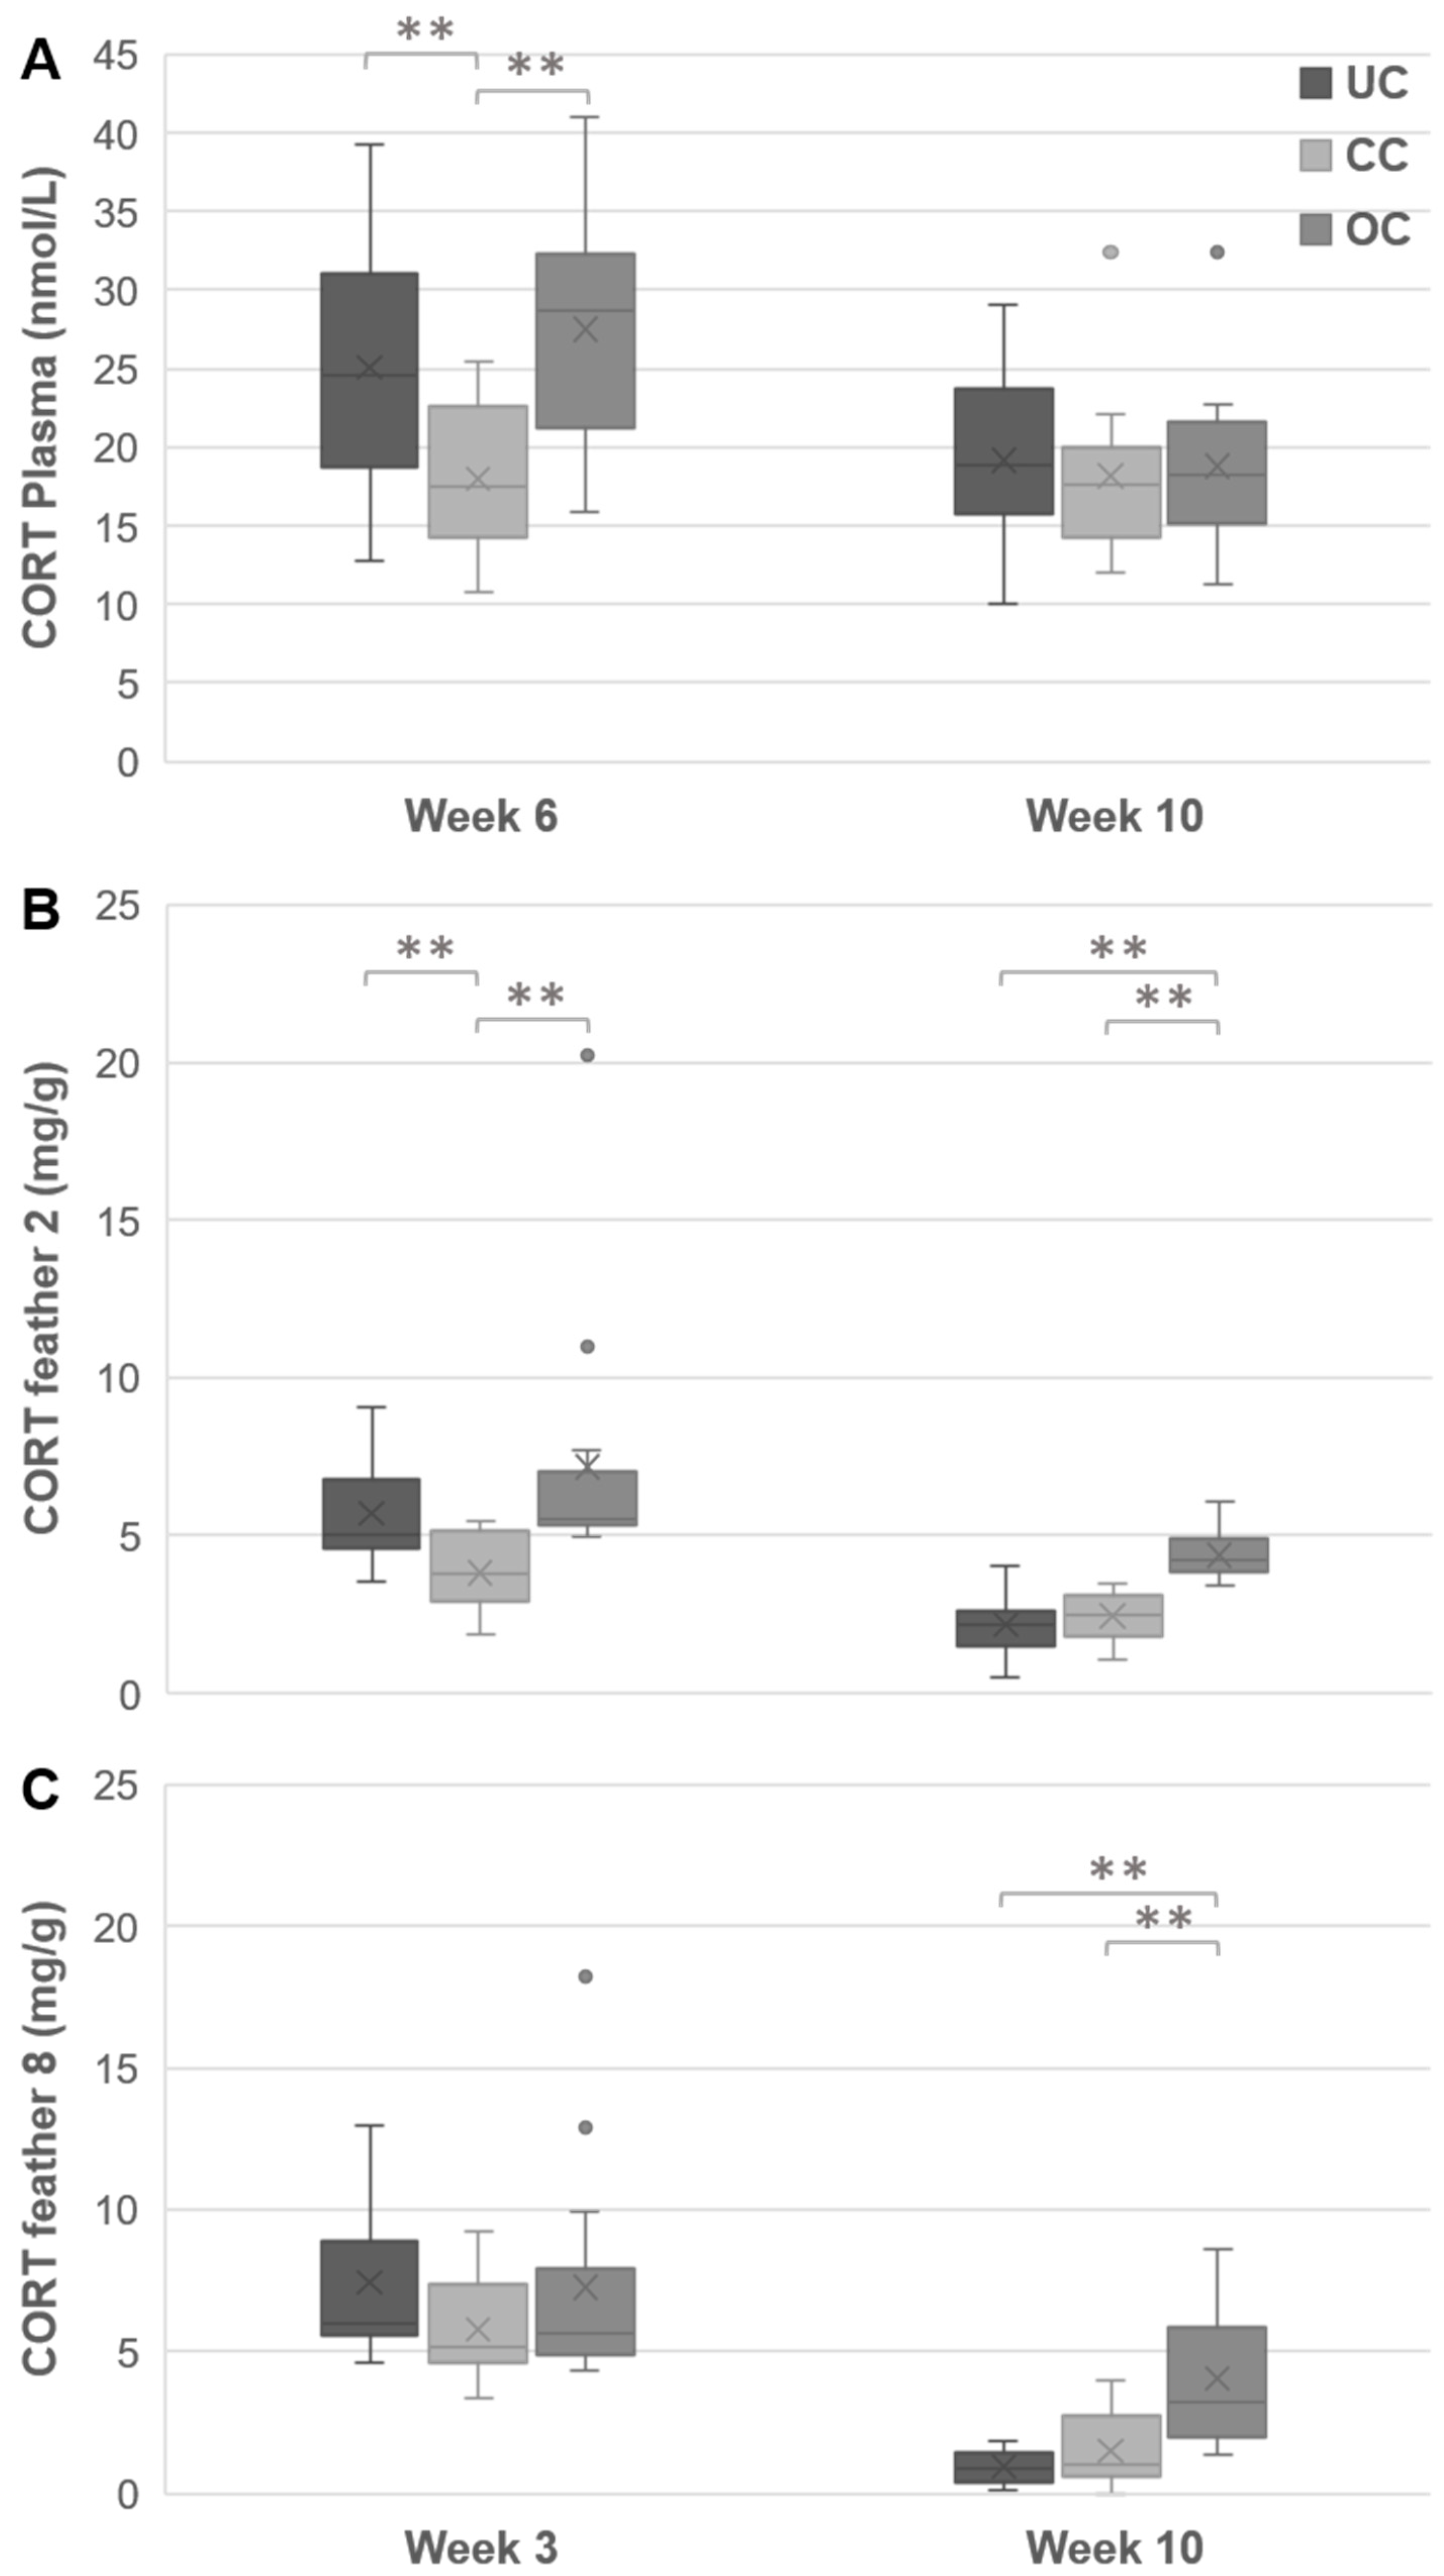
3.4. Plasma CORT
3.5. Feather CORT
4. Discussion
4.1. Body Weight
4.2. Stress and Anxiety
4.3. Welfare
5. Conclusions
Author Contributions
Funding
Acknowledgments
Conflicts of Interest
References
- Appleby, M.C. What causes crowding? Effects of space, facilities and group size on behavior, with particular reference to furnished cages for hens. Anim. Welf. 2004, 13, 313–320. [Google Scholar]
- Bestman, M.; Koene, P.; Wagenaar, J.-P. Influence of farm factors on the occurrence of feather pecking in organic reared hens and their predictability for feather pecking in the laying period. Appl. Anim. Behav. Sci. 2009, 121, 120–125. [Google Scholar] [CrossRef]
- Lampton, S.L.; Knowles, T.G.; Yorke, C.; Nicol, C.J. The risk factors affecting the development of gentle and severe feather pecking in loose housed laying hens. App. Anim. Behav. Sci. 2010, 123, 32–42. [Google Scholar] [CrossRef]
- Rodenburg, T.B.; van Krimpen, M.M.; de Jong, I.C.; de Haas, E.N.; Kops, M.S.; Riedstra, B.J.; Nordquist, R.E.; Wagenaar, J.P.; Bestman, M.; Nicol, C.J. The prevention and control of feather pecking in laying hens: Identifying the underlying principles. World’s Poult. Sci. J. 2013, 69, 361–374. [Google Scholar] [CrossRef]
- Janczak, A.M.; Riber, A.B. Review of rearing-related factors affecting the welfare of laying hens. Poult. Sci. 2015, 94, 1454–1469. [Google Scholar] [CrossRef] [PubMed]
- Rodenburg, T.B.; de Haas, E.N. Of nature and nurture: The role of genetics and environment in behavioral development of laying hens. Behav. Sci. 2016, 7, 91–94. [Google Scholar] [CrossRef]
- Averoz, X.; Estevez, I. Meta-analysis of the effects of intensive rearing environments on the performance and welfare of broiler chickens. Poult. Sci. 2018, 97, 3767–3785. [Google Scholar] [CrossRef]
- Ohl, F.; Van der Staay, F.J. Animal welfare: At the interface between science and society. Vet. J. 2012, 192, 13–19. [Google Scholar] [CrossRef]
- Koolhaas, J.M.; Bartolomucci, A.; Buwalda, B.; De Boer, S.F.; Flügge, G.; Korte, S.M.; Meerlo, P.; Murison, R.; Olivier, B.; Palanza, P.; et al. Stress revisited: A critical evaluation of the stress concept. Neurosci. Biobehav. Rev. 2011, 35, 1291–1301. [Google Scholar] [CrossRef]
- Selye, H. The general adaptation syndrome and the diseases of adaptation. J. Clin. Endocrinol. MeTable 1946, 6, 117–230. [Google Scholar] [CrossRef]
- de Matos, R. Adrenal steroid metabolism in birds: Anatomy, physiology, and clinical considerations. Vet. Clin. N. Am. Exotic Anim. Pract. 2008, 11, 35–57. [Google Scholar] [CrossRef] [PubMed]
- Bozkurt, Z.; Bayram, I.; Bülbül, A.; Aktepe, O.R. Effects of strain, cage density and position on immune response to vaccines and blood parameters in layer pullets. Anim. Sci. Biotech. 2008, 42, 149–158. [Google Scholar]
- Jones, R.B.; Beuving, G.; Blokhuis, H.J. Tonic immobility and heterophil/lymphocyte responses of the domestic fowl to corticosterone infusion. Physiol. Behav. 1988, 42, 249–253. [Google Scholar] [CrossRef]
- Ralph, C.R.; Tilbrook, A.J. Invited review: The usefulness of measuring glucocorticoids for assessing animal welfare. J. Anim. Sci. 2016, 94, 457–470. [Google Scholar] [CrossRef] [PubMed]
- Ohl, F.; Arndt, S.S.; van der Staay, F.J. Pathological anxiety in animals. Vet. J. 2008, 175, 18–26. [Google Scholar] [CrossRef] [PubMed]
- Labar, K.S.; Ledoux, J.E. Coping with danger: The neural basis of defensive behavior and fearful feelings. Compr. Physiol. 2011. [Google Scholar] [CrossRef]
- Hall, C.S. Emotional behavior in the rat. I. Defecation and urination as measures of individual differences in emotionality. J. Comp. Psychol. 1934, 18, 385. [Google Scholar] [CrossRef]
- Jones, R.B. Sex and strain differences in the open-field responses of the domestic chick. Appl. Anim. Ethol. 1977, 3, 255–261. [Google Scholar] [CrossRef]
- Jones, R.B. Activities of chicks in their home cages and in an open field. Br. Poult. Sci. 1978, 19, 725–730. [Google Scholar] [CrossRef]
- de Haas, E.N.; Kops, M.S.; Bolhuis, J.E.; Groothuis, T.G.G.; Ellen, E.D.; Rodenburg, T.B. The relation between fearfulness in young and stress-response in adult laying hens, on individual and group level. Physiol. Behav. 2012, 107, 433–439. [Google Scholar] [CrossRef]
- Marin, R.H.; Freytes, P.; Guzman, D.; Bryan Jones, R. Effects of an acute stressor on fear and on the social reinstatement responses of domestic chicks to cagemates and strangers. Appl. Anim. Behav. Sci. 2001, 71, 57–66. [Google Scholar] [CrossRef]
- Nordquist, R.E.; Heerkens, J.L.; Rodenburg, T.B.; Boks, S.; Ellen, E.D.; van der Staay, F.J. Laying hens selected for low mortality: behavior in tests of fearfulness, anxiety and cognition. Appl. Anim. Behav. Sci. 2011, 131, 110–122. [Google Scholar] [CrossRef]
- Angevaare, M.J.; Prins, S.; van der Staay, F.J.; Nordquist, R.E. The effect of maternal care and infrared beak trimming on development, performance and behavior of Silver Nick hens. Appl. Anim. Behav. Sci. 2012, 140, 70–84. [Google Scholar] [CrossRef]
- Väisänen, J.; Jensen, P. Social versus exploration and foraging motivation in young red junglefowl (Gallus gallus) and White Leghorn layers. Appl. Anim. Behav. Sci. 2003, 84, 139–158. [Google Scholar] [CrossRef]
- Suarez, S.D.; Gallup, G.G. Social reinstatement and open-field testing in chickens. Anim. Learn. Behav. 1983, 11, 119–126. [Google Scholar] [CrossRef]
- Romero, L.M.; Reed, J.M. Collecting baseline corticosterone samples in the field: is under 3 min good enough? Comp. Biochem. Physiol. Part A Mol. Integr. Physiol. 2005, 140, 73–79. [Google Scholar] [CrossRef] [PubMed]
- Bortolotti, G.R.; Marchant, T.A.; Blas, J.; German, T. Corticosterone in feathers is a long-term, integrated measure of avian stress physiology. Funct. Ecol. 2008, 22, 494–500. [Google Scholar] [CrossRef]
- Berkvens, C.N. Keratin Glucocorticoid Analysis by Enzyme Immunoassay in Mammals, Birds and Reptiles. Ph.D. Thesis, University of Guelph, Guelph, ON, Canada, 2012. [Google Scholar]
- Zeinstra, E.C.; Oeben, L.; van der Staay, F.J.; Nordquist, R.E. Methoden voor de bepaling van corticosteron in veren en cortisol in haren als mogelijke lange-termijn indicator voor dierenwelzijn. Biotech. 2015, 54, 17–22. [Google Scholar]
- Anderson, K.E.; Adams, A.W. Effects of rearing density and feeder and waterer spaces on the productivity and fearful behavior of layers. Poult. Sci. 1992, 71, 53–58. [Google Scholar] [CrossRef]
- Blokhuis, H.J.; van der Haar, J.W. Effects of floor type during rearing nad of beak trimming on ground pecking and feather pecking in laying hens. Appl. Anim. Behav. Sci. 1989, 22, 359–369. [Google Scholar] [CrossRef]
- Bozkurt, Z.; Bayram, I.; Türkmenoğlu, I.; Aktepe, O.C. Effects of cage density and position on performance of commercial layer pullets from four genotypes. Turkish J. Vet. Anim. Sci. 2006, 30, 17–28. [Google Scholar]
- Carey, J.B. Effects of pullet-stocking density on performance of the laying hens. Poult. Sci. 1986, 66, 1283–1287. [Google Scholar] [CrossRef] [PubMed]
- Hansen, I.; Braastad, B.O. Effects of rearing density on pecking behavior and plumage condition of laying hens in two types of aviary. Appl. Anim. Behav. Sci. 1994, 40, 263–272. [Google Scholar] [CrossRef]
- Hester, P.Y.; Wilson, E.K. Performance of White Leghorn hens in response to cage density and the introduction of cage mates. Poult. Sci. 1986, 65, 2029–2033. [Google Scholar] [CrossRef] [PubMed]
- Huber-Eicher, B.; Audigé, L. Analysis of risk factors for the occurrence of feather pecking in laying hen growers. Brit. Poult. Sci. 1999, 40, 599–604. [Google Scholar] [CrossRef] [PubMed]
- Hunniford, M.E.; Widowski, T.M. Rearing environment and laying location affect pre-laying behavior in enriched cages. Appl. Anim. Behav. Sci. 2016, 181, 205–213. [Google Scholar] [CrossRef]
- Leeson, S.; Summer, J.D. Effects of cage density and diet energy concentration on the performance of growing Leghorn pullets subjected to early induced maturity. Poult. Sci. 1984, 63, 875–882. [Google Scholar] [CrossRef]
- Møller, A.P.; Sanotra, G.S.; Vestergaard, K.S. Developmental stability in relation to population density and breed of chicken Gallus Gallus. Poult. Sci. 1996, 74, 1761–1771. [Google Scholar] [CrossRef]
- Patterson, P.H.; Siegel, H.S. Impact of cage density on pullet performance and blood parameters of stress. Poult. Sci. 1997, 77, 32–40. [Google Scholar] [CrossRef]
- Pavan, A.C.; Mori, C.; Garcia, E.A.; Scherer, M.R.; Pizzolante, C.C. Níveis de proteína bruta e de aminoácidos sulfurados totais sobre o desempenho, a qualidade dos ovos e a excreção de nitrogênio de poedeiras de ovos marrons. R. Bras. Zootec. 2005, 34, 568–574. [Google Scholar] [CrossRef]
- Wells, R.G. The effect of varying stocking density on the development and subsequent laying performance of floor-reared pullets. Brit. Poult. Sci. 1972, 13, 13–25. [Google Scholar] [CrossRef]
- Zepp, M.; Louton, H.; Erhard, M.; Schmidt, P.; Helmer, F.; Schwarzer, A. The influence of stocking density and enrichment on the occurrence of feather pecking and aggressive pecking behavior in laying hen chicks. J. Vet. Behav. 2018, 24, 9–18. [Google Scholar] [CrossRef]
- Blumstein, D.T.; Daniel, J.C. Quantifying behavior the JWatcher way. Int. Comp. Biol. 2008, 48, 437–439. [Google Scholar]
- Maher, J.M.; Markey, J.C.; Ebert-May, D. The other half of the story: Effect size analysis in quantitative research. CBE—Life Sci. Educ. 2013, 12, 345–351. [Google Scholar] [CrossRef] [PubMed]
- Bell, D. Crowding in cage rearing affects pullet weights. Poult. Tribut. 1969, 18, 19–28. [Google Scholar]
- Jones, R.B.; Satterlee, D.G.; Ryder, F.H. Fear and distress in Japanese quail chicks of two lines genetically selected for low or high adrenocortical response to immobilization stress. Horm. Behav. 1992, 26, 385–393. [Google Scholar] [CrossRef]
- Satterlee, D.G.; Marin, R.H. Stressor-induced changes in open-field behavior of Japanese quail selected for contrasting adrenocortical responsiveness to immobilization. Poult. Sci. 2006, 85, 404–409. [Google Scholar] [CrossRef]
- Jones, R.B. Repeated exposure of the domestic chick to a novel environment: Effects on behavioral responses. Behav. Process. 1977, 2, 163–173. [Google Scholar] [CrossRef]
- Leone, E.H.; Estevez, I. Use of space in the domestic fowl: Separating the effects of enclosure size, group size and density. Anim. Behav. 2008, 76, 1673–1682. [Google Scholar] [CrossRef]
- Turner, A.I.; Keating, C.L.; Tilbrook, A.J. Sex differences and the role of sex steroids in sympatho-adrenal medullary system and hypothalamo-pituitary adrenal axis responses to stress. Sex Steroids 2012. [Google Scholar] [CrossRef]
- Turner, A.I.; Rivalland, E.T.A.; Clarke, I.J.; Tilbrook, A.J. Stressor specificity of sex differences in hypothalamo-pituitary-adrenal axis activity: Cortisol responses to exercise, endotoxin, wetting, and isolation/restraint stress in gonadectomized male and female sheep. Endocrinology 2010, 151, 4324–4331. [Google Scholar] [CrossRef] [PubMed]
- Muir, W.M.; Craig, J.V. Improving animal well-being through genetic selection. Poult. Sci. 1998, 77, 1781–1788. [Google Scholar] [CrossRef] [PubMed]
- Shelton, D.S. Environmental Features Influence Complex Behavior in Small Groups of Animals. Ph.D. Thesis, Indiana University Bloomington, Bloomington, IL, USA, 2016. [Google Scholar]


| Author | Year | Reference | Density (cm2/Chick) | BW | FI | U | FA | M | PC | H:L | Behavior | LP |
|---|---|---|---|---|---|---|---|---|---|---|---|---|
| Anderson & Adams | 1992 | [30] | 192/221 | (0–16) ↓ (16+) ↑ | nd | nd | - | nd | nd | - | - | - |
| Bestman et al. | 2009 | [2] | (0–4) 294.1/476.2 (5–6) 416.7/555.6 (7–17) 952.4/010.1 | - | - | - | - | - | - | - | ↑ feather pecking | - |
| Blokhuis & van der Haar | 1989 | [31] | 625/1250/3703.7 | - | - | - | - | - | nd | - | ↓ ground pecking ↑ feather pecking | - |
| Bozkurt et al. | 2008 | [12] | (0–4) 105.9/134.8/185.3 (4–16) 211.8/274.5/370.6 | - | - | ↑ | - | - | - | ↑ | - | - |
| Bozkurt et al. | 2006 | [32] | (0–4) 105.9/134.8/185.3 (4–16) 211.8/274.5/370.6 | ↓ | ↓ | - | - | nd | - | - | - | - |
| Carey | 1986 | [33] | 1) 239/259/311 2) 222/259/311 | ↓ | ↓ | - | - | - | - | - | - | ↑ egg weight ↓ egg production decline |
| Hansen & Braastad | 1994 | [34] | 769.2/1538.5 | nd | nd | - | - | nd | ↓ | - | ↓ ground pecking ↑ feather pecking | nd |
| Hester & Wilson | 1986 | [35] | 344/516/1031 | - | - | - | - | - | - | - | - | ↓ hard-shelled:shell-less eggs ↓ eggs:hens |
| Huber-Eicher & Audige | 1999 | [36] | (0–2) > 285.7/< 285.7 (3–16) > 1000/< 1000 | - | - | - | - | - | - | - | ↑ feather pecking | - |
| Hunniford | 2016 | [37] | (0-5) 194.6/285.2 (6–16) 387.1/775 (16+) 690 | - | - | - | - | - | - | - | ↓ activity | - |
| Leeson & Summer | 1984 | [38] | 293/586 | nd | ↓ | - | - | - | - | - | - | ↑ egg weight ↓ eggs |
| Moller et al. | 1995 | [39] | 357.1/416.7/500 | - | - | - | ↑ | - | - | - | ↑ tonic immobility | - |
| Patterson & Siegel | 1997 | [40] | (0–6) 97.8/116.1/142.9/185.8 (6–16) 195.6/232.3/285.9/371.6 | ↓ | (0–2) ↓ (2+) ↑ | nd | - | nd | - | - | - | - |
| Pavan et al. | 2005 | [41] | (0–6) 210.5/228.6/250/275.9 (6–16) 357.1/416.7/500 (16+) 375/450/562.2 | nd | nd | nd | - | - | - | - | - | nd |
| Wells | 1972 | [42] | 700/930/1390/1860 | nd | nd | nd | - | nd | ↓ | - | - | nd |
| Zepp et al. | 2018 | [43] | 436.7/552.5 | - | - | - | - | - | - | - | ↑ feather pecking | - |
| Crowding Condition | |||
|---|---|---|---|
| Age | Undercrowding | Conventional Crowding | Overcrowding |
| 0–3 | 500 cm2 | 167 cm2 | 56 cm2 |
| 4–6 | 1000 cm2 | 333 cm2 | 111 cm2 |
| 7–10 | 1429 cm2 | 500 cm2 | 167 cm2 |
© 2019 by the authors. Licensee MDPI, Basel, Switzerland. This article is an open access article distributed under the terms and conditions of the Creative Commons Attribution (CC BY) license (http://creativecommons.org/licenses/by/4.0/).
Share and Cite
von Eugen, K.; Nordquist, R.E.; Zeinstra, E.; van der Staay, F.J. Stocking Density Affects Stress and Anxious Behavior in the Laying Hen Chick During Rearing. Animals 2019, 9, 53. https://doi.org/10.3390/ani9020053
von Eugen K, Nordquist RE, Zeinstra E, van der Staay FJ. Stocking Density Affects Stress and Anxious Behavior in the Laying Hen Chick During Rearing. Animals. 2019; 9(2):53. https://doi.org/10.3390/ani9020053
Chicago/Turabian Stylevon Eugen, Kaya, Rebecca E. Nordquist, Elly Zeinstra, and Franz Josef van der Staay. 2019. "Stocking Density Affects Stress and Anxious Behavior in the Laying Hen Chick During Rearing" Animals 9, no. 2: 53. https://doi.org/10.3390/ani9020053
APA Stylevon Eugen, K., Nordquist, R. E., Zeinstra, E., & van der Staay, F. J. (2019). Stocking Density Affects Stress and Anxious Behavior in the Laying Hen Chick During Rearing. Animals, 9(2), 53. https://doi.org/10.3390/ani9020053