Milk Urea Concentration in Dairy Sheep: Accounting for Dietary Energy Concentration


 , and
, and 
Simple Summary
Abstract
1. Introduction
2. Materials and Methods
2.1. Animals and Diets
2.2. Measurements
2.3. Chemical Analyses
2.4. Statistical Analysis
3. Results
3.1. Composition of the Diets
3.2. Animal Data
3.3. Results of E1 and E2
3.4. Results of the Meta-Analyses
4. Discussion
4.1. Results of E1 and E2
4.2. Results of the Meta-Analyses
4.3. Practical Applications
5. Conclusions
Author Contributions
Funding
Acknowledgments
Conflicts of Interest
References
- Hennessy, D.W.; Nolan, J.V. Nitrogen kinetics in cattle fed a mature subtropical grass hay with and without protein meal supplementation. Aust. J. Agric. Res. 1988, 39, 1135–1150. [Google Scholar] [CrossRef]
- Harmeyer, J.; Martens, H. Aspects of urea metabolism in ruminants with reference to the goat. J. Dairy Sci. 1980, 63, 1707–1728. [Google Scholar] [CrossRef]
- Zhai, S.W.; Liu, J.X.; Ma, Y. Relation between milk urea content and nitrogen excretion from lactating cows. Acta Agric. Scand. A. 2005, 55, 113–115. [Google Scholar] [CrossRef]
- Oltner, R.; Wiktorsson, H. Urea concentrations in milk and blood as influenced by feeding varying amounts of protein and energy to dairy cows. Livest. Prod. Sci. 1983, 10, 457–467. [Google Scholar] [CrossRef]
- Butler, W.R.; Calaman, J.J.; Beam, S.W. Plasma and Milk Urea Nitrogen in Relation to Pregnancy Rate in Lactating Dairy Cattle. J. Anim. Sci. 1996, 74, 858–865. [Google Scholar] [CrossRef]
- Cannas, A.; Pes, A.; Mancuso, R. Effect of Dietary Energy and Protein Concentration on the Concentration of Milk Urea Nitrogen in Dairy Ewes. J. Dairy Sci. 1998, 81, 499–508. [Google Scholar] [CrossRef]
- Broderick, G.A. Effects of Varying Dietary Protein and Energy Levels on the Production of Lactating Dairy Cows. J. Dairy Sci. 2003, 80, 1370–1381. [Google Scholar] [CrossRef]
- Rapetti, L.; Colombini, S.; Galassi, G.; Crovetto, G.M.; Malagutti, L. Relationship between milk urea level, protein feeding and urinary nitrogen excretion in high producing dairy goats. Small Rumin. Res. 2014, 121, 96–100. [Google Scholar] [CrossRef]
- Cannas, A.; Cabiddu, A.; Bomboi, G.; Ligios, S.; Floris, B.; Molle, G. Decreasing dietary NFC concentration during mid-lactation of dairy ewes: Does it result in higher milk production? Small Rumin. Res. 2013, 111, 41–49. [Google Scholar] [CrossRef]
- Cannas, A. Feeding of lactating ewes. In Dairy Sheep Nutrition; Pulina, G., Ed.; CABI Publishing: Wallingford, UK, 2004; pp. 79–108. [Google Scholar]
- St-Pierre, N.R. Invited review: Integrating quantitative findings from multiple studies using mixed model methodology. J. Dairy Sci. 2001, 84, 741–755. [Google Scholar] [CrossRef]
- Sauvant, D.; Schmidely, P.; Daudin, J.J. Les méta-analyses des données expérimentales: Applications en nutrition animale. INRA Prod. Anim. 2005, 18, 63–73. [Google Scholar]
- Nousiainen, J.; Shingfield, K.J.; Huhtanen, P. Evaluation of Milk Urea Nitrogen as a Diagnostic of Protein Feeding. J. Dairy Sci. 2004, 87, 386–398. [Google Scholar] [CrossRef]
- Spek, J.W.; Dijkstra, J.; van Duinkerken, G.; Hendriks, W.H.; Bannink, A. Prediction of urinary nitrogen and urinary urea nitrogen excretion by lactating dairy cattle in northwestern Europe and North America: A meta-analysis. J. Dairy Sci. 2013, 96, 4310–4322. [Google Scholar] [CrossRef]
- Nutrient Research Council (NRC). Nutrient Requirements of Small Ruminants: Sheep, Goats, Cervids, and New World Camelides; National Academy Press: Washington, DC, USA, 2007. [Google Scholar]
- Boe, F. Effects of Dietary Carbohydrates on Milk Production, Feed Utilization, and Feeding Behaviour of Dairy Sheep. Ph.D. Thesis, University of Sassari, Sassari, Italy, 2006. [Google Scholar]
- Baumont, R.; Dulphy, J.P.; Sauvant, D.; Meschy, F.; Aufrère, J.; Peyraud, J.L. Valeur alimentaire des fourragges et des matières premières: Tables et prévision. In Alimentation des Bovins, Ovins et Caprins; Éditions Quæ: Versailles, France, 2010; pp. 153–183. ISBN 978-2-7592-0874-6. [Google Scholar]
- Hassoun, P.; Bocquier, F. Alimentation des ovins. In Alimentation des Bovins, Ovins et Caprins; Éditions Quæ: Versailles, France, 2010; pp. 123–138. ISBN 978-2-7592-0874-6. [Google Scholar]
- Helrich, K. AOAC: Official Methods of Analysis (Volume 1), 15th ed.; Association of Official Analytical Chemists, Inc.: Arlington, VA, USA, 1990. [Google Scholar]
- Van Soest, P.J.; Robertson, J.B.; Lewis, B.A. Methods for dietary fiber, neutral detergent fiber, and nonstarch polysaccharides in relation to animal nutrition. J. Dairy Sci. 1991, 74, 3583–3597. [Google Scholar] [CrossRef]
- Licitra, G.; Hernandez, T.M.; Soest, P.J.V. Standardization of procedures for nitrogen fractionation of ruminant feeds. Anim. Feed Sci. Technol. 1996, 57, 347–358. [Google Scholar] [CrossRef]
- Martillotti, F.; Antongiovanni, M.; Rizzi, L.; Santi, E.; Bittante, G. Metodi di Analisi per la Valutazione Degli Alimenti D’impiego Zootecnico; CNR/IPRA: Milan, Italy, 1987. [Google Scholar]
- Cannas, A.; Pes, A.; Fresi, S.; Serra, F.; Pulina, G. Effects of feeding level and type of dietary protein supplement on milk urea content in ewes. In Proceedings of the Abstracts of the 48th Annual Meeting of the European Association of Animal Production, Wien, Austria, 25–28 August 1997. Poster S3.35. [Google Scholar]
- Ubertalle, A.; Fortina, R.; Battaglini, L.M.; Mimosi, A.; Profitti, M. Effect of protein degradability on urea nitrogen in sheep milk. Scienza e Tecnica Lattiero Casearia. 1998, 49, 67–81. [Google Scholar]
- Mikolayunas-Sandrock, C.; Armentano, L.E.; Thomas, D.L.; Berger, Y.M. Effect of protein degradability on milk production of dairy ewes. J. Dairy Sci. 2009, 92, 4507–4513. [Google Scholar] [CrossRef]
- Mikolayunas, C.; Thomas, D.L.; Armentano, L.E.; Berger, Y.M. Effect of rumen-undegradable protein supplementation and fresh forage composition on nitrogen utilization of dairy ewes. J. Dairy Sci. 2011, 94, 416–425. [Google Scholar] [CrossRef]
- SAS, Version 8.1; SAS Institute Inc.: Cary, NC, USA, 2000.
- Van Soest, P.J. The Nutritional Ecology of the Ruminant, 2nd ed.; Cornell University Press: Ithaca, NY, USA, 1994. [Google Scholar]
- Molle, G.; Decandia, M.; Cabiddu, A.; Landau, S.Y.; Cannas, A. An update on the nutrition of dairy sheep grazing Mediterranean pastures. Small Rumin. Res. 2008, 77, 93–112. [Google Scholar] [CrossRef]
- Cannas, A.; Boe, F.; Giovanetti, V.; Zerbini, E.; Molle, G. The rumen passage rate of forage NDF is highly associated only to the level of intake of dietary NDF. J. Dairy Sci. 2007, 90, 617. [Google Scholar]
- Witt, M.W.; Sinclair, L.A.; Wilkinson, R.G.; Buttery, P.J. The effects of synchronizing the rate of dietary energy and nitrogen supply to the rumen on milk production and metabolism of ewes. Anim. Sci. J. 2000, 71, 187–195. [Google Scholar] [CrossRef]
- Silanikove, N. The physiological basis of adaptation in goats to harsh environments. Small Rumin. Res. 2000, 35, 181–193. [Google Scholar] [CrossRef]
- Bocquier, F.; Theriez, M.; Brelurut, A. Recommandations alimentaires pour le brebis en lactation. In Alimentation des Ruminants: Révision du Système et des Tables de l’INRA Bull. Tech.; Centre de Recherches Zootechniques et Veterinaires de Theix: Ceyrat, France, 1987; pp. 199–211. [Google Scholar]
- Molle, G.; Giovanetti, V.; Cabiddu, A.; Cuccureddu, M.; Scanu, G.; Decandia, M. Milk urea as nutritional indicator in sheep grazing legume-based pastures. In Nutritional and Foraging Ecology of Sheep and Goats, Proceedings of CIHEAM/FAO/NAGREF, Zaragoza, Spain, 11–13 October 2007; Papachristou, Z.M., Parissi, H., Ben Salem, P., Morand-Fehr, P., Eds.; 2009; pp. 141–146. [Google Scholar]
- Branca, A.; Molle, G.; Sitzia, M.; Decandia, M.; Landau, S. Short-term dietary effects on reproductive wastage after induced ovulation and artificial insemination in primiparous lactating Sarda ewes. Anim. Reprod. Sci. 2000, 58, 59–71. [Google Scholar] [CrossRef]


| Item | Experiment 1 | Experiment 2 | ||
|---|---|---|---|---|
| Mid Lactation | Late Lactation | Mid Lactation | Late Lactation | |
| DIM 1 (days) | 118 ± 3 | 222 ± 3 | 119 ± 11 | 224 ± 10 |
| MY 2 (mL/day) | 1792 ± 259 | 1516 ± 311 | 1401 ± 207 | 1011 ± 349 |
| BW 3 (kg) | 43.1 ± 3.5 | 47.6 ± 4.3 | 44.6 ± 4.7 | 46.2 ± 3.4 |
| BCS 4 (0–5) | 2.3 ± 0.18 | 2.6 ± 0.15 | 2.4 ± 0.25 | 2.5 ± 0.17 |
| Age (years) | 4 ± 1 | 4 ± 1 | 5 ± 2 | 5 ± 2 |
| Parity (n.) | 3 ± 1 | 3 ± 1 | 4 ± 2 | 4 ± 2 |
| Item | Experiment 1 | Experiment 2 | |||||
|---|---|---|---|---|---|---|---|
| CF 1 | BM | BP | CC | CM | AA | SH | |
| Ingredients | |||||||
| Barley meal (% DM) | 47.0 | ||||||
| Corn flakes (% DM) | 51.6 | ||||||
| Corn meal (% DM) | 59.3 | ||||||
| Dehydrated alfalfa (% DM) | 27.0 | 28.0 | 26.0 | 26.6 | 26.7 | 89.4 | 26.2 |
| Beet pulp (% DM) | 40.9 | ||||||
| Corn cobs (% DM) | 32.5 | ||||||
| Corn germ (% DM) | 6.4 | 12.9 | 20.0 | 20.0 | |||
| Corn gluten meal (% DM) | 8.0 | 1.7 | 1.9 | 5.8 | 8.2 | 5.5 | |
| Soybean hulls (% DM) | 62.3 | ||||||
| Wheat middlings (% DM) | 6.1 | 10.0 | 5.0 | ||||
| Minerals and vitamins (% DM) | 7.0 | 7.0 | 5.1 | 5.1 | 5.8 | 5.6 | 6.0 |
| Chemical composition 2 | |||||||
| CP (% DM) | 18.7 | 18.1 | 17.9 | 19.8 | 18.0 | 19.7 | 17.5 |
| EE (% DM) | 2.7 | 3.1 | 3.3 | 4.4 | 3.0 | 2.6 | 2.5 |
| Ash (% DM) | 8.1 | 9.3 | 8.3 | 8.5 | 7.3 | 11.2 | 9.0 |
| NDF (% DM) | 28.5 | 33.2 | 44.9 | 45.8 | 23.9 | 45.6 | 51.9 |
| ADF (% DM) | 14.2 | 16.3 | 21.4 | 22.2 | 12.4 | 29.2 | 36.0 |
| ADL (% DM) | 2.8 | 3.0 | 3.3 | 3.7 | 2.1 | 6.0 | 2.8 |
| NFC (% DM) 3 | 47.3 | 41.0 | 31.8 | 26.1 | 51.2 | 25.1 | 23.6 |
| WSC (% DM) | 3.7 | 3.7 | 4.5 | 3.6 | 3.3 | 4.3 | 3.2 |
| starch (% DM) | 28.8 | 25.2 | 8.0 | 12.4 | 35.6 | 7.1 | 3.2 |
| Ca (% DM) | 1.18 | 1.42 | 1.25 | 0.88 | 0.78 | 1.62 | 1.17 |
| P (% DM) | 0.55 | 0.45 | 0.50 | 0.52 | 0.49 | 0.51 | 0.55 |
| Cl (% DM) | 0.62 | 0.64 | 0.60 | 0.64 | 0.62 | 0.96 | 0.63 |
| K (% DM) | 0.98 | 1.22 | 0.90 | 1.14 | 0.97 | 2.43 | 1.63 |
| Mg (% DM) | 0.25 | 0.30 | 0.33 | 0.31 | 0.22 | 0.30 | 0.27 |
| S (% DM) | 0.60 | 0.53 | 0.57 | 0.58 | 0.64 | 0.58 | 0.56 |
| Na (% DM) | 0.62 | 0.74 | 0.72 | 0.58 | 0.60 | 0.62 | 0.60 |
| NEL mid lactation (Mcal/kg DM) | 1.80 | 1.75 | 1.78 | 1.52 | 1.82 | 1.32 | 1.49 |
| NEL late lactation (Mcal/kg DM) | 1.88 | 1.69 | 1.73 | 1.53 | 1.76 | 1.20 | 1.44 |
| CP/NEL mid lactation | 104 | 103 | 101 | 130 | 99 | 149 | 118 |
| CP/NEL late lactation | 99 | 107 | 103 | 129 | 103 | 165 | 123 |
| Protein fractions 4 (% DM) | |||||||
| A | 2.9 | 3.5 | 3.5 | 4.4 | 3.3 | 4.7 | 3.0 |
| B1 | 1.3 | 1.7 | 1.3 | 1.3 | 0.7 | 2.4 | 1.4 |
| B2 | 9.1 | 8.2 | 6.8 | 9.5 | 10.6 | 8.4 | 8.6 |
| B3 | 3.4 | 3.2 | 4.4 | 2.9 | 1.9 | 2.7 | 2.6 |
| C | 1.9 | 1.5 | 1.8 | 1.7 | 1.5 | 1.5 | 1.9 |
| PDIN 5 (% DM) | 132 | 104 | 100 | 112 | 137 | 114 | 120 |
| PDIE 6 (% DM) | 137 | 106 | 107 | 109 | 147 | 94 | 129 |
| Item 2 | Experiment 1 | Experiment 2 | |||||||||||||
|---|---|---|---|---|---|---|---|---|---|---|---|---|---|---|---|
| Mid Lactation | Late Lactation | Mid Lactation | Late Lactation | ||||||||||||
| CF 1 | BM | BP | CC | CF | BM | BP | CC | CM | AA | SH | CM | AA | SH | ||
| DMI (g/day) | Mean | 1870 | 1849 | 2055 | 2602 | 1295 | 1752 | 1992 | 2182 | 1717 | 2196 | 2634 | 890 | 1903 | 1603 |
| Min | 1262 | 1674 | 1585 | 2159 | 1192 | 1024 | 1701 | 1863 | 1413 | 1933 | 2136 | 582 | 1701 | 1230 | |
| Max | 2401 | 2238 | 2588 | 3392 | 1367 | 2423 | 2386 | 2548 | 2096 | 2438 | 3175 | 1211 | 2148 | 1879 | |
| CPI (g/day) | Mean | 349 | 334 | 367 | 516 | 241 | 317 | 356 | 433 | 310 | 432 | 461 | 160 | 375 | 280 |
| Min | 235 | 302 | 283 | 428 | 222 | 185 | 304 | 369 | 255 | 381 | 374 | 105 | 335 | 215 | |
| Max | 448 | 405 | 463 | 673 | 255 | 438 | 427 | 506 | 378 | 480 | 556 | 218 | 423 | 329 | |
| NELI (Mcal/day) | Mean | 3.37 | 3.23 | 3.65 | 3.96 | 2.43 | 2.97 | 3.46 | 3.34 | 3.13 | 2.91 | 3.93 | 1.56 | 2.27 | 2.28 |
| Min | 2.24 | 2.97 | 2.89 | 3.29 | 2.25 | 1.66 | 2.93 | 2.84 | 2.59 | 2.53 | 3.38 | 1.11 | 1.98 | 2.05 | |
| Max | 4.42 | 3.90 | 4.56 | 5.13 | 2.61 | 4.10 | 4.20 | 3.86 | 3.82 | 3.27 | 4.68 | 2.27 | 2.48 | 2.50 | |
| PDIN balance (g/day) 3 | Mean | 63.1 | 27.7 | 33.1 | 130.9 | 60.7 | 48.7 | 70.3 | 122.1 | 89.2 | 117.9 | 140.7 | −31.2 | 112.5 | 81.4 |
| Min | 36.7 | −9.5 | 16.6 | 104.0 | 40.1 | 10.2 | 31.3 | 76.6 | 52.6 | 99.1 | 124.5 | −25.5 | 75.8 | −19.1 | |
| Max | 95.6 | 48.6 | 48.9 | 178.0 | 92.4 | 92.6 | 103.7 | 104.1 | 136.3 | 152.7 | 164.8 | 102.6 | 125.5 | 115.9 | |
| PDIN balance (%) 4 | Mean | 33.7 | 18.3 | 18.9 | 80.5 | 61.0 | 34.8 | 60.4 | 103.5 | 64.4 | 91.1 | 84.1 | 48.3 | 116.0 | 79.1 |
| Min | 26.6 | −4.6 | 11.7 | 72.6 | 29.6 | 10.6 | 20.5 | 57.8 | 37.4 | 60.9 | 63.0 | −22.4 | 57.0 | 14.8 | |
| Max | 43.3 | 27.1 | 23.5 | 87.7 | 107.6 | 58.1 | 111.9 | 160.7 | 107.3 | 121.9 | 122.4 | 163.3 | 163.3 | 138.7 | |
| Milk (g/day) | Mean | 1678 | 1393 | 1541 | 1445 | 728 | 934 | 990 | 899 | 1181 | 1075 | 1584 | 498 | 732 | 746 |
| Min | 880 | 939 | 1084 | 1072 | 393 | 643 | 343 | 503 | 813 | 864 | 1052 | 249 | 386 | 422 | |
| Max | 2235 | 2133 | 1897 | 1782 | 1098 | 1218 | 1372 | 1242 | 1498 | 1450 | 2405 | 928 | 1126 | 986 | |
| Fat (%) | Mean | 4.0 | 4.3 | 4.5 | 6.0 | 4.2 | 4.9 | 4.7 | 6.0 | 4.3 | 6.4 | 5.6 | 4.9 | 4.8 | 6.0 |
| Min | 3.3 | 3.7 | 3.8 | 4.0 | 3.9 | 4.1 | 3.7 | 4.9 | 3.1 | 5.5 | 5.0 | 3.6 | 4.2 | 3.8 | |
| Max | 5.1 | 5.3 | 5.4 | 7.7 | 4.8 | 5.4 | 5.6 | 7.0 | 6.1 | 7.9 | 7.1 | 6.6 | 5.1 | 8.0 | |
| Protein (%) | Mean | 5.1 | 5.4 | 5.1 | 4.9 | 5.4 | 5.7 | 5.3 | 5.2 | 5.3 | 5.0 | 5.0 | 5.8 | 4.8 | 5.4 |
| Min | 4.7 | 4.7 | 4.8 | 4.1 | 4.8 | 5.1 | 4.5 | 4.4 | 4.2 | 4.5 | 4.7 | 3.9 | 4.6 | 4.8 | |
| Max | 6.0 | 6.0 | 5.5 | 6.0 | 6.0 | 6.2 | 6.3 | 6.9 | 7.1 | 5.8 | 5.9 | 6.9 | 5.4 | 6.6 | |
| Lactose (%) | Mean | 5.1 | 5.0 | 4.9 | 4.8 | 4.4 | 4.8 | 4.5 | 4.6 | 4.4 | 4.6 | 4.7 | 3.5 | 4.3 | 4.3 |
| Min | 4.8 | 4.8 | 4.8 | 4.7 | 4.2 | 4.5 | 4.0 | 4.2 | 4.0 | 4.5 | 4.2 | 2.8 | 3.5 | 3.8 | |
| Max | 5.3 | 5.2 | 5.1 | 5.0 | 4.8 | 5.1 | 4.8 | 5.1 | 4.9 | 4.9 | 5.1 | 4.4 | 5.0 | 4.7 | |
| MUC (mg/dL) | Mean | 33.5 | 36.2 | 34.7 | 48.4 | 38.4 | 46.1 | 38.8 | 44.9 | 33.3 | 57.2 | 43.5 | 37.7 | 72.8 | 57.9 |
| Min | 27.6 | 30.2 | 30.4 | 37.8 | 30.8 | 39.4 | 31.4 | 35.7 | 23.0 | 43.7 | 39.8 | 28.5 | 57.1 | 52.2 | |
| Max | 42.6 | 46.8 | 40.8 | 55.5 | 43.7 | 50.7 | 48.5 | 51.0 | 44.8 | 67.5 | 51.3 | 44.1 | 81.5 | 67.8 | |
| X 2 | Intercept | Slope | Whole Equation 1 | |||||||
|---|---|---|---|---|---|---|---|---|---|---|
| B0 | s.e. | p < | C0 | s.e. | p < | rmse 5 | CV 6 | R 2 | p < | |
| CP (% DM) | −68.4 | 61.6 | 0.29 | 6.1 | 3.3 | 0.09 | 10.46 | 23.5 | 0.15 | 0.09 |
| A (% DM) | 4.16 | 14.5 | 0.77 | 11.1 | 3.9 | 0.01 | 9.19 | 20.6 | 0.35 | 0.015 |
| B1 (% DM) | 19.7 | 7.1 | 0.02 | 17.1 | 4.7 | 0.003 | 8.14 | 18.3 | 0.49 | 0.003 |
| A+B1 (% DM) | 1.3 | 11.1 | 0.91 | 8.5 | 2.1 | 0.002 | 7.79 | 17.5 | 0.53 | 0.001 |
| NDF (% DM) | 19.3 | 10.7 | 0.09 | 0.6 | 0.3 | 0.03 | 9.70 | 21.8 | 0.27 | 0.03 |
| ADF (% DM) | 23.9 | 6.8 | 0.004 | 0.9 | 0.3 | 0.007 | 8.68 | 14.5 | 0.42 | 0.007 |
| ADL (% DM) | 19.6 | 6.1 | 0.007 | 7.4 | 1.7 | 0.001 | 0.61 | 16.7 | 0.57 | 0.001 |
| NFC (% DM) | 68.9 | 8.2 | 0.001 | −0.7 | 0.2 | 0.009 | 8.85 | 19.9 | 0.39 | 0.009 |
| starch (% DM) | 58.9 | 5.3 | 0.001 | −0.6 | 0.2 | 0.01 | 8.88 | 19.9 | 0.39 | 0.01 |
| NFCI (g/day) | 76.1 | 11.2 | 0.001 | −0.05 | 0.02 | 0.01 | 9.09 | 20.4 | 0.36 | 0.01 |
| starchI (g/day) | 64.5 | 5.9 | 0.001 | −0.05 | 0.01 | 0.003 | 8.19 | 19.4 | 0.48 | 0.003 |
| NEL (Mcal/kg DM) | 127.6 | 9.6 | 0.001 | −51.2 | 5.8 | 0.001 | 4.36 | 9.8 | 0.85 | 0.001 |
| CP/NEL (g/Mcal) | −14.9 | 7.4 | 0.07 | 0.5 | 0.06 | 0.001 | 4.63 | 10.4 | 0.83 | 0.001 |
| PDIN balance (g/day) 3 | 32.2 | 6.4 | 0.001 | 0.15 | 0.07 | 0.056 | 10.10 | 22.6 | 0.27 | 0.056 |
| PDIN balance (%) 4 | 26.9 | 5.1 | 0.001 | 0.28 | 0.07 | 0.003 | 7.99 | 17.96 | 0.54 | 0.003 |
| X 2 | Intercept | Slope | Whole Equation 1 | |||||||
|---|---|---|---|---|---|---|---|---|---|---|
| A0 | s.e. | p < | B0 | s.e. | p < | rmse 3 | CV 4 | R 2 | p < | |
| CP (% DM) | −25.3 | 7.5 | 0.01 | 3.9 | 0.4 | 0.001 | 7.35 | 15.97 | 0.68 | 0.001 |
| CP Exp (% DM) | −20.7 | 8.6 | 0.05 | 3.7 | 0.5 | 0.001 | 4.89 | 10.62 | 0.82 | 0.001 |
| NDF (% DM) | 43.1 | 11.7 | 0.001 | 0.07 | 0.3 | 0.79 | 13.11 | 28.5 | 0.001 | 0.79 |
| NDF Exp (% DM) | 32.3 | 9.2 | 0.009 | 0.4 | 0.2 | 0.07 | 5.60 | 12.2 | 0.64 | 0.001 |
| NFC (% DM) | 68.2 | 7.6 | 0.001 | −0.6 | 0.2 | 0.006 | 9.98 | 21.50 | 0.22 | 0.006 |
| NFC Exp (% DM) | 69.75 | 6.9 | 0.001 | −0.6 | 0.2 | 0.001 | 4.89 | 10.52 | 0.56 | 0.001 |
| NEL (Mcal/kg DM) | 145.5 | 16.7 | 0.001 | −62.4 | 10.4 | 0.001 | 9.64 | 21.00 | 0.46 | 0.001 |
| NEL Exp (Mcal/kg DM) | 124.1 | 16.2 | 0.001 | −48.5 | 10.1 | 0.001 | 5.46 | 11.84 | 0.73 | 0.001 |
| CP/NEL (g/Mcal) | −15.1 | 3.6 | 0.001 | 0.5 | 0.03 | 0.001 | 4.56 | 9.90 | 0.88 | 0.001 |
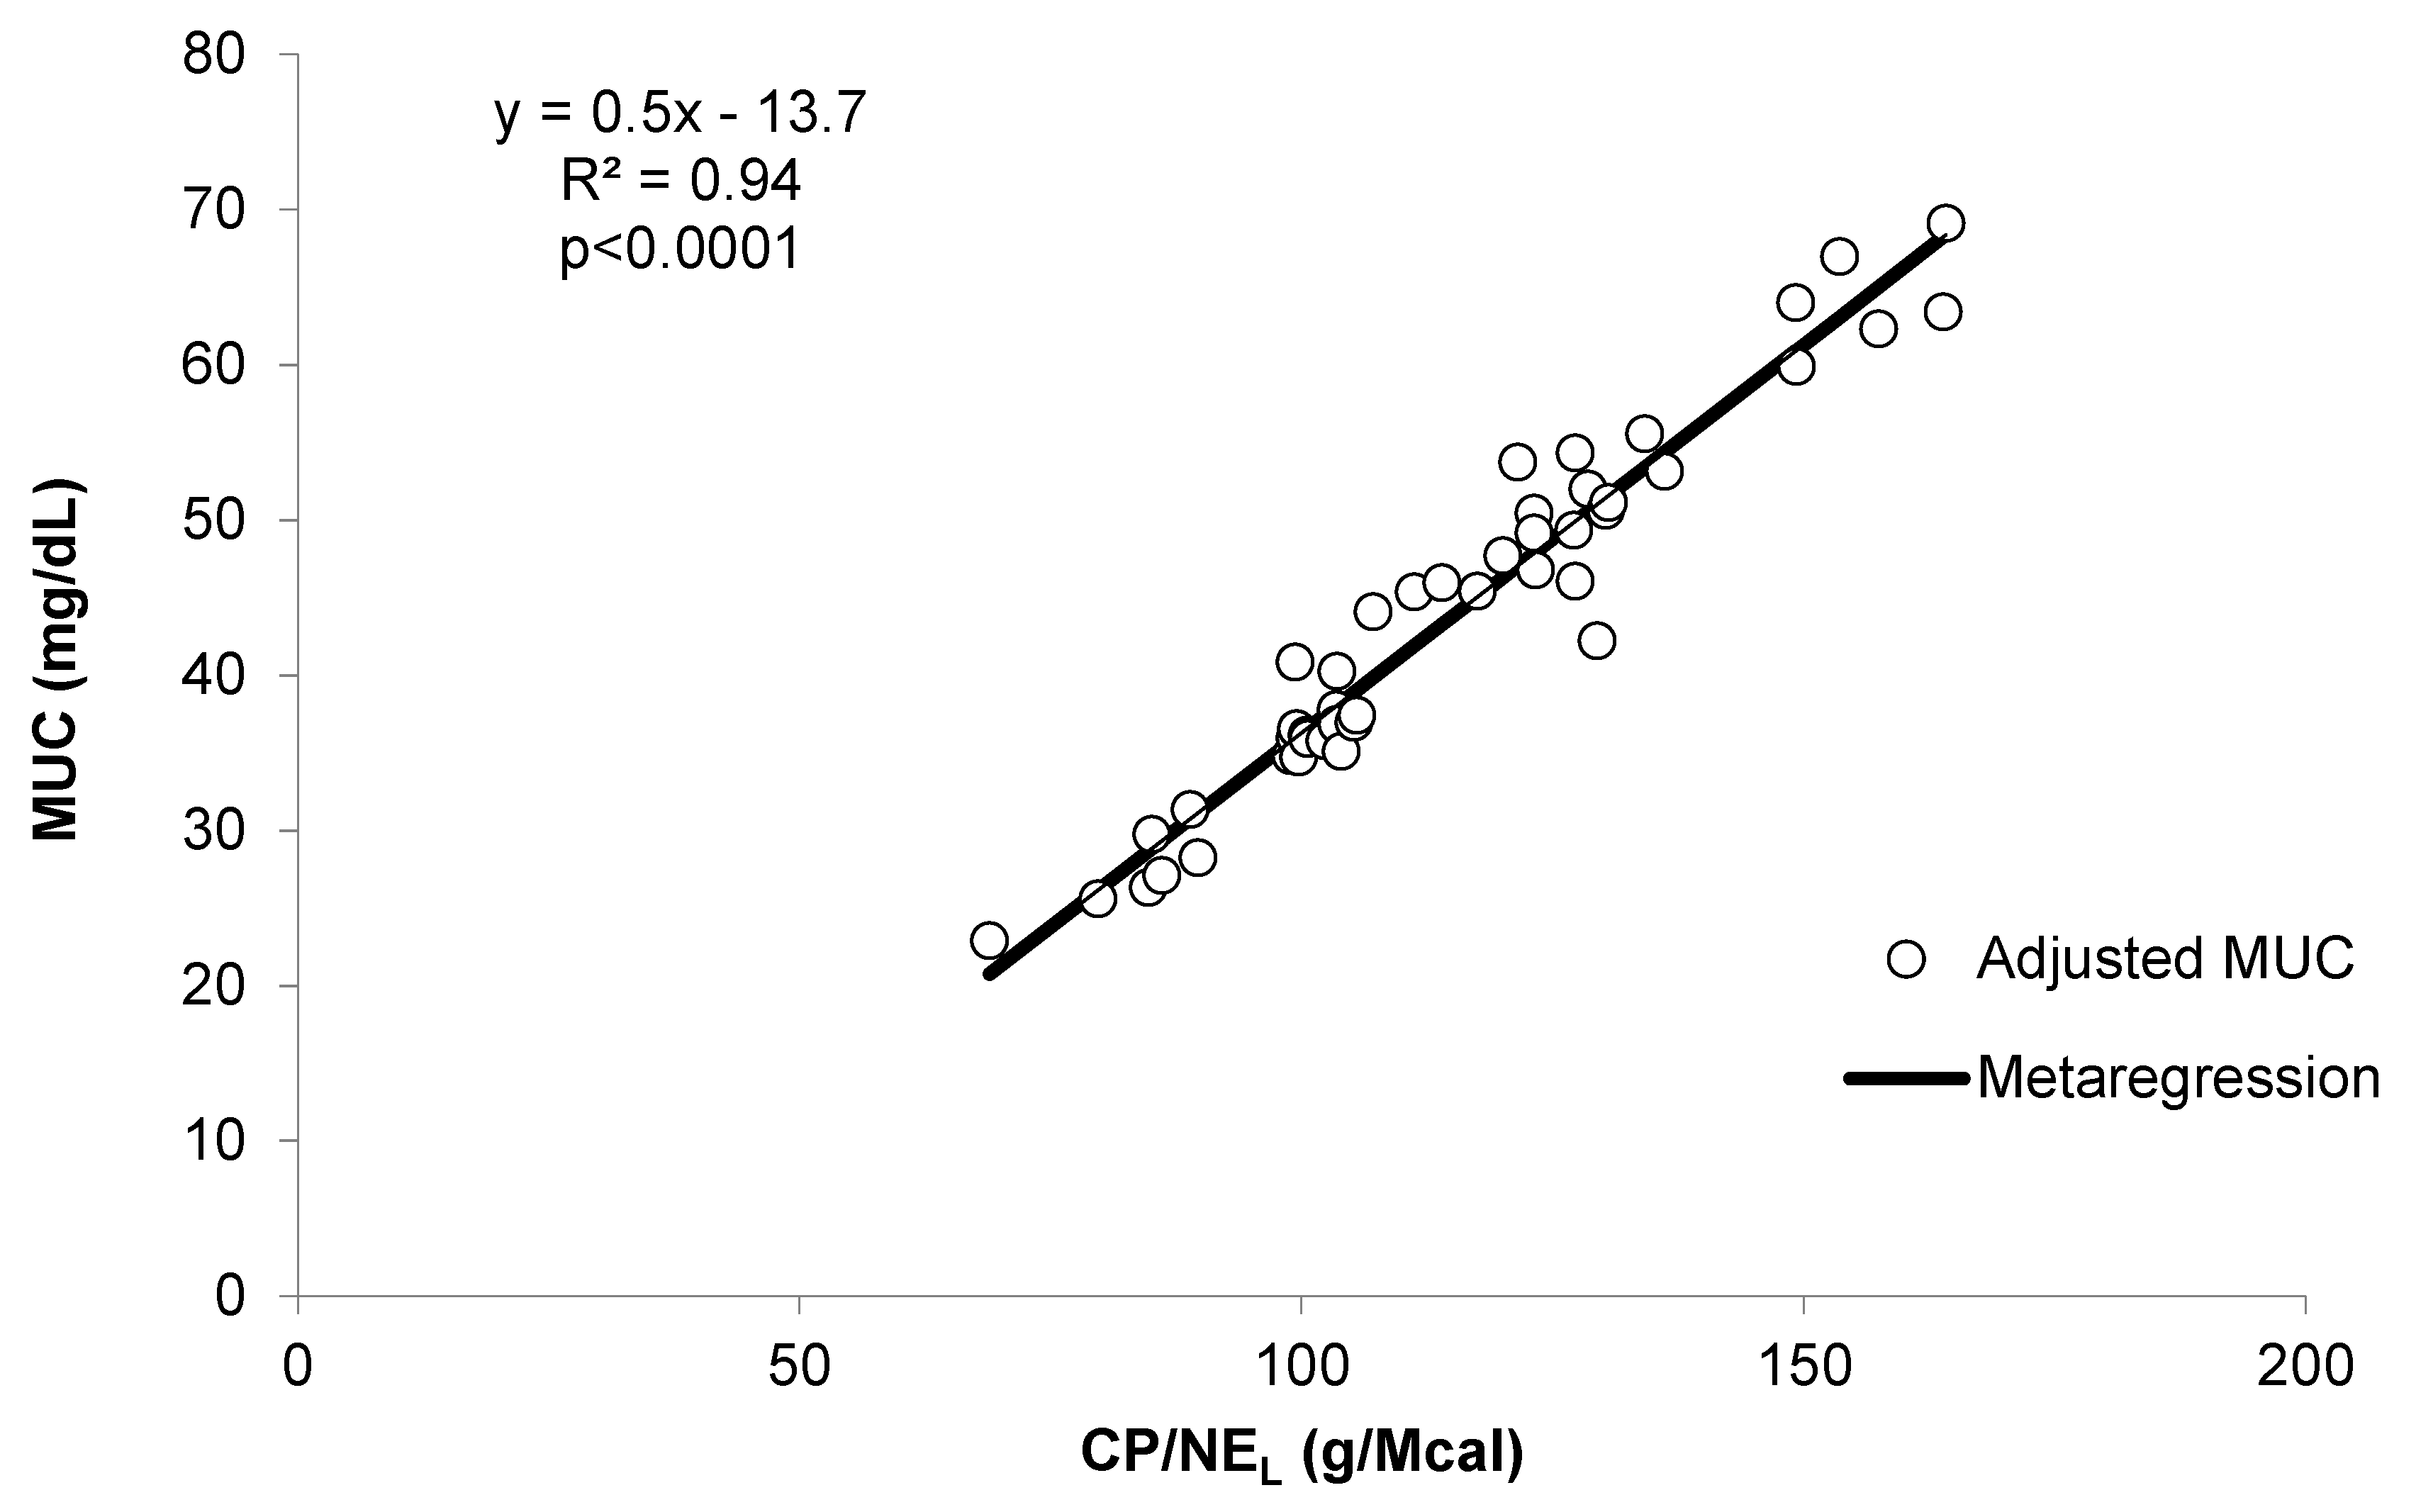
| CP/NEL Exp (g/Mcal) | −13.7 | 4.2 | 0.014 | 0.5 | 0.03 | 0.001 | 3.30 | 7.17 | 0.93 | 0.001 |
| CPI (g/day) | 23.9 | 6.5 | 0.001 | 0.05 | 0.01 | 0.001 | 11.54 | 25.06 | 0.23 | 0.001 |
| CPI Exp (g/day) | 17.8 | 6.9 | 0.03 | 0.07 | 0.01 | 0.001 | 5.24 | 11.38 | 0.76 | 0.001 |
| Dietary NEL (Mcal/kg DM) | Dietary CP (g/kg DM) | ||||||||
|---|---|---|---|---|---|---|---|---|---|
| 120 | 130 | 140 | 150 | 160 | 170 | 180 | 190 | 200 | |
| 1.2 | 36 | 40 | 45 | 49 | 53 | 57 | 61 | 65 | 70 |
| 1.3 | 32 | 36 | 40 | 44 | 48 | 52 | 56 | 59 | 63 |
| 1.4 | 30 | 33 | 36 | 40 | 43 | 47 | 51 | 54 | 58 |
| 1.5 | 27 | 30 | 33 | 36 | 40 | 43 | 46 | 50 | 53 |
| 1.6 | 25 | 27 | 30 | 33 | 36 | 39 | 43 | 46 | 49 |
| 1.7 | 22 | 25 | 27 | 30 | 33 | 36 | 39 | 42 | 45 |
© 2019 by the authors. Licensee MDPI, Basel, Switzerland. This article is an open access article distributed under the terms and conditions of the Creative Commons Attribution (CC BY) license (http://creativecommons.org/licenses/by/4.0/).
Share and Cite
Giovanetti, V.; Boe, F.; Decandia, M.; Bomboi, G.C.; Atzori, A.S.; Cannas, A.; Molle, G. Milk Urea Concentration in Dairy Sheep: Accounting for Dietary Energy Concentration. Animals 2019, 9, 1118. https://doi.org/10.3390/ani9121118
Giovanetti V, Boe F, Decandia M, Bomboi GC, Atzori AS, Cannas A, Molle G. Milk Urea Concentration in Dairy Sheep: Accounting for Dietary Energy Concentration. Animals. 2019; 9(12):1118. https://doi.org/10.3390/ani9121118
Chicago/Turabian StyleGiovanetti, Valeria, Filippo Boe, Mauro Decandia, Giovanni Cristoforo Bomboi, Alberto Stanislao Atzori, Antonello Cannas, and Giovanni Molle. 2019. "Milk Urea Concentration in Dairy Sheep: Accounting for Dietary Energy Concentration" Animals 9, no. 12: 1118. https://doi.org/10.3390/ani9121118
APA StyleGiovanetti, V., Boe, F., Decandia, M., Bomboi, G. C., Atzori, A. S., Cannas, A., & Molle, G. (2019). Milk Urea Concentration in Dairy Sheep: Accounting for Dietary Energy Concentration. Animals, 9(12), 1118. https://doi.org/10.3390/ani9121118