Association of Polymorphisms in Candidate Genes with the Litter Size in Two Sheep Breeds

Simple Summary
Abstract
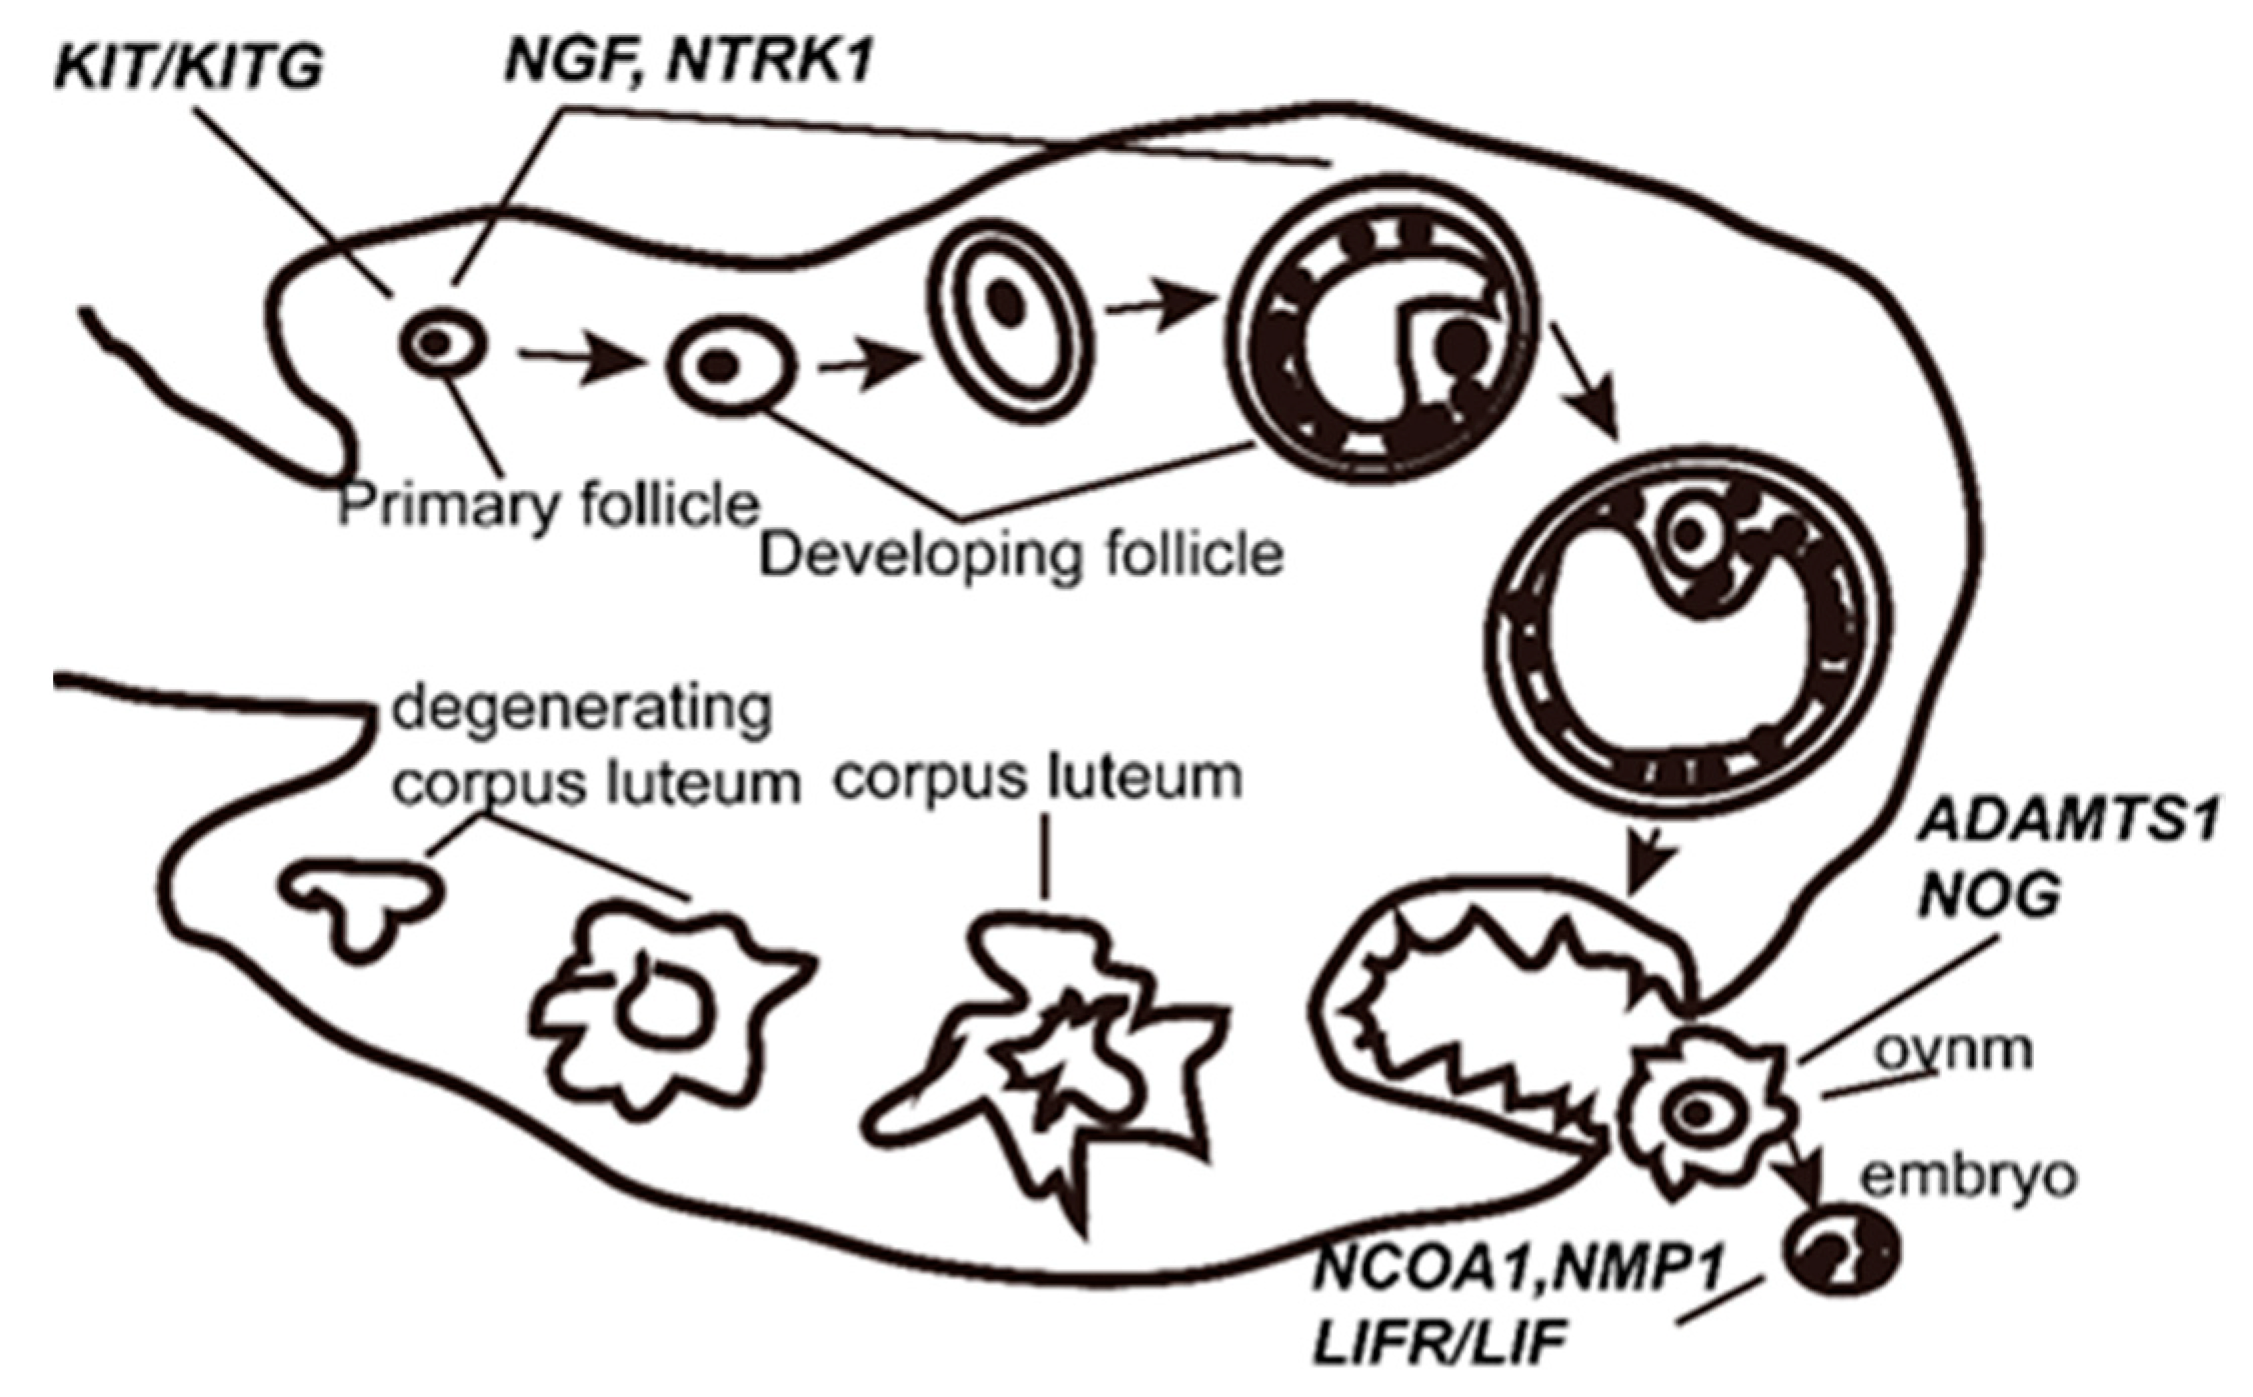
1. Introduction
2. Materials and Methods
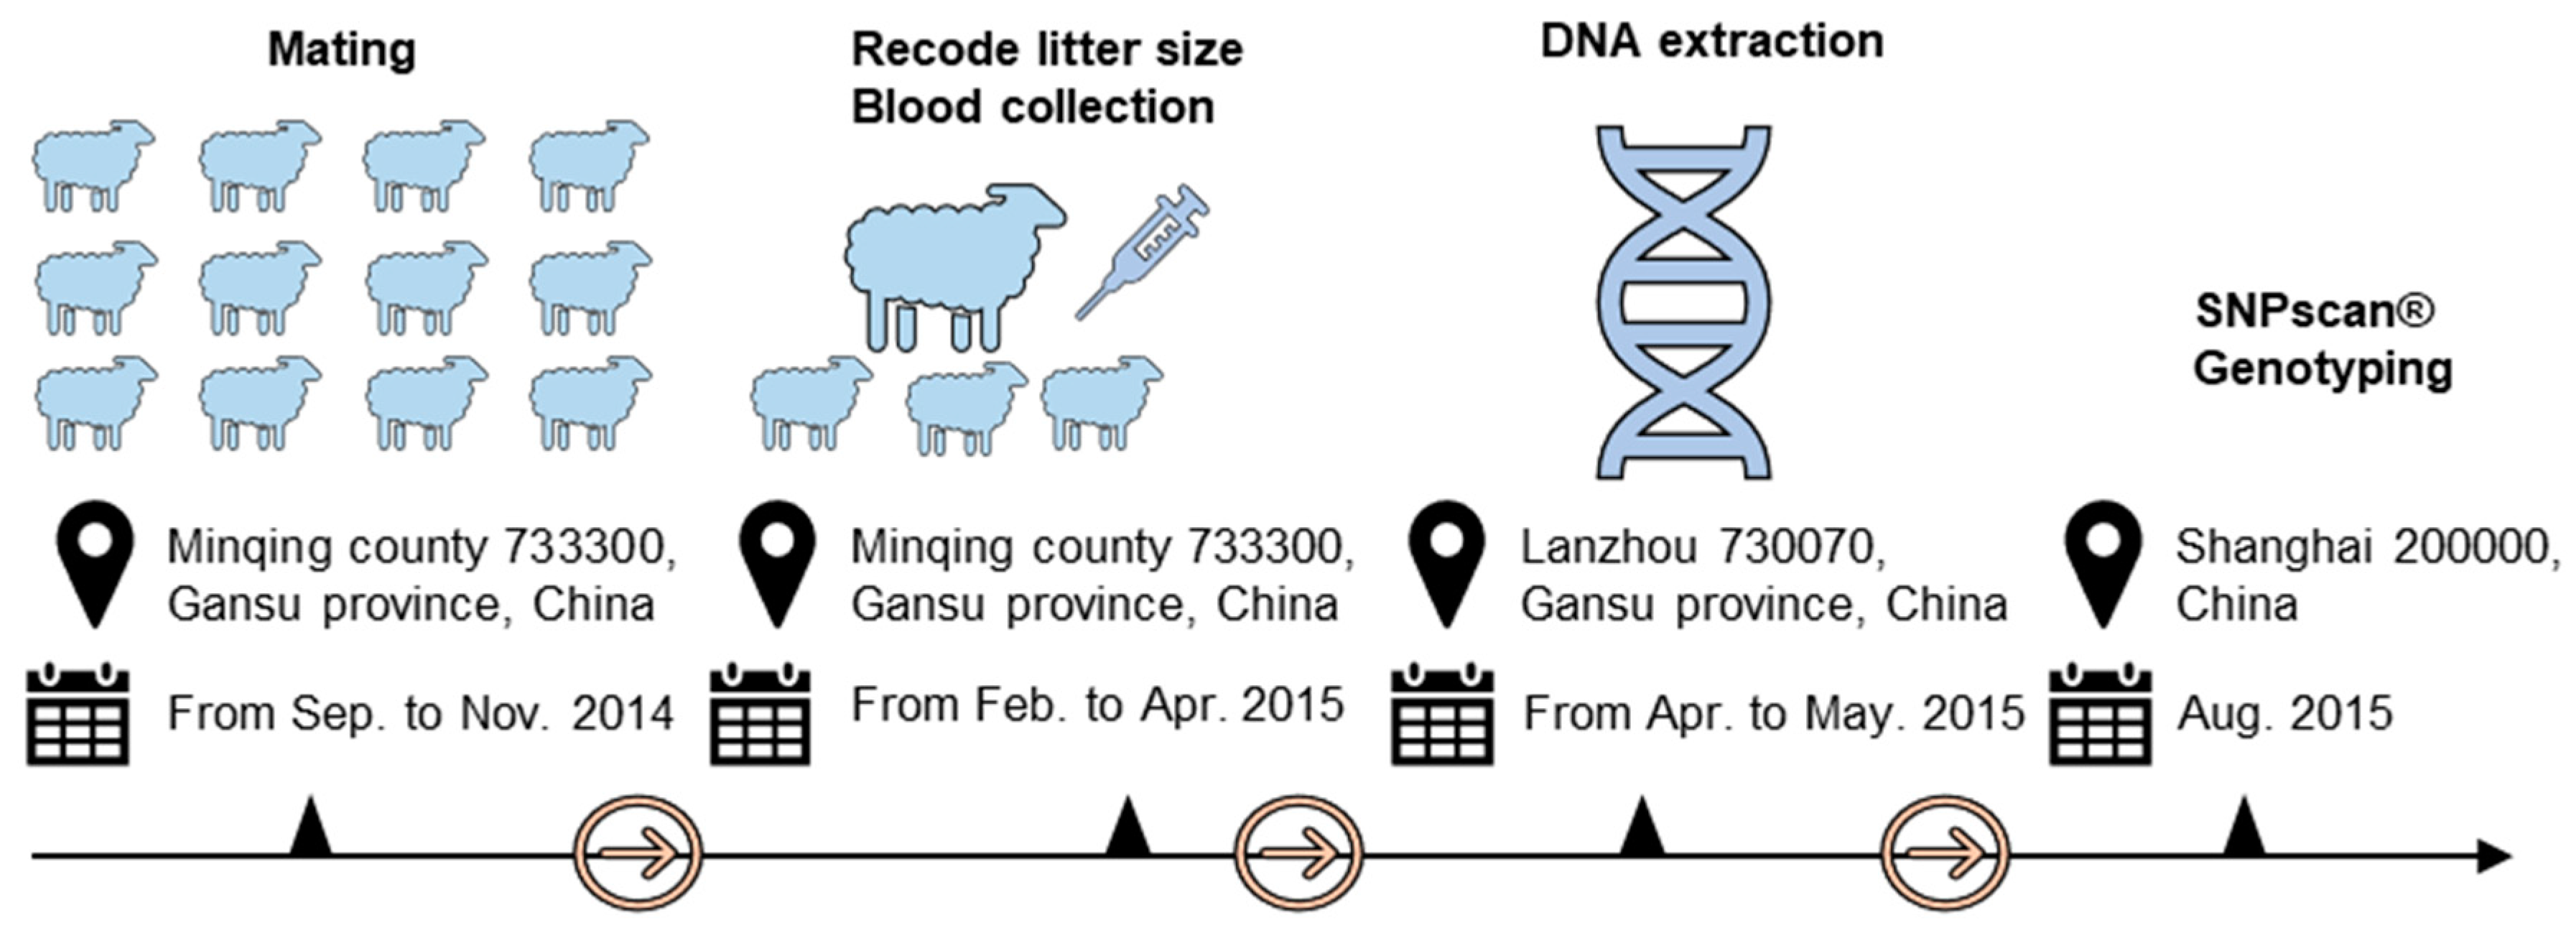
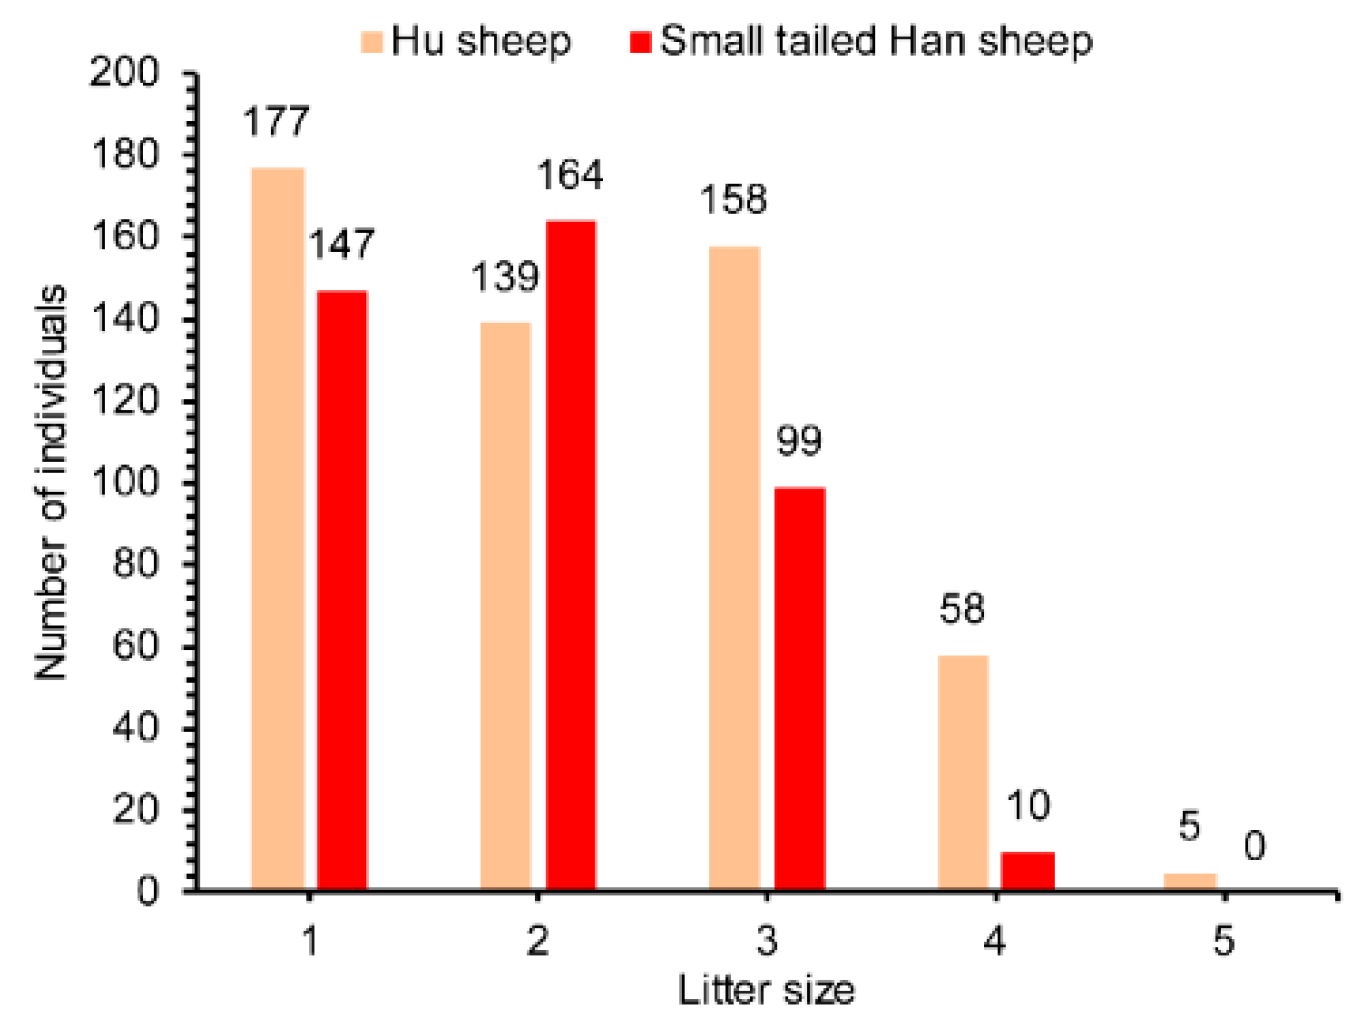
2.1. Phenotypic Data Collection and DNA Extraction
2.2. Single Nucleotide Polymorphism Detection and Genotyping
2.3. Population Parameter Calculation and Quality Control
2.4. Single Nucleotide Polymorphism Association Analysis
2.5. The Haplotype Analysis
3. Results
3.1. Genotyping and Quality Control
3.2. Population Genetic Parameters
3.3. Single Nucleotide Polymorphisms Associated with Litter Size
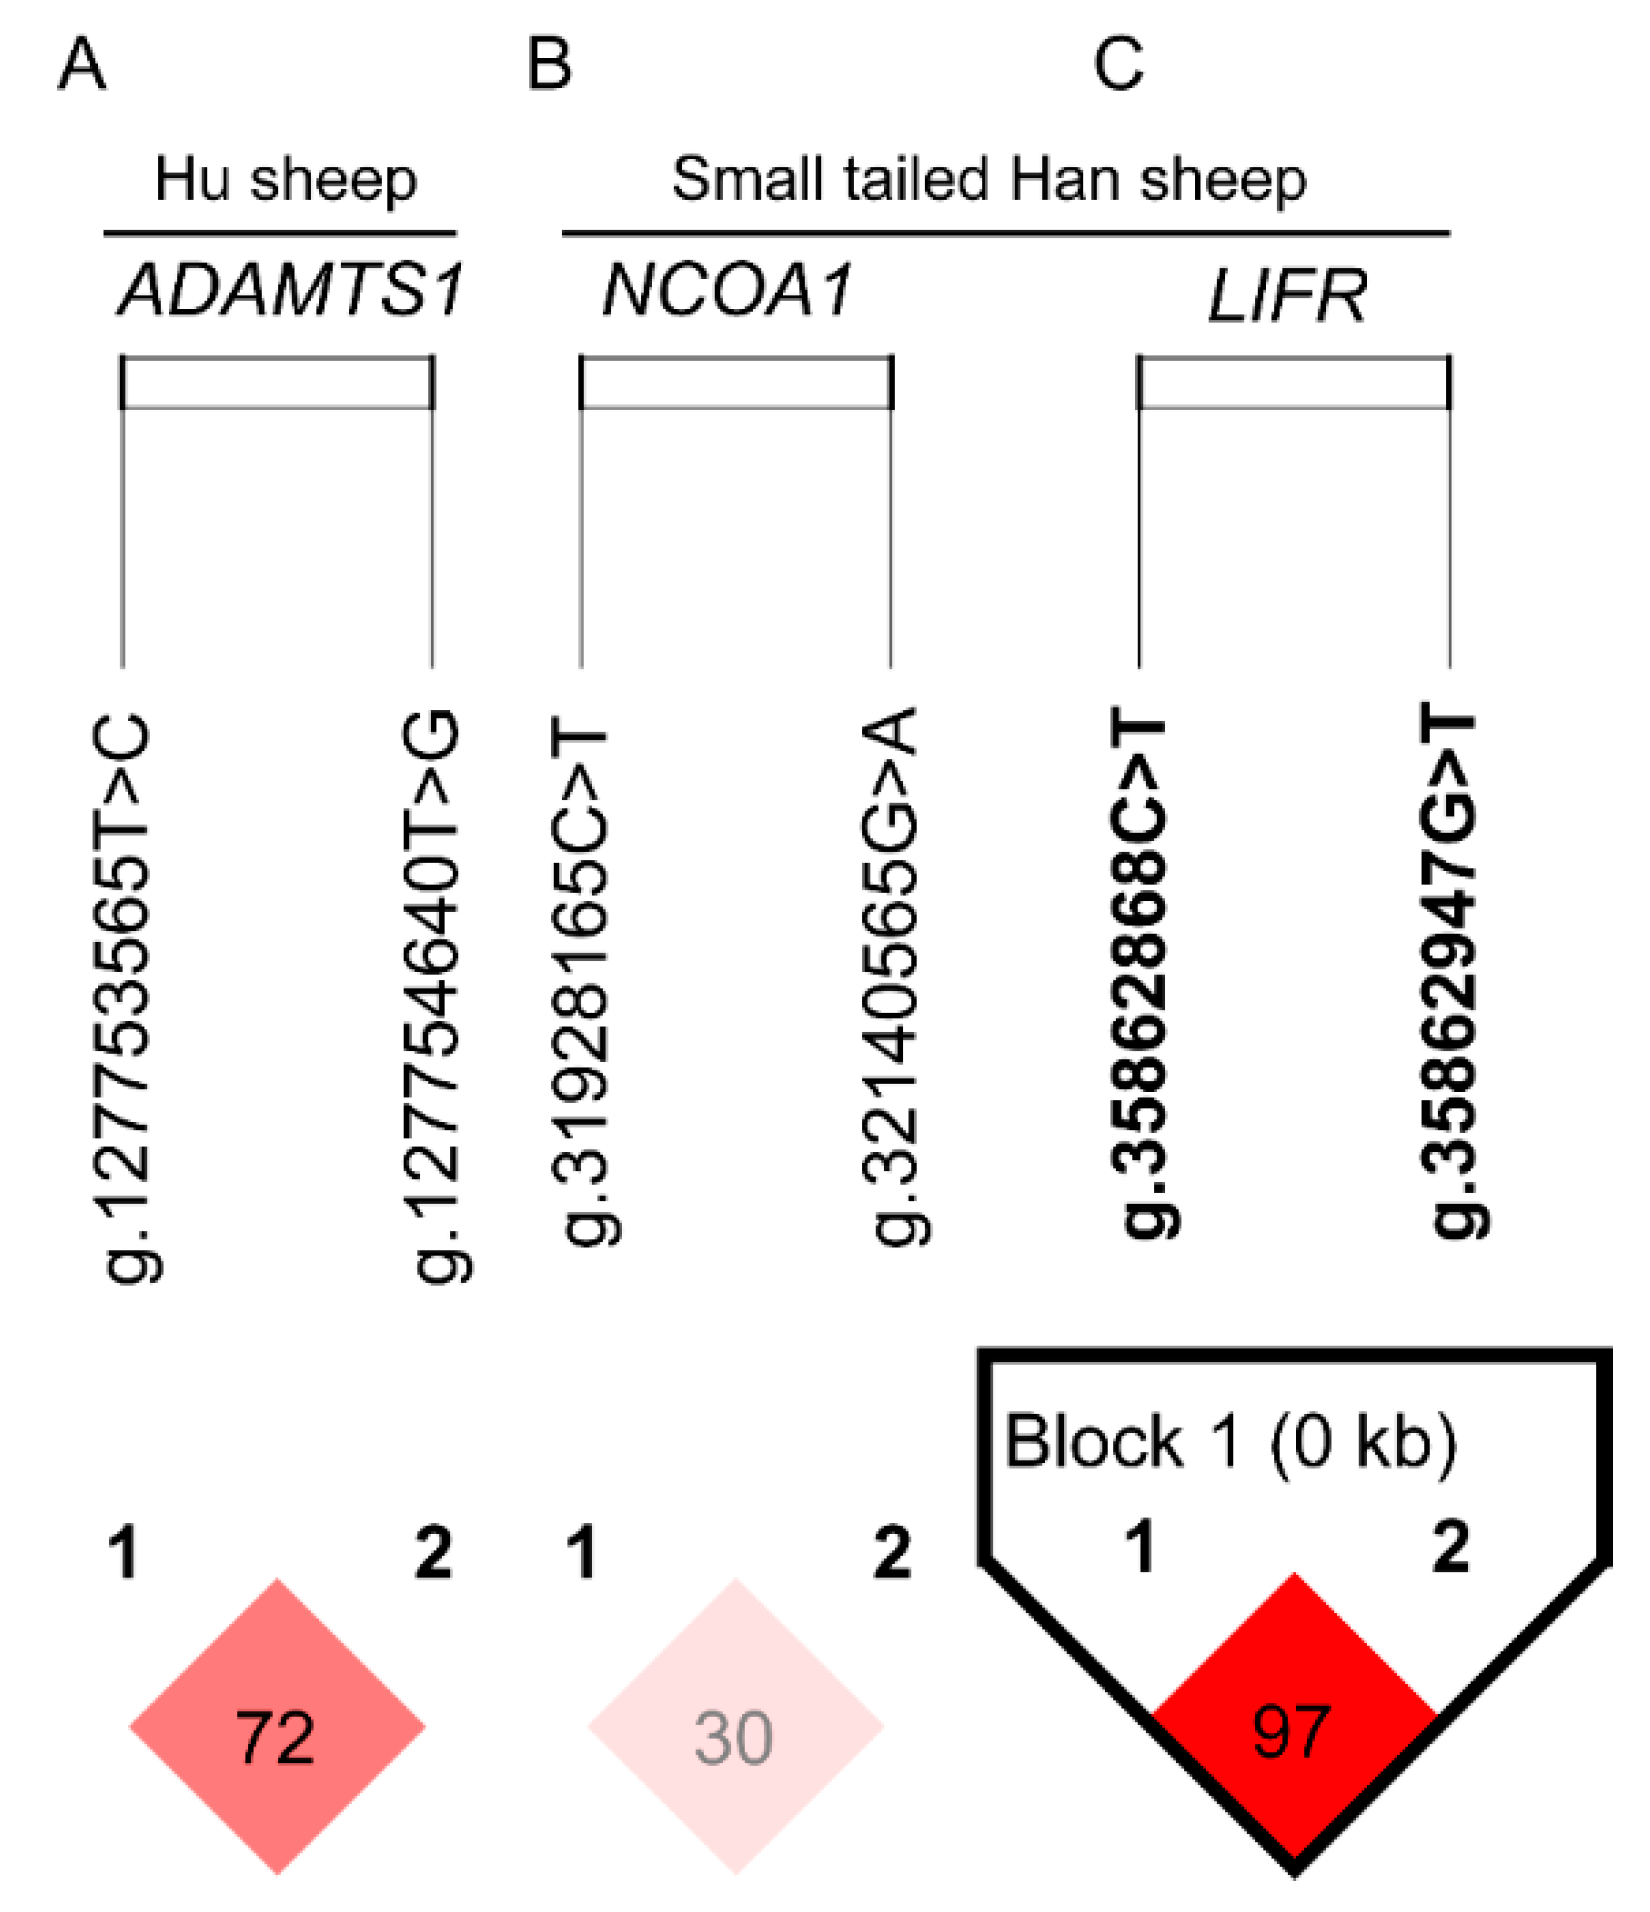
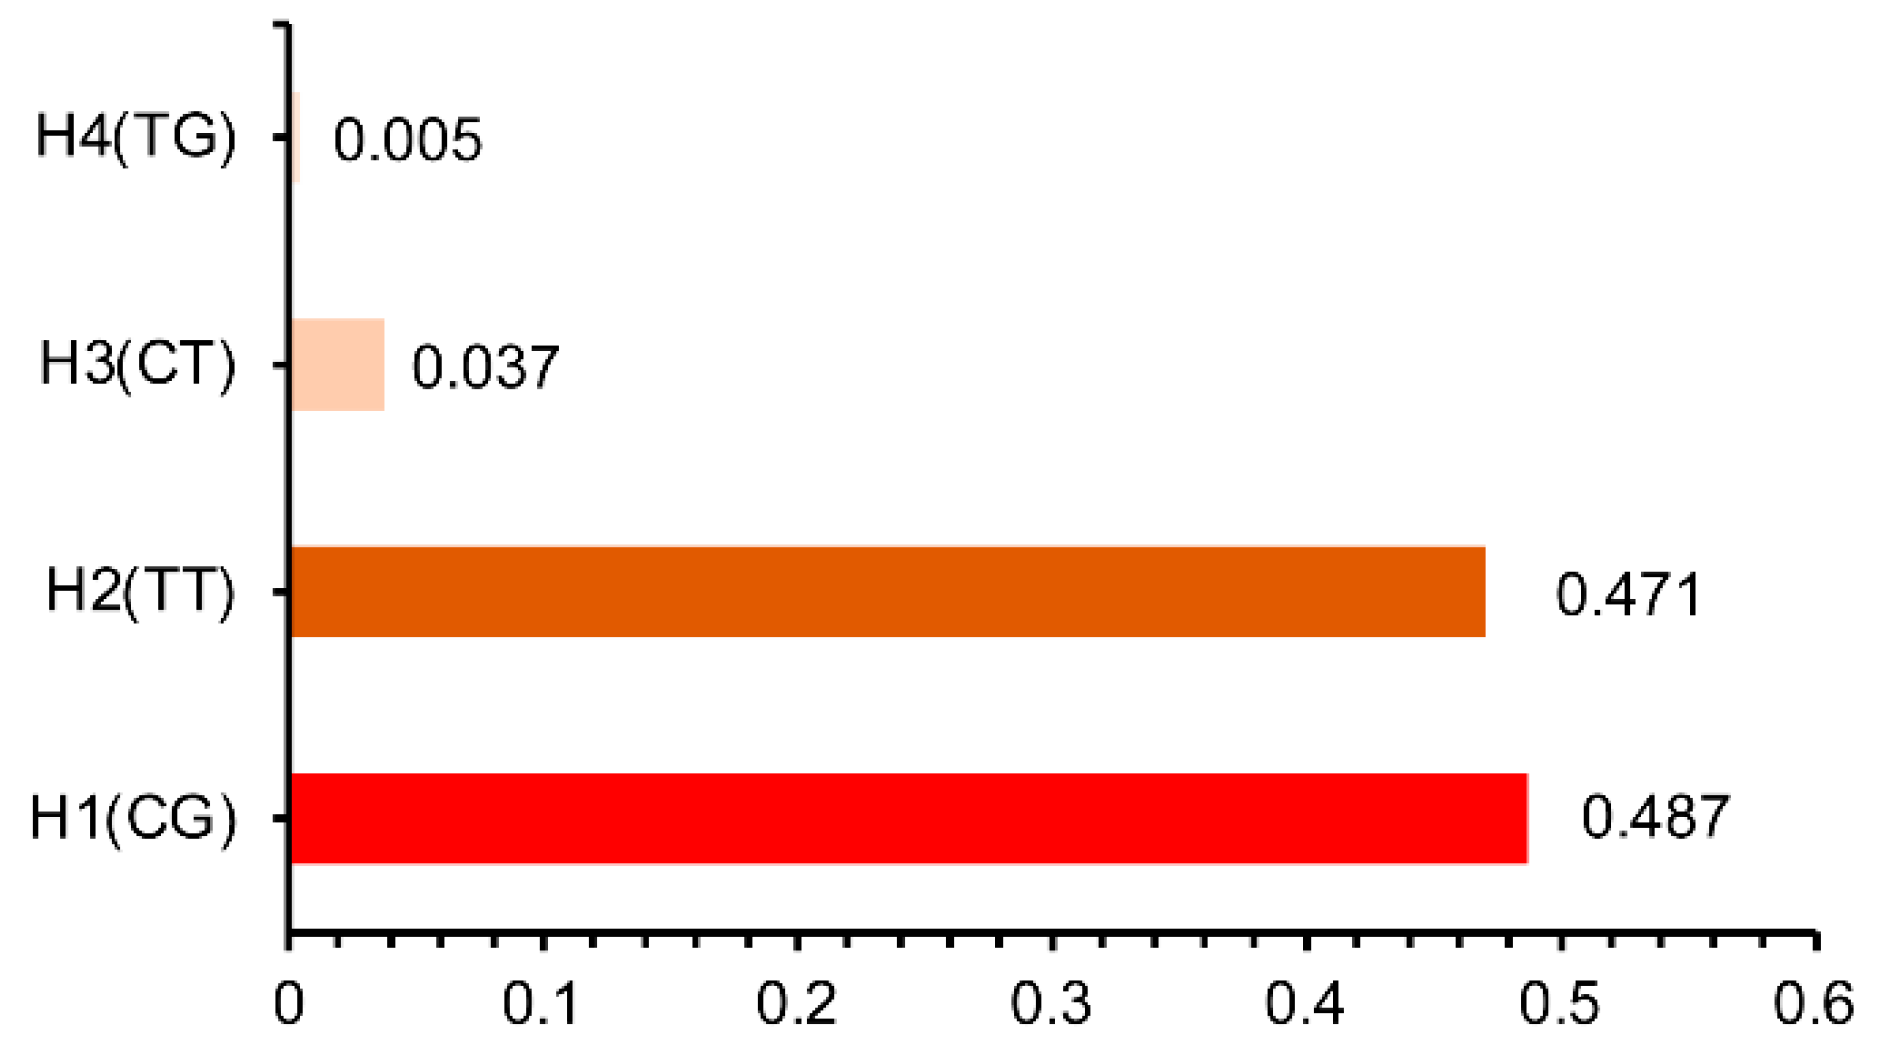
3.4. The Haplotype Analysis
4. Discussion
5. Conclusions
Supplementary Materials
Author Contributions
Funding
Acknowledgments
Conflicts of Interest
References
- Haresign, W. The physiological basis for variation in ovulation rate and litter size in sheep: A review. Livest. Prod. Sci. 1985, 13, 3–20. [Google Scholar] [CrossRef]
- Hutt, K.; McLaughlin, E.; Holland, M.; McLaughlin, E. Kit ligand and c-Kit have diverse roles during mammalian oogenesis and folliculogenesis. Mol. Hum. Reprod. 2006, 12, 61–69. [Google Scholar] [CrossRef] [PubMed]
- Driancourt, M.; Reynaud, K.; Cortvrindt, R.; Smitz, J. Roles of KIT and KIT LIGAND in ovarian function. Rev. Reprod. 2000, 5, 143–152. [Google Scholar] [CrossRef] [PubMed]
- Knapczyk-Stwora, K.; Grzesiak, M.; Duda, M.; Koziorowski, M.; Slomczynska, M. Effect of flutamide on folliculogenesis in the fetal porcine ovary—Regulation by Kit ligand/c-Kit and IGF1/IGF1R systems. Anim. Reprod. Sci. 2013, 142, 160–167. [Google Scholar] [CrossRef]
- Dissen, G.A.; Romero, C.; Hirshfield, A.N.; Ojeda, S.R. Nerve Growth Factor Is Required for Early Follicular Development in the Mammalian Ovary. Endocrinology 2001, 142, 2078–2086. [Google Scholar] [CrossRef]
- Chaves, R.; Alves, A.; Duarte, A.; Araújo, V.; Celestino, J.; Matos, M.; Lopes, C.; Campello, C.; Name, K.; Báo, S.; et al. Nerve Growth Factor Promotes the Survival of Goat Preantral Follicles Cultured in vitro. Cells Tissues Organs 2010, 192, 272–282. [Google Scholar] [CrossRef]
- Chaves, R.N.; Alves, A.M.; Lima, L.F.; Matos, H.M.; Rodrigues, A.P.; Figueiredo, J.R. Role of nerve growth factor (NGF) and its receptors in folliculogenesis. Zygote 2013, 21, 187–197. [Google Scholar] [CrossRef]
- Mayerhofer, A.; Dissen, G.A.; Parrott, J.A.; Hill, D.F.; Mayerhofer, D.; Garfield, R.E.; Costa, M.E.; Skinner, M.K.; Ojeda, S.R. Involvement of nerve growth factor in the ovulatory cascade: Trka receptor activation inhibits gap junctional communication between thecal cells. Endocrinology 1996, 137, 5662–5670. [Google Scholar] [CrossRef]
- An, X.P.; Hou, J.X.; Gao, T.Y.; Cao, B.Y. Cloning and expression of caprine KIT gene and associations of polymorphisms with litter size. Anim. Prod. Sci. 2016, 56, 1579–1584. [Google Scholar] [CrossRef]
- An, X.P.; Hou, J.X.; Li, G.; Song, Y.X.; Wang, J.G.; Chen, Q.J.; Cui, Y.H.; Wang, Y.F.; Cao, B.Y. Polymorphism identification in the goat KITLG gene and association analysis with litter size. Anim. Genet. 2012, 43, 104–107. [Google Scholar] [CrossRef]
- An, X.P.; Hou, J.X.; Gao, T.Y.; Lei, Y.N.; Song, Y.X.; Wang, J.G.; Cao, B.Y. Association analysis between variants in KITLG gene and litter size in goats. Gene 2015, 558, 126–130. [Google Scholar] [CrossRef] [PubMed]
- An, X.P.; Hou, J.X.; Lei, Y.N.; Gao, T.Y.; Song, Y.X.; Wang, J.G.; Cao, B.Y. Two mutations in the 5′-flanking region of the KITLG gene are associated with litter size of dairy goats. Anim. Genet. 2015, 46, 308–311. [Google Scholar] [CrossRef] [PubMed]
- An, X.; Song, Y.; Bu, S.; Ma, H.; Gao, K.; Hou, J.; Wang, S.; Lei, Z.; Cao, B. Association of polymorphisms at the microRNA binding site of the caprine KITLG 3′-UTR with litter size. Sci. Rep. 2016, 6, 25691. [Google Scholar] [CrossRef] [PubMed]
- Willis, E.L.; Bridges, P.J.; Fortune, J.E. Progesterone receptor and prostaglandins mediate luteinizing hormone-induced changes in messenger RNAs for ADAMTS proteases in theca cells of bovine periovulatory follicles. Mol. Reprod. Dev. 2017, 84, 55–66. [Google Scholar] [CrossRef]
- Robker, R. Ovulation: A multi-gene, multi-step process. Steroids 2000, 65, 559–570. [Google Scholar] [CrossRef]
- Brown, H.M.; Dunning, K.R.; Robker, R.L.; Boerboom, D.; Pritchard, M.; Lane, M.; Russell, D.L. ADAMTS1 cleavage of versican mediates essential structural remodeling of the ovarian follicle and cumulus-oocyte matrix during ovulation in mice. Biol. Reprod. 2010, 83, 549–557. [Google Scholar] [CrossRef]
- Kadi, N.; Tahiri, L.; Maziane, M.; Mernissi, F.Z.; Harzy, T. Proximal symphalangism and premature ovarian failure. Jt. Bone Spine 2012, 79, 83–84. [Google Scholar] [CrossRef]
- Kosaki, K.; Sato, S.; Hasegawa, T.; Matsuo, N.; Suzuki, T.; Ogata, T. Premature ovarian failure in a female with proximal symphalangism and Noggin mutation. Fertil. Steril. 2004, 81, 1137–1139. [Google Scholar] [CrossRef]
- Yue, K.; Peng, J.; Zheng, R.; Li, J.L.; Chen, J.F.; Li, F.E.; Dai, L.H.; Ding, S.H.; Guo, W.H.; Xu, N.Y.; et al. Sequencing, Genomic Structure, Chromosomal Mapping and Association Study of the Porcine ADAMTS1 Gene with Litter Size. Asian-Australas. J. Anim. Sci. 2008, 21, 917–922. [Google Scholar] [CrossRef]
- Chen, X.; Liu, Z.; Xu, J. The cooperative function of nuclear receptor coactivator 1 (NCOA1) and NCOA3 in placental development and embryo survival. Mol. Endocrinol. 2010, 24, 1917–1934. [Google Scholar] [CrossRef]
- Xu, S.S.; Gao, L.; Xie, X.L.; Ren, Y.L.; Shen, Z.Q.; Wang, F.; Shen, M.; Eyorsdottir, E.; Hallsson, J.H.; Kiseleva, T.; et al. Genome-Wide Association Analyses Highlight the Potential for Different Genetic Mechanisms for Litter Size Among Sheep Breeds. Front. Genet. 2018, 9, 118. [Google Scholar] [CrossRef] [PubMed]
- Modric, T.; Kowalski, A.A.; Green, M.L.; Simmen, R.C.; Simmen, F.A. Pregnancy-dependent expression of leukaemia inhibitory factor (LIF), LIF receptor-beta and interleukin-6 (IL-6) messenger ribonucleic acids in the porcine female reproductive tract. Placenta 2000, 21, 345–353. [Google Scholar] [CrossRef] [PubMed]
- Yelich, J.V.; Pomp, D.; Geisert, R.D. Ontogeny of elongation and gene expression in the early developing porcine conceptus. Biol. Reprod. 1997, 57, 1256–1265. [Google Scholar] [CrossRef] [PubMed]
- Song, H.; Lim, H.; Das, S.K.; Paria, B.C.; Dey, S.K. Dysregulation of EGF family of growth factors and COX-2 in the uterus during the preattachment and attachment reactions of the blastocyst with the luminal epithelium correlates with implantation failure in LIF-deficient mice. Mol. Endocrinol. 2000, 14, 1147–1161. [Google Scholar] [CrossRef] [PubMed]
- Savatier, P.; Lapillonne, H.; van Grunsven, L.A.; Rudkin, B.B.; Samarut, J. Withdrawal of differentiation inhibitory activity/leukemia inhibitory factor up-regulates D-type cyclins and cyclin-dependent kinase inhibitors in mouse embryonic stem cells. Oncogene 1996, 12, 309–322. [Google Scholar]
- Stewart, C.L.; Kaspar, P.; Brunet, L.J.; Bhatt, H.; Gadi, I.; Kontgen, F.; Abbondanzo, S.J. Blastocyst implantation depends on maternal expression of leukaemia inhibitory factor. Nature 1992, 359, 76–79. [Google Scholar] [CrossRef]
- Anegon, I.; Cuturi, M.C.; Godard, A.; Moreau, M.; Terqui, M.; Martinat-Botte, F.; Soulillou, J.P. Presence of leukaemia inhibitory factor and interleukin 6 in porcine uterine secretions prior to conceptus attachment. Cytokine 1994, 6, 493–499. [Google Scholar] [CrossRef]
- Ma, X.H.; Hu, S.J.; Ni, H.; Zhao, Y.C.; Tian, Z.; Liu, J.L.; Ren, G.; Liang, X.H.; Yu, H.; Wan, P.; et al. Serial analysis of gene expression in mouse uterus at the implantation site. J. Biol. Chem. 2006, 281, 9351–9360. [Google Scholar] [CrossRef]
- Geisert, R.; Yelich, J. Regulation of conceptus development and attachment in pigs. J. Reprod. Fertil. Suppl. 1997, 52, 133–149. [Google Scholar]
- Sambrook, J.; Russell, D.W. The Condensed Protocols From Molecular Cloning: A Laboratory Manual; Cold Spring Harbor Laboratory Press: Cold Spring Harbor, NY, USA, 2006. [Google Scholar]
- Li, H.; Wang, B.; Liu, D.; Wang, T.; Li, Q.; Wang, W.; Li, H. SNPscan as a high-performance screening tool for mutation hotspots of hearing loss-associated genes. Genomics 2015, 106, 83–87. [Google Scholar] [CrossRef]
- Granato, I.S.C.; Galli, G.; de Oliveira Couto, E.G.; e Souza, M.B.; Mendonça, L.F.; Fritsche-Neto, R. snpReady: A tool to assist breeders in genomic analysis. Mol. Breed. 2018, 38, 102. [Google Scholar] [CrossRef]
- De Mendiburu, F.; Simon, R. Agricolae-Ten Years of an Open Source Statistical Tool for Experiments in Breeding, Agriculture and Biology. PeerJ 2015, PrePrints 3, e1404v1. [Google Scholar]
- Barrett, J.C.; Fry, B.; Maller, J.; Daly, M.J. Haploview: Analysis and visualization of LD and haplotype maps. Bioinformatics 2005, 21, 263–265. [Google Scholar] [CrossRef] [PubMed]
- Chu, M.; Jia, L.; Zhang, Y.; Jin, M.; Chen, H.; Fang, L.; Di, R.; Cao, G.; Feng, T.; Tang, Q.; et al. Polymorphisms of coding region of BMPR-IB gene and their relationship with litter size in sheep. Mol. Biol. Rep. 2011, 38, 4071–4076. [Google Scholar] [CrossRef] [PubMed]
- El-Halawany, N.; Zhou, X.; Al-Tohamy, A.F.; El-Sayd, Y.A.; Shawky, A.E.; Michal, J.J.; Jiang, Z. Genome-wide screening of candidate genes for improving fertility in Egyptian native Rahmani sheep. Anim. Genet. 2016, 47, 513. [Google Scholar] [CrossRef] [PubMed]
- Chu, M.X.; Guo, X.H.; Feng, C.J.; Li, Y.; Huang, D.W.; Feng, T.; Cao, G.L.; Fang, L.; Di, R.; Tang, Q.Q.; et al. Polymorphism of 5′ regulatory region of ovine FSHR gene and its association with litter size in Small Tail Han sheep. Mol. Biol. Rep. 2012, 39, 3721–3725. [Google Scholar] [CrossRef]
- Ma, X.; Guan, L.; Xuan, J.; Wang, H.; Yuan, Z.; Wu, M.; Liu, R.; Zhu, C.; Wei, C.; Zhao, F.; et al. Effect of polymorphisms in the CAMKMT gene on growth traits in Ujumqin sheep. Anim. Genet. 2016, 47, 618–622. [Google Scholar] [CrossRef]
- Naicy, T.; Venkatachalapathy, R.T.; Aravindakshan, T.V.; Radhika, G.; Raghavan, K.C.; Mini, M.; Shyama, K. Nerve Growth Factor gene ovarian expression, polymorphism identification, and association with litter size in goats. Theriogenology 2016, 86, 2172–2178. [Google Scholar] [CrossRef]
- Wang, W.; La, Y.; Zhou, X.; Zhang, X.; Li, F.; Liu, B. The genetic polymorphisms of TGFbeta superfamily genes are associated with litter size in a Chinese indigenous sheep breed (Hu sheep). Anim. Reprod. Sci. 2018, 189, 19–29. [Google Scholar] [CrossRef]
- Chang, K.C. Critical regulatory domains in intron 2 of a porcine sarcomeric myosin heavy chain gene. J. Muscle Res. Cell Motil. 2000, 21, 451–461. [Google Scholar] [CrossRef]
- Anna, A.; Monika, G. Splicing mutations in human genetic disorders: Examples, detection, and confirmation. J. Appl. Genet. 2018, 59, 253–268. [Google Scholar] [CrossRef] [PubMed]
- Pagani, F.; Raponi, M.; Baralle, F.E. Synonymous mutations in CFTR exon 12 affect splicing and are not neutral in evolution. Proc. Natl. Acad. Sci. USA 2005, 102, 6368–6372. [Google Scholar] [CrossRef] [PubMed]
- Kimchi-Sarfaty, C.; Oh, J.M.; Kim, I.W.; Sauna, Z.E.; Calcagno, A.M.; Ambudkar, S.V.; Gottesman, M.M. A “silent” polymorphism in the MDR1 gene changes substrate specificity. Science 2007, 315, 525–528. [Google Scholar] [CrossRef] [PubMed]
- Fung, K.L.; Pan, J.; Ohnuma, S.; Lund, P.E.; Pixley, J.N.; Kimchi-Sarfaty, C.; Ambudkar, S.V.; Gottesman, M.M. MDR1 synonymous polymorphisms alter transporter specificity and protein stability in a stable epithelial monolayer. Cancer Res. 2014, 74, 598–608. [Google Scholar] [CrossRef] [PubMed]
- Sauna, Z.E.; Kimchi-Sarfaty, C. Understanding the contribution of synonymous mutations to human disease. Nat. Rev. Genet. 2011, 12, 683–691. [Google Scholar] [CrossRef] [PubMed]


| Sheep Breed | Litter Size | Total Samples | ||||
|---|---|---|---|---|---|---|
| 1 | 2 | 3 | 4 | 5 | ||
| Hu sheep (sample size) | 3 | 2 | 2 | 2 | 1 | 10 |
| Small-tailed Han sheep (sample size) | 3 | 3 | 2 | 2 | 0 | 10 |
| SNP ID | Breed | MA | MAF | He | Ho | PIC | χ2 | p Value |
|---|---|---|---|---|---|---|---|---|
| KIT: g.70199073A>G | HUS | G | 0.19 | 0.30 | 0.31 | 0.26 | 0.21 | 0.6442 |
| STH | G | 0.28 | 0.40 | 0.44 | 0.32 | 4.10 | 0.0430 | |
| KITLG: g.124520653G>C | HUS | C | 0.10 | 0.19 | 0.19 | 0.17 | 0.01 | 0.9410 |
| STH | C | 0.12 | 0.22 | 0.23 | 0.19 | 1.31 | 0.2530 | |
| ADAMTS1: g.127751615C>T | HUS | - | - | - | - | - | - | - |
| STH | T | 0.11 | 0.20 | 0.19 | 0.18 | 0.18 | 0.6729 | |
| ADAMTS1: g.127753565T>C | HUS | C | 0.37 | 0.47 | 0.50 | 0.36 | 2.05 | 0.1519 |
| STH | C | 0.46 | 0.50 | 0.53 | 0.37 | 1.93 | 0.1652 | |
| ADAMTS1: g.127753643C>T | HUS | - | - | - | - | - | - | - |
| STH | T | 0.20 | 0.32 | 0.31 | 0.27 | 0.45 | 0.5023 | |
| ADAMTS1: g.127754640T>G | HUS | T | 0.48 | 0.50 | 0.54 | 0.37 | 3.19 | 0.0740 |
| STH | G | 0.45 | 0.50 | 0.49 | 0.37 | 0.01 | 0.9216 | |
| NCOA1: g.31928165C>T | HUS | T | 0.40 | 0.48 | 0.51 | 0.36 | 2.89 | 0.0891 |
| STH | T | 0.33 | 0.44 | 0.45 | 0.35 | 0.10 | 0.7507 | |
| NCOA1: g.31928230C>T | HUS | T | 0.15 | 0.26 | 0.27 | 0.23 | 0.83 | 0.3630 |
| STH | T | 0.25 | 0.38 | 0.35 | 0.31 | 1.71 | 0.1916 | |
| NCOA1: g.32072394C>T | HUS | T | 0.19 | 0.31 | 0.30 | 0.26 | 0.92 | 0.3371 |
| STH | T | 0.22 | 0.34 | 0.36 | 0.28 | 1.54 | 0.2142 | |
| NCOA1: g.32116034A>G | HUS | G | 0.22 | 0.34 | 0.32 | 0.28 | 1.60 | 0.2064 |
| STH | G | 0.20 | 0.32 | 0.33 | 0.27 | 0.75 | 0.3867 | |
| NCOA1: g.32140565G>A | HUS | A | 0.11 | 0.20 | 0.22 | 0.18 | 2.84 | 0.0922 |
| STH | A | 0.20 | 0.32 | 0.32 | 0.27 | 0.03 | 0.8540 | |
| NCOA1: g.32140837T>C | HUS | C | 0.24 | 0.36 | 0.34 | 0.30 | 2.13 | 0.1448 |
| STH | C | 0.24 | 0.36 | 0.38 | 0.29 | 1.28 | 0.2589 | |
| NPM1: g.3245714T>C | HUS | C | 0.43 | 0.49 | 0.49 | 0.37 | 0.04 | 0.8432 |
| STH | T | 0.45 | 0.50 | 0.46 | 0.37 | 2.68 | 0.1019 | |
| NPM1: g.3245741C>T | HUS | T | 0.43 | 0.49 | 0.50 | 0.37 | 0.07 | 0.7901 |
| STH | C | 0.46 | 0.50 | 0.47 | 0.37 | 0.91 | 0.3407 | |
| NPM1: g.3245965C>T | HUS | T | 0.43 | 0.49 | 0.49 | 0.37 | 0.01 | 0.9257 |
| STH | C | 0.45 | 0.49 | 0.45 | 0.37 | 3.05 | 0.0808 | |
| NPM1: g.3246266T>G | HUS | G | 0.24 | 0.36 | 0.34 | 0.30 | 3.12 | 0.0774 |
| STH | G | 0.20 | 0.32 | 0.28 | 0.27 | 6.62 | 0.0101 | |
| NPM1: g.3247499A>T | HUS | T | 0.29 | 0.41 | 0.44 | 0.33 | 2.04 | 0.1534 |
| STH | T | 0.31 | 0.43 | 0.41 | 0.34 | 0.65 | 0.4218 | |
| NPM1: g.3251189A>T | HUS | T | 0.42 | 0.49 | 0.49 | 0.37 | 0.00 | 0.9940 |
| STH | T | 0.46 | 0.50 | 0.48 | 0.37 | 0.77 | 0.3811 | |
| LIF: g.68801067C>T | HUS | - | - | - | - | - | - | - |
| STH | T | 0.12 | 0.21 | 0.20 | 0.19 | 1.63 | 0.2019 | |
| LIF: g.68816215C>T | HUS | T | 0.06 | 0.12 | 0.12 | 0.11 | 0.59 | 0.4418 |
| STH | T | 0.11 | 0.19 | 0.19 | 0.17 | 0.00 | 0.9715 | |
| LIFR: g.35813711C>T | HUS | T | 0.43 | 0.49 | 0.50 | 0.37 | 0.33 | 0.5646 |
| STH | T | 0.32 | 0.43 | 0.44 | 0.34 | 0.03 | 0.8658 | |
| LIFR: g.35814094C>T | HUS | T | 0.43 | 0.49 | 0.51 | 0.37 | 0.59 | 0.4418 |
| STH | T | 0.32 | 0.44 | 0.44 | 0.34 | 0.10 | 0.7568 | |
| LIFR: g.35813931G>A | HUS | T | 0.19 | 0.31 | 0.28 | 0.26 | 3.33 | 0.0680 |
| STH | T | 0.29 | 0.41 | 0.37 | 0.33 | 3.88 | 0.0489 | |
| LIFR: g.35813935A>G | HUS | G | 0.45 | 0.50 | 0.47 | 0.37 | 1.22 | 0.2690 |
| STH | G | 0.35 | 0.46 | 0.41 | 0.35 | 4.52 | 0.0334 | |
| LIFR: g.35817147A>G | HUS | G | 0.17 | 0.28 | 0.27 | 0.24 | 0.97 | 0.3250 |
| STH | G | 0.27 | 0.40 | 0.40 | 0.32 | 0.00 | 0.9578 | |
| LIFR: g.35817247G>A | HUS | A | 0.17 | 0.28 | 0.27 | 0.24 | 0.97 | 0.3250 |
| STH | A | 0.27 | 0.40 | 0.40 | 0.32 | 0.00 | 0.9888 | |
| LIFR: g.35835329G>A | HUS | A | 0.39 | 0.48 | 0.46 | 0.36 | 0.40 | 0.5280 |
| STH | A | 0.43 | 0.49 | 0.53 | 0.37 | 2.54 | 0.1113 | |
| LIFR: g.35835474G>T | HUS | T | 0.07 | 0.13 | 0.13 | 0.12 | 0.14 | 0.7117 |
| STH | T | 0.23 | 0.35 | 0.37 | 0.29 | 0.66 | 0.4154 | |
| LIFR: g.35841608T>C | HUS | C | 0.09 | 0.16 | 0.16 | 0.14 | 0.27 | 0.6044 |
| STH | C | 0.23 | 0.35 | 0.37 | 0.29 | 1.07 | 0.3022 | |
| LIFR: g.35845633T>C | HUS | T | 0.24 | 0.36 | 0.35 | 0.30 | 0.79 | 0.3743 |
| STH | C | 0.15 | 0.25 | 0.27 | 0.22 | 1.64 | 0.2009 | |
| LIFR: g.35847837A>G | HUS | G | 0.09 | 0.17 | 0.18 | 0.15 | 0.72 | 0.3954 |
| STH | G | 0.25 | 0.37 | 0.38 | 0.30 | 0.43 | 0.5103 | |
| LIFR: g.35847864A>T | HUS | T | 0.41 | 0.48 | 0.50 | 0.37 | 0.89 | 0.3463 |
| STH | T | 0.42 | 0.49 | 0.54 | 0.37 | 5.34 | 0.0209 | |
| LIFR: g.35848079G>A | HUS | A | 0.38 | 0.47 | 0.48 | 0.36 | 0.13 | 0.7151 |
| STH | A | 0.42 | 0.49 | 0.52 | 0.37 | 2.27 | 0.1318 | |
| LIFR: g.35848108A>G | HUS | G | 0.41 | 0.48 | 0.51 | 0.37 | 1.28 | 0.2571 |
| STH | G | 0.45 | 0.49 | 0.56 | 0.37 | 8.43 | 0.0037 | |
| LIFR: g.35847912C>T | HUS | T | 0.41 | 0.48 | 0.49 | 0.37 | 0.03 | 0.8553 |
| STH | T | 0.43 | 0.49 | 0.53 | 0.37 | 2.63 | 0.1047 | |
| LIFR: g.35851829T>C | HUS | C | 0.22 | 0.34 | 0.34 | 0.28 | 0.00 | 0.9701 |
| STH | C | 0.18 | 0.30 | 0.30 | 0.25 | 0.33 | 0.5640 | |
| LIFR: g.35853589T>C | HUS | C | 0.35 | 0.45 | 0.46 | 0.35 | 0.04 | 0.8470 |
| STH | C | 0.42 | 0.49 | 0.51 | 0.37 | 0.70 | 0.4014 | |
| LIFR: g.35853637T>G | HUS | G | 0.30 | 0.42 | 0.41 | 0.33 | 0.17 | 0.6765 |
| STH | G | 0.37 | 0.46 | 0.50 | 0.36 | 2.46 | 0.1167 | |
| LIFR: g.35853852T>C | HUS | C | 0.22 | 0.34 | 0.32 | 0.28 | 0.98 | 0.3211 |
| STH | C | 0.13 | 0.23 | 0.23 | 0.20 | 0.01 | 0.9251 | |
| LIFR: g.35862868C>T | HUS | T | 0.44 | 0.49 | 0.49 | 0.37 | 0.06 | 0.8061 |
| STH | T | 0.48 | 0.50 | 0.55 | 0.37 | 4.63 | 0.0314 | |
| LIFR: g.35862947G>T | HUS | T | 0.45 | 0.49 | 0.49 | 0.37 | 0.09 | 0.7616 |
| STH | G | 0.49 | 0.50 | 0.55 | 0.37 | 5.07 | 0.0244 | |
| LIFR: g.35867028T>C | HUS | C | 0.42 | 0.49 | 0.48 | 0.37 | 0.08 | 0.7815 |
| STH | - | - | - | - | - | - | - | |
| NGF: g.91795933T>C | HUS | C | 0.47 | 0.50 | 0.52 | 0.37 | 0.79 | 0.3734 |
| STH | C | 0.40 | 0.48 | 0.46 | 0.37 | 0.72 | 0.3961 | |
| NTRK1: g.105276945C>T | HUS | T | 0.34 | 0.45 | 0.42 | 0.35 | 3.18 | 0.0745 |
| STH | T | 0.17 | 0.28 | 0.31 | 0.24 | 3.05 | 0.0807 | |
| NTRK1: g.105288550C>G | HUS | C | 0.47 | 0.50 | 0.44 | 0.37 | 6.71 | 0.0096 |
| STH | C | 0.46 | 0.50 | 0.44 | 0.37 | 5.47 | 0.0193 |
| SNP ID | Gene Symbol | Genotype | Hu Sheep | Small-Tailed Han Sheep | ||
|---|---|---|---|---|---|---|
| N | Mean ± S.D. | N | Mean ± S.D. | |||
| KIT: g.70199073A>G | KIT (intron 2) | AA | 354 | 2.25 ± 1.05 | 211 | 1.88 ± 0.78b |
| GA | 166 | 2.13 ± 1.02 | 185 | 1.94 ± 0.85ab | ||
| GG | 17 | 2.12 ± 1.32 | 24 | 2.42 ± 0.83a | ||
| p-value | 0.42 | 0.00945 ** | ||||
| KITLG: g.124520653G>C | KITLG (intron 9) | CC | 6 | 3.17 ± 0.75a | 4 | 1.50 ± 0.58 |
| GC | 100 | 2.10 ± 1.11b | 97 | 1.93 ± 0.79 | ||
| GG | 431 | 2.22 ± 1.03ab | 319 | 1.94 ± 0.84 | ||
| p-value | 0.0461 * | 0.568 | ||||
| ADAMTS1: g.127753565T>C | ADAMTS1 (exon 5) Ser→Ser | CC | 66 | 2.24 ± 1.02ab | 114 | 2 ± 0.79 |
| CT | 266 | 2.09 ± 1.02b | 223 | 1.93 ± 0.85 | ||
| TT | 205 | 2.35 ± 1.07a | 83 | 1.84 ± 0.80 | ||
| p-value | 0.0262 * | 0.42 | ||||
| ADAMTS1: g.127754640G>T | ADAMTS1 (intron 7) | GG | 137 | 2.39 ± 1.07a | 86 | 1.88 ± 0.79 |
| GT | 288 | 2.10 ± 1.01b | 207 | 1.94 ± 0.83 | ||
| TT | 111 | 2.25 ± 1.11ab | 127 | 1.95 ± 0.84 | ||
| p-value | 0.0297* | 0.817 | ||||
| NCOA1: g.31928165C>T | NCOA1 (intron 1) | CC | 184 | 2.28 ± 1.09 | 185 | 1.98 ± 0.86a |
| CT | 276 | 2.13 ± 1.01 | 189 | 1.97 ± 0.79a | ||
| TT | 76 | 2.3 ± 1.08 | 45 | 1.60 ± 0.75b | ||
| p-value | 0.217 | 0.0158* | ||||
| NCOA1: g.32140565G>A | NCOA1 (intron 21) | AA | 3 | 3.00 ± 1.70 | 16 | 1.38 ± 0.50b |
| GA | 116 | 2.25 ± 1.02 | 135 | 2.02 ± 0.84a | ||
| GG | 418 | 2.19 ± 1.05 | 269 | 1.92 ± 0.82a | ||
| p-value | 0.368 | 0.0109* | ||||
| LIFR: g.35862868C>T | LIFR (intron 19) | CC | 169 | 2.19 ± 1.03 | 104 | 1.71 ± 0.81b |
| CT | 262 | 2.21 ± 1.08 | 231 | 2.00 ± 0.83 a | ||
| TT | 106 | 2.25 ± 1.01 | 84 | 2.04 ± 0.78a | ||
| p-value | 0.91 | 0.0054** | ||||
| LIFR: g.35862947G>T | LIFR (intron 19) | GG | 166 | 2.18 ± 1.03 | 90 | 1.74 ± 0.84b |
| GT | 262 | 2.21 ± 1.08 | 233 | 1.96 ± 0.81ab | ||
| TT | 109 | 2.23 ± 1.01 | 97 | 2.05 ± 0.82a | ||
| p-value | 0.915 | 0.0309* | ||||
| NGF: g.91795933T>C | NGF (intron 2) | CC | 115 | 2.32 ± 1.06 | 73 | 1.73 ± 0.79b |
| CT | 278 | 2.13 ± 1.05 | 194 | 1.94 ± 0.85ab | ||
| TT | 144 | 2.28 ±1.02 | 153 | 2.02 ± 0.79a | ||
| p-value | 0.157 | 0.0418* | ||||
| SNP ID | QTL ID | QTL Region (Chr:Mb) | Distance (Mb) | Reference |
|---|---|---|---|---|
| KIT: g.70199073A>G | 13975 | Chr6:68.3-68.4 | 1.80 | [35] |
| 130449 | Chr6: 42.6-42.6 | 27.60 | [36] | |
| 154661 | Chr6: 29.4-29.4 | 40.80 | [21] | |
| 154662 | Chr6:29.4-29.4 | 40.80 | [21] | |
| KITLG: g.124520653G>C | 14242 | Chr3:75.2-75.3 | 49.22 | [37] |
| ADAMTS1: g.127753565T>C | - | - | - | - |
| ADAMTS1: g.127754640G>T | - | - | - | - |
| NCOA1: g.31928165C>T | 14242 | Chr3:75.2-75.3 | 43.27 | [37] |
| NCOA1: g.32140565G>A | 14242 | Chr3:75.2-75.3 | 43.27 | [37] |
| LIFR: g.35862868C>T | 154682 | Chr16:31.8-31.8 | 4.06 | [21] |
| 154683 | Chr16:31.8-31.8 | 4.06 | [21] | |
| 154684 | Chr16:31.9-31.9 | 3.96 | [21] | |
| LIFR: g.35862947G>T | 154682 | Chr16:31.8-31.8 | 4.06 | [21] |
| 154683 | Chr16:31.8-31.8 | 4.06 | [21] | |
| 154684 | Chr16:31.9-31.9 | 3.96 | [21] | |
| NGF: g.91795933T>C | - | - | - | - |
| Haplotype Combination (n) | Litter Size (Mean ± S.D.) | p Value |
|---|---|---|
| H1H1 (87) | 1.70 ± 0.82b | 0.0284* |
| H1H2 (214) | 1.97 ± 0.81a | |
| H1H3 (17) | 1.76 ± 0.75ab | |
| H2H2 (83) | 2.02 ± 0.78a | |
| H2H3 (14) | 2.21 ± 1.05a |
© 2019 by the authors. Licensee MDPI, Basel, Switzerland. This article is an open access article distributed under the terms and conditions of the Creative Commons Attribution (CC BY) license (http://creativecommons.org/licenses/by/4.0/).
Share and Cite
Yuan, Z.; Zhang, J.; Li, W.; Wang, W.; Li, F.; Yue, X. Association of Polymorphisms in Candidate Genes with the Litter Size in Two Sheep Breeds. Animals 2019, 9, 958. https://doi.org/10.3390/ani9110958
Yuan Z, Zhang J, Li W, Wang W, Li F, Yue X. Association of Polymorphisms in Candidate Genes with the Litter Size in Two Sheep Breeds. Animals. 2019; 9(11):958. https://doi.org/10.3390/ani9110958
Chicago/Turabian StyleYuan, Zehu, Junxia Zhang, Wanhong Li, Weimin Wang, Fadi Li, and Xiangpeng Yue. 2019. "Association of Polymorphisms in Candidate Genes with the Litter Size in Two Sheep Breeds" Animals 9, no. 11: 958. https://doi.org/10.3390/ani9110958
APA StyleYuan, Z., Zhang, J., Li, W., Wang, W., Li, F., & Yue, X. (2019). Association of Polymorphisms in Candidate Genes with the Litter Size in Two Sheep Breeds. Animals, 9(11), 958. https://doi.org/10.3390/ani9110958