Exploring Smart Glasses for Augmented Reality: A Valuable and Integrative Tool in Precision Livestock Farming


Simple Summary
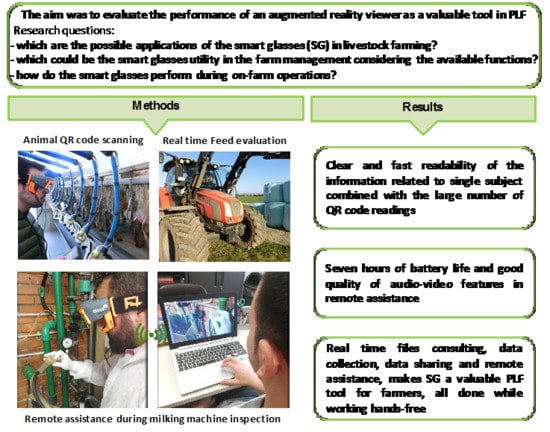
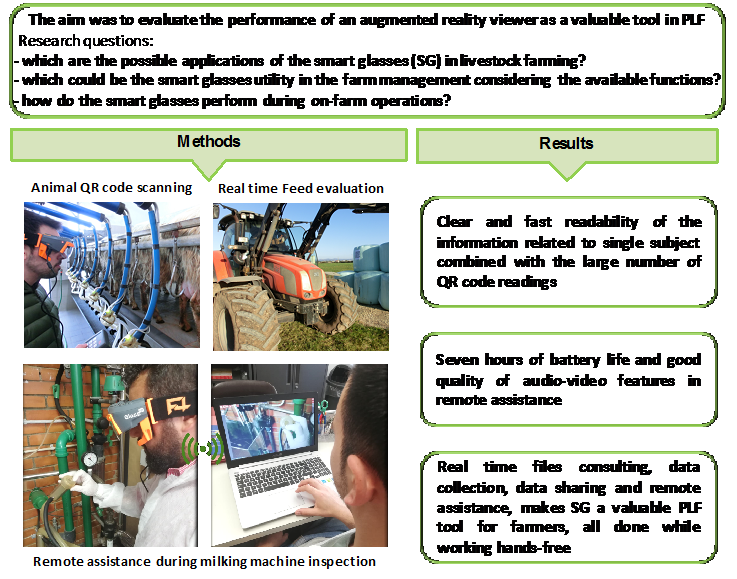
Abstract
1. Introduction
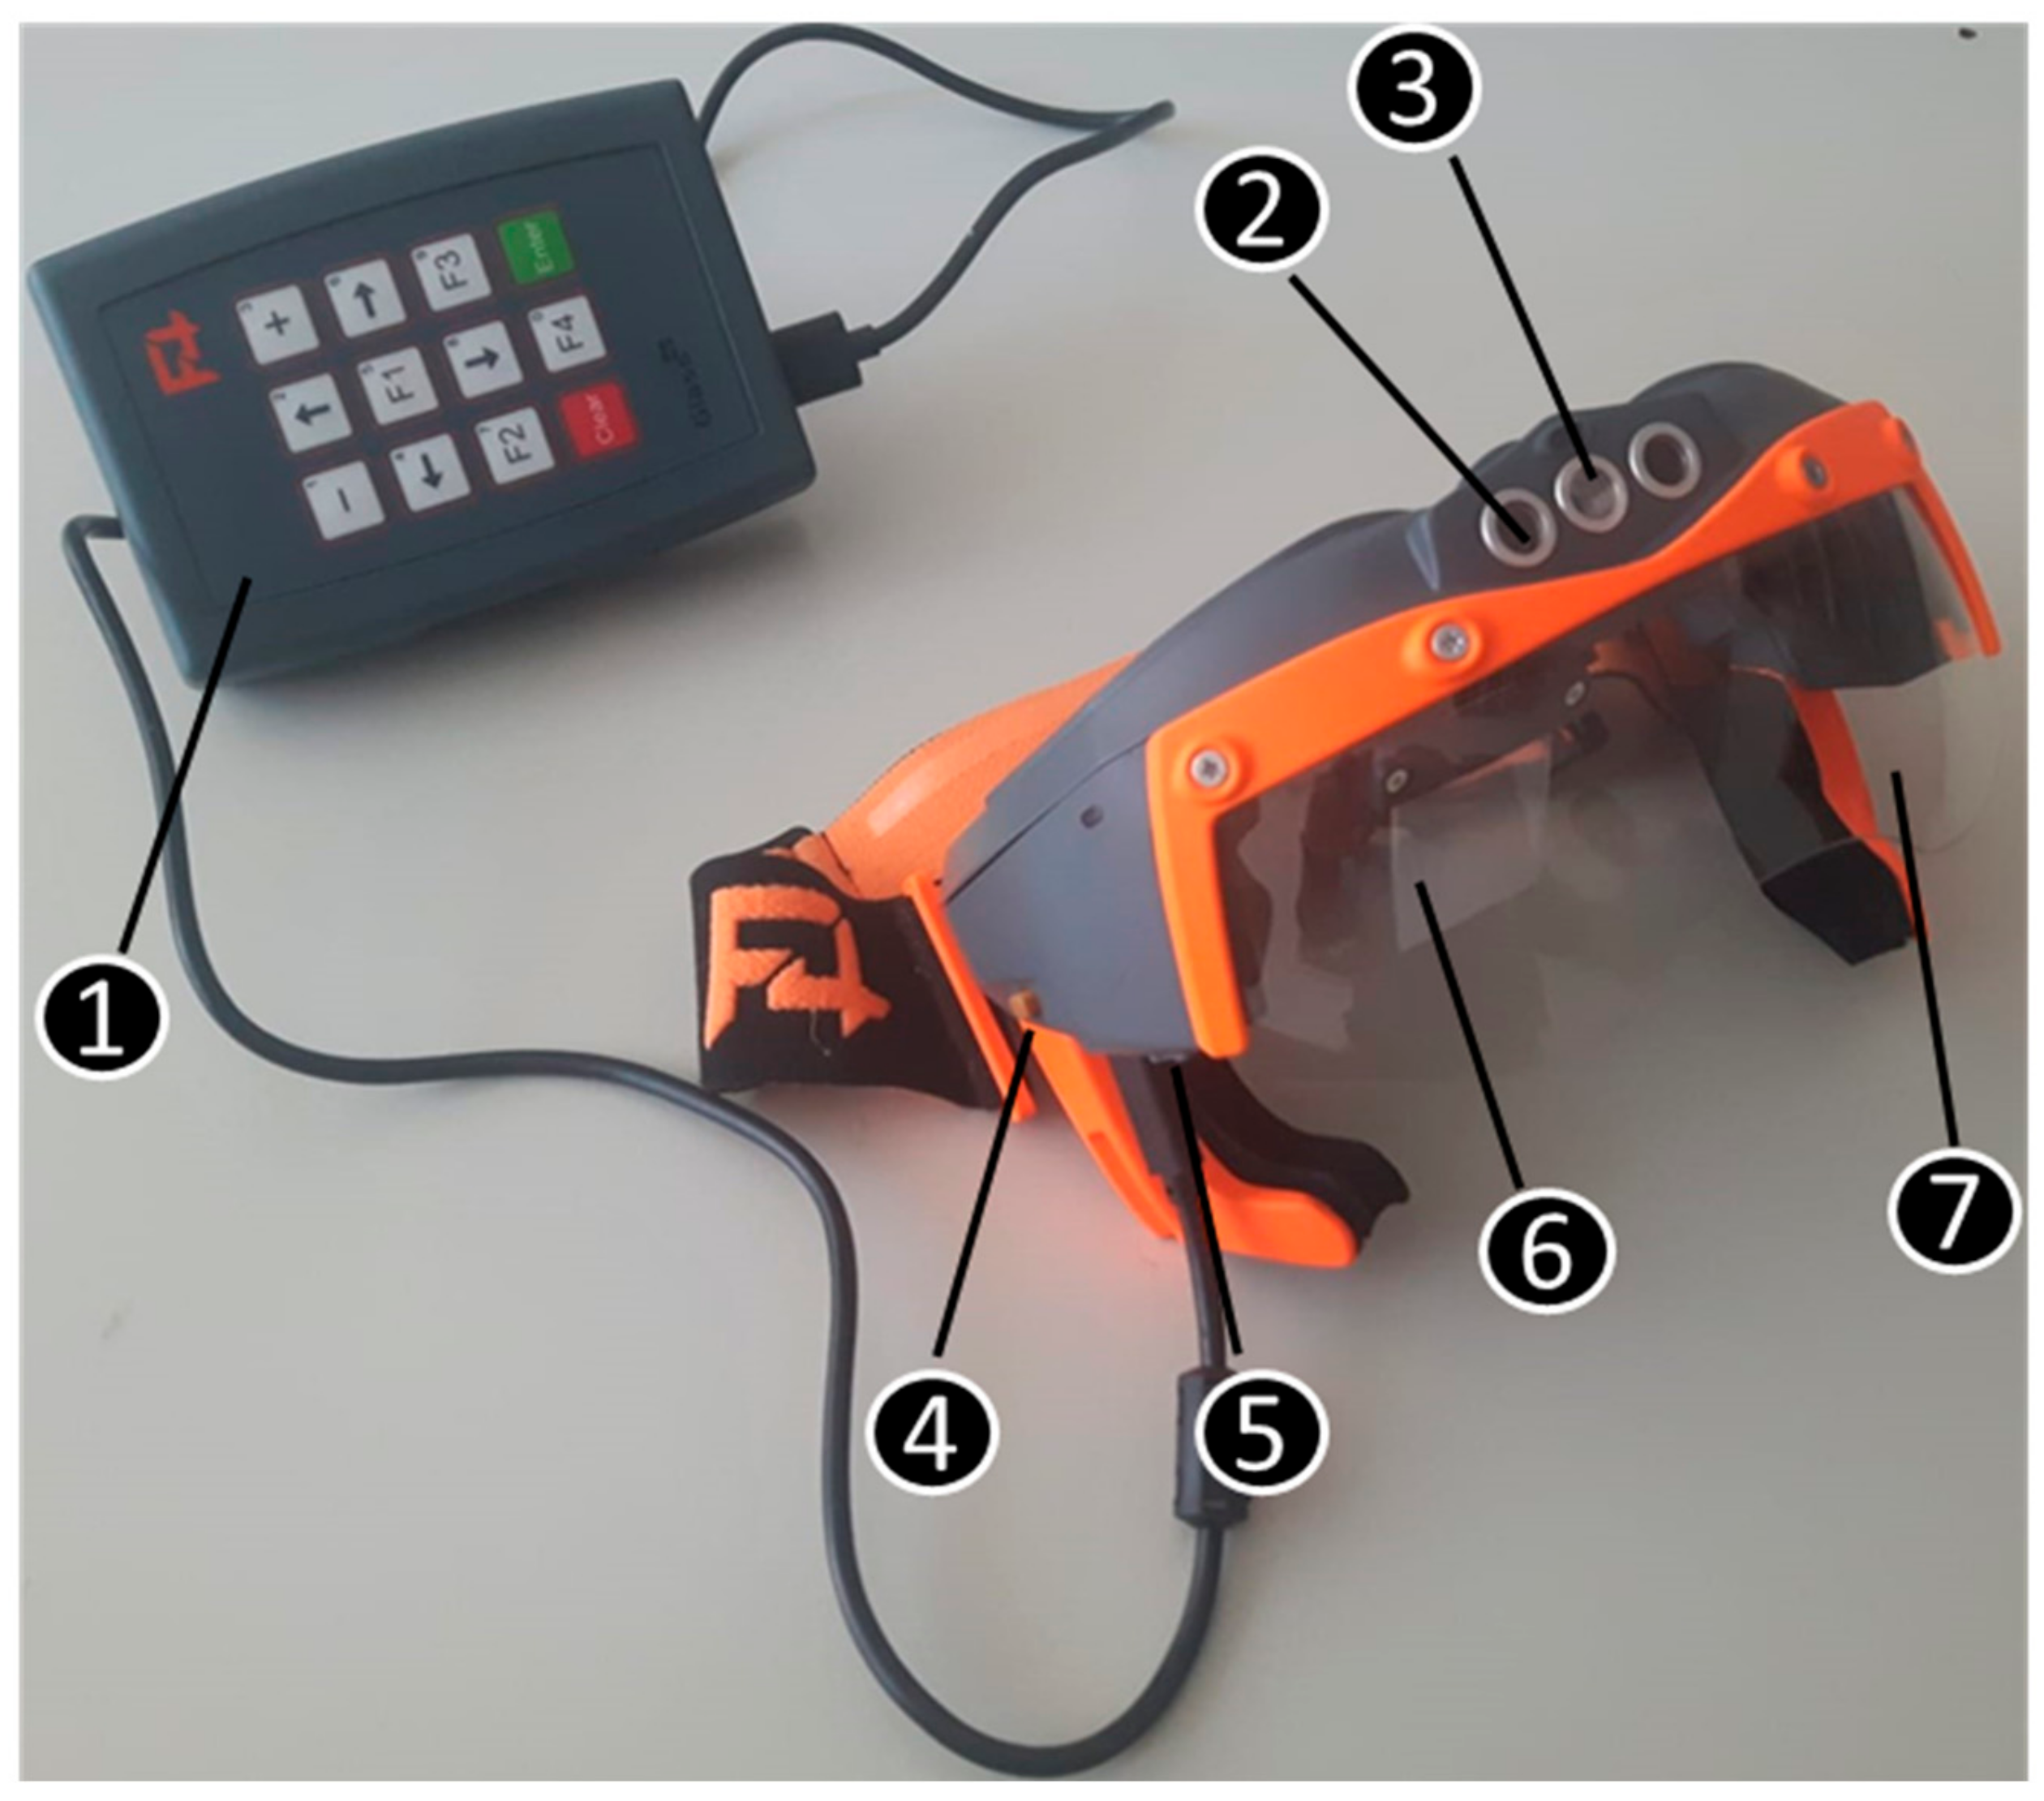
2. Materials and Methods
2.1. Laboratory Tests
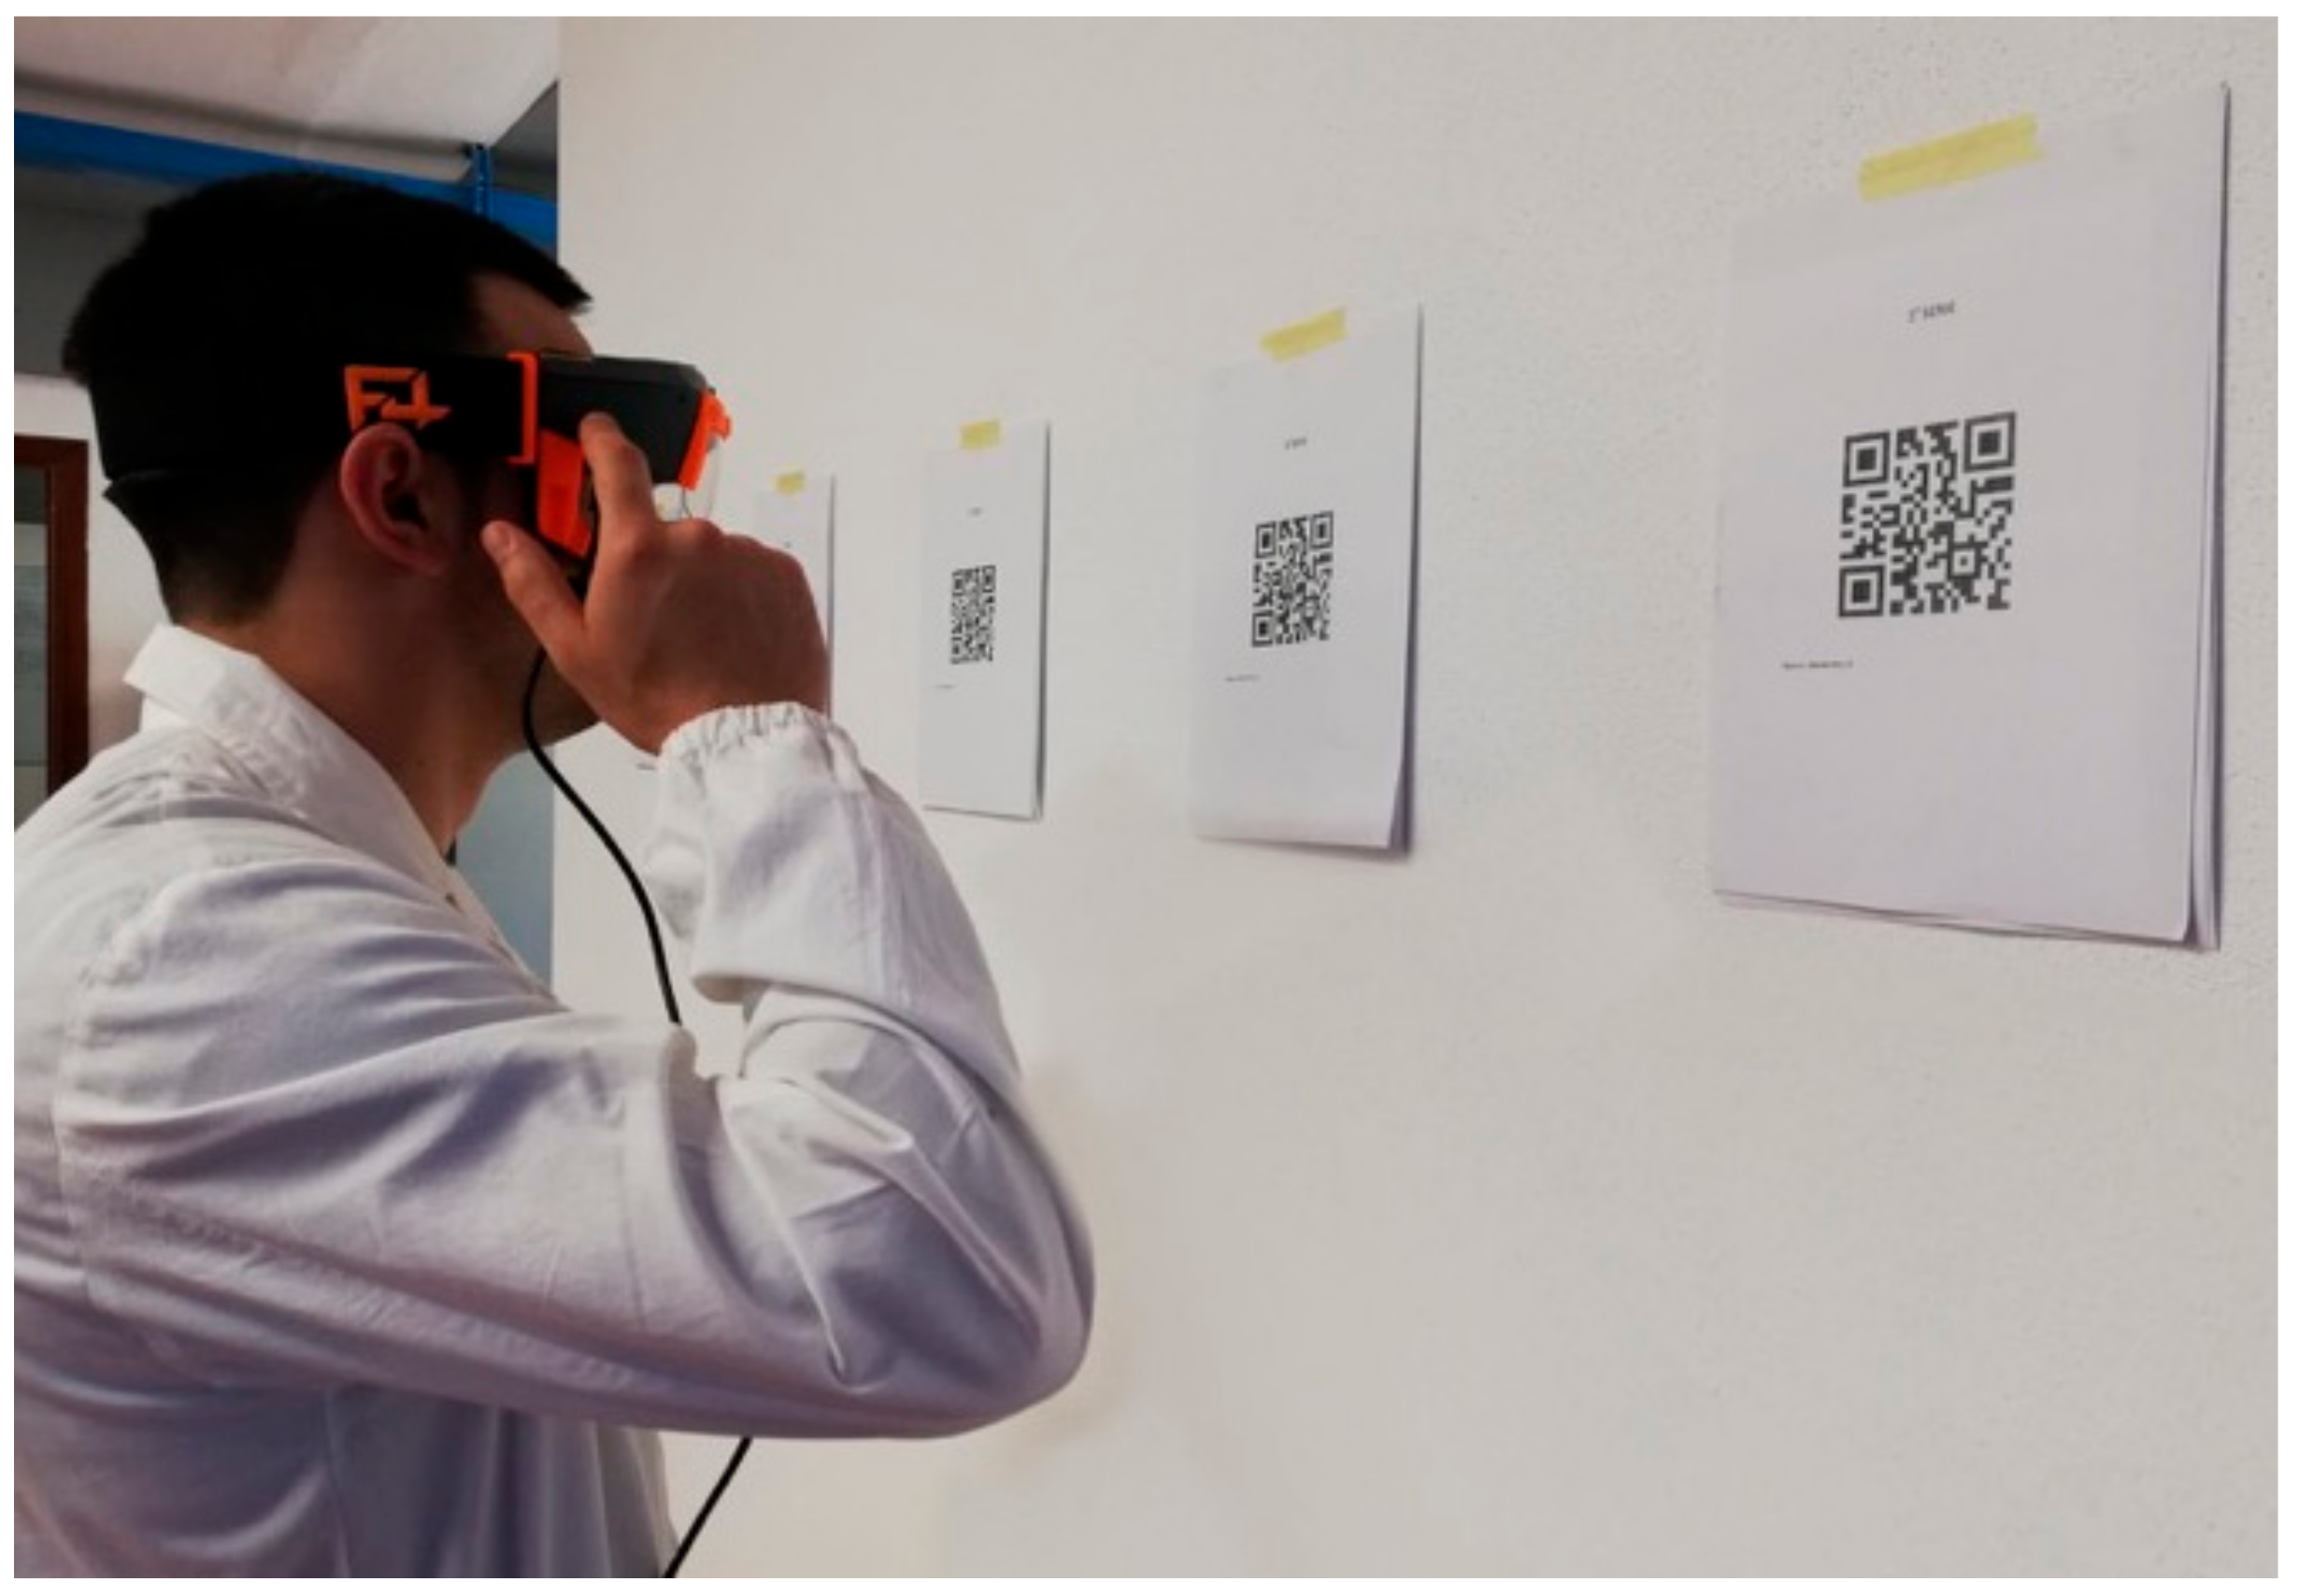
2.1.1. QR Code Scanning Time
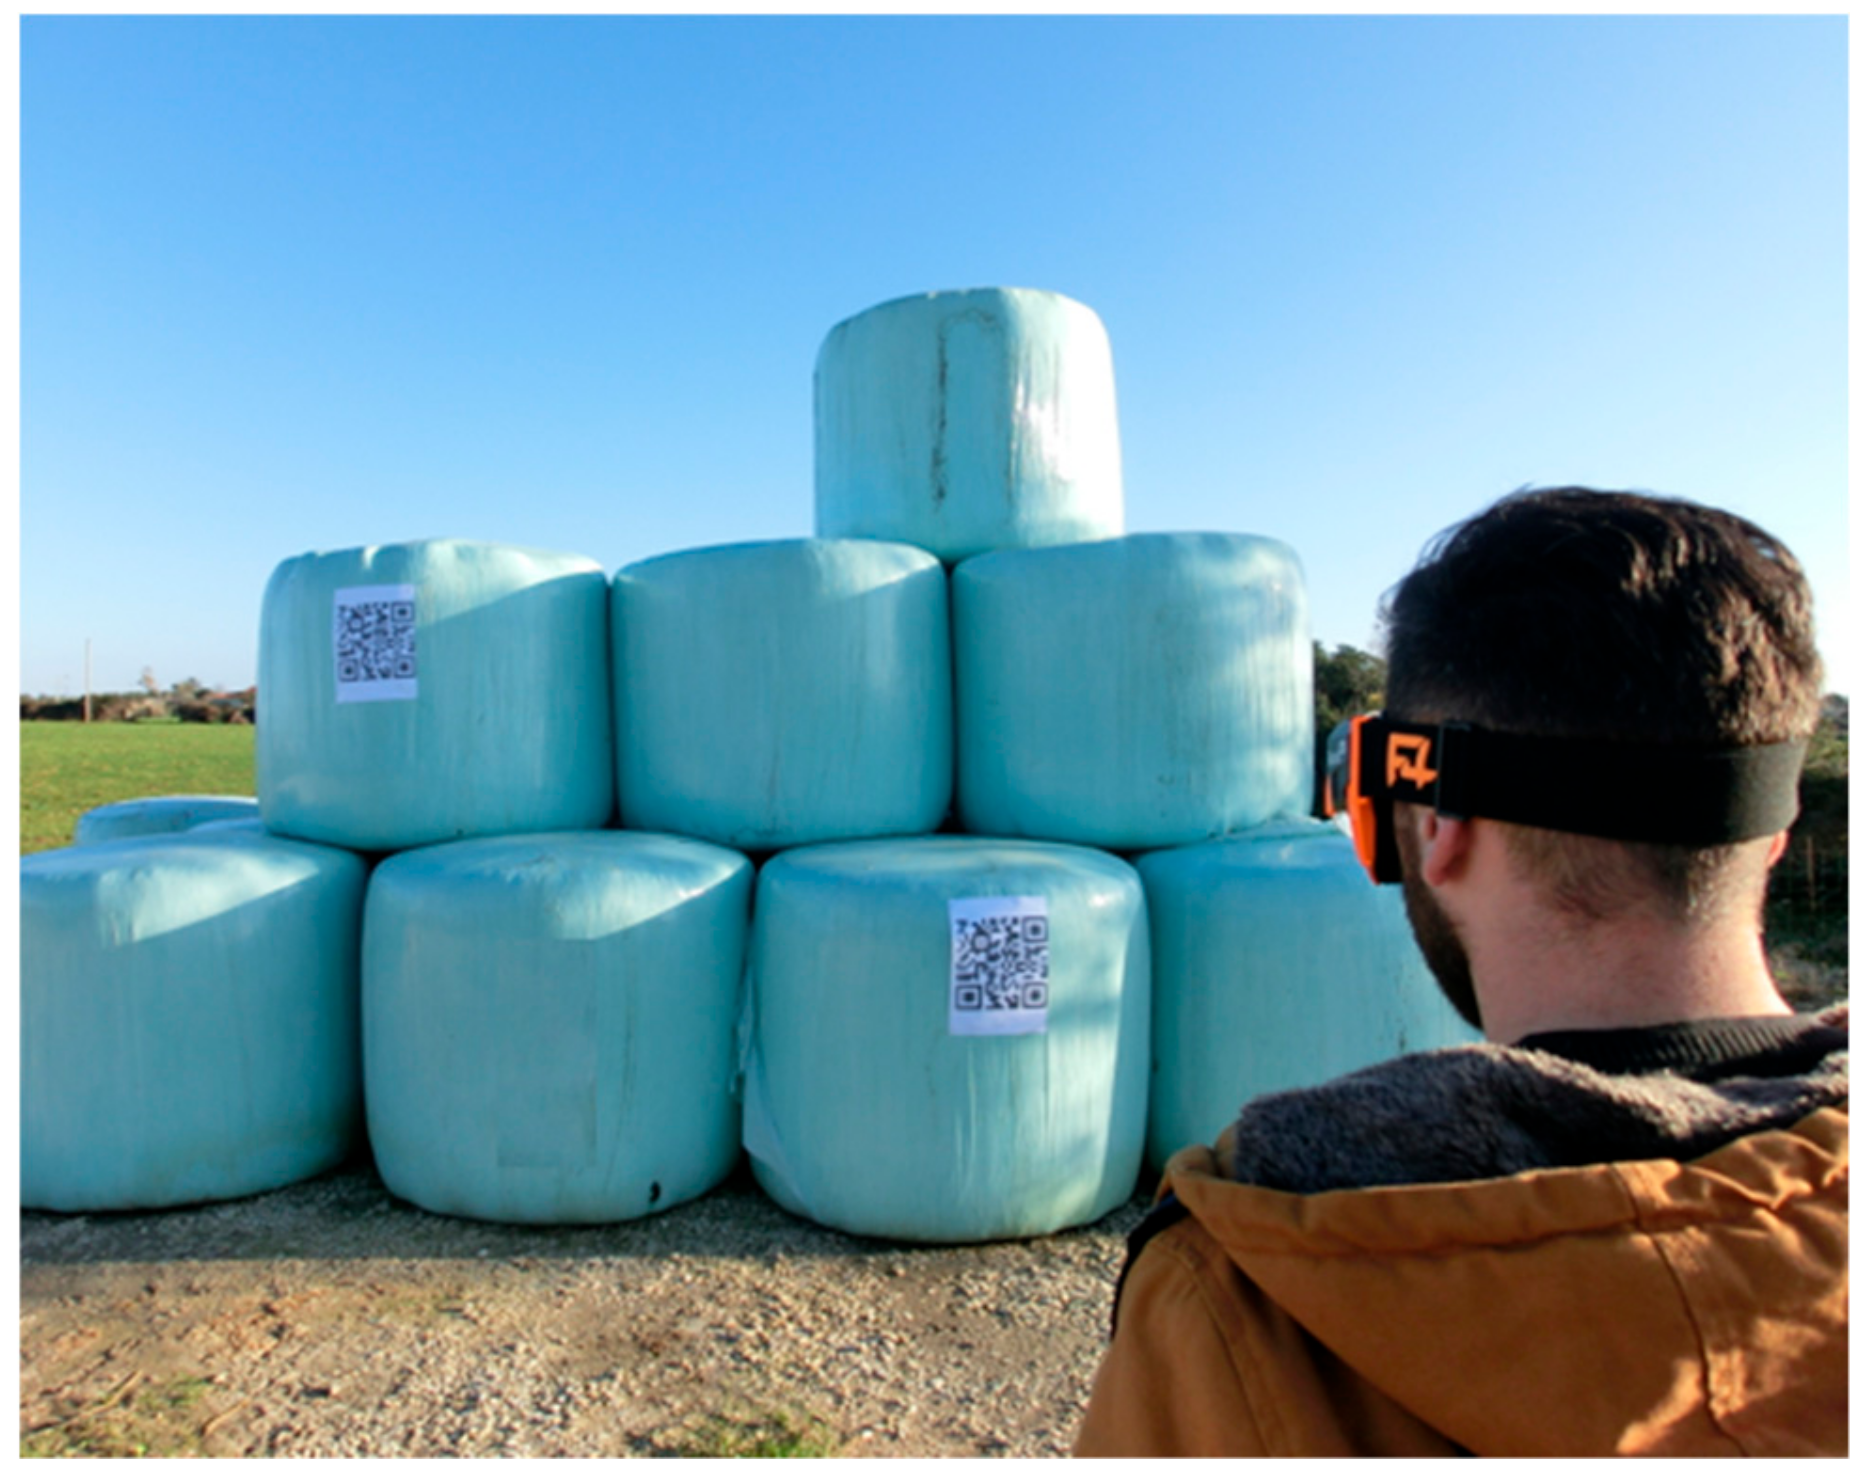
2.1.2. QR Code Scanning Distance
2.1.3. QR Code and Farm Information Sheet
2.2. Audio-Video Quality Tests
2.2.1. Video Call Lag Time
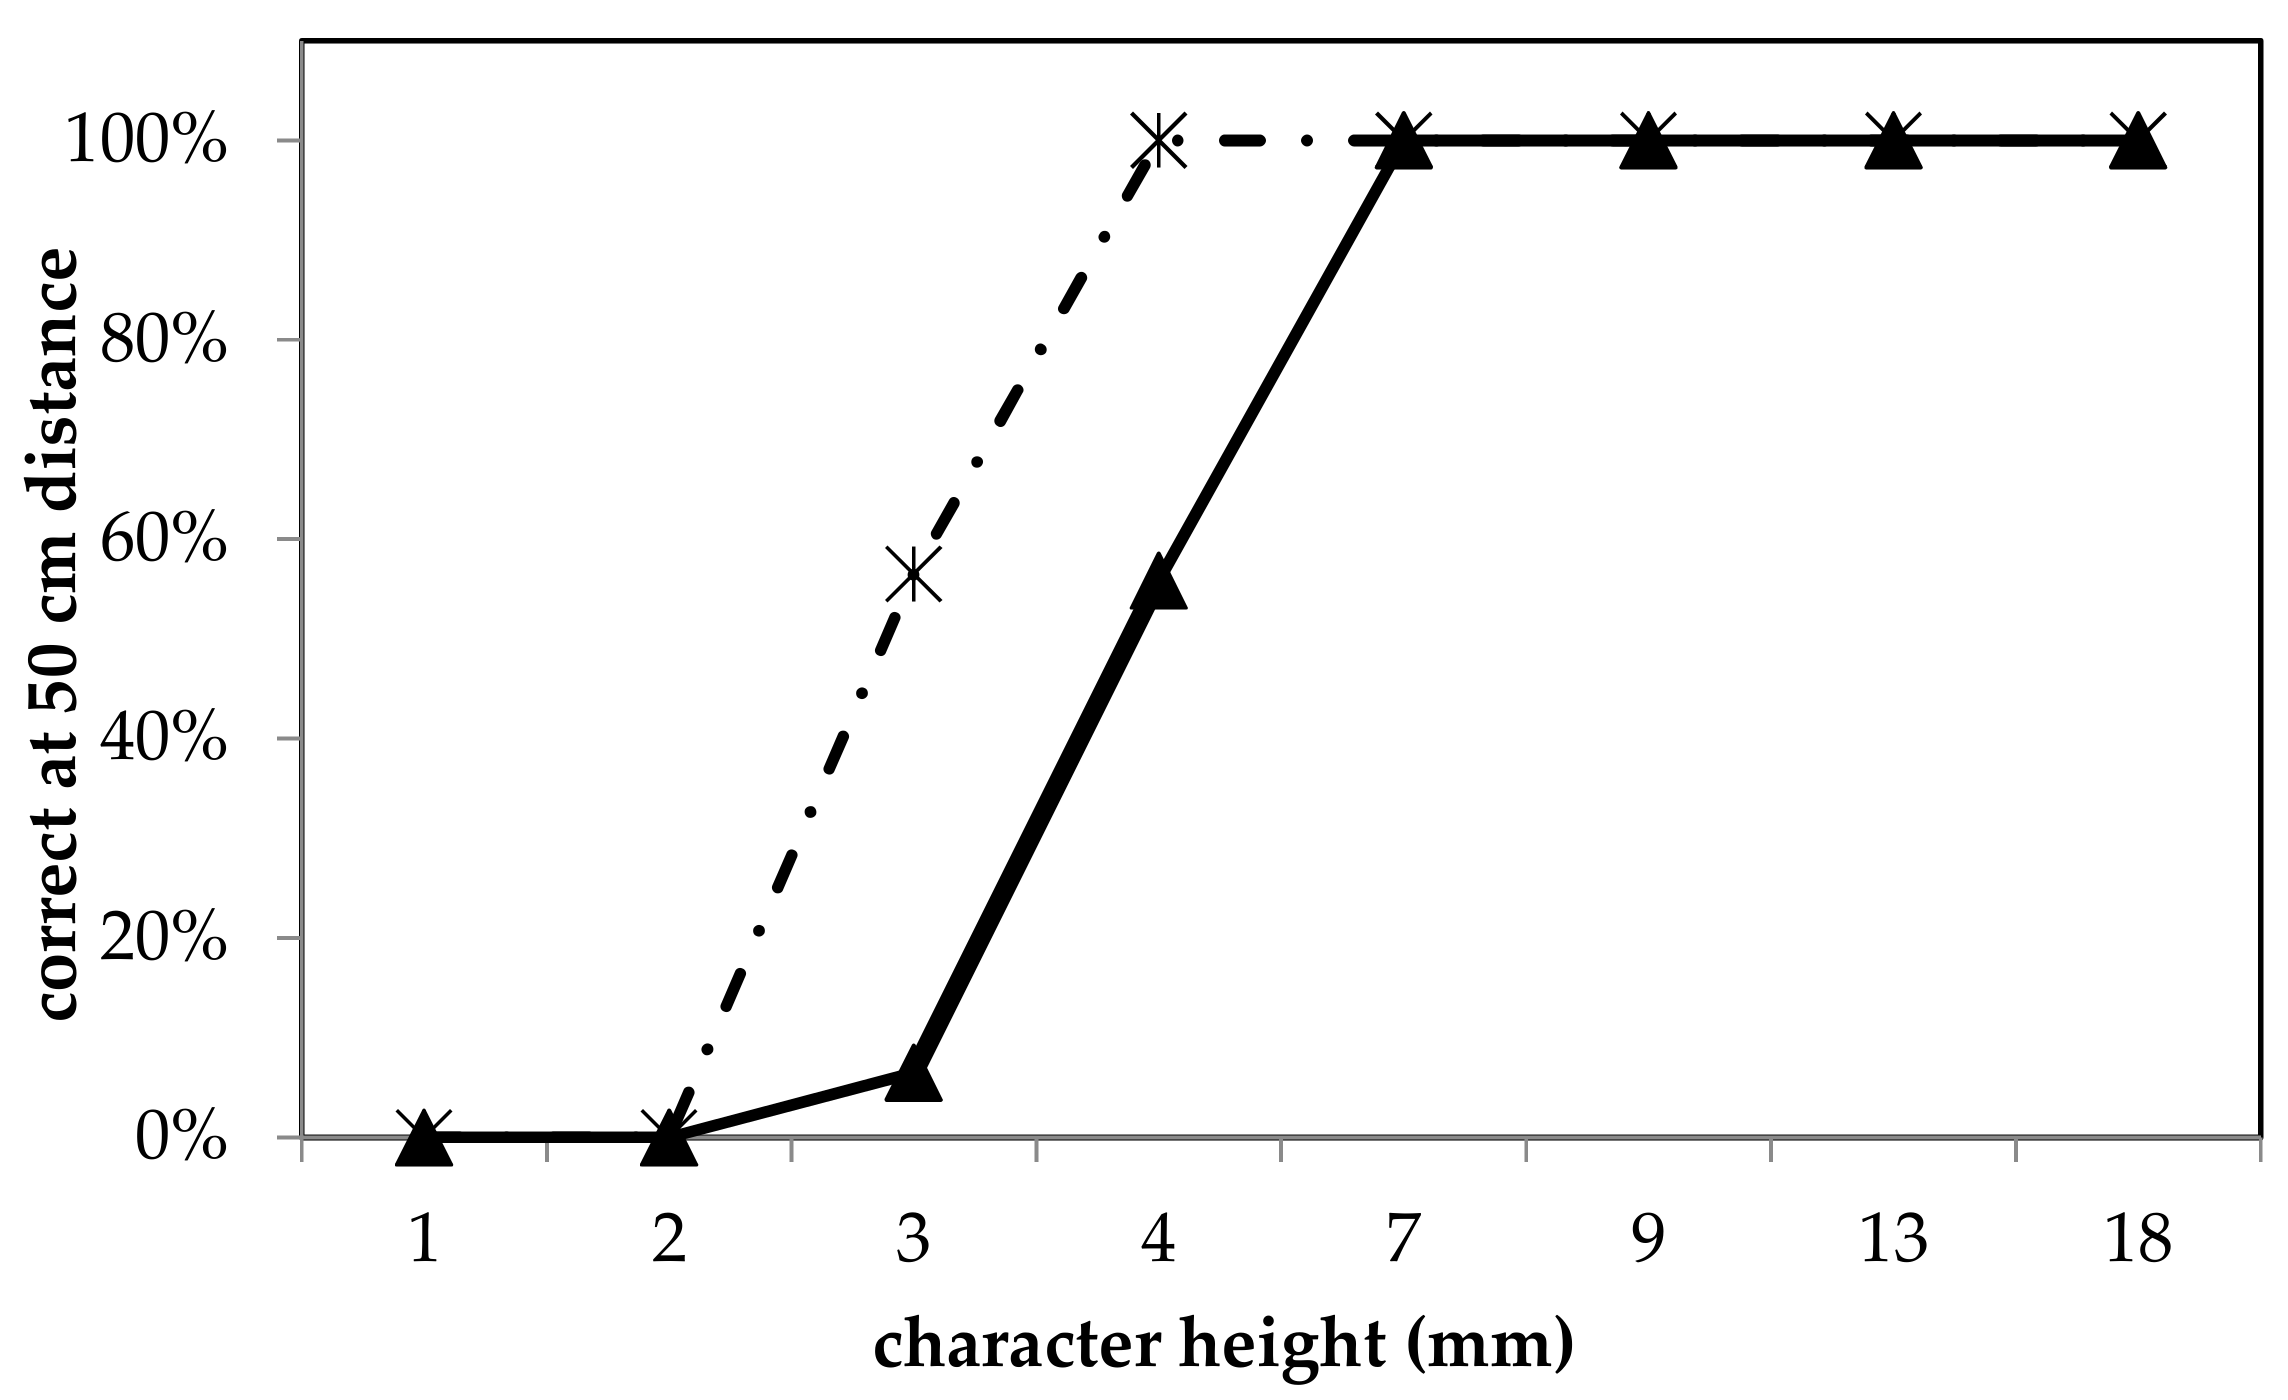
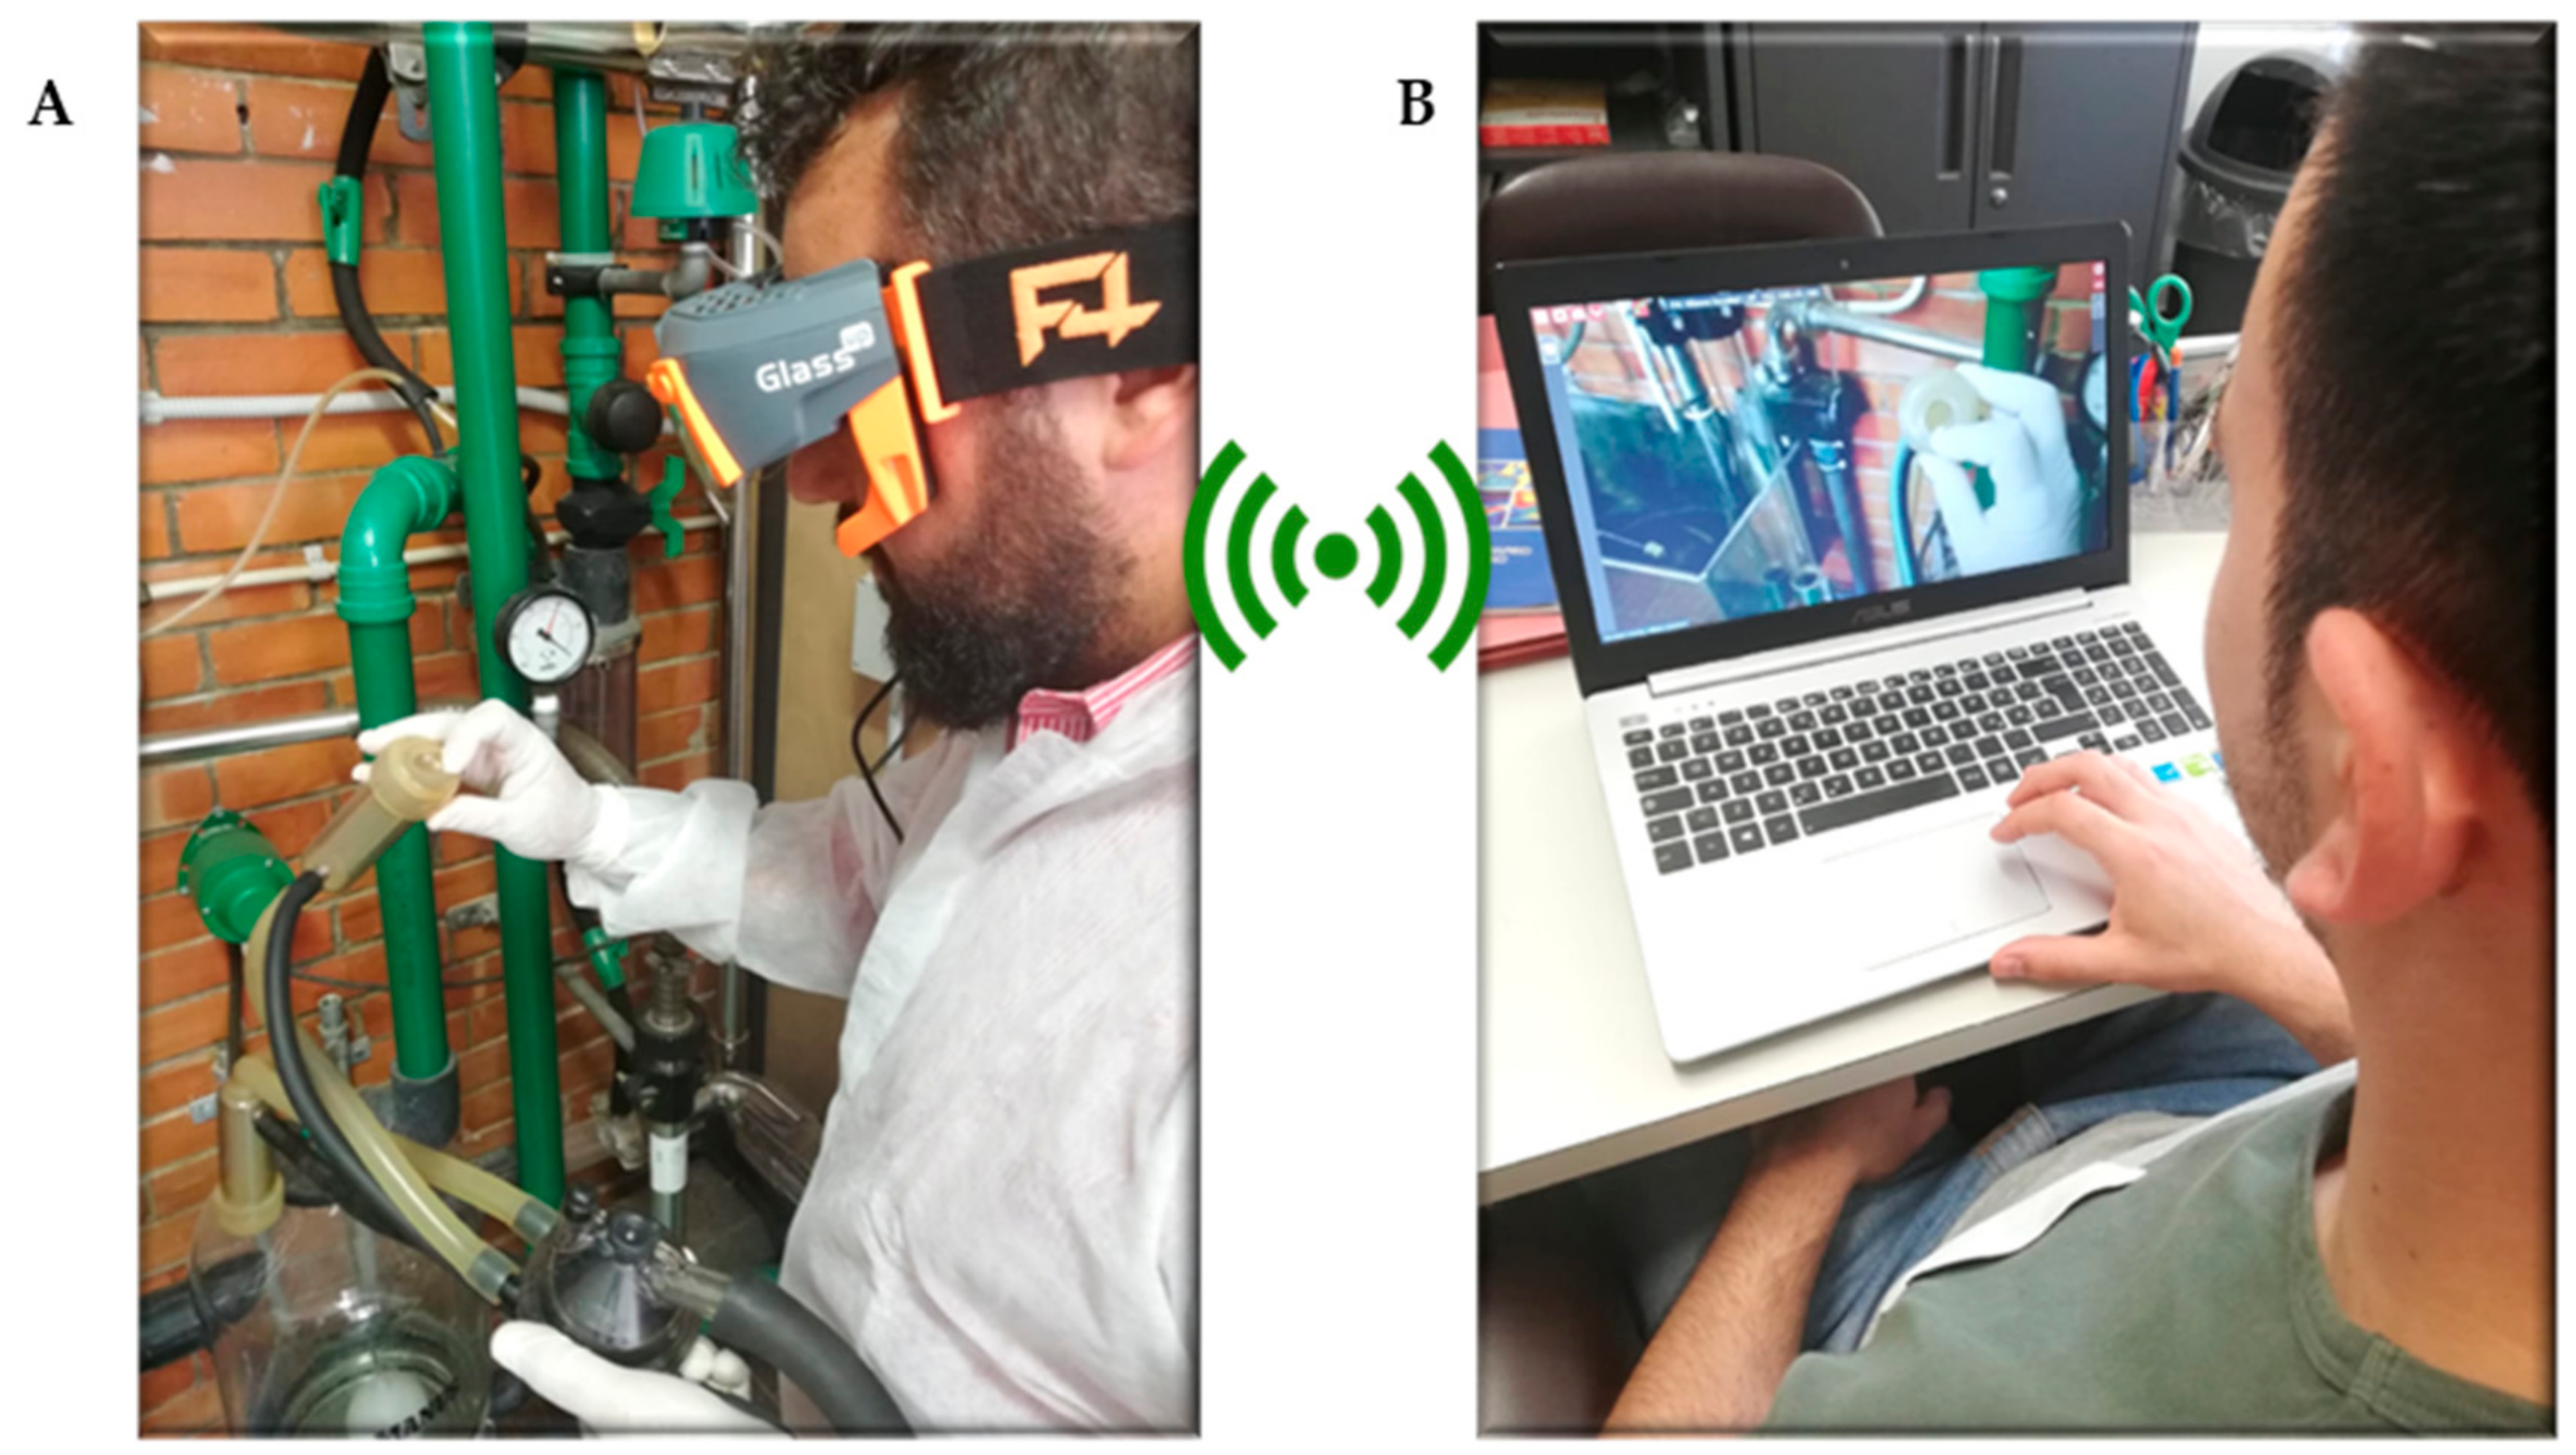
2.2.2. Vision Testing Through F4 Smart Glasses Via Remote Internet Connection
2.3. Battery Life
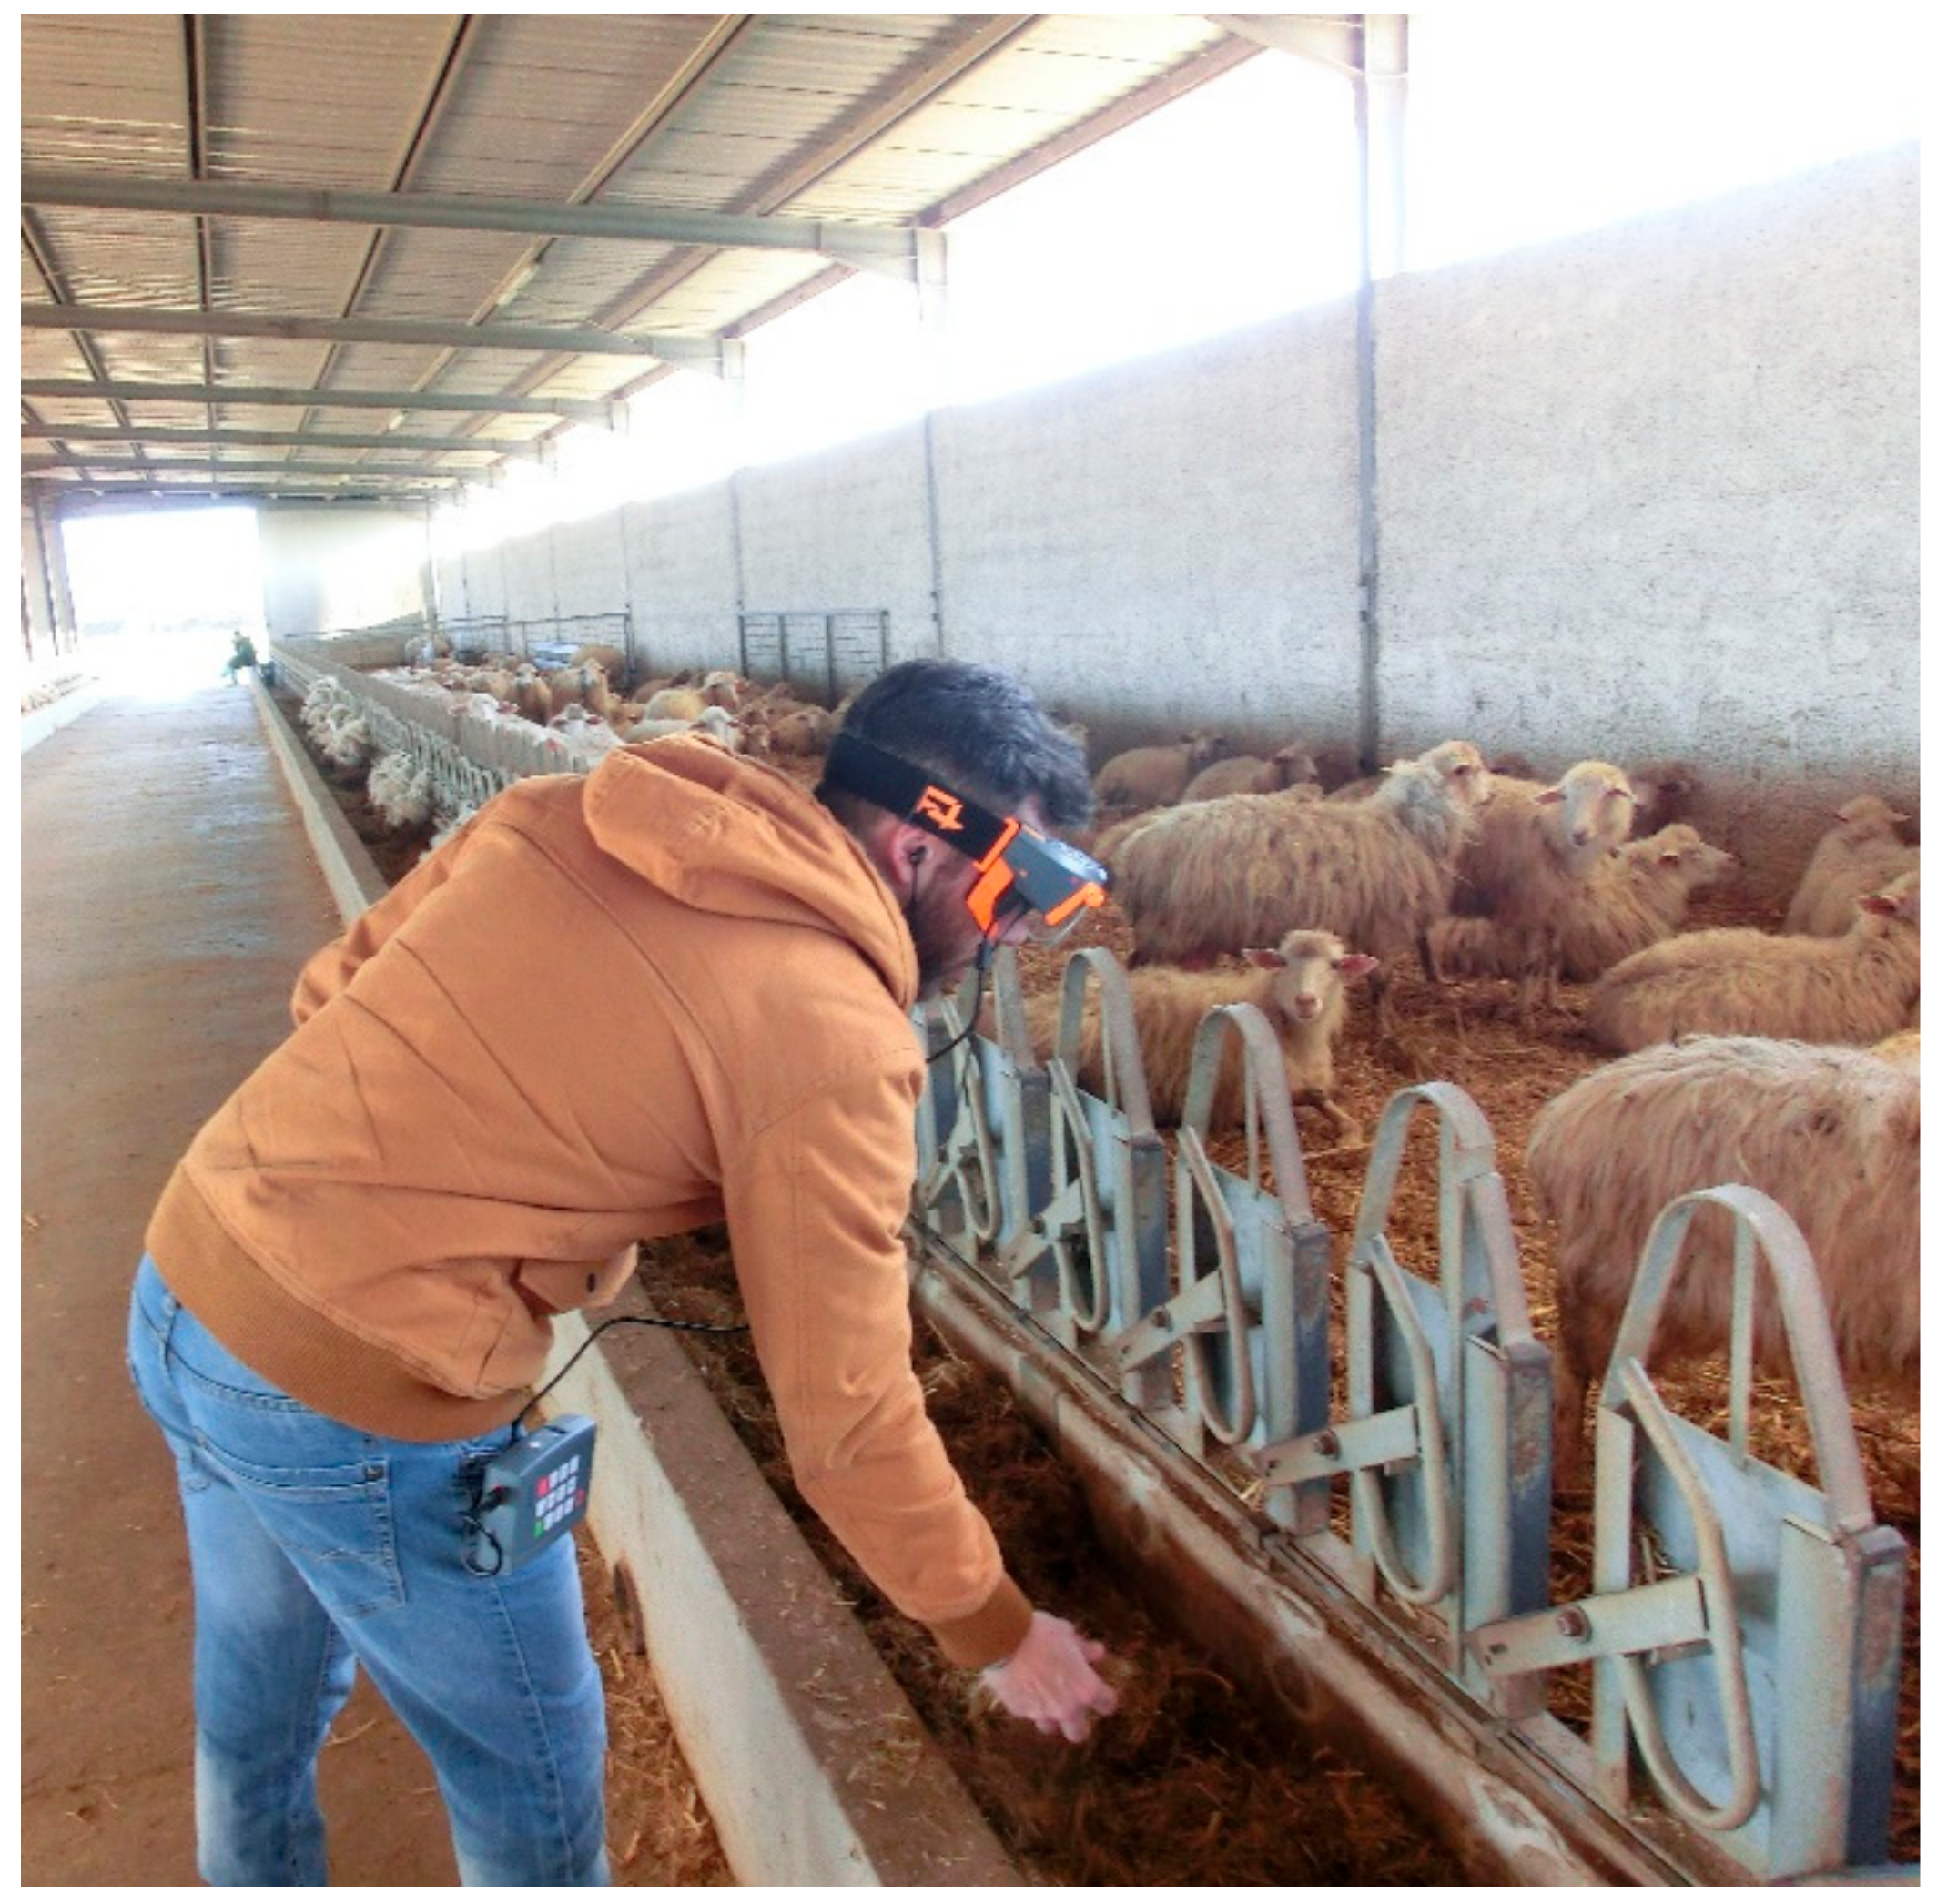
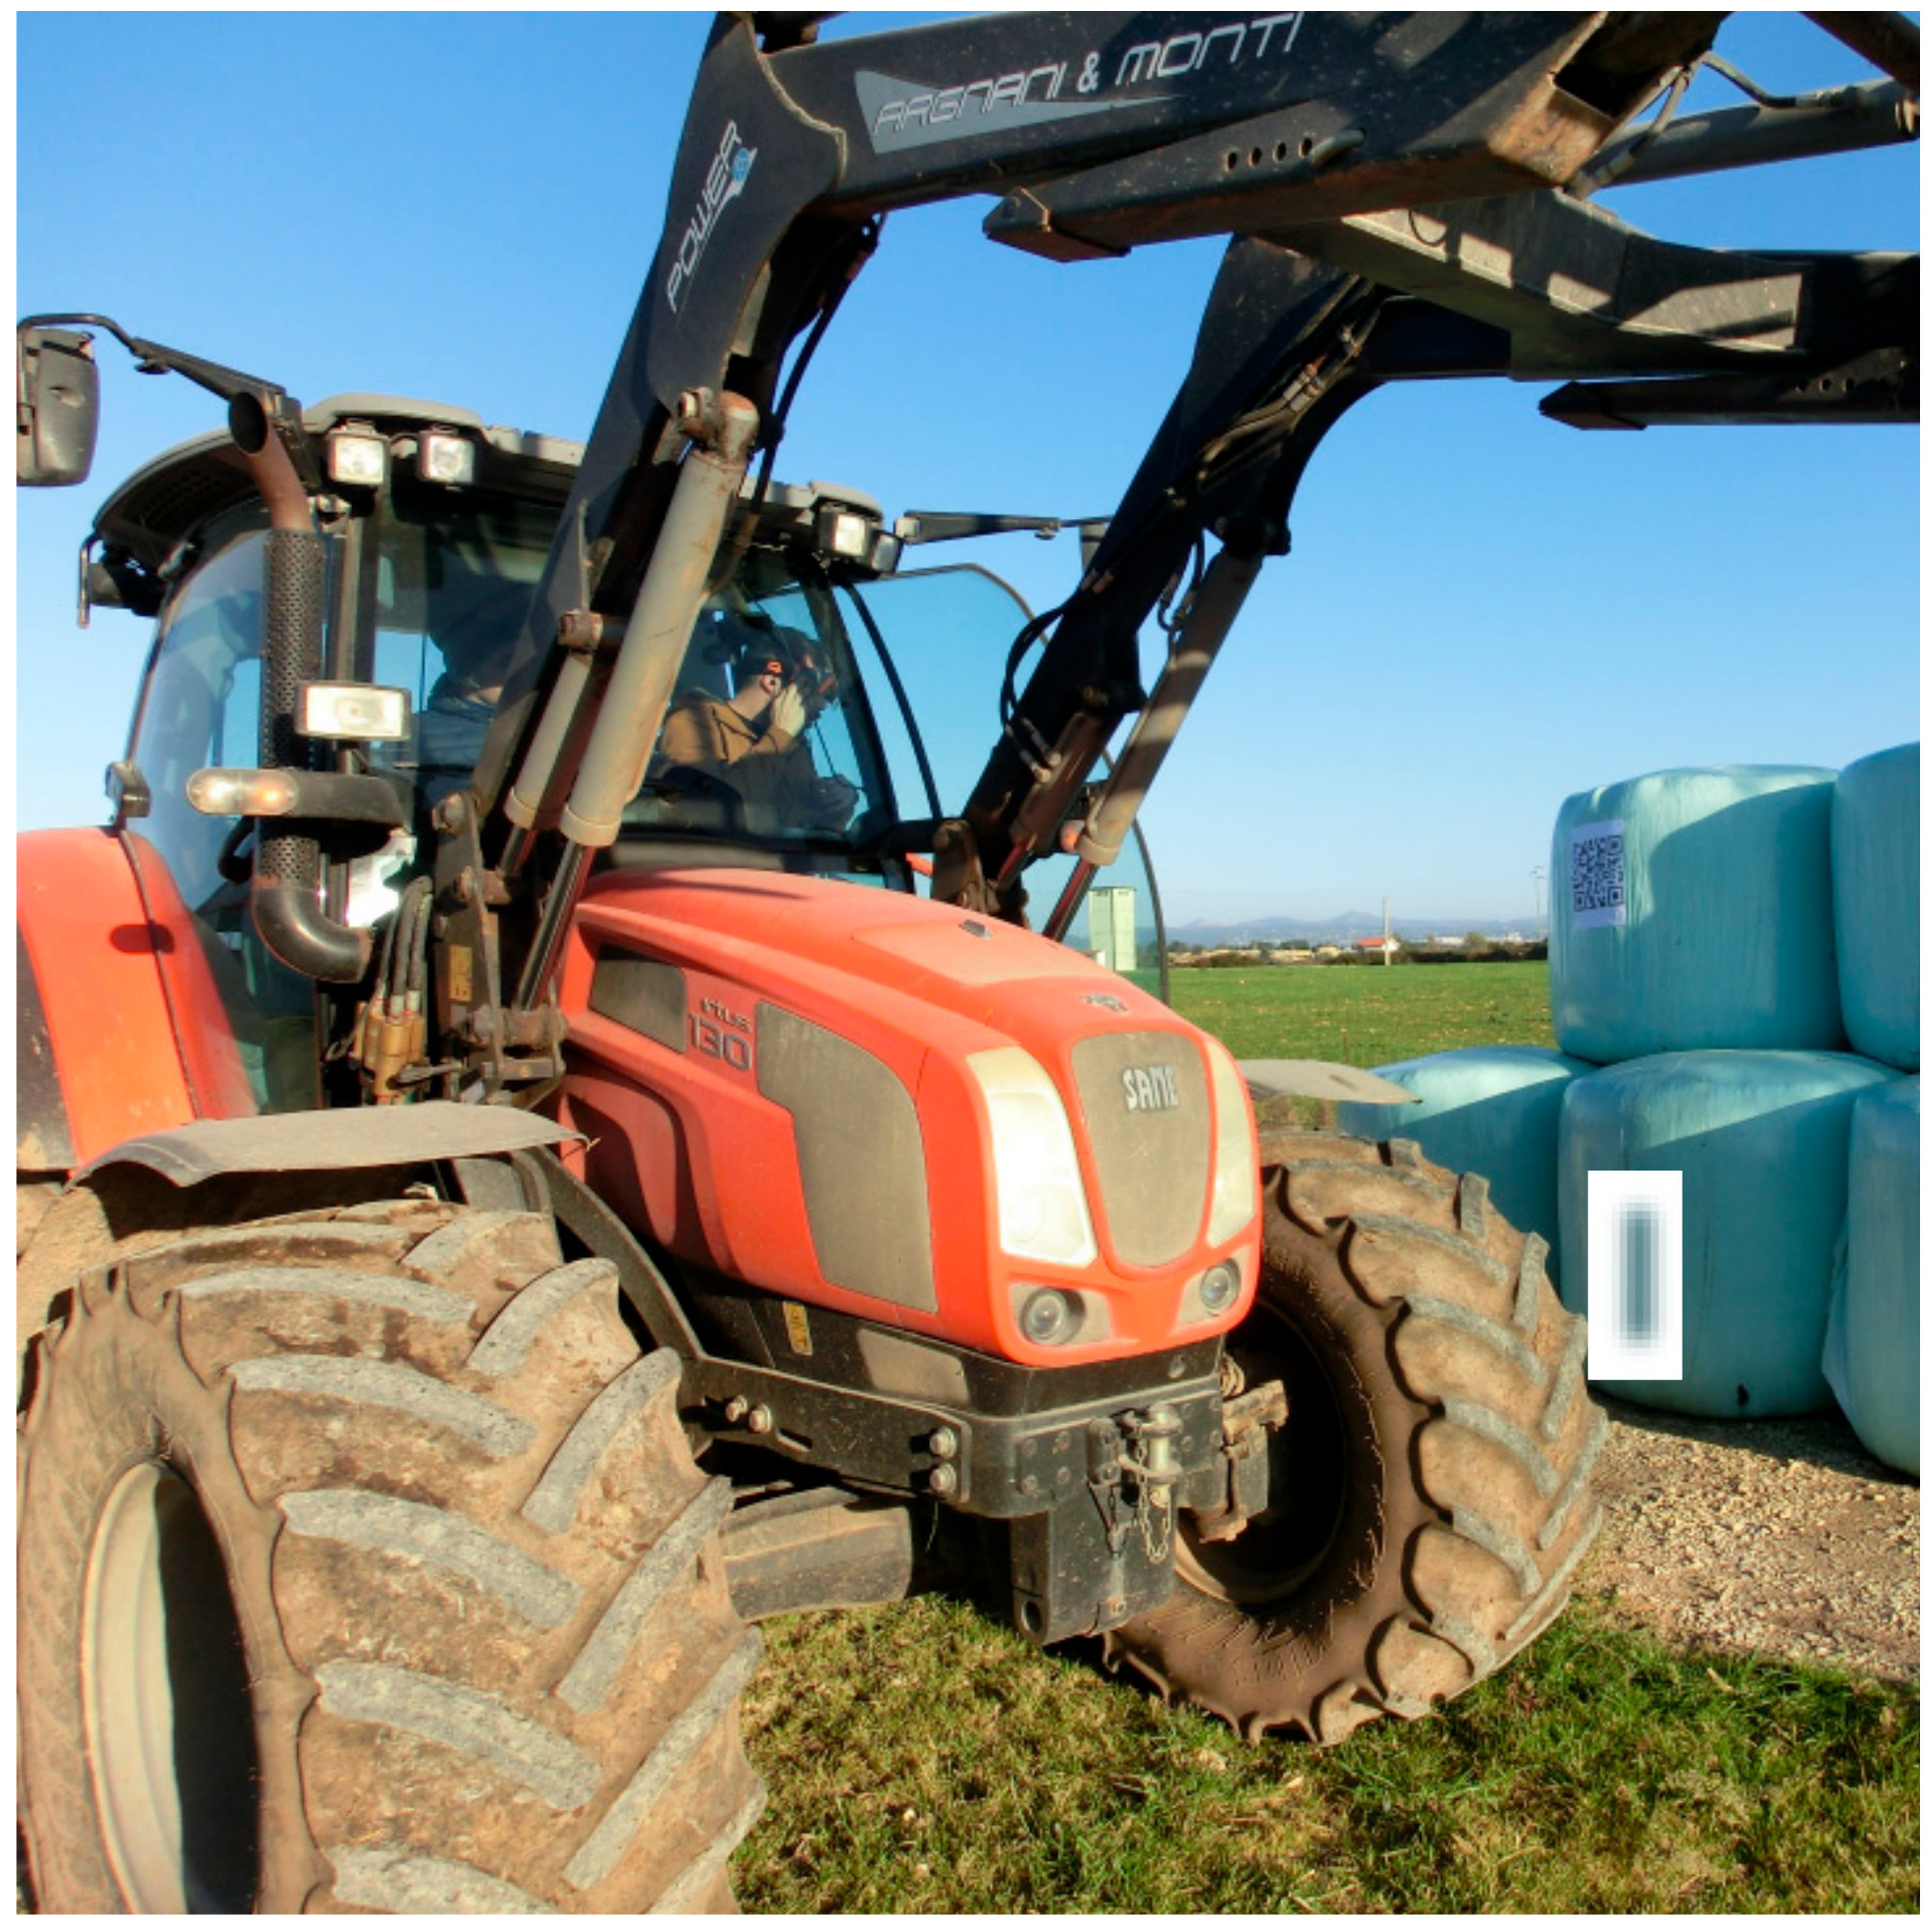
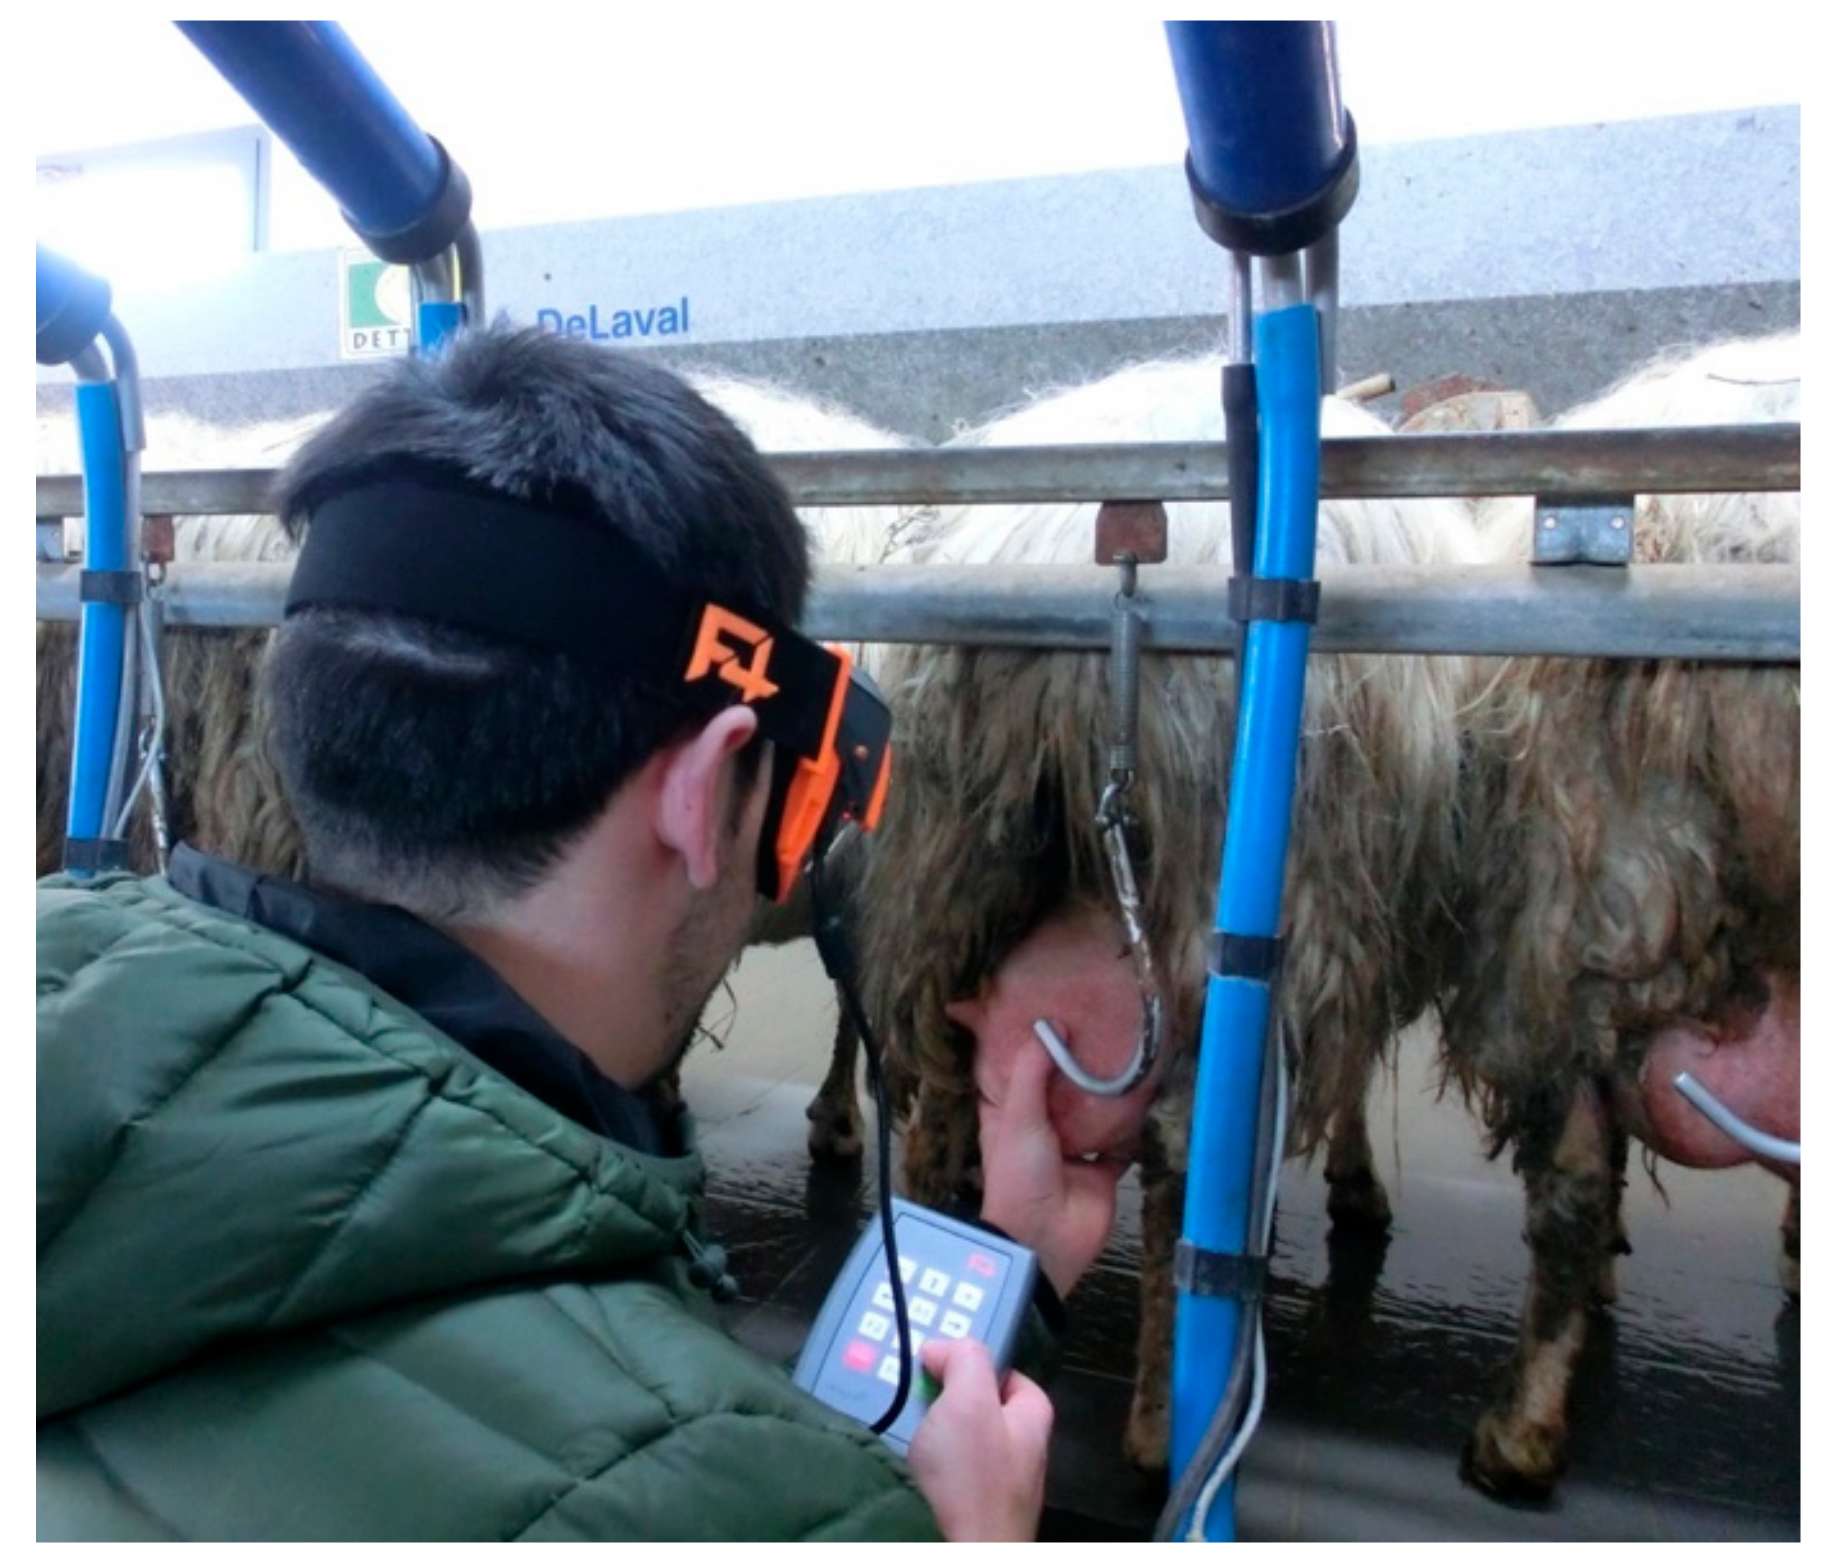
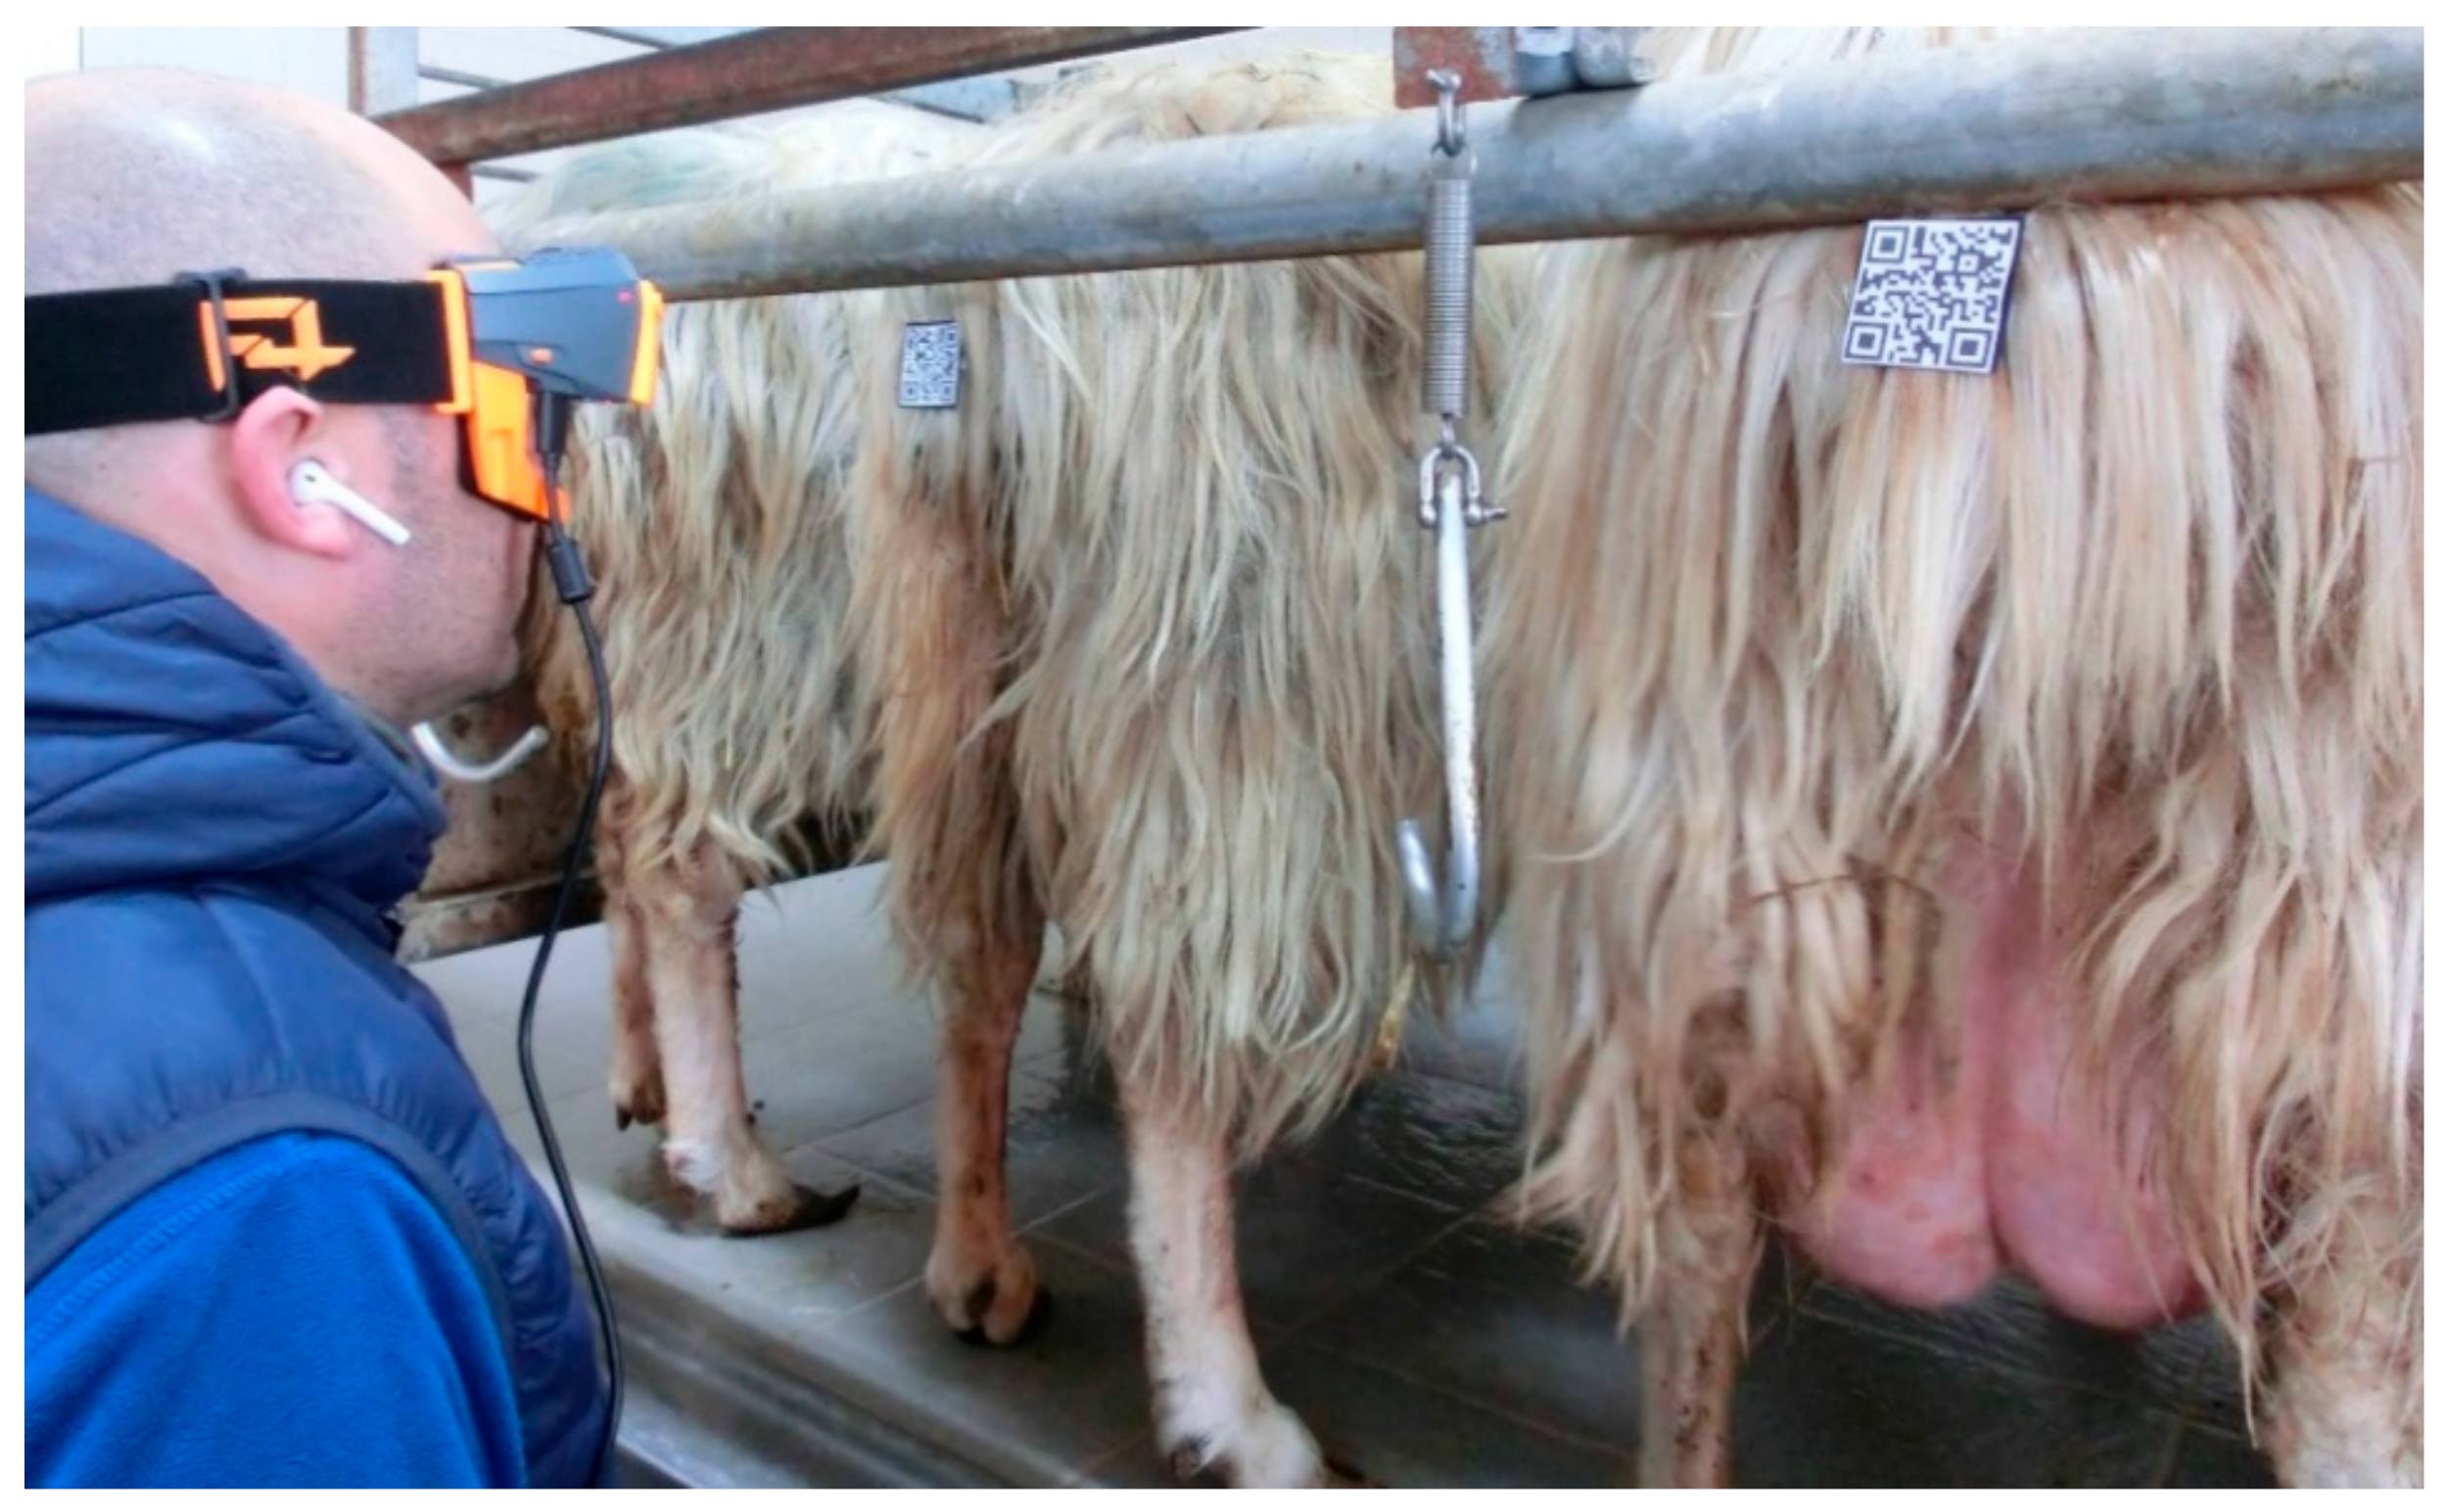
2.4. Farm Tests
2.5. Statistical Analysis
3. Results
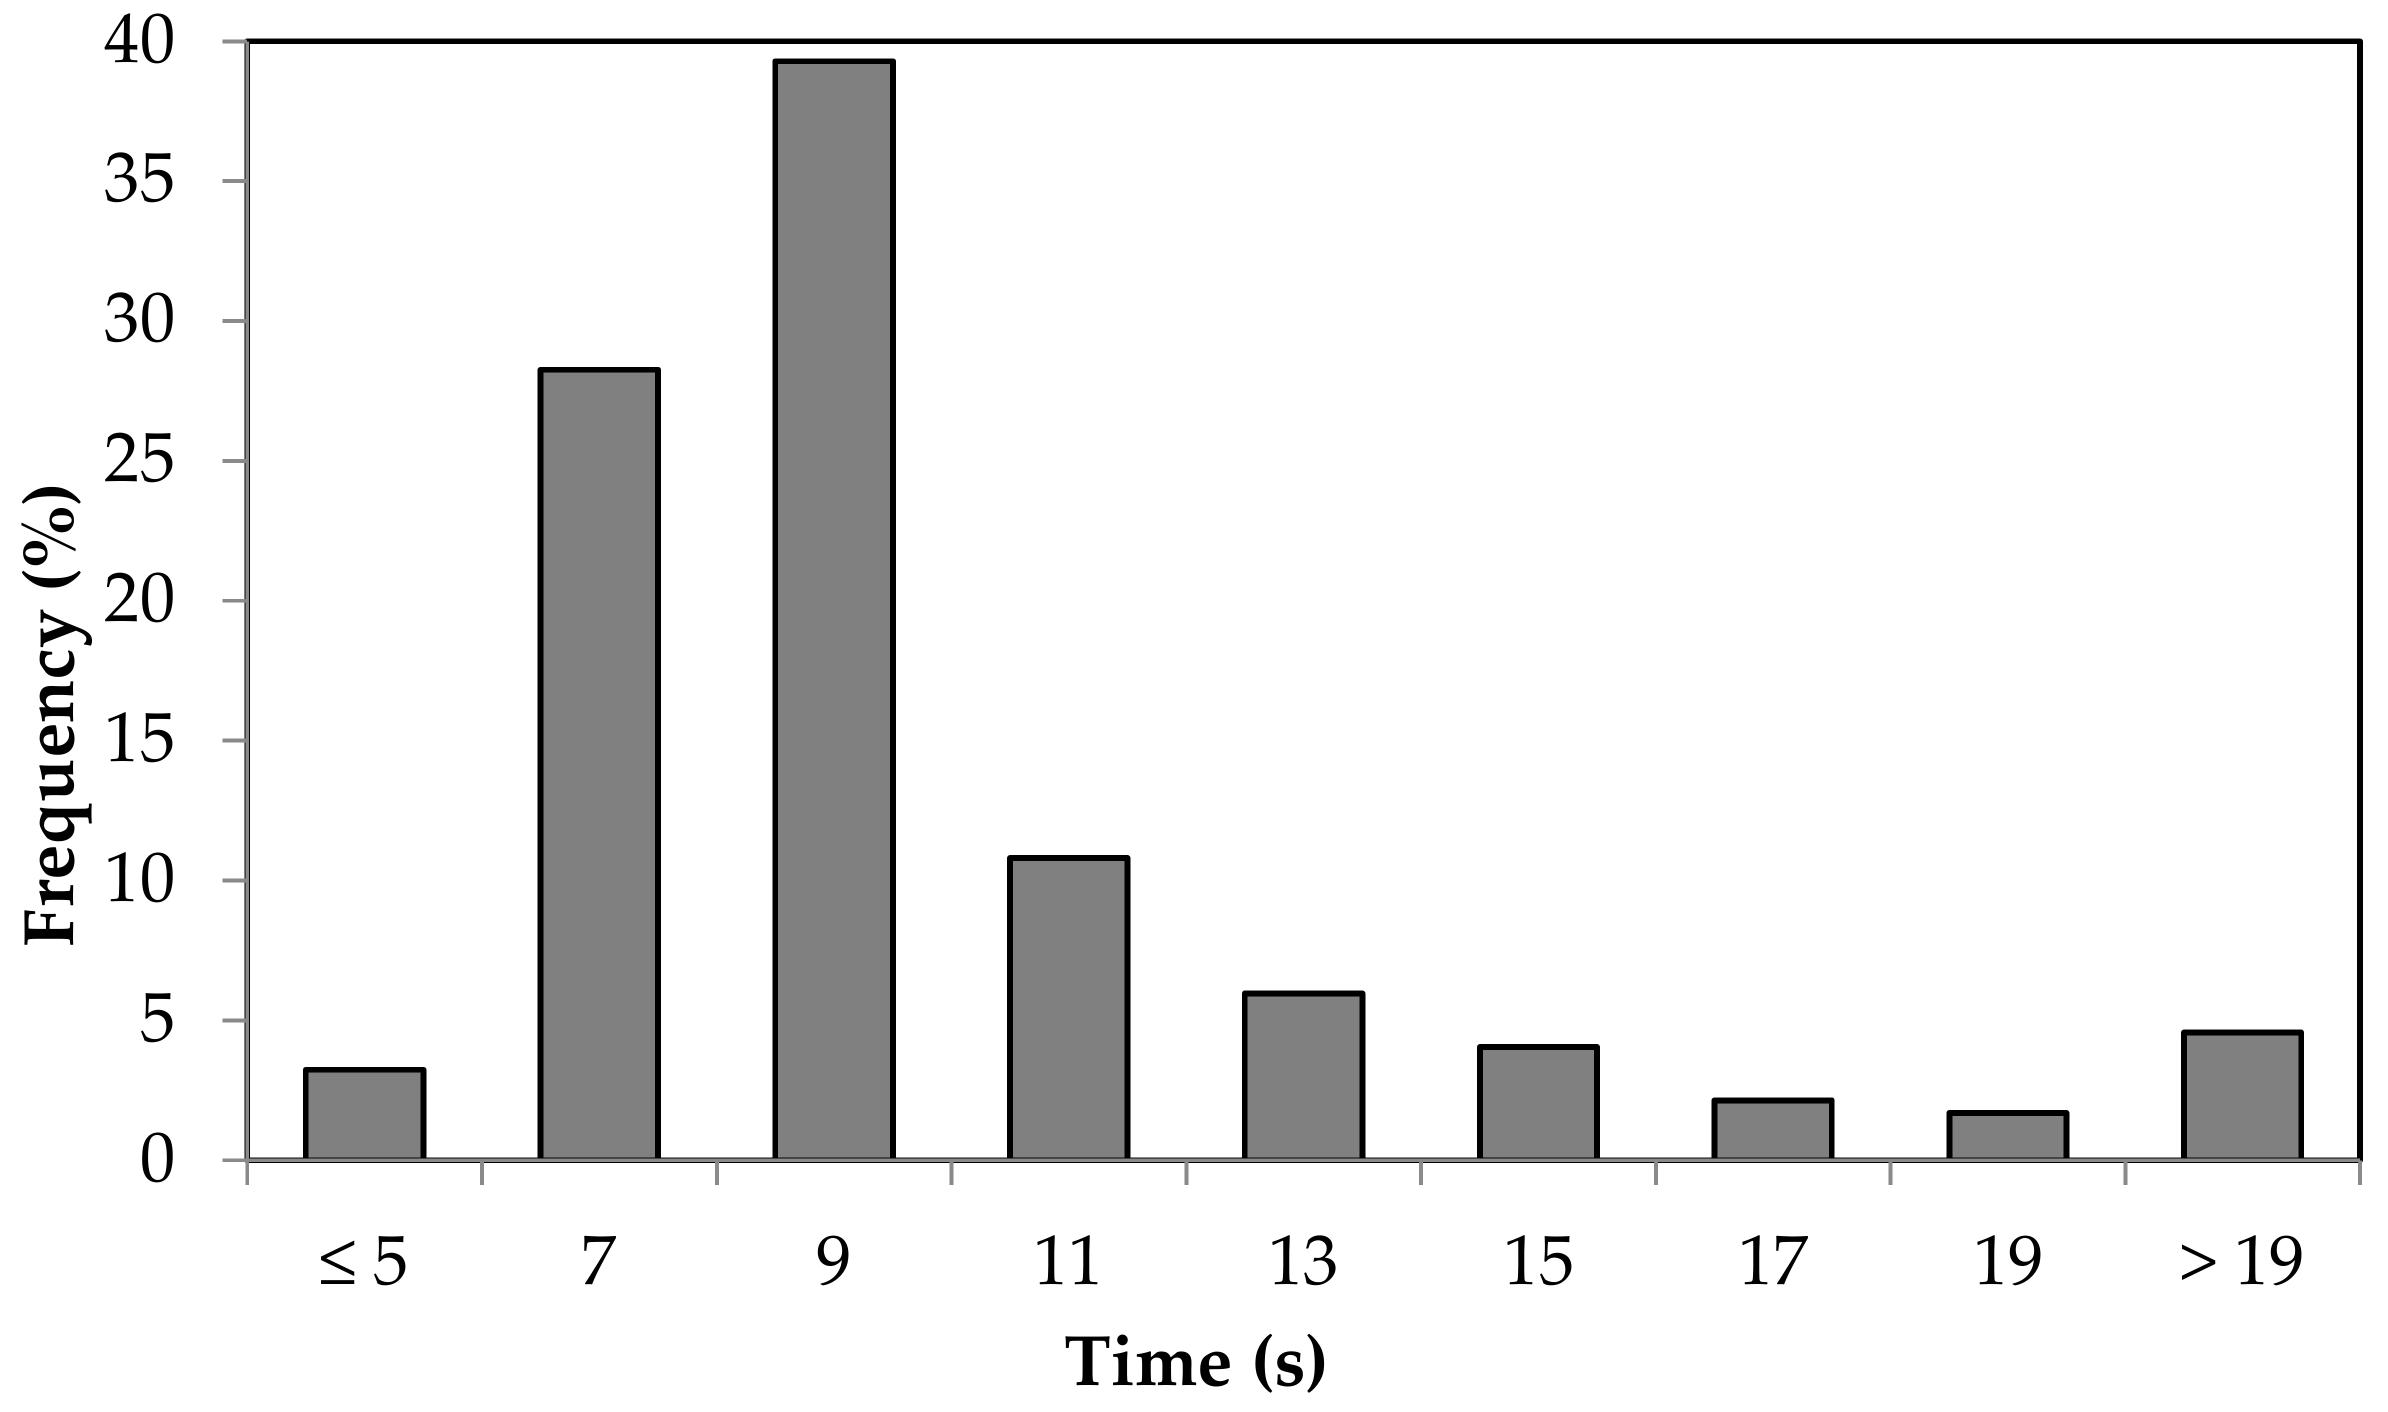
3.1. QR Code Scanning Time
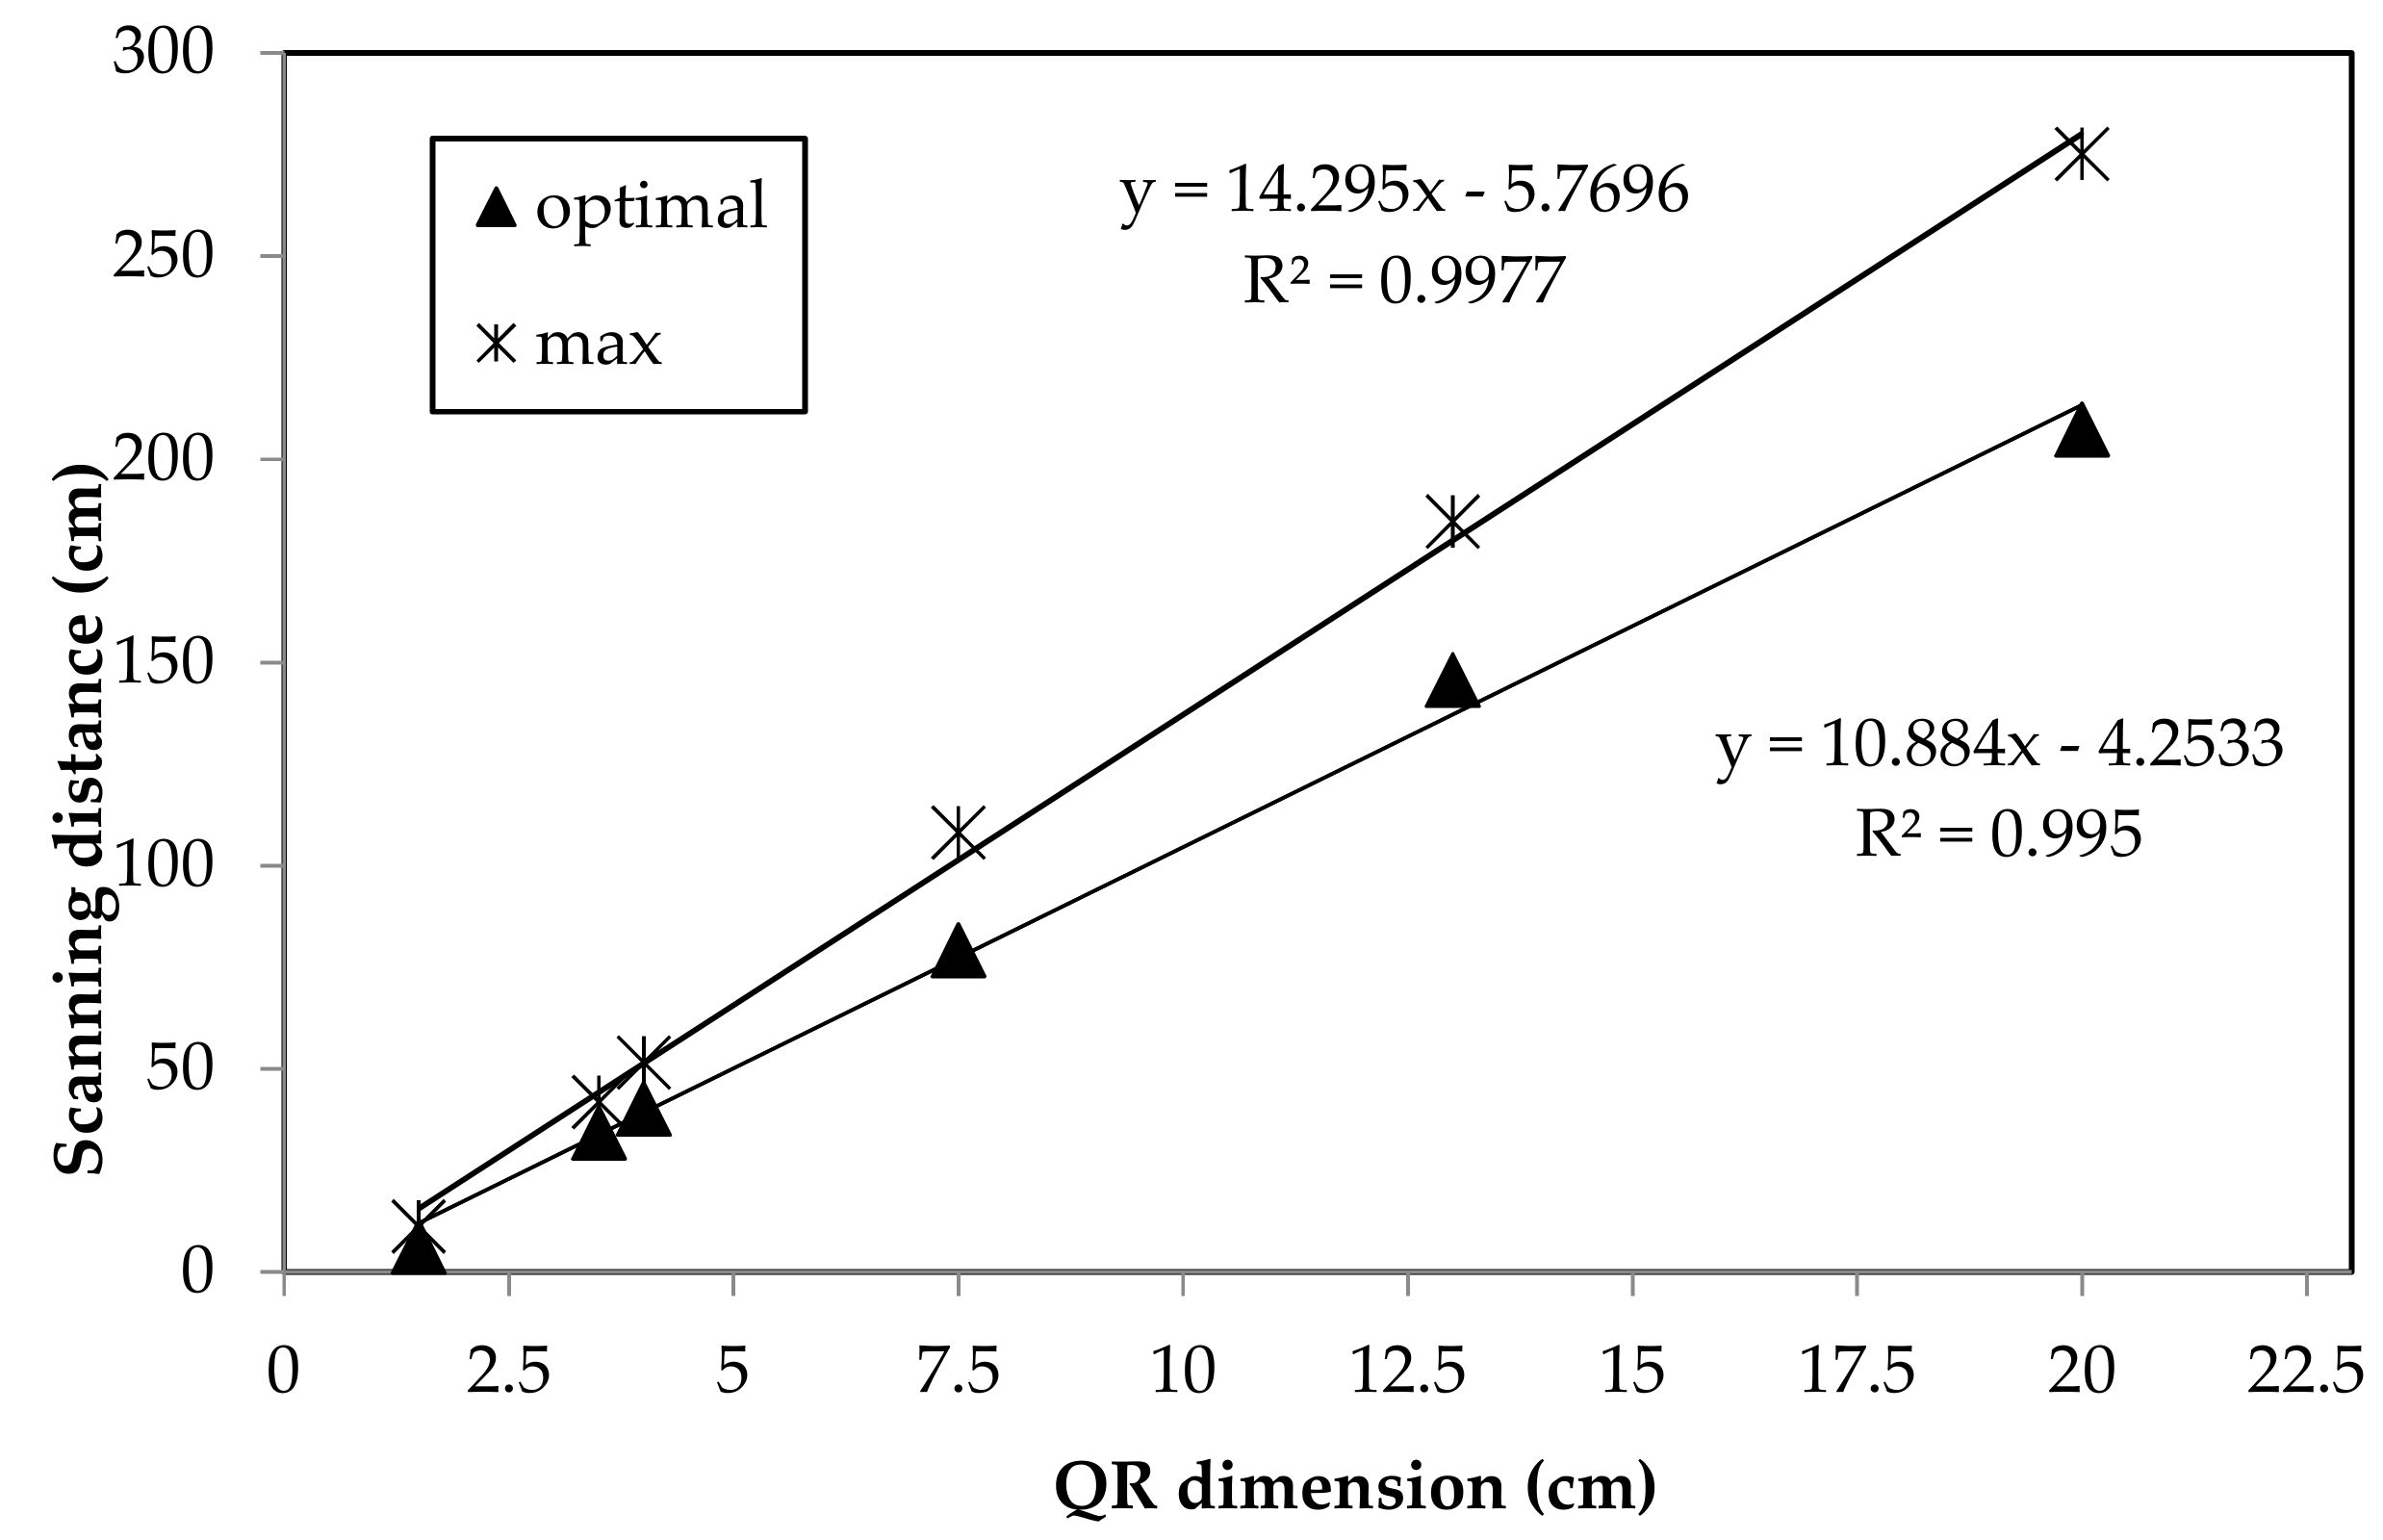
3.2. QR Code Scanning Distance
3.3. Battery Life
3.4. Audio-Video Quality
4. Discussion
5. Conclusions
Author Contributions
Funding
Acknowledgments
Conflicts of Interest
References
- Milgram, P.; Kishino, F. A Taxonomy of Mixed Reality Visual Display. IEICE Trans. Inf. Syst. 1994, 77, 1321–1329. [Google Scholar]
- Azuma, R.; Baillot, Y.; Behringer, R.; Feiner, S.; Julier, S.; MacIntyre, B. Recent advances in augmented reality. IEEE Comput. Graph. Appl. 2001, 21, 34–47. [Google Scholar] [CrossRef]
- Azuma, R. A survey of augmented reality. Presence Teleoper. Virtual Environ. 1997, 6, 355–385. [Google Scholar] [CrossRef]
- Höllerer, T.H.; Feiner, S.K. Mobile Augmented Reality. Telegeoinform. Locat. Based Comput. Serv. 2004, 21, 392–421. [Google Scholar]
- Lee, L.H.; Hui, P. Interaction Methods for Smart Glasses: A Survey. IEEE Access 2018, 6, 28712–28732. [Google Scholar] [CrossRef]
- Syberfeldt, A.; Danielsson, O.; Gustavsson, P. Augmented Reality Smart Glasses in the Smart Factory: Product Evaluation Guidelines and Review of Available Products. IEEE Access 2017, 5, 9118–9130. [Google Scholar] [CrossRef]
- Yuen, S.; Yaoyuneyong, G.; Johnson, E. Augmented reality: An overview and five directions for AR in education. J. Educ. Technol. Dev. Exch. 2011, 4, 119–140. [Google Scholar] [CrossRef]
- Billinghurst, M.; Clark, A.; Lee, G. A survey of augmented reality. Found. Trends Hum. Comput. Interact. 2015, 8, 73–272. [Google Scholar] [CrossRef]
- Bottani, E.; Vignali, G. Augmented reality technology in the manufacturing industry: A review of the last decade. IISE Trans. 2019, 51, 284–310. [Google Scholar] [CrossRef]
- Holata, L.; Plzák, J.; Svetlík, R.; Fonte, J. Integration of Low-Resolution ALS and Ground-Based SfM Photogrammetry Data. A Cost-Effective Approach Providing an “Enhanced 3D Model” of the Hound Tor Archaeological Landscapes (Dartmoor, South-West England). Remote Sens. 2018, 10, 1357. [Google Scholar] [CrossRef]
- Zhang, Y.; Yue, P.; Zhang, G.; Guan, T.; Lv, M.; Zhong, D. Augmented Reality Mapping of Rock Mass Discontinuities and Rockfall Susceptibility Based on Unmanned Aerial Vehicle Photogrammetry. Remote Sens. 2019, 11, 1311. [Google Scholar] [CrossRef]
- Cejka, J.; Bruno, F.; Skarlatos, D.; Liarokapis, F. Detecting Square Markers in Underwater Environments. Remote Sens. 2019, 11, 495. [Google Scholar] [CrossRef]
- Fan, Y.; Feng, Z.; Mannan, A.; Khan, T.U.; Shen, C.; Saeed, S. Estimating Tree Position, Diameter at Breast Height, and Tree Height in Real-Time Using a Mobile Phone with RGB-D SLAM. Remote Sens. 2018, 10, 1845. [Google Scholar] [CrossRef]
- King, G.R.; Piekarski, W.; Thomas, B.H. ARVino–Outdoor Augmented Reality Visualization of Viticulture GIS Data. In Proceedings of the 4th IEEE/ACM International Symposium on Mixed and Augmented Reality, Washington, DC, USA, 5–8 October 2005; pp. 52–55. [Google Scholar]
- Santana-Fernández, J.; Gómez-Gil, J.; Del-Pozo-San-Cirilo, L. Design and implementation of a GPS guidance system for agriculture tractors using augmented reality technology. Sensors 2010, 10, 10435–10447. [Google Scholar] [CrossRef]
- Vidal, N.R.; Vidal, R.A. Augmented reality systems for weed economic thresholds applications. Planta Daninha 2010, 28, 449–454. [Google Scholar] [CrossRef]
- De Castro Neto, M.; Cardoso, P. Augmented Reality Greenhouse. In Proceedings of the EFITA-WCCA-CIGR Conference “Sustainable Agriculture through ICT Innovation”, Turin, Italy, 24–27 June 2013. [Google Scholar]
- Liu, M.; Li, X.; Lei, X.; Wu, S. Research of mobile augmented reality technology applied in agriculture. In Proceedings of the International Conference on Advanced Computer Science and Electronic Information (ICACSEI), Beijing, China, 25 July 2013; pp. 311–315. [Google Scholar]
- Katsaros, A.; Keramopulos, E.; Salampasis, M. A Prototype Application for Cultivation Optimization Using Augmented Reality. CEUR Workshop. In Proceedings of the 8th International Conference on Information and Communication Technologies in Agriculture, Chania, Crete Island, Greece, 21–24 September 2017. [Google Scholar]
- Cupial, M. Augmented reality in agriculture. In Proceedings of the 5th International Scientific Symposium: Farm Machinery and Process Management in Sustainable Agriculture, Lublin, Poland, 23–24 November 2011; pp. 23–24. [Google Scholar]
- Huuskonen, J.; Oksanen, T. Soil sampling with drones and augmented reality in precision agriculture. Comput. Electron. Agric. 2018, 154, 25–35. [Google Scholar] [CrossRef]
- Okayama, T.; Miyawaki, K. The “Smart Garden” using Augmented Reality. IFAC Proc. Vol. 2013, 46, 307–310. [Google Scholar] [CrossRef]
- Fournel, S.; Rousseau, A.; Laberge, B. Rethinking environment control strategy of confined animal housing systems through precision livestock farming. Biosyst. Eng. 2017, 155, 96–123. [Google Scholar] [CrossRef]
- King, T.M.; LeBlanc, S.J.; Pajor, E.A.; Wright, T.C.; DeVries, T.J. Behaviour and productivity of cows milked in automated systems before diagnosis of health disorders in early lactation. J. Dairy Sci. 2018, 101, 4343–4356. [Google Scholar] [CrossRef]
- Caria, M.; Todde, G.; Pazzona, A. Evaluation of automated in-line precision dairy farming technology implementation in three dairy farms in Italy. Front Agric. Sci. Eng. 2019, 6, 181–187. [Google Scholar] [CrossRef]
- Halachmi, I.; Guarino, M.; Bewley, J.; Pastell, M. Smart Animal Agriculture: Application of Real-Time Sensors to Improve Animal Well-Being and Production. Annu. Rev. Anim. Biosci. 2019, 7, 403–425. [Google Scholar] [CrossRef] [PubMed]
- Caria, M.; Boselli, C.; Murgia, L.; Rosati, R.; Pazzona, A. Influence of low vacuum levels on milking characteristics of sheep, goat and buffalo. J. Agric. Eng. 2013, 44, 217–220. [Google Scholar] [CrossRef]
- Todde, G.; Caria, M.; Gambella, F.; Pazzona, A. Energy and Carbon Impact of Precision Livestock Farming Technologies Implementation in the Milk Chain: From Dairy Farm to Cheese Factory. Agriculture 2017, 7, 79. [Google Scholar] [CrossRef]
- Tullo, E.; Finzi, A.; Guarino, M. Environmental impact of livestock farming and Precision Livestock Farming as a mitigation strategy. Sci. Total Environ. 2019, 650, 2751–2760. [Google Scholar] [CrossRef] [PubMed]
- Todde, G.; Murgia, L.; Caria, M.; Pazzona, A. A multivariate statistical analysis approach to characterize mechanization, structural and energy profile in Italian dairy farms. Energy Rep. 2016, 2, 129–134. [Google Scholar] [CrossRef]
- Wathes, C.M.; Kristensenb, H.H.; Aertsc, J.M.; Berckmans, D. Is precision livestock farming an engineer’s daydream or nightmare, an animal’s friend or foe, and a farmer’s panacea or pitfall? Comput. Electron. Agric. 2008, 64, 2–10. [Google Scholar] [CrossRef]
- Denso Wave. Available online: https://www.qrcode.com/en/history/ (accessed on 12 June 2019).
- Furht, B. Handbook of Augmented Reality; Springer: New York, NY, USA, 2011; p. 341. ISBN 9781461400646. [Google Scholar]
- Muensterer, O.J.; Lacher, M.; Zoeller, C.; Bronstein, M.; Kübler, J. Google Glass in paediatric surgery: An exploratory study. Int. J. Surg. 2014, 12, 281–289. [Google Scholar] [CrossRef]
- Qian, J.; Du, X.; Zhang, B.; Fan, B.; Yang, X. Optimization of QR code readability in movement state using response surface methodology for implementing continuous chain traceability. Comput. Electron. Agric. 2017, 139, 56–64. [Google Scholar] [CrossRef]
- Zaninelli, M. Development and Testing of a Device to Increase the Level of Automation of a Conventional Milking Parlor through Vocal Commands. Agriculture 2017, 7, 3. [Google Scholar] [CrossRef]
- Ferreira, M.C.; Fontes, T.; Vera, C.; Dias, T.G.; Borges, J.L.; Cunha, J.F. Evaluation of an integrated mobile payment, route planner and social network solution for public transport. In Proceedings of the Transport Res Procedia, 3re Conference on Sustainable Urban Mobility, Volos, Greece, 26–27 May 2016. [Google Scholar]
- Obeidy, W.K.; Arshad, H.; Huang, J.Y. An Acceptance Model for Smart Glasses based Tourism Augmented Reality. In Proceedings of the AIP Conference 1891, 020080, The 2nd International Conference on Applied Science and Technology, Kedah, Malaysia, 3–5 April 2017. [Google Scholar] [CrossRef]
- Rese, A.; Baier, D.; Geyer-Schulz, A.; Schreiber, S. How augmented reality apps are accepted by consumers: A comparative analysis using scales and opinions. Technol. Forecast. Soc. 2017, 124, 306–319. [Google Scholar] [CrossRef]
- Wild, F.; Klemke, R.; Lefrere, P.; Fominykh, M.; Kuula, T. Technology acceptance of augmented reality and wearable technologies. In Proceedings of the Communications in Computer and Information Science, 3rd International Conference on Immersive Learning Research Network, Coimbra, Portugal, 26–29 June 2017. [Google Scholar]
- Jacobs, J.V.; Hettinger, L.J.; Huang, Y.H.; Jeffries, S.; Lesch, T.M.F.; Simmons, L.A.; Verma, S.K.; Willetts, J.L. Employee acceptance of wearable technology in the workplace. Appl. Ergon. 2019, 78, 148–156. [Google Scholar] [CrossRef] [PubMed]
- Manis, K.T.; Choi, D. The virtual reality hardware acceptance model (VR-HAM): Extending and T individuating the technology acceptance model (TAM) for virtual reality hardware. J. Bus. Res. 2019, 100, 503–513. [Google Scholar] [CrossRef]
- Yoon, J.W.; Chen, R.E.; Kim, E.J.; Akinduro, O.O.; Kerezoudis, P.; Han, P.; Si, P.; Freeman, W.D.; Diaz, R.J.; Komotar, R.J.; et al. Augmented reality for the surgeon: Systematic review. Int. J. Med. Robot. Comput. Assist. Surg. 2017, 14, 1914. [Google Scholar] [CrossRef] [PubMed]


| Item | Technical Features |
|---|---|
| Processor | Cortex A9 |
| Flash memory | 8 Gigabytes |
| Operating System on board | Linux |
| Display | Color filter Active Matrix LCD (on right eye) Full color 640 × 480 pixel (VGA) |
| Sensors | Accelerometer (9 axis), gyroscope, compass, temperature and lux sensors |
| Connectivity | WiFi, Bluetooth |
| Camera | Full Color, 5 Mpixels, 15 FPS |
| Battery | Li-Polymer 5000 mAh |
| Operating temperature | 5–35 °C |
| Weight (glasses) | 251 g |
| International Protection (IP) | 31 |
| QR Code Size (cm) | ST (s) | SD | Min ST (s) | Max ST (s) | Tot. scan (N°) |
|---|---|---|---|---|---|
| 3.5 | 11.0 a | 5.7 | 4.1 | 34.7 | 1143 |
| 4.0 | 8.6 b | 3.8 | 4.2 | 33.9 | 1194 |
| 7.5 | 7.7 c | 2.8 | 3.9 | 28.3 | 1152 |
| Operator | ST (s) | SD | Min ST (s) | Max ST (s) |
|---|---|---|---|---|
| a | 9.4 a | 5.0 | 4.3 | 34.7 |
| b | 8.7 b | 4.1 | 3.9 | 33.2 |
| c | 9.1 a | 4.1 | 4.1 | 33.6 |
| Battery Life (h) | ||||||
|---|---|---|---|---|---|---|
| Level 4 | Level 3 | Level 2 | Level 1 | Level 0 | Total Battery Life | |
| Scan-code | 1.11 ± 0.41 | 1.89 ± 0.26 | 1.02 ± 0.45 | 0.98 ± 0.32 | 1.86 ± 1.12 | 6.87 ± 0.42 |
| Video call | 1.45 ± 0.33 | 2.13 ± 0.42 | 1.26 ± 0.29 | 1.33 ± 0.31 | 0.83 ± 0.58 | 7.01 ± 0.33 |
| Smart Glasses F4 Functions | Applications | Examples |
|---|---|---|
| QR code scanning | Single subject identification | In livestock farms could help farmers to identify the animals and its productive data. Identify feedstock composition to improve feeding strategies. Retrieve fleet equipment information about history, maintenance, activity, etc. |
| VoIP call | Hands-free calling | The farmers could make hands-free calling while working, providing and/or receiving business and operative information on-the-go |
| Video streaming | Remote assistance while working | The farmer could share his point of view (live sharing) with a technician in real-time during maintenance procedures of equipment (e.g., milking parlor inspections) |
| Image acquisition | Photo capture and editing | During animal selection, farmers can take picture through the smart glasses to save the animal phenotypic relevant features. Photo acquisition may be also useful to underline the characteristics of spare parts of farm’s equipment. Photos may also be edited from the dashboard |
| Video-Audio recording | Video acquisition and saving | Recording and saving video off-line about different situations as system decision support tool; from animal diseases’ symptoms to systems’ anomalies. |
| Audio recording | Save notes and memorandum | The tractor driver could record voice annotation about on-farm procedures and draft by voice a checklist, while solving field operations. |
| File consulting | Audio, video, photo and text accessing during farm activities | Hands-free and immediate access to animal information (productions, health status, identification number, etc.). Tractor’s handbook consulting for maintenance support. This function allows to follow the on-screen instruction for problem solving or to recall and rapidly visualize the needed information. |
© 2019 by the authors. Licensee MDPI, Basel, Switzerland. This article is an open access article distributed under the terms and conditions of the Creative Commons Attribution (CC BY) license (http://creativecommons.org/licenses/by/4.0/).
Share and Cite
Caria, M.; Sara, G.; Todde, G.; Polese, M.; Pazzona, A. Exploring Smart Glasses for Augmented Reality: A Valuable and Integrative Tool in Precision Livestock Farming. Animals 2019, 9, 903. https://doi.org/10.3390/ani9110903
Caria M, Sara G, Todde G, Polese M, Pazzona A. Exploring Smart Glasses for Augmented Reality: A Valuable and Integrative Tool in Precision Livestock Farming. Animals. 2019; 9(11):903. https://doi.org/10.3390/ani9110903
Chicago/Turabian StyleCaria, Maria, Gabriele Sara, Giuseppe Todde, Marco Polese, and Antonio Pazzona. 2019. "Exploring Smart Glasses for Augmented Reality: A Valuable and Integrative Tool in Precision Livestock Farming" Animals 9, no. 11: 903. https://doi.org/10.3390/ani9110903
APA StyleCaria, M., Sara, G., Todde, G., Polese, M., & Pazzona, A. (2019). Exploring Smart Glasses for Augmented Reality: A Valuable and Integrative Tool in Precision Livestock Farming. Animals, 9(11), 903. https://doi.org/10.3390/ani9110903