Article

Effect of Dietary Calcium Nitrate Addition on Methane Emission, Nitrogen Excretion, and Ruminal Fermentation Parameters and Microbiota in Liuyang Black Goats

1
College of Animal Science and Technology, Gansu Agricultural University, Lanzhou 730070, China
2
Lanzhou Animal Disease Prevention and Control Center, Lanzhou 730046, China
3
Animal Husbandry Station of Beijing, Beijing 100107, China
*
Author to whom correspondence should be addressed.
Animals 2026, 16(8), 1150; https://doi.org/10.3390/ani16081150
Submission received: 16 February 2026 / Revised: 24 March 2026 / Accepted: 4 April 2026 / Published: 10 April 2026

Simple Summary

This study explored the effects of incorporating calcium nitrate into the diets of Liuyang black goats on methane emissions and their digestive processes. Results revealed that the addition of calcium nitrate significantly reduced both methane and carbon dioxide emissions from these goats. Furthermore, three hours after feeding, an increase in rumen pH was observed, accompanied by a decrease in ammonia concentration and a reduction in the acetate-to-propionate ratio. Additionally, calcium nitrate facilitated a decline in the population of specific microorganisms within the rumen. In summary, research indicates that calcium nitrate is highly effective in reducing methane emissions in goats and optimizing their gut microbial environment. These findings provide valuable theoretical perspectives on the role of calcium nitrate in the feeding regimens of Liuyang black goats.

Abstract

This research explored how dietary supplementation of calcium nitrate influences methane emissions, nitrogen excretion, ruminal fermentation parameters, and microbiota in Liuyang black goats. A total of twelve male goats from this breed were divided into two groups: one serving as a control group (CON), while the other received a treatment of 3% calcium nitrate (CAL). The research was conducted over a period of 40 days and comprised two separate trial phases. A 10-day adaptation period and a 5-day sampling period (days 11–15) for each stage. Results showed that incorporating calcium nitrate significantly reduced the emissions of methane (CH4) (p < 0.05) and carbon dioxide (CO2) (p < 0.05). Moreover, the use of calcium nitrate modified the trends in ruminal fermentation, resulting in an increase in pH (p < 0.05). Moreover, the ratio of acetate to propionate (A:P) was notably reduced in the CAL group (p < 0.05), indicating a shift toward enhanced production of propionate. At the microbial level, an increased presence of Bacteroidota and Prevotella was observed in the CAL group (p < 0.05). In contrast, the CON group exhibited elevated levels of Firmicutes and Methanobrevibacter (p < 0.05). This finding suggests that calcium nitrate plays a significant role in reducing methane emissions and also affects the fermentation processes in the rumen along with the microbiota of Liuyang black goats. Further research is needed to examine the long-term implications of calcium nitrate supplementation on the health and productivity of these goats.

1. Introduction

Global warming stands as one of the most urgent challenges facing the world in the 21st century, primarily driven by greenhouse gases (GHGs) [1]. Notably, methane (CH4) is of significant relevance, given that its ability to contribute to global warming is 28 times more potent than that of carbon dioxide (CO2) when assessed over a period of one hundred years [2]. Ruminants, including cattle, sheep and goats, are significant sources of CH4 emissions due to their unique digestive process involving enteric fermentation in the rumen [3]. Enteric CH4 emissions, which primarily result from enteric methanogenesis, a microbial process that takes place in the digestive tract, are receiving increasing attention. This is due to their significantly higher global warming potential compared to CO2, as well as their significant contribution to total agricultural emissions, accounting for approximately 39% [4]. Rumen fermentation in ruminants creates optimal growth conditions and a nutrient-rich environment for microorganisms. It also enables efficient utilization of fibrous feedstuffs that are typically difficult to digest [5]. While rumen fermentation promotes fiber degradation, 2% to 15% of ingested dietary energy is concurrently lost as CH4. Therefore, practical feeding strategies are needed to reduce CH4 emissions from ruminants. Earlier research indicates that nitrate demonstrates a potential to mitigate CH4 levels in goats [6]. In the rumen, nitrates are reduced to nitrites and ammonia, which compete with rumen methanogenesis for reducing equivalents and reduce CH4 emissions [7]. Although nitrate supplementation holds potential advantages, its use in ruminant diets has been constrained by worries regarding toxicity and the significant inconsistencies in CH4 reduction reported in various studies. Nitrate reduction in the rumen requires an adaptation period to increase the population of nitrate-nitrite reducing bacteria, thereby preventing poisoning from nitrite accumulation [8]. Reasonable and appropriate supplementation does not adversely affect the production health of goats [9,10]. Calcium nitrate, a soluble form of nitrate, has emerged as a potential alternative that can be rapidly absorbed in the rumen and utilized by rumen microbes to produce less CH4-intensive fermentation products, such as propionate, thereby mitigating the problems associated with other forms of nitrate while still providing the desired reduction in CH4 emissions [11]. Additionally, calcium nitrate may improve nitrogen utilization by providing a readily available nitrogen source for microbial protein synthesis, thereby reducing nitrogen excretion and enhancing overall feed efficiency [6]. However, the effects of calcium nitrate on CH4 emission, nitrogen metabolism, and rumen fermentation dynamics in specific ruminant species, such as Liuyang black goats, remain understudied. As an important local breed in China, Liuyang black goats are known for their high meat quality and adaptability to local environments. Understanding the impact of calcium nitrate on these goats is crucial for developing sustainable feeding strategies that can reduce environmental impacts while maintaining or enhancing animal productivity.
The objective of this research was to investigate how dietary supplementation with calcium nitrate influences CH4 emissions, nitrogen excretion patterns, ruminal fermentation parameters, and the microbial community composition in Liuyang black goats. We hypothesized that adding calcium nitrate will not adversely affect the production health of goats, can reduce methane production, and optimize rumen fermentation. The findings will contribute to optimizing dietary strategies for environmentally sustainable goat production while maintaining animal health.

2. Materials and Methods

2.1. Animal, Diets and Treatments

We selected 12 male Liuyang Black goats sourced from the Subtropical Agricultural Research Institute of the Chinese Academy of Sciences in Changsha. The goats were randomly assigned to two groups: a control group (CON) and a treatment group (CAL) that was fed a diet containing 3% calcium nitrate (dry weight basis, grams per kilogram). Each group consisted of 6 goats with an average weight of 28 ± 0.2 kg; each goat served as an independent replicate. The experiment consisted of two 20-day periods, totaling 40 days. Feeding conditions remained consistent throughout the entire experiment. During the first 20 days, samples were collected from 3 goats in each group; during the second 20 days, samples were collected from the remaining 3 goats in each group. The calcium nitrate used in the treatment group was a commercial compound obtained from Rhus Chinensis Mill, with a purity of 99.9%, supplied by the National Pharmaceutical Chemical Reagent Company in Shanghai. Each phase included a 10-day pre-experimental period. On the 15th day of each phase, respiratory metabolism tests were performed using a single-chamber system, measuring the dynamic emissions of CH4 and CO2 over two consecutive days. Each goat was housed in a spacious, well-ventilated pen measuring 2.5 m in length and 1.5 m in width. They received feed two times a day, specifically at 8:00 AM and 5:00 PM, and they always had free access to clean drinking water.
The formulation of the experimental diet and the calculation of its nutritional components were based on the Agricultural Industry Standard of the People’s Republic of China (NY/T816-2021) [12], which outlines the nutritional requirements for male goat weighing approximately 30 ± 0.2 kg. The experimental diet consisted of fully mixed pellet feed with a diameter of approximately 3.5 mm and a length of 1 to 2 cm, provided by Gansu Runmu Biological Engineering Co., Ltd., Jinchang, China. Detailed information related to the composition and chemical analysis of the experimental diet can be found in Table 1.

2.2. Sample Collection

The experimental design comprised an initial 10-day adaptation period, succeeded by a 5-day sampling phase (days 11–15) in each phase. Sampling methods were adapted from Wang et al. [13]. During the sampling period, daily measurements had been conducted to gather essential data: (1) Daily records had been maintained for the quantity of feed provided and the residual amount to calculate dry matter intake (DMI). (2) Fecal samples were collected using plastic buckets placed behind the test sheep. (3) Urine output had been captured via a collection system featuring a PVC tube fitted onto the penis, draining into a storage bucket. All collected samples had undergone standardized processing procedures. Fecal samples had been homogenized, with 10% (w/w) of the aliquot reserved for further analysis. Urine output had been quantified by volume, and a 10% (v/v) subsample had been taken for additional examination.
Throughout the formal trial period, body weight (BW) measurements had been taken every morning prior to feeding. The goats’ average daily weight gain (ADG) was calculated by evaluating the differences between their starting and ending BW.
On the thirteenth day of each experimental phase, rumen fluid samples were collected using a rumen tube and vacuum pump prior to feeding, and again three hours after feeding. To avoid contamination from saliva, approximately 20 mL of the initial sample was discarded. The leftover fluid was subsequently filtered through four layers of gauze and examined right away for pH levels with the help of a portable pH meter (pH-HJ90, Beijing Aerospace Computer Co, Beijing, China). In order to facilitate additional analysis of ammonia nitrogen in conjunction with volatile fatty acids (VFAs), two samples were preserved at a temperature of −20 °C. Additionally, another two aliquots had been preserved at −80 °C for 16S rRNA pyrosequencing.
On the 15th day of each experimental phase following the goats’ adaptation to the respiration chamber, methane CH4 and carbon dioxide CO2 production was measured using a mobile open-circuit respiratory calorimeter system. The specific methodology followed the experimental protocol established by Wang et al. [14]. The measurement process had been designed to span two days and was conducted within an open respiration chamber, which maintains an average airflow rate of 40 m3/h as regulated by a gas flow meter (C100L-CRWE-DD, SIYA, Shanghai, China). During this period, a sophisticated greenhouse gas analyzer (MIU-374-8, Los Gatos Research, San Jose, CA, USA) had assessed gas concentrations at both the chamber outlet and in the surrounding environment at hourly intervals. Each measurement consisted of a 9 min detection phase followed by a 9 min control phase. Additionally, a gas flow meter (C100L-CRWE-DD, SIYA, Shanghai, China) had continuously monitored the gas production rate of the Liuyang black goats throughout the entire day. The data collected had been transmitted to a computer system for processing and calibration with pure CH4 and CO2 at a flow rate of 100 mL/min.

2.3. Chemical Analysis

Fecal samples were subjected to drying in an oven set at 60 °C for a duration of 48 h, after which they were ground with a vertical Wiley mill produced by Arthur H. Thomas Company located in Philadelphia, PA, USA, until they could pass through a sieve of 0.45 mm. The assessment of the chemical composition involved quantifying the DM content (utilizing method 930.15; AOAC, 2012), assessing CP levels (applying method 984.13; AOAC, 2012), and measuring the concentrations of calcium and phosphorus (methods 942.05 and 965.17; AOAC, 2012) [15]. The Ankom A200i fiber analyzer, developed by ANKOM Technology Co. (New York, NY, USA), was employed to evaluate acid detergent fiber (ADF) and neutral detergent fiber (NDF), following the protocols set forth by Van Soest et al. [16]. The calculation of digestible energy (DE) was conducted in line with the methods suggested by the National Research Council (NRC) and associated tables for goats [17].
To investigate the VFAs found in ruminal fluid, a high-performance gas chromatograph (HPGC; model GC-2014; produced by Shimadzu Corporation, Kyoto, Japan) was employed. This apparatus features a flame ionization detector (FID) that operates using hydrogen and includes a capillary column supplied by Agilent Technologies, Inc. (Wilmington, DE, USA). The column has a length of 30 m, an inner diameter of 0.32 mm, and a film thickness of 0.50 µm. The temperatures for both the column and FID were set at 120 °C and 200 °C, respectively, with high-purity nitrogen gas (99.99%) serving as the carrier gas at a flow rate of 1.2 mL/min. Hydrogen and air were delivered at rates of 30 mL/min and 300 mL/min, respectively. For the preparation of samples, 1 mL of ruminal fluid was combined with 0.25 mL of metaphosphoric acid (25%, w/v) and then centrifuged at 4 °C and 3000× g for 15 min to extract the supernatant for analysis. The ammonia nitrogen (NH3-N) concentration in the ruminal fluid was quantified using a UV/Visible spectrophotometer (UV-1801), manufactured by Beijing Beifen-Ruili Analytical Instrument Co, Ltd. (Beijing, China), in accordance with the procedure outlined by Broderick and Kang [18], utilizing the phenol-chloramine colorimetric method.

2.4. Sequencing of the 16S rRNA Gene and Bioinformatics Analysis

Samples of rumen content were obtained from six black goats in each experimental group. The experimental method referenced that of Yang et al. [19]. Genomic DNA was fully extracted with the QIAamp DNA Stool Mini Kit provided by QIAGEN (Hilden, Germany). The amplification of hypervariable regions V3 and V4 of the bacterial 16S rRNA gene was executed using barcode-labeled primers 515F (5′-GTGCCAGCMGCCGCGGTAA-3′) and 806R (5′-GGACTACHVGGGTWTCTTAAT-3′) [20,21]. The PCR reaction consisted of 15 μL of Phusion® High-Fidelity PCR Master Mix (New England Biolabs, Ipswich, MA, USA), along with 0.2 μM of each primer and 10 ng of template DNA. The thermal cycling protocol included an initial denaturation step at 98 °C for one minute, followed by 30 cycles of annealing and extension, concluding with a final extension at 72 °C for a duration of 5 min [22]. The size of the amplified products was assessed using 2% agarose gel electrophoresis and then purified with the Qiagen gel extraction kit (QIAGEN GmbH, Hilden, Germany). Finally, paired-end sequencing of 250 bp was conducted on the Illumina NovaSeq platform (Illumina, San Diego, CA, USA). The assembly of raw reads was carried out employing FLASH software (Version 1.2.7, http://ccb.jhu.edu/software/FLASH/ (accessed on 3 April 2025)) [23]. Subsequently, QIIME (Version 1.9.1, http://qiime.org/scripts/split_libraries_fastq.html (accessed on 3 April 2025)) [24] was employed for quality control to eliminate chimeric sequences, resulting in effective tags. The sequences were subsequently grouped into operational taxonomic units (OTUs) based on a similarity threshold of 97% [25]. The UPARSE tool (Version 7.0.1001, http://www.drive5.com/uparse/ (accessed on 3 April 2025)) was utilized, with species classification based on the UCHIME algorithm [26]. Furthermore, the Chao1 and Shannon diversity indices were computed [27], while principal coordinates analysis (PCoA) and visualization were performed utilizing R software (version 3.5.2, R Foundation for Statistical Computing, Vienna, Austria) [28]. Lastly, taxonomic classification was conducted using Mothur software (version 1.41.1), referencing the Silva.nr.132 database [29]. We performed linear discriminant analysis effect size (LEfSe) analysis with the Micro Biome Process package (version 1.1.463, RStudio, Inc., Boston, MA, USA) in RStudio (version 3.5.2, R Foundation for Statistical Computing, Vienna, Austria) to evaluate all classification levels ranging from phylum to species, establishing a threshold for LDA scores (≥3.5) to ascertain the significance of the identified biomarkers. Additionally, Spearman rank correlation analysis was applied to examine the relationship between rumen fermentation characteristics and the relative abundances of the top 10 dominant bacterial genera and phyla.

2.5. Calculations and Statistical Analysis

The CH4 emission, CO2 emission, growth performance and apparent nutrient digestibility were statistically analyzed with the aid of SPSS software (IBM Corp. Released 2019, IBM SPSS Statistics for Windows, Version 26.0, Armonk, NY, USA: IBM Corp.). The linear model applied was organized in the following manner:
Yi = μ + Ti + βt⋅tj + εi
In this context, Yi represents the mean treatment observed during the 5-day collection period for the ith dietary group. The overall mean is indicated by μ. The fixed effects of the two treatments (CON and CAL, corresponding to i = 1 and 2) are denoted by Ti. The term βt denotes the effect associated with the time stage, illustrating how time influences the outcome variable. The time covariate, tj, is defined such that tj = 1 corresponds to the initial time stage, while tj = 2 refers to the subsequent time stage. Lastly, εi represents the random residual error.
SPSS software (IBM Corporation 2019 edition, IBM SPSS Statistics for Windows, Version 26.0, Armonk, NY, USA: IBM Corporation) was used to examine the normality assumption, homogeneity of variance, and outlier handling for data on average daily gain (ADG), apparent nutrient digestibility, rumen fermentation indicators, and relative abundance of rumen bacteria. Independent samples t-tests were performed. The models used are as follows:
t = x 1 ¯ x 2 ¯ S x 1 ¯ x 2 ¯
In this context, x 1 ¯ and x 2 ¯ denote the average values of various treatment groups, whereas S x 1 ¯ x 2 ¯ represents the standard error associated with the mean difference. A significance threshold of p < 0.05 was determined. Additionally, Spearman’s correlation coefficients were utilized to assess the associations between microbial species and rumen VFAs, with the same statistical significance threshold of p < 0.05 applied.

3. Results

3.1. Effects of Dietary Calcium Nitrate Supplementation on Methane and Carbon Dioxide Emissions

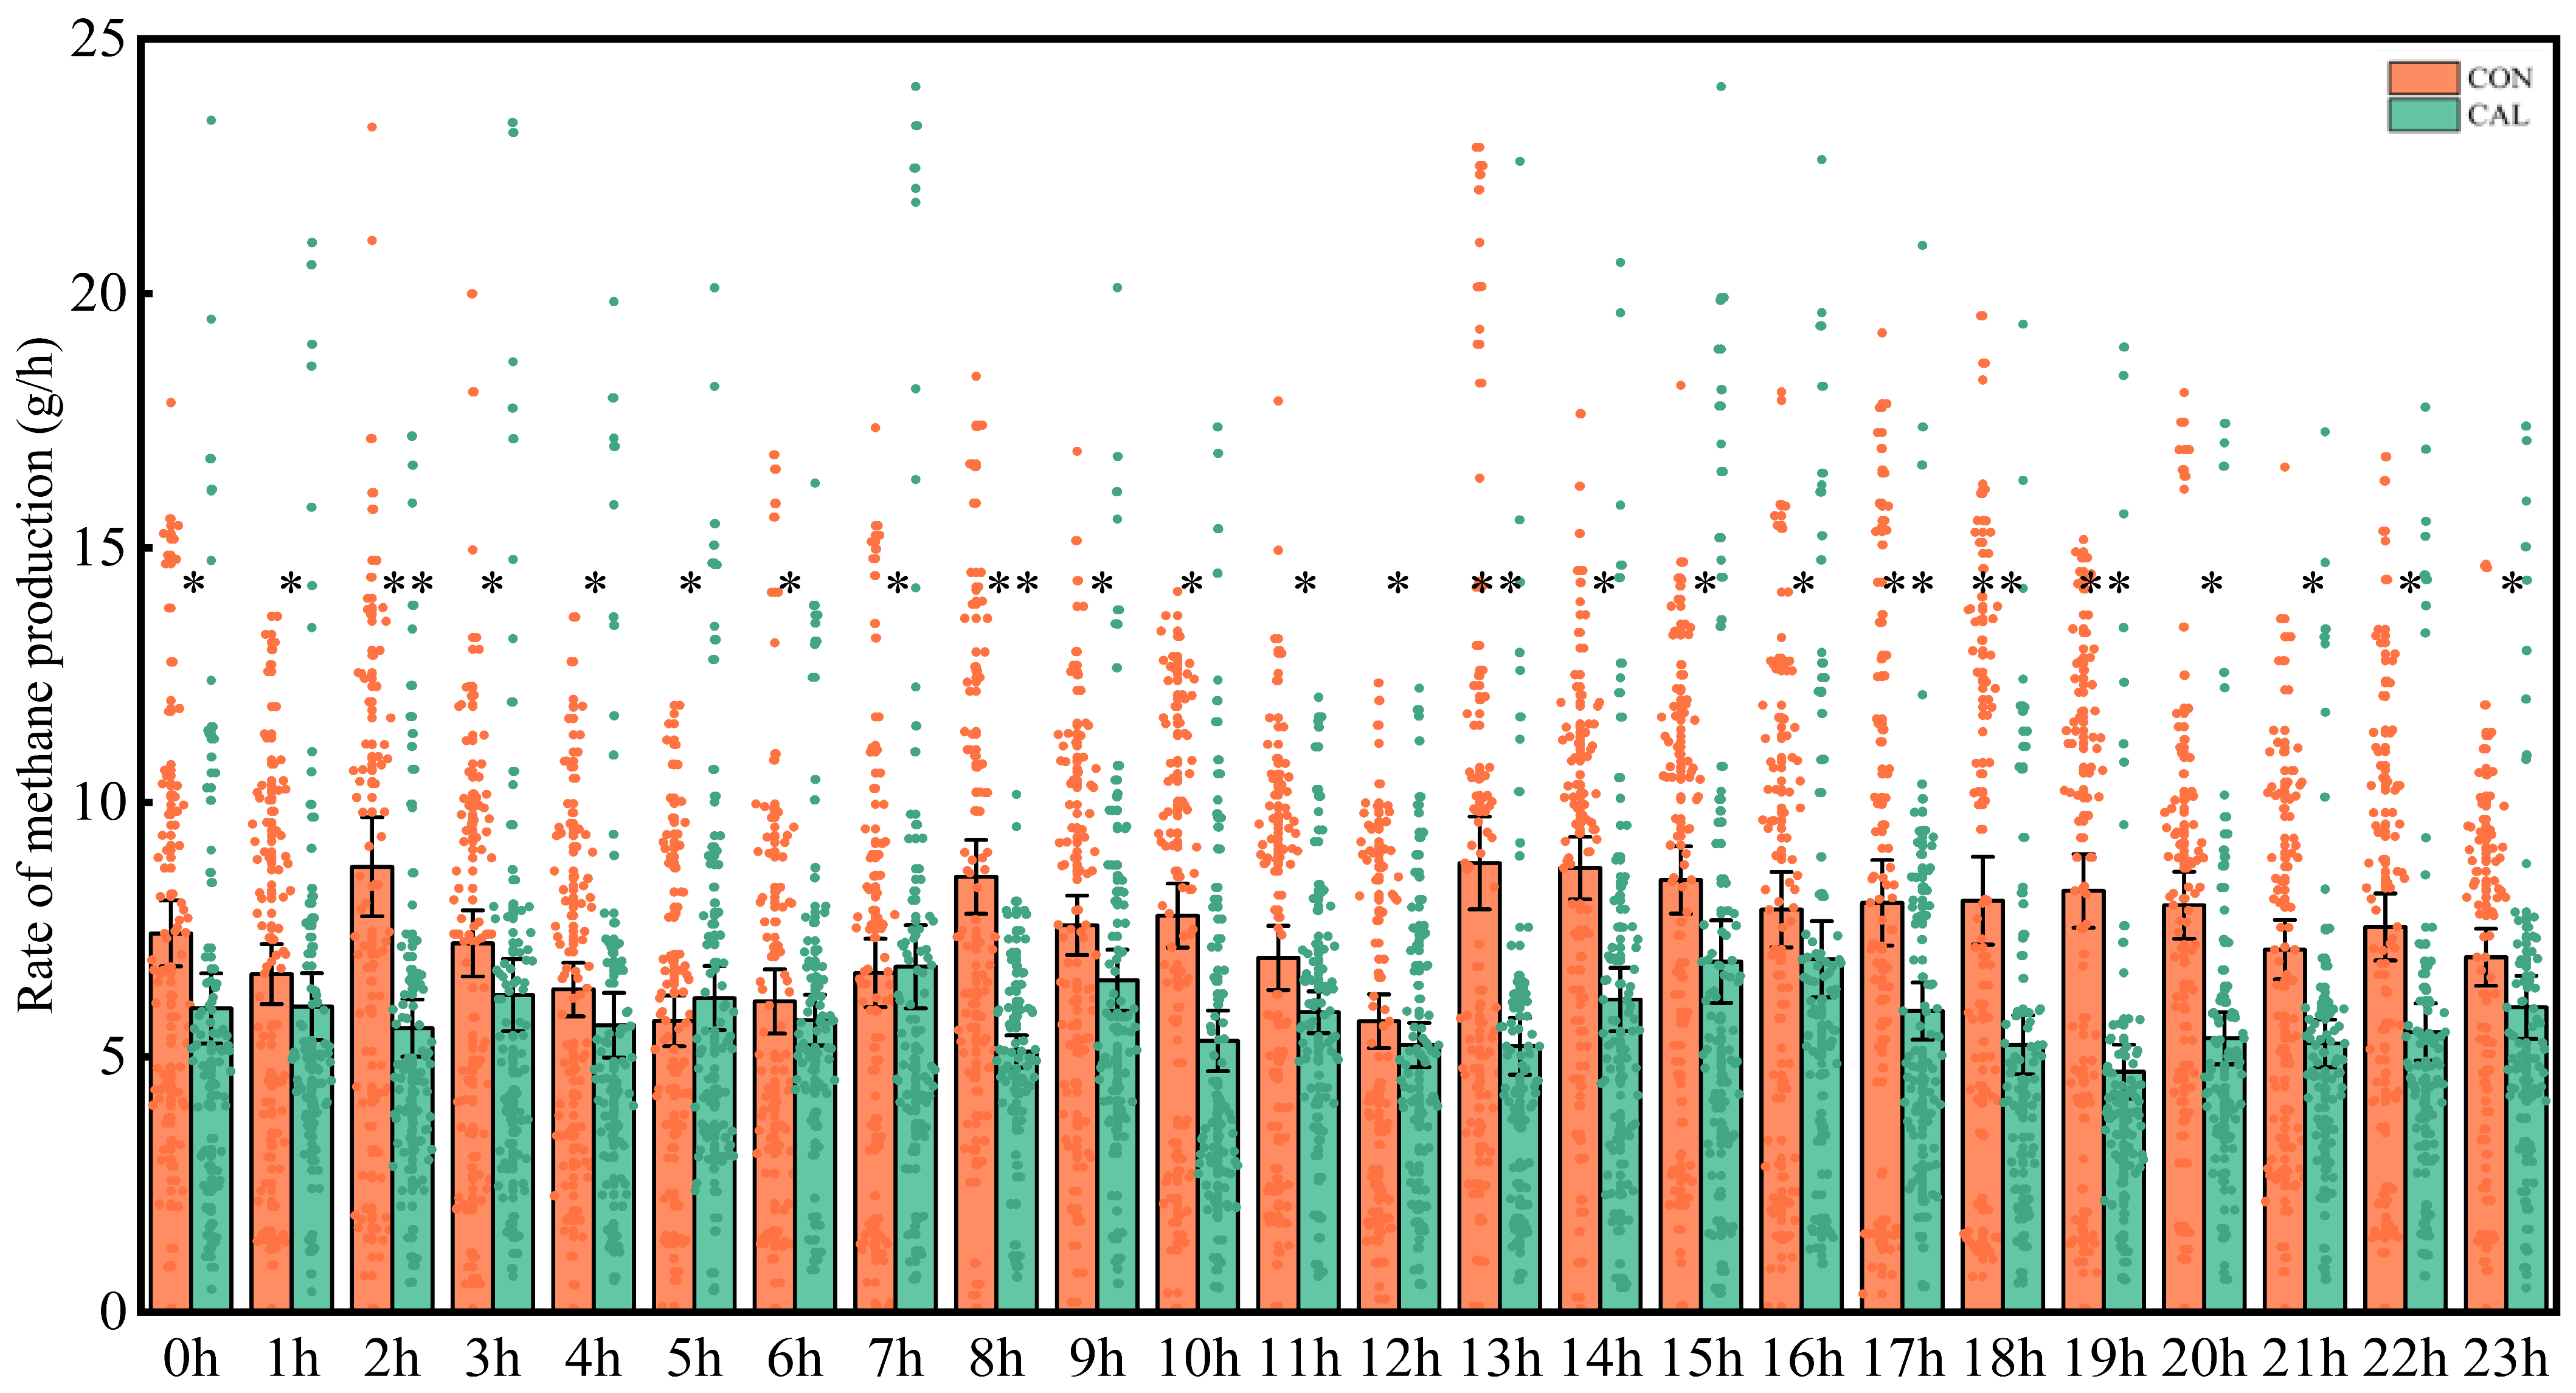
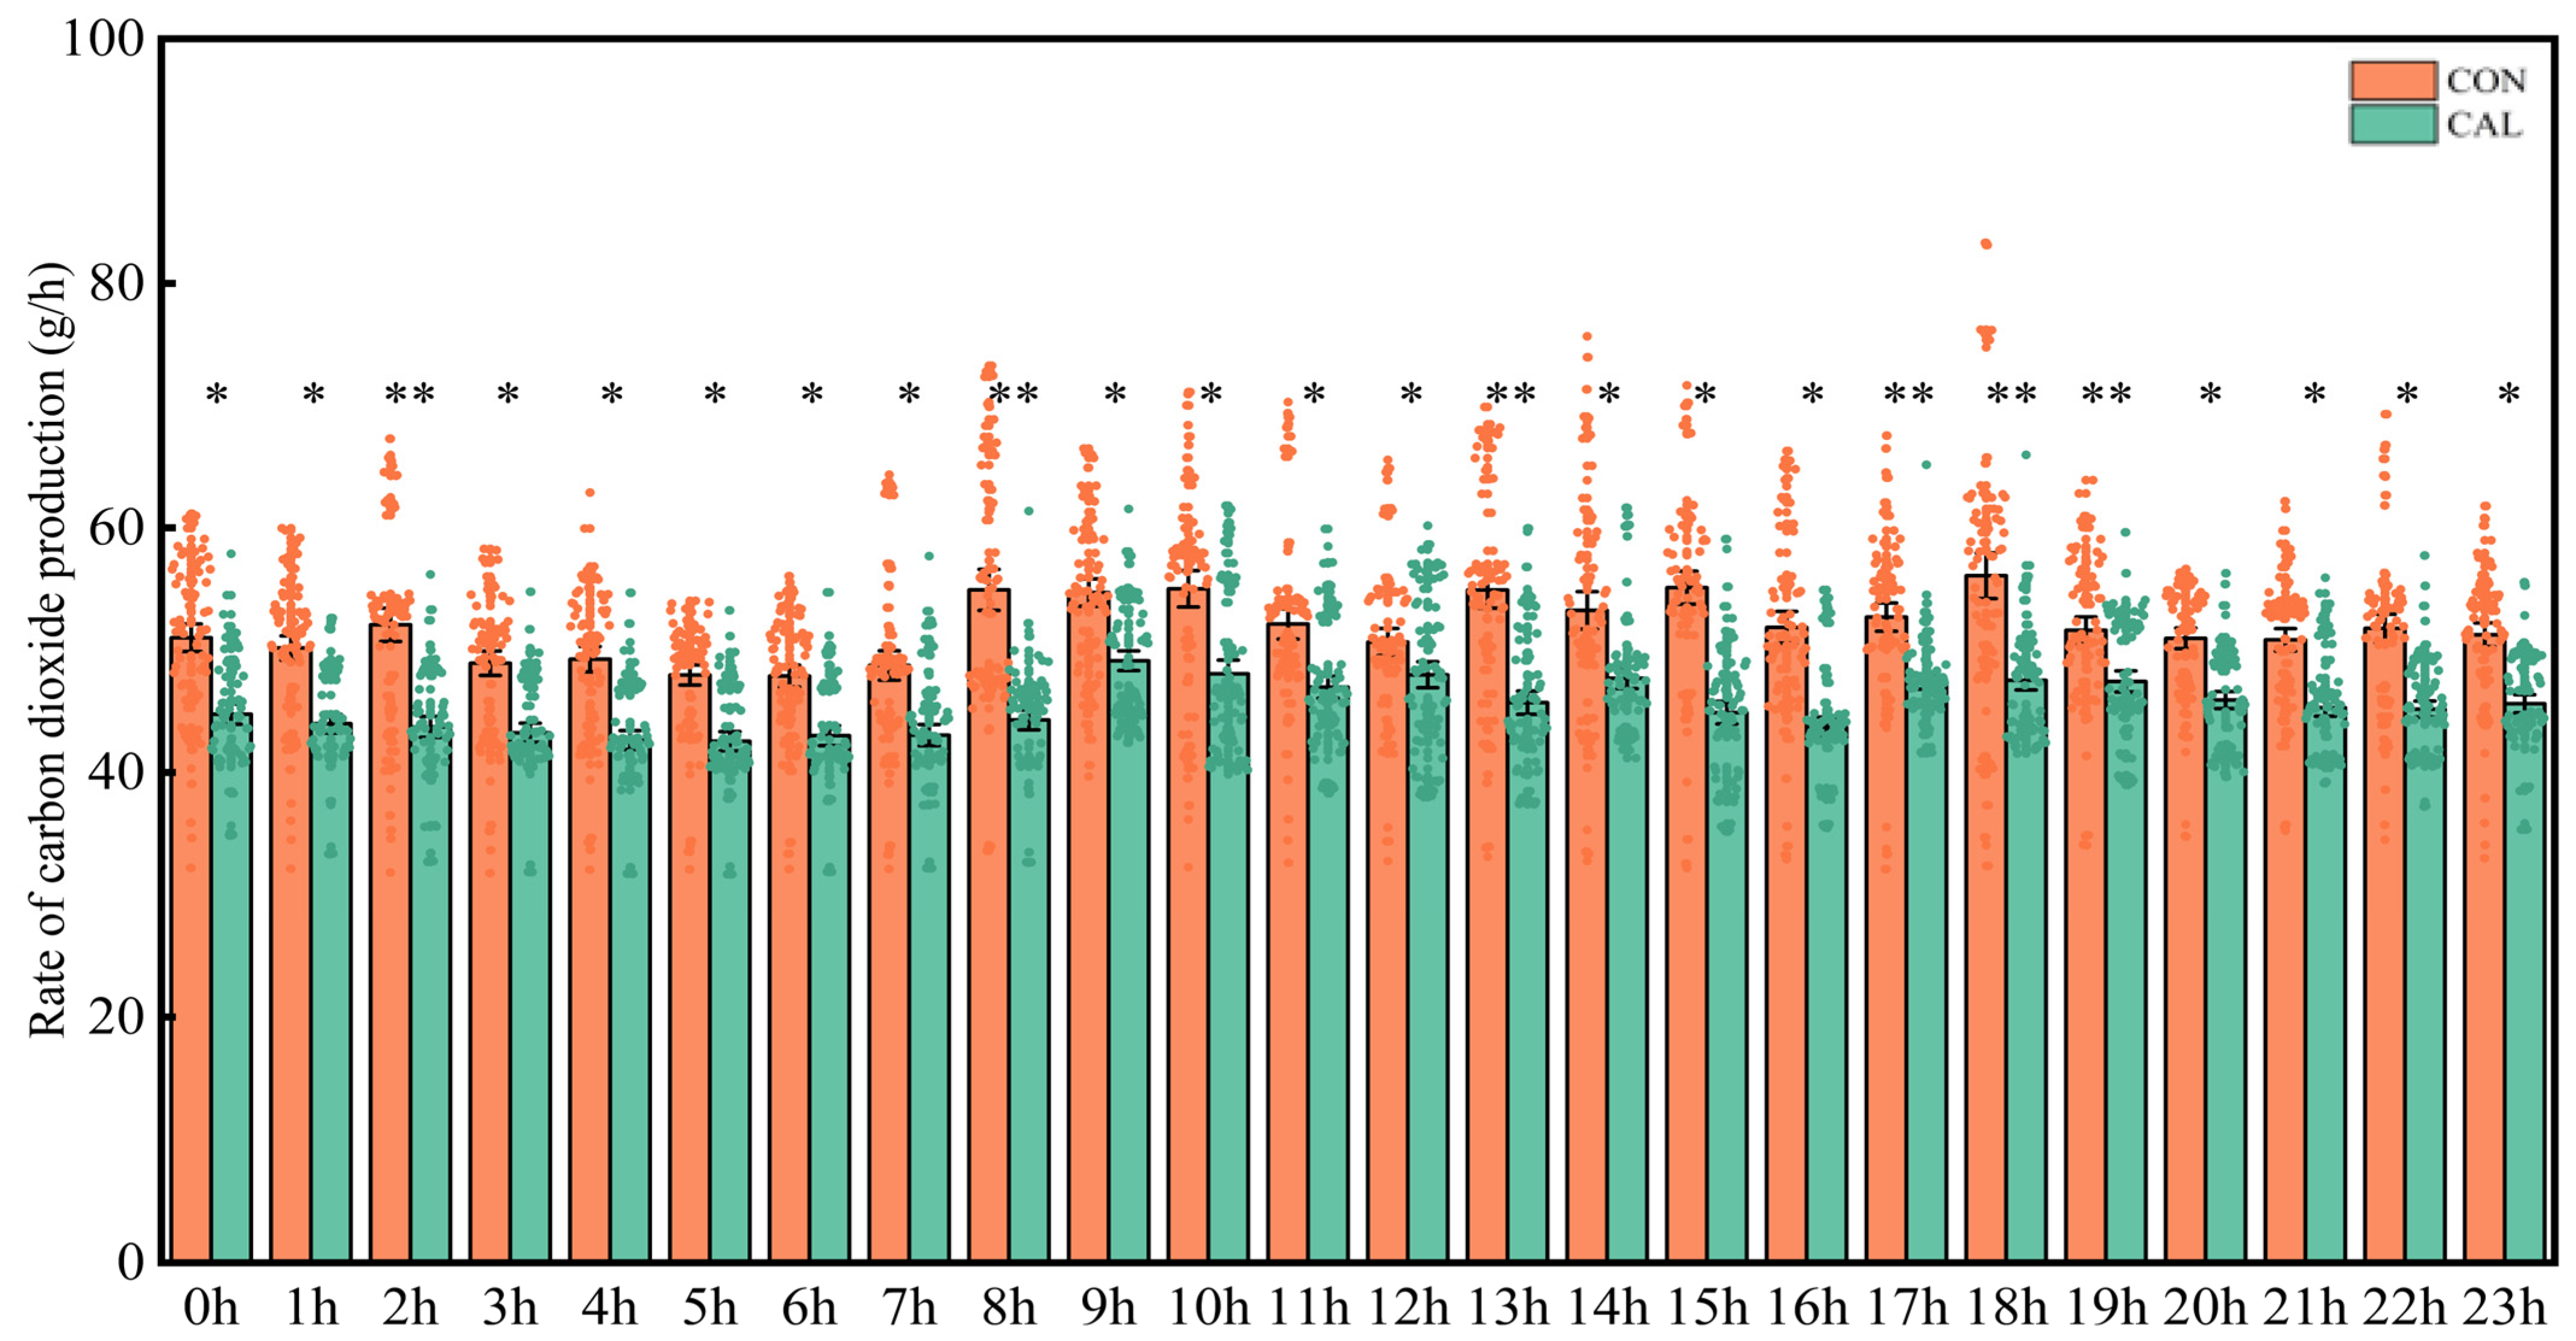
The emissions of CH4 and CO2 were tracked and visually displayed (Figure 1 and Figure 2). The findings indicated that the CAL group had consistently lower emissions of both CH4 and CO2 compared to the CON group across all time points measured (p < 0.05). Specifically, inclusion of calcium nitrate in the diet led to a significant decrease in the emission rates of CH4 and CO2 in goats (p < 0.05). Furthermore, the temporal patterns of CH4 and CO2 production in goats exhibited a distinct diurnal variation, with emissions peaking within 2 to 3 h after feeding and subsequently decreasing until the next feeding event.
The diet of goats that included calcium nitrate led to a noteworthy reduction in daily CH4 emissions, as shown in Table 2. Specifically, the production of CH4 per unit of dry matter intake (DMI) was significantly lower in the CAL group when compared to the CON group (CH4/DMI, p < 0.05). Conversely, no significant differences were observed in methane emissions per unit of average daily gain between the two groups (CH4/ADG, p > 0.05). Similarly, methane emissions per unit of neutral detergent fiber intake did not differ significantly between the groups (CH4/NDFI, p > 0.05). Additionally, no significant differences were found in methane emissions per unit of acidic detergent fiber intake (CH4/ADFI, p > 0.05). Moreover, incorporating calcium nitrate into the diet resulted in significant decreases in both CH4 energy loss and emissions per metabolic BW relative to the CON group (CH4-E, CH4/BW0.75, p < 0.05). Similarly, the CAL group showed substantially lower daily CO2 emissions compared to the CON group (p < 0.05). In addition, the CAL group exhibited significant reductions across all individual indicators of CO2 emissions (p < 0.05).

3.2. Effects of Dietary Calcium Nitrate Supplementation on Apparent Nutrient Digestibility and Growth Performance

As shown in Table 3, the addition of calcium nitrate to the diets of goats did not significantly impact their growth performance or nutrient digestibility (p > 0.05). Calcium nitrate supplementation, in particular, did not have a significant impact on ADG, feed conversion ratio (F/G), or DMI (p > 0.05). However, the apparent nutrient digestibility was reduced with calcium nitrate supplementation, even though the differences between the supplemented group and the control group were not statistically significant (p > 0.05).

3.3. Effects of Dietary Calcium Nitrate Supplementation on Nitrogen Metabolism

Table 4 presents the effects of calcium nitrate supplementation on nitrogen metabolism in goats. The data indicated that dietary calcium nitrate did not significantly influence nitrogen intake, faecal nitrogen, urine nitrogen, digestive nitrogen, nitrogen deposition, nitrogen digestibility, net protein utilization, or the biological value of proteins in goats (p > 0.05).

3.4. Effects of Dietary Calcium Nitrate Supplementation on Rumen Fermentation Parameters

Table 5 presents the effects of calcium nitrate supplementation on ruminal pH, NH3-N, and VFAs in goats. Before feeding, no significant differences were observed between the two groups in terms of pH, NH3-N, total volatile fatty acids (TVFAs), the proportion of individual VFAs, and the acetate to propionate ratio (A:P) (p > 0.05). However, a significant difference was observed in valerate proportions (p < 0.05), suggesting a specific effect of calcium nitrate on this VFAs.
Three hours after feeding, significant differences in rumen fermentation patterns were observed in goats. The CAL group had a higher pH compared to the CON group (p < 0.05). Additionally, NH3-N production increased, but no significant difference was observed (p > 0.05). The CAL group also exhibited a lower acetate proportion and higher propionate proportion, along with increased concentrations of valerate, isobutyrate, and isovalerate (p < 0.05). These findings suggest that calcium nitrate supplementation modulates ruminal fermentation patterns, favoring propionate production over acetate (p < 0.05).

3.5. Effects of Dietary Calcium Nitrate Supplementation on Diversity of Rumen Bacterial Community

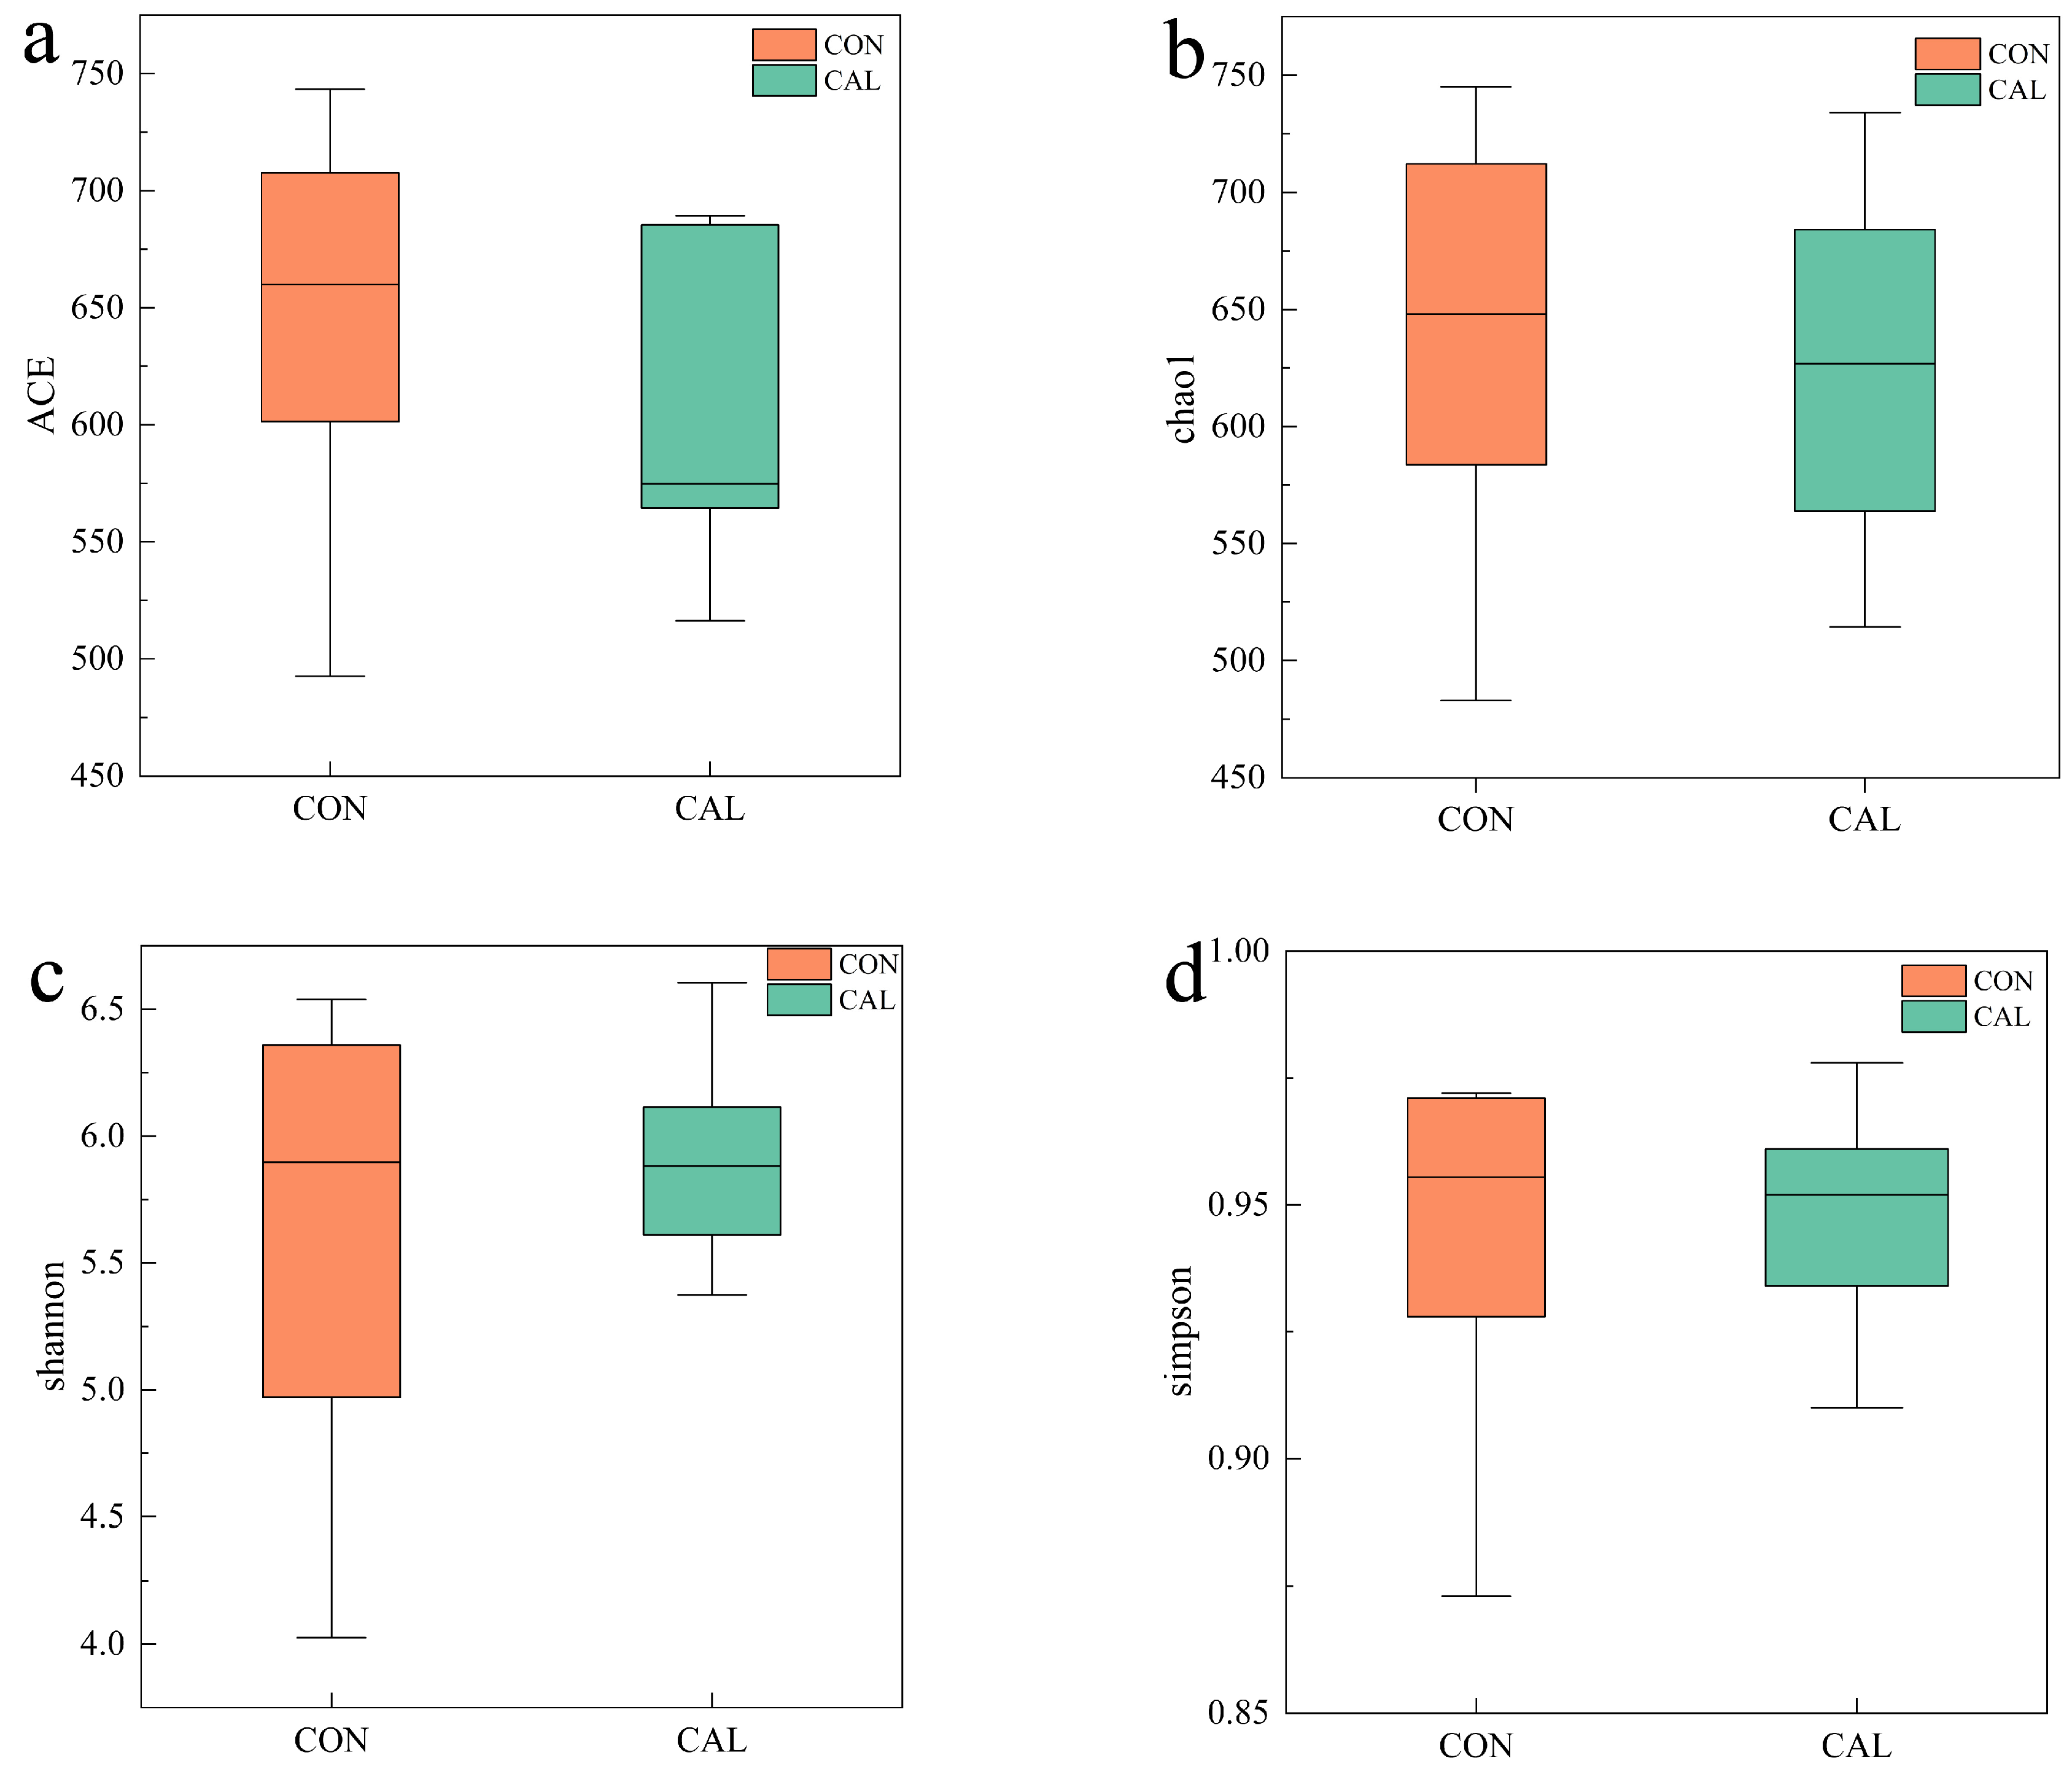
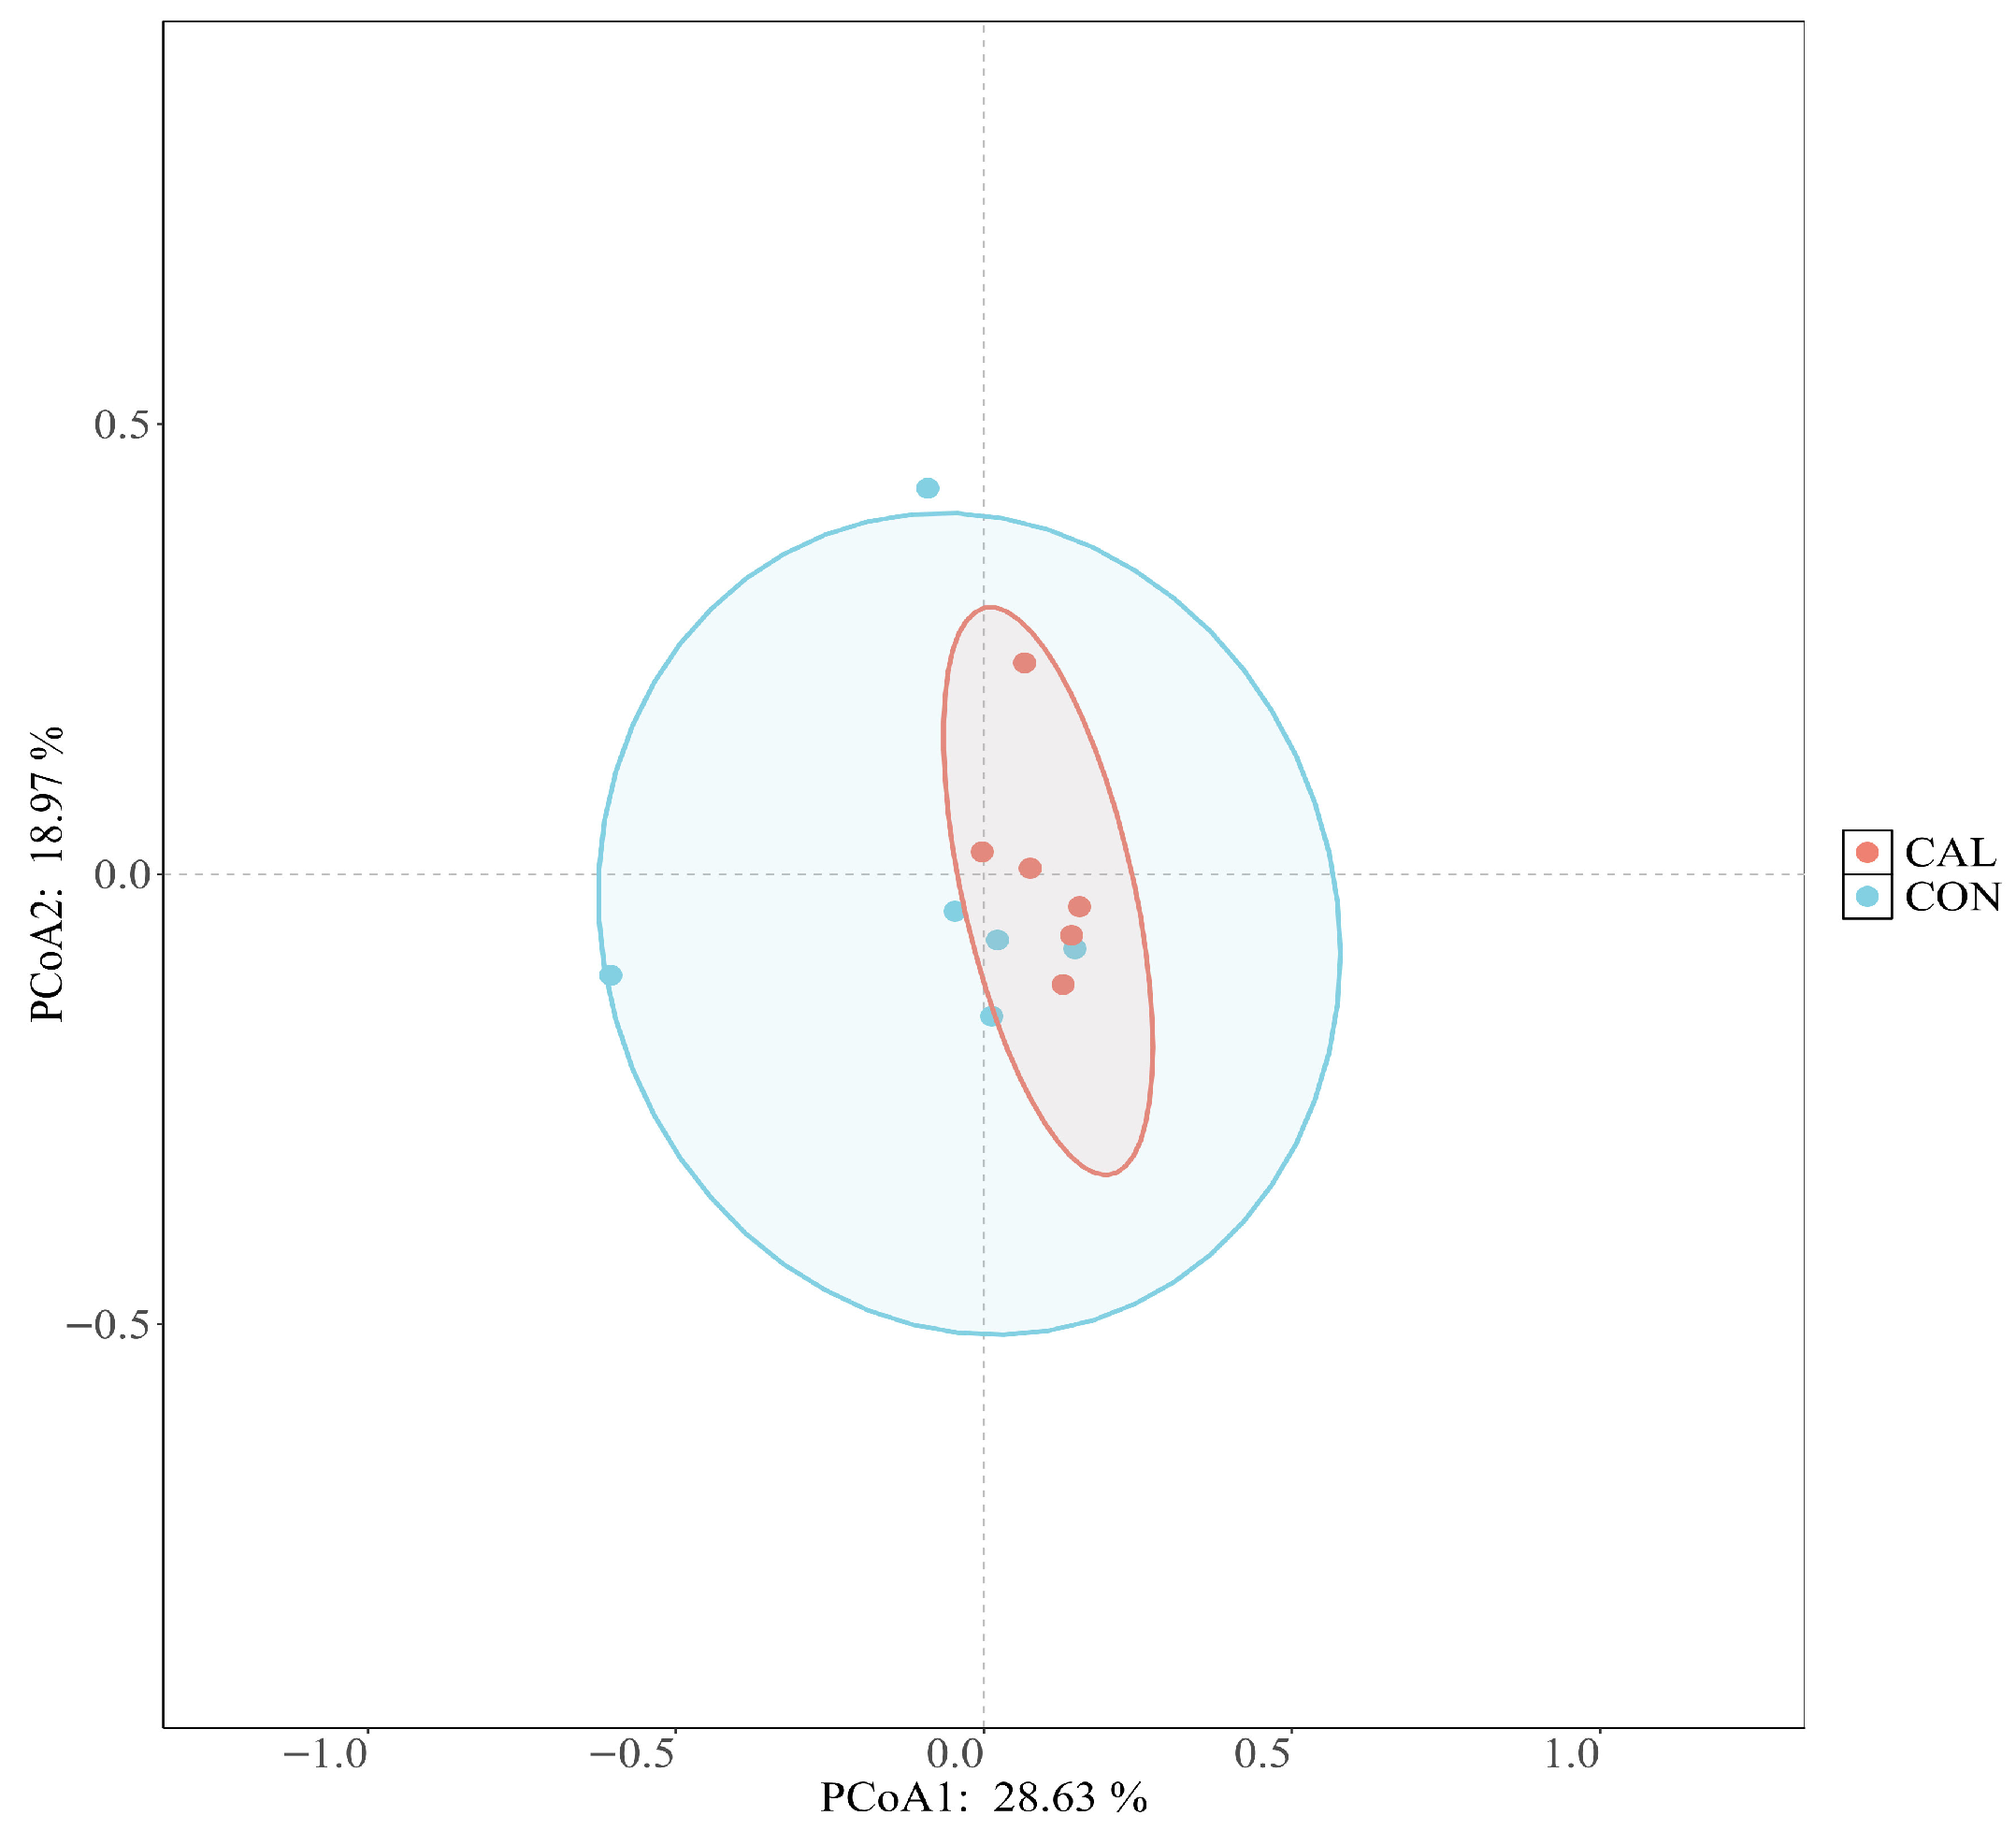
The incorporation of calcium nitrate did not significantly influence the alpha diversity metrics, such as ACE, Chao1, Shannon, and Simpson, related to the bacterial microflora found in the rumen fluid of Liuyang black goats (p > 0.05, Figure 3). Meanwhile, the beta diversity assessment utilizing weighted UniFrac distances showed a more centralized spatial arrangement of samples within the CAL group, suggesting enhanced internal consistency. In contrast, the CON group displayed a more dispersed pattern. This suggests that the CAL group exhibited a significantly higher degree of sample aggregation compared to the CON group (Figure 4).
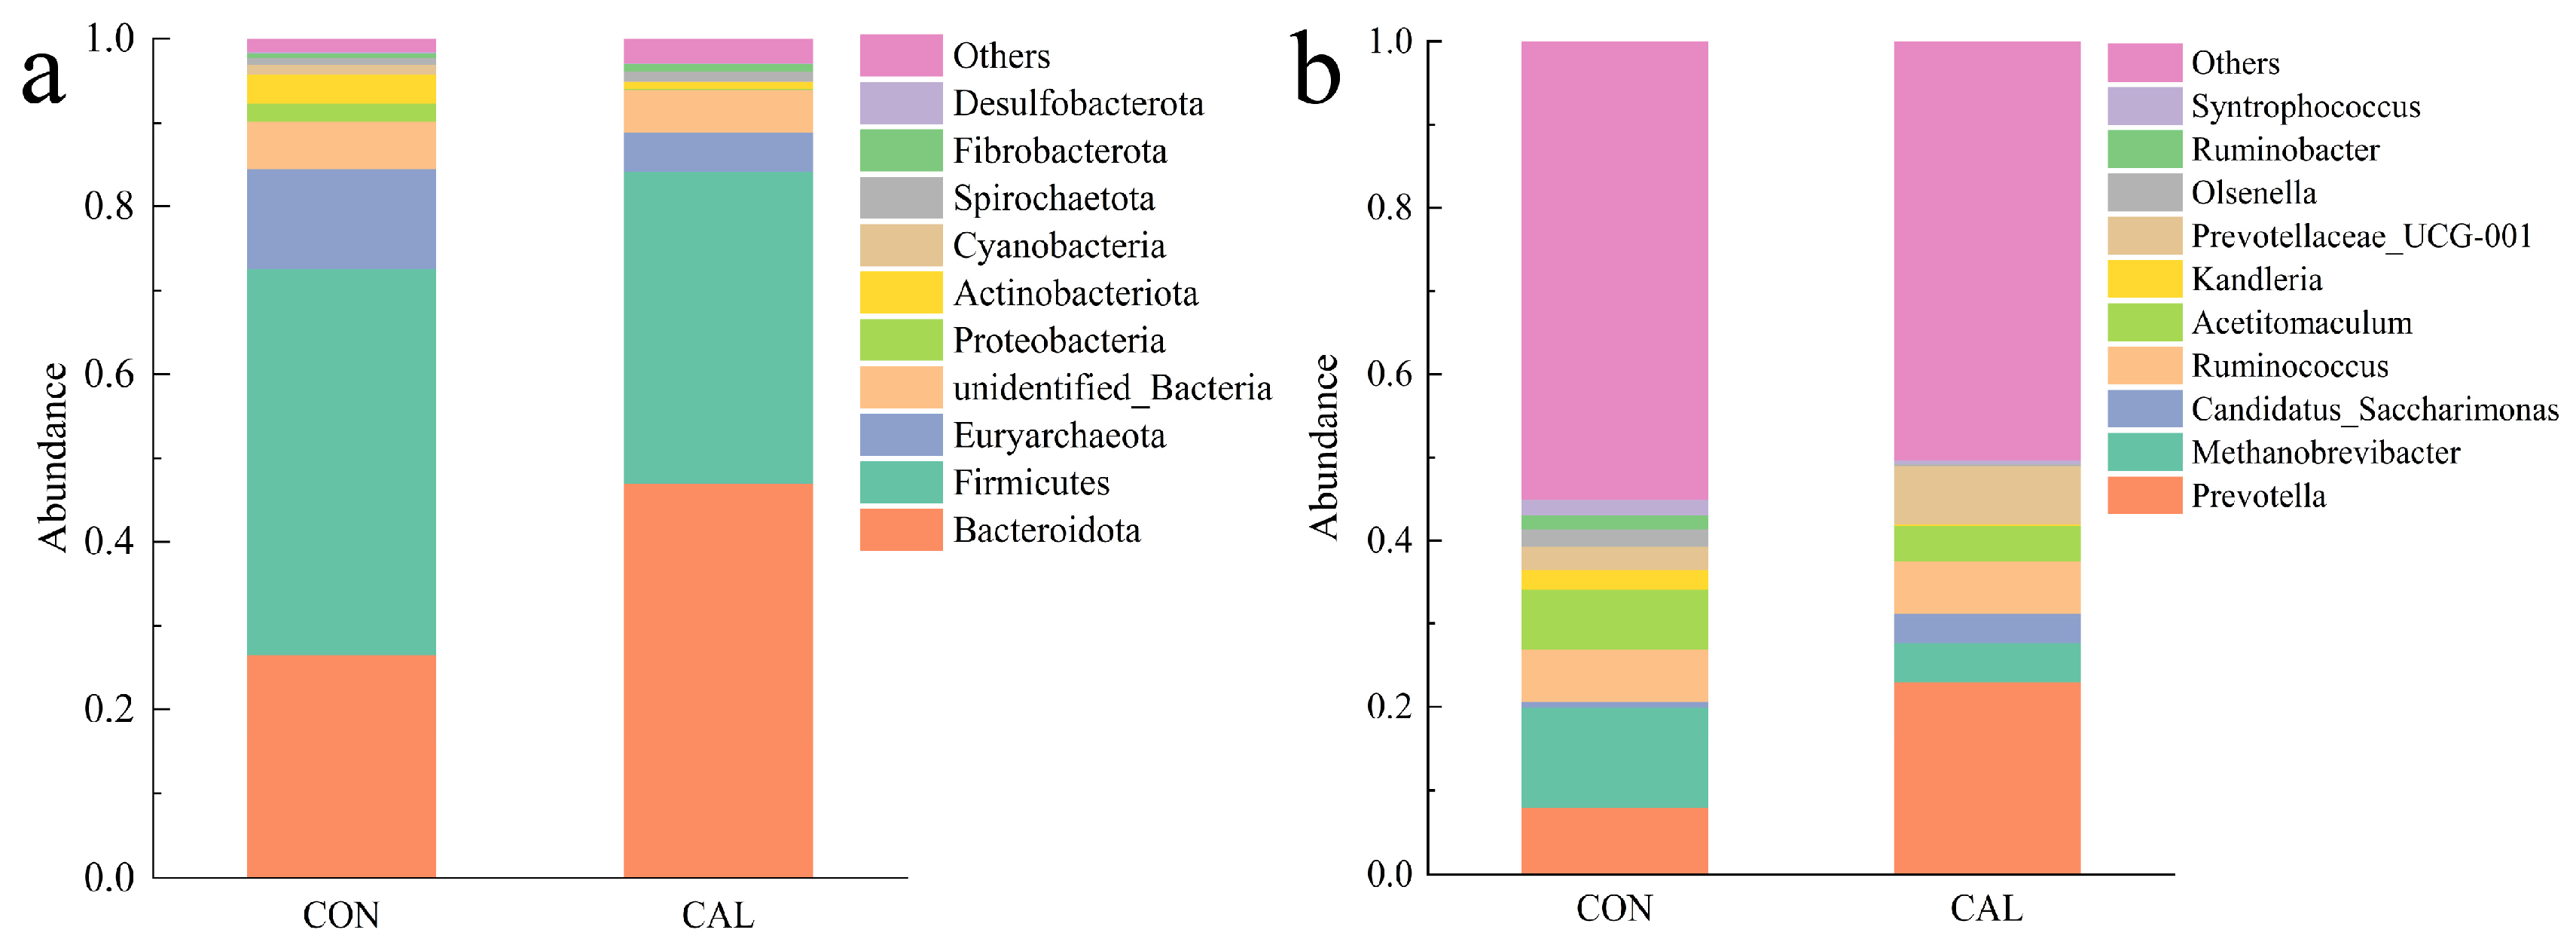
Among bacteria, the study’s findings indicated that the microbial community composition and relative abundance varied betwen the two treatment groups, with Bacteroidota and Firmicutes being the dominant phyla. Notably, Bacteroidota was most abundant in the CAL group and Firmicutes in the CON group (p < 0.05, Figure 5a and Table 6). At the genus level, Prevotella and Methanobrevibacter were particularly prominent, with Prevotella showing a higher relative abundance in the CAL group and Methanobrevibacter in the CON group (p < 0.05, Figure 5b and Table 7), and some genera such as Prevotellaceae_UCG-001 appeared to be more abundant in the CAL group compared to the CON group (p < 0.05).
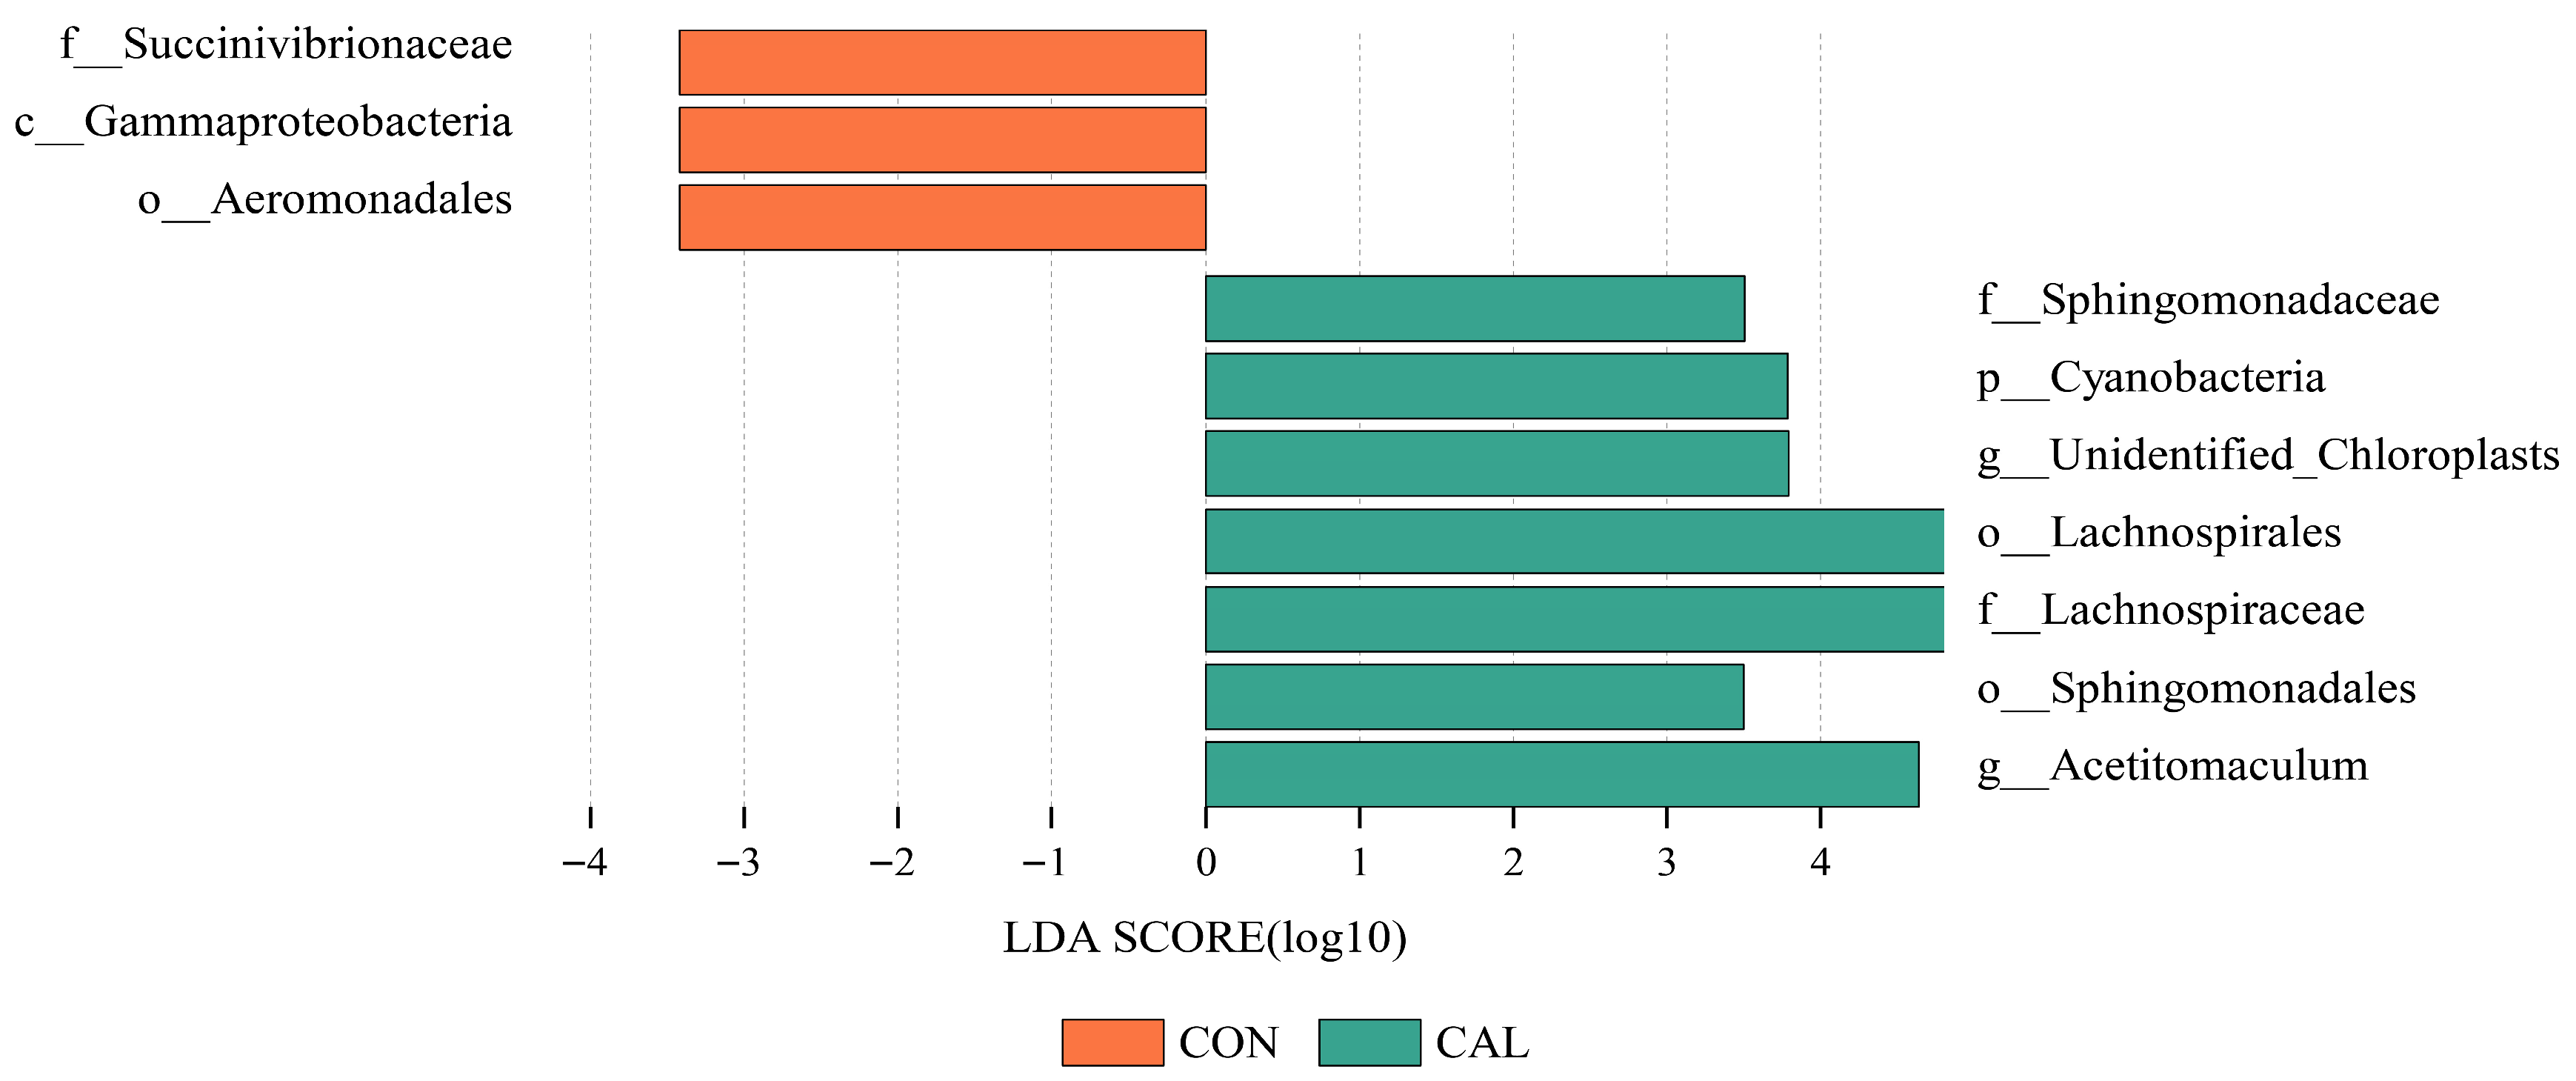
The analysis using Linear discriminant analysis effect size (LEfSe) demonstrated clear differences in the characteristics of the microbial communities between the various treatment groups. In the rumen, the CAL group was significantly enriched with a diverse array of taxa, including Sphingomonadaceae, Unidentified_chloroplasts, Lachnospirales, Lachnospiraceae, and Sphingomonadales. In contrast, the CON group showed enrichment with three primary taxa, including Succinivibrionaceae, Gammaproteobacteria, and Aeromonadales (Figure 6).
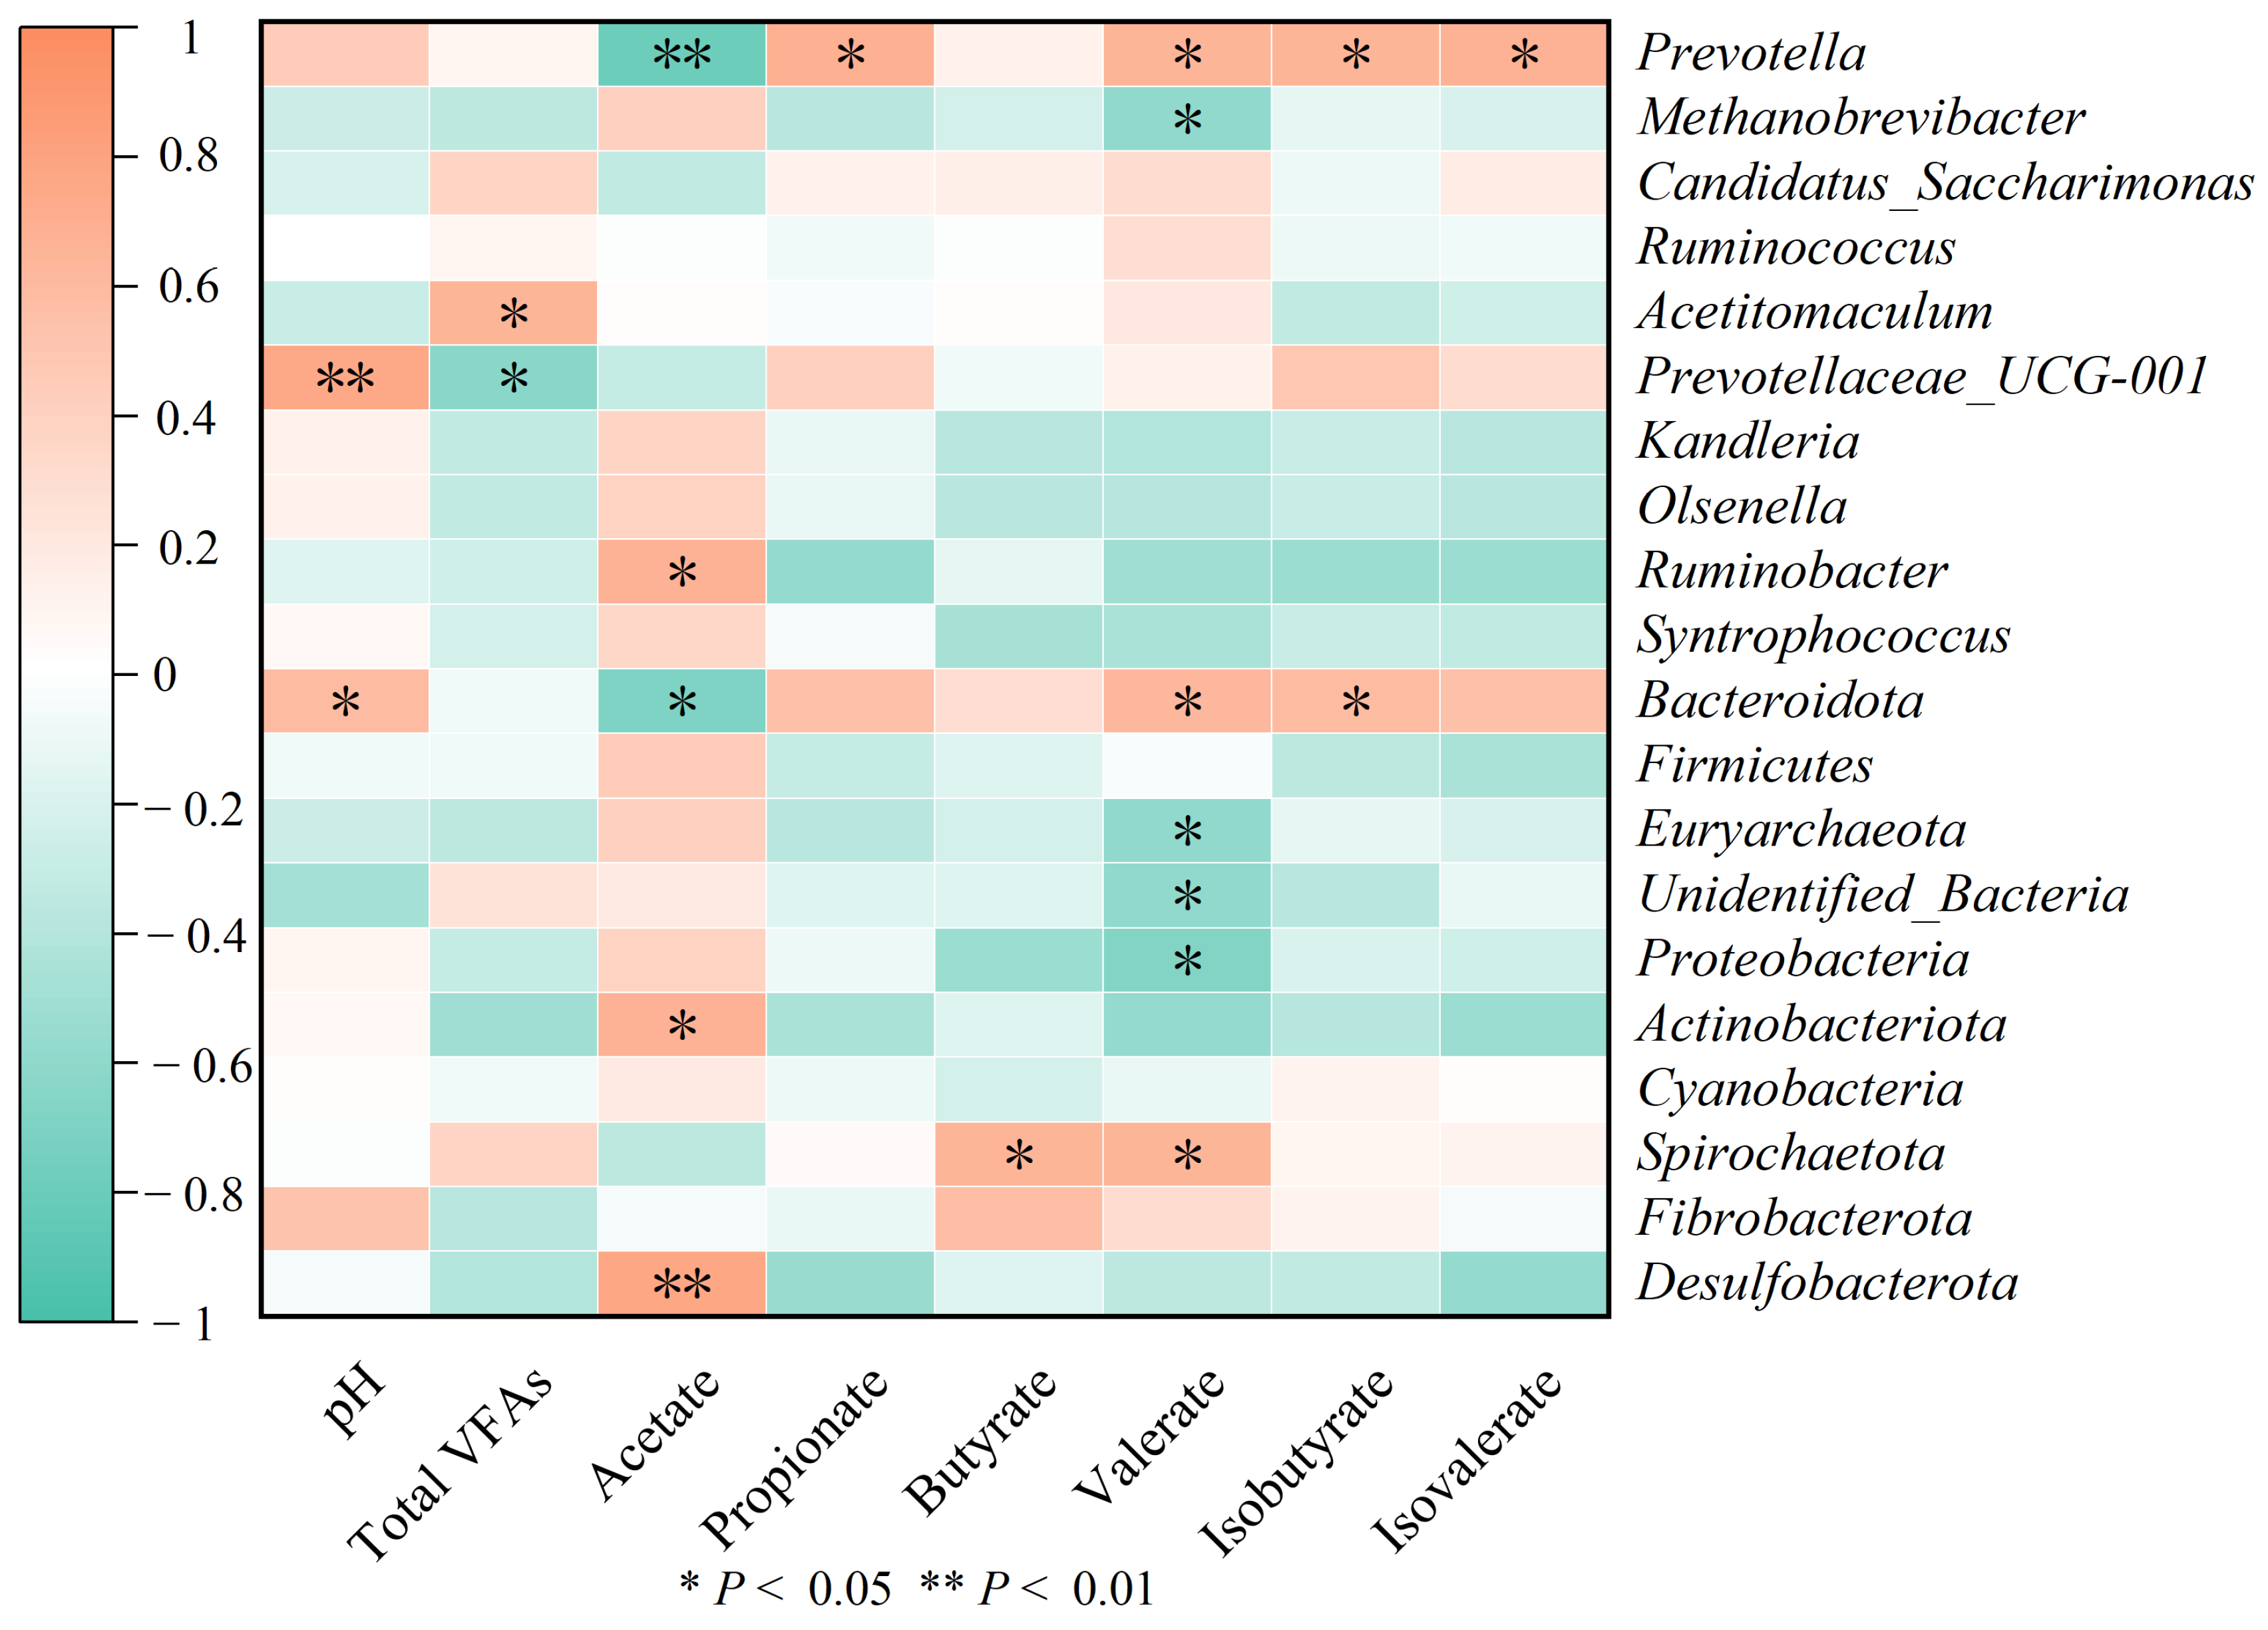
Spearman correlation analysis revealed meaningful relationships between parameters of rumen fermentation and the relative abundance of various microbial taxa (Figure 7). The pH level in the rumen was positively correlated with the abundance of Bacteroidota (p < 0.05). The concentration of acetate was positively associated with Ruminobacter (p < 0.05), Actinobacteriota (p < 0.05), and Desulfobacterota (p < 0.01), whereas it showed negative correlations with Bacteroidota (p < 0.05) and Prevotella (p < 0.01). Propionate concentration was positively associated with Prevotella abundance (p < 0.05). Butyrate and valerate concentrations both correlated positively with Spirochaetota (p < 0.05). The TVFA showed a significant positive relationship with Acetitomaculum abundance (p < 0.05).

4. Discussion

CH4 is responsible for about 16% of worldwide human-made greenhouse gas emissions and has a significantly greater warming potential compared to CO2 [30]. The production of ruminal CH4 is a multifaceted trait affected by various factors, such as DMI, the composition of feed, the microbiota present in the rumen, the ratio of fermentation byproducts, genetic traits of the host, and environmental influences [31]. Upon entering the rumen of ruminants, cellulose undergoes fermentation, yielding VFAs and reduced H2. Within the rumen ecosystem, methanogenic archaea efficiently utilize the reduced H2 produced by other microorganisms through an interspecies H2 transfer mechanism [32]. Research indicates that CH4 production exhibits a gradual decline trend as nitrate supplementation in ruminant diets increases [33]. Research has shown that incorporating NO3 into ruminant diets can effectively reduce CH4 emissions in vivo, with observed reduction potentials ranging from 6.8% to 12.5% for each 1% of NO3 added on a dry DM basis per day [34]. Asanuma et al. [35] reported a sharp decrease in the number of methanogens in the rumen of goats following the addition of nitrate, suggesting that nitrate may be toxic to methanogens, thereby reducing CH4 emissions by inhibiting their activity. However, findings on the effects of nitrate on CH4 emissions are not consistent across studies. Meller et al. [36] and Rebelo et al. [37] observed reduced CH4 emissions with dietary nitrate supplementation but noted no significant differences in CH4 production. This difference is mainly linked to reduced DMI resulting from the nitrate effect, as there is a positive correlation between feed intake and intestinal CH4 emissions. In this study, the reduction in methane emissions was accompanied by no significant differences in DMI among treatment groups. Specifically, the dietary addition of 3% calcium nitrate significantly reduced CH4 production, which is in agreement with the findings of the aforementioned researchers. There was no significant difference in methane emissions per unit of acid-detergent fiber intake, which may be attributed to the influence of individual variation. Furthermore, the lack of data on methemoglobin in this study represents a limitation, and there may be differences in the safety thresholds across different species, highlighting the need for further studies on the effects of nitrate in the rumen.
In the present study, DMI and ADG were slightly higher in the CAL group compared to the CON group, although no significant differences were observed between the two groups. Meller et al. [36] and Rebelo et al. [37] noted that nitrate addition decreased DMI by approximately 8.0% at similar levels of inclusion, which was initially attributed to nitrate toxicity, characterized by elevated blood methemoglobin levels exceeding 20% of total hemoglobin. When animals were gradually acclimated to nitrate or protective nitrates were used, the decrease in DMI was primarily due to the bitter taste of nitrates, rather than toxicity. This suggests that gradual acclimatization is crucial for maintaining DMI levels without compromising animal performance or health. For instance, Halmemies et al. [9] fed growing goats (initial BW of 10 kg) diets supplemented with 5.0% calcium nitrate or 2.6% urea for 12 weeks and observed that growth rates were comparable when calcium nitrate was used as the main nitrogen source. Similarly, Van Zijderveld et al. [38] found no detrimental effects on DMI and ADG when crossbred Texel lambs (initial BW 43 kg) were fed 26 g/kg DM calcium nitrate for 4 weeks. Seyyedsalehi et al. [39] concluded that DMI reductions and signs of nitrate toxicity only occurred when diets contained more than 30 g/kg nitrate for sheep and more than 10 g/kg nitrate for beef cattle. Li et al. [10] also demonstrated that, compared to urea, nitrate (21 g/kg DM) did not significantly affect DMI but resulted in a 19% decrease in ADG, highlighting the need for further studies on the effects of nitrate in the rumen.
Enhancing the efficiency of microbial protein production in the rumen markedly reduces the urinary excretion of nitrogen-containing metabolites. The mechanism underlying this process is the efficient utilization properties of microbial proteins during digestion, which enable the nitrogen in their metabolites to be fully absorbed by the host, thereby minimizing urinary nitrogen losses [40]. In this investigation, significant differences were not found between the CAL and CON groups regarding nitrogen metabolism. These results align with those presented by Li et al. [10], who indicated that the inclusion of nitrate did not affect the digestibility of DM or nitrogen (N) when compared to that of control diets. The findings from the current study further suggest that nitrate may act as a nitrogen source for microbial development in the rumen. Thus, it is logical to propose that nitrate is efficiently utilized as a nitrogen source for microbial growth within the rumen. Additionally, Almeida et al. [41] noted an increase in rumen microbial nitrogen outflow from 9.3 to 11.8 g N daily as the dietary nitrate concentration was elevated from 0% to 4%. Similarly, some researchers have found that sheep fed nitrate-supplemented diets consumed more N compared to those fed urea-supplemented diets. However, this increased intake did not affect the apparent digestibility of N in sheep [42]. When considering energy efficiency, energy losses through CH4 were reduced by 3.5% in sheep consuming nitrate-supplemented diets. Although the proportion of energy lost as CH4 was lower for nitrate-added diets, no significant differences in metabolic energy intake were observed between treatments.
The rumen is a central component of the digestive system in ruminants, playing a vital role in the degradation of fibrous feeds and serving as the primary site for the absorption of key nutrients, such as proteins and trace elements [43]. Maintaining a healthy and balanced rumen environment is crucial for optimizing digestive efficiency and nutrient absorption in ruminants. The pH of rumen fluid is a key indicator of the fermentation environment within the rumen, with changes in pH directly reflecting the conditions of fermentation. The normal pH range for rumen fluid is typically 6.0 to 7.0 [44]. Following feeding, ruminal pH typically decreases and then gradually increases due to the absorption of VFAs, rumination, and salivation [45]. The present study also observed this pattern of pH fluctuation. In contrast to our results, Mahmoudi et al. [46] did not find a significant difference in rumen fluid pH when dietary nitrate was introduced for fattening rams. Nevertheless, other research has yielded contrasting outcomes. Ungerfeld et al. [47] detected a notable increase in rumen fluid pH with the supplementation of nitrate in an in vitro batch culture. Likewise, Hassan et al. [48] reported that incorporating nitrate into diets at concentrations of 6.84 g/kg DM and 6.80 g/kg DM led to higher pH levels. Additionally, an in vitro experiment by Zhou et al. [49] revealed that significant pH increases occurred when nitrate levels exceeded 24 μmol/L. These findings align with those of the current experiment.
NH3-N is released by rumen microorganisms during the decomposition of nitrogenous substances in feed. It serves not only as a key nitrogen source during rumen microbial fermentation but also as a fundamental indicator for assessing the efficiency of converting feed nitrogen to microbial nitrogen [50]. In the current study, the concentrations of NH3-N rose at 3 h after feeding when compared to pre-feeding levels, though no significant differences were found among the groups. The CAL group’s NH3-N concentration was greater than that of the CON group, mainly because calcium nitrate was included in the diet, resulting in nitrite production and subsequently higher rumen NH3-N levels [51]. Almeida et al. [41] noted that incorporating nitrate into the diet enhanced NH3-N production in the rumen, which aligns with the findings of this study. However, previous in vitro studies have shown that nitrate supplementation had no effect on NH3-N concentration [52,53]. Conversely, other reports indicate that nitrate supplementation may reduce NH3-N concentrations [54]. These conflicting results suggest that nitrate metabolism in the rumen is not exclusively converted to NH3, and its impact on NH3-N levels may vary depending on the experimental conditions and dietary formulations.
Ruminants derive 60% to 80% of their energy from VFAs produced through rumen digestion of nutrients [55]. Under standard conditions, the minimum hydrogen requirement for acetate synthesis by acetogenic bacteria is approximately 10 to 100 times higher than that for methanogenesis by methanogenic archaea [56]. If ruminal VFA production is shifted towards propionate (lower acetate-to-propionate ratio, A:P), the net balance of H2 in the rumen is reduced, thereby decreasing CH4 production [57]. Research indicates that the supplementation of nitrate enhances the growth of specific bacteria that degrade fiber in the rumen, as well as boosts the production of valeric acid within this environment [58]. The impact of nitrate supplementation on the composition of VFAs has shown variability among different studies. For instance, Feng et al. [57] observed a linear increase in the proportion of propionic acid with the administration of three calcium nitrate doses at 5.3, 13.6, and 21.1 g/kg DM, a finding that aligns with the conclusions of the present study. This variation may be attributed to differences in sampling time and the dose-dependent effect of nitrate supplementation on CH4 mitigation [57]. Numerous investigations highlighted a notable impact of nitrate supplementation on the profiles of VFAs, with sampling often conducted shortly after feeding—especially in grazing cows given dietary nitrate at concentrations of 22.5, 21.5, and 18 g/kg DM [59]. Conversely, Li et al. [10] reported no influence of nitrate supplementation on rumen VFAs when samples were taken from goats over six hours post-feeding. In our current study, we noted alterations in acetate proportions due to treatment and a marked reduction in the A:P ratio, which somewhat diverges from certain earlier findings [60]. This reduction was linked to an increase in H2 release and a boost in the abundance and functioning of microorganisms that produce acetate [51]. Moreover, a noteworthy decrease in the A:P ratio was noted in the CAL group in contrast to the CON group, which could be linked to changes in the fermentation process resulting from variations in the relative abundance of rumen microorganisms, including Fibrobacterium and Ruminococcus species.
In the current study, it was observed that the relative abundance of the methanogenic genus Methanobrevibacter diminished at the genus level. Bharanidharan et al. [61] similarly noted that the addition of NO3 resulted in a 54% decrease in the population of methanogenic bacteria in ruminants. Furthermore, Li et al. [10] indicated that nitrate could significantly lower both Methanobrevibacter levels and CH4 emissions in sheep. Other research has also indicated that nitrate supplementation helps reduce the numbers of methanogenic bacteria, consequently leading to a decrease in CH4 production during fermentation. This has important implications for controlling greenhouse gas emissions from ruminants and reducing the energy losses associated with CH4 emissions from animal feeds, which can range from 2% to 12% [62]. Furthermore, these studies suggest that nitrates can exert long-term effects on rumen methanogenic bacteria [63,64]. In the rumen, CH4 is primarily produced by methanogenic archaea, which use H2 and CO2 as substrates for CH4 synthesis [65]. When nitrates enter the rumen, nitrate-reducing bacteria utilize H2 as an electron donor and nitrate ions as an electron acceptor. Through the action of nitrate reductase, nitrates are reduced to nitrites [66]. During this reduction process, nitrates compete with methanogens for electrons from H2 donors, thereby inhibiting CH4 production, reducing greenhouse gas emissions, and minimizing feed energy waste [67]. Patra and Yu [68] observed that nitrate has a high electron affinity, which allows it to outcompete methanogens for electrons, thereby further inhibiting CH4 production.

5. Conclusions

The research illustrated that the supplementation of dietary calcium nitrate in Liuyang black goats led to a significant decrease in CH4 and CO2 emissions, thus emphasizing its potential as a method for reducing greenhouse gas emissions from ruminant animals. Additionally, the results indicated that calcium nitrate influenced ruminal fermentation dynamics and modified the makeup of the rumen microbiota. These findings highlight the possible advantages of using calcium nitrate as a feed additive to enhance the sustainability of goat production systems. Future investigations should aim to refine the dosage of calcium nitrate and examine its long-term implications for animal health, productivity, and overall environmental effects.

Author Contributions

Conceptualization, M.L. and C.Z.; Formal analysis, M.L. and C.Z.; Funding acquisition, C.Z. and H.Z.; Investigation, M.L., X.N., J.W. and B.C.; Methodology, T.L., C.Z. and H.Z.; Project administration, T.L., C.Z. and H.Z.; Supervision, T.L., C.Z. and H.Z.; Writing—original draft, M.L.; Writing—review and editing, C.Z. and H.Z. All authors have read and agreed to the published version of the manuscript.

Funding

This research received funding from several sources, including the National Natural Science Foundation of China (grant numbers 32472938 and 32160803), the Publicly Recruited Doctoral Research Startup Fund Project at Gansu Agricultural University (grant number GAU-KYQD-2024-07), the Key Talent Project of Gansu Province (grant number 2024RCXM60), the Longyuan Youth Talent Special Support Program of Gansu Province (Document No. 11 from the Provincial Committee Talent Work Group, 2024), and the Discipline Team Project at Gansu Agricultural University (GAU-XKTD-2022-20).

Institutional Review Board Statement

All experiments in this study were conducted following the approved guidelines of the Regulation Standing Committee of the Gansu People’s Congress. The Ethics Committee of the Gansu Agriculture University approved all experimental protocols and sample collections under permit number GSAU-Eth-AST-2024-023.

Informed Consent Statement

Informed consent was obtained from all subjects involved in the study.

Data Availability Statement

The data will be made available from the corresponding author upon reasonable request.

Acknowledgments

We sincerely thank Ying Yun for her valuable input in probability design, formal analysis, survey research, and the development of the initial draft. We are also grateful to Yi Wang for his assistance with fundraising and the execution of the survey. Our heartfelt appreciation extends to all individuals who participated in this experiment.

Conflicts of Interest

The authors declare that there is no conflict of interest.

Abbreviations

In this manuscript, the abbreviations listed below are utilized:
CALCalcium Nitrate Group
CONControl Group
CH4Methane
NH3-NAmmonia Nitrogen
A:PAcetate-to-propionate Ratio
VFAsVolatile Fatty Acids
CO2Carbon Dioxide
GHGsGreenhouse Gases
ADGAverage Daily Weight Gain
BWBody Weight

References

  1. Wang, W.; Lund, P.; Larsen, M.; Weisbjerg, M.R. Effect of nitrate supplementation, dietary protein supply, and genetic yield index on performance, methane emission, and nitrogen efficiency in dairy cows. J. Dairy Sci. 2023, 106, 5433–5451. [Google Scholar] [CrossRef] [PubMed]
  2. Dlamini, J.C.; Cárdenas, L.; Tesfamariam, E.H.; Dunn, R.; Hawkins, J.; Blackwell, M.; Evans, J.; Collins, A. Soil methane (CH4) fluxes in cropland with permanent pasture and riparian buffer strips with different vegetation. J. Plant Nutr. Soil Sci. 2021, 185, 132–144. [Google Scholar] [CrossRef]
  3. Chang, J.; Peng, S.; Ciais, P.; Saunois, M.; Dangal, S.R.S.; Herrero, M.; Havlík, P.; Tian, H.; Bousquet, P. Revisiting enteric methane emissions from domestic ruminants and their δ13CCH4 source signature. Nat. Commun. 2019, 10, 3420. [Google Scholar] [CrossRef] [PubMed]
  4. Cheng, M.; McCarl, B.; Fei, C. Climate change and livestock production: A literature review. Atmosphere 2022, 13, 140. [Google Scholar] [CrossRef]
  5. Jafari, S.; Meng, G.Y.; Rajion, M.A.; Ebrahimi, M. The use of plant by-products as non-conventional feedstuff for livestock feeding with reference to rumen methanogenesis. Agrofor. Syst. 2019, 10, 1491–1500. [Google Scholar] [CrossRef]
  6. Adejoro, F.A.; Hassen, A.; Akanmu, A.M.; Morgavi, D.P. Replacing urea with nitrate as a non-protein nitrogen source increases lambs’ growth and reduces methane production, whereas acacia tannin has no effect. Anim. Feed. Sci. Technol. 2020, 259, 114360. [Google Scholar] [CrossRef]
  7. Honan, M.; Feng, X.; Tricarico, J.M.; Kebreab, E. Feed additives as a strategic approach to reduce enteric methane production in cattle: Modes of action, effectiveness and safety. Anim. Prod. Sci. 2021, 62, 1303–1317. [Google Scholar] [CrossRef]
  8. Lee, C.; Beauchemin, K.A. A review of feeding supplementary nitrate to ruminant animals: Nitrate toxicity, methane emissions, and production performance. Can. J. Anim. Sci. 2014, 94, 557–570. [Google Scholar] [CrossRef]
  9. Halmemies-Beauchet-Filleau, A.; Rinne, M.; Lamminen, M.; Mapato, C.; Ampapon, T.; Wanapat, M.; Vanhatalo, A. Review: Alternative and novel feeds for ruminants: Nutritive value, product quality and environmental aspects. Animal 2018, 12, 295–309. [Google Scholar] [CrossRef]
  10. Li, L.; Davis, J.; Nolan, J.; Hegarty, R. An initial investigation on rumen fermentation pattern and methane emission of sheep offered diets containing urea or nitrate as the nitrogen source. Anim. Prod. Sci. 2012, 52, 653–658. [Google Scholar] [CrossRef]
  11. Hristov, A.N.; Oh, J.; Giallongo, F.; Frederick, T.W.; Harper, M.T.; Weeks, H.L.; Branco, A.F.; Moate, P.J.; Deighton, M.H.; Williams, S.R.O.; et al. An inhibitor persistently decreased enteric methane emission from dairy cows with no negative effect on milk production. Proc. Natl. Acad. Sci. USA 2015, 112, 10663–10668. [Google Scholar] [CrossRef] [PubMed]
  12. NY/T816-2021; Nutritional Requirements of Mutton. Ministry of Agriculture and Rural Affairs: Beijing, China, 2021.
  13. Wang, J.; Liu, T.; Xu, J.F.; Liu, H.H.; Sun, K.; Fan, H.Y.; Zhu, S.X.; Ran, H.; Zheng, C. Mannan oligosaccharides reduce the carbon footprint by decreasing methane emission and nitrogen excretion in Xiangdong black goats. Anim. Feed Sci. Technol. 2025, 328, 116464. [Google Scholar] [CrossRef]
  14. Wang, R.; Si, H.B.; Wang, M.; Lin, B.; Deng, J.P.; Tan, L.W.; Liu, W.X.; Sun, X.Z.; Teklebrhan, T.; Tan, Z.L. Effects of elemental magnesium and magnesium oxide on hydrogen, methane and volatile fatty acids production in in vitro rumen batch cultures. Anim. Feed Sci. Technol. 2019, 252, 74–82. [Google Scholar] [CrossRef]
  15. AOAC International. Official Methods of Analysis of AOAC International, 18th ed; Oxford University Press: Oxford, UK, 2012. [Google Scholar]
  16. Soest, P.J.V.; Robertson, J.B.; Lewis, B.A. Methods for dietary fiber, neutral detergent fiber, and nonstarch polysaccharides in relation to animal nutrition. J. Dairy Sci. 1991, 74, 83–97. [Google Scholar] [CrossRef]
  17. National Research Council. Nutrient Requirements of Small Ruminants: Sheep, Goats, Cervids, and New World Camelids; The National Academies Press: Washington, DC, USA, 2007. [Google Scholar]
  18. Broderick, G.A.; Kang, J.H. Automated simultaneous determination of ammonia and total amino acids in ruminal fluid and in vitro media. J. Dairy Sci. 1980, 63, 64–75. [Google Scholar] [CrossRef]
  19. Yang, X.H.; Liu, T.; Zhou, J.W.; An, L.J.; Pan, F.M.; Zhang, H.; Wang, X.J.; Xu, G.Y.; Zheng, C. Effects of Bacillus subtilis addition to milk replacer on growth performance, nutrient digestibility, intestinal crobiota, and short-chain fatty acid concentration of Hu lambs. Anim. Feed Sci. Technol. 2025, 319, 116175. [Google Scholar] [CrossRef]
  20. Tang, L.; Li, Y.; Srivathsan, A.; Gao, Y.; Li, K.; Hu, D.; Zhang, D. Gut microbiomes of endangered przewalski’s horse populations in short- and long-term captivity: Implication for species reintroduction based on the soft-release strategy. Front. Microbiol. 2020, 11, 363. [Google Scholar] [CrossRef]
  21. Li, X.; Brejnrod, A.D.; Ernst, M.; Rykær, M.; Herschend, J.; Olsen, N.M.C.; Dorrestein, P.C.; Rensing, C.; Sørensen, S.J. Heavy metal exposure causes changes in the metabolic health-associated gut microbiome and metabolites. Environ. Int. 2019, 126, 454–467. [Google Scholar] [CrossRef]
  22. Kozich, J.J.; Westcott, S.L.; Baxter, N.T.; Highlander, S.K.; Schloss, P.D. Development of a dual-index sequencing strategy and curation pipeline for analyzing amplicon sequence data on the miseq illumina sequencing platform. Appl. Environ. Microbiol. 2013, 79, 5112–5120. [Google Scholar] [CrossRef]
  23. Magoc, T.; Salzberg, S.L. Flash: Fast length adjustment of short reads to improve genome assemblies. Bioinformatics 2011, 27, 2957–2963. [Google Scholar] [CrossRef]
  24. Caporaso, J.G.; Kuczynski, J.; Stombaugh, J.; Bittinger, K.; Bushman, F.D.; Costello, E.K.; Fierer, N.; Pena, A.G.; Goodrich, J.K.; Gordon, J.I.; et al. Qiime allows analysis of high-throughput community sequencing data. Nat. Methods 2010, 7, 335–336. [Google Scholar] [CrossRef]
  25. Rognes, T.; Flouri, T.; Nichols, B.; Quince, C.; Mahe, F. Vsearch: A versatile open source tool for metagenomics. PeerJ 2016, 4, e2584. [Google Scholar] [CrossRef] [PubMed]
  26. Wang, Z.; Yu, Y.; Li, X.; Xiao, H.; Zhang, P.; Shen, W.; Wan, F.; He, J.; Tang, S.; Tan, Z.; et al. Fermented soybean meal replacement in the diet of lactating holstein dairy cows: Modulated rumen fermentation and ruminal microflora. Front. Microbiol. 2021, 12, 625857. [Google Scholar] [CrossRef] [PubMed]
  27. Wang, Z.; Elekwachi, C.; Jiao, J.; Wang, M.; Tang, S.; Zhou, C.; Tan, Z.; Forster, R.J. Changes in metabolically active bacterial community during rumen development, and their alteration by rhubarb root powder revealed by 16s rrna amplicon sequencing. Front. Microbiol. 2017, 8, 159. [Google Scholar] [CrossRef] [PubMed]
  28. Fomenky, B.E.; Chiquette, J.; Bissonnette, N.; Talbot, G.; Chouinard, P.Y.; Ibeagha-Awemu, E.M. Impact of saccharomyces cerevisiae boulardii cncmi-1079 and lactobacillus acidophilus bt1386 on total lactobacilli population in the gastrointestinal tract and colon histomorphology of holstein dairy calves. Anim. Feed Sci. Technol. 2017, 234, 151–161. [Google Scholar] [CrossRef]
  29. Abhauer, K.P.; Wemheuer, B.; Daniel, R.; Meinicke, P. Tax4fun: Predicting functional profiles from metagenomic 16s rrna data. Bionformatics 2015, 31, 2882–2884. [Google Scholar]
  30. Liu, H.; Puchala, R.; LeShure, S.; Gipson, T.A.; Flythe, M.D.; Goetsch, A.L. Effects of lespedeza condensed tannins alone or with monensin, soybean oil, and coconut oil on feed intake, growth, digestion, ruminal methane emission, and heat energy by yearling alpine doelings. J. Anima Sci. 2019, 97, 885–899. [Google Scholar] [CrossRef]
  31. Greening, C.; Geier, R.; Wang, C.; Woods, L.C.; Morales, S.E.; McDonald, M.J.; Rushton-Green, R.; Morgan, X.C.; Koike, S.; Leahy, S.C.; et al. Diverse hydrogen production and consumption pathways influence methane production in ruminants. ISME J. 2019, 13, 2617–2632. [Google Scholar] [CrossRef]
  32. Li, J.; Zhao, S.; Meng, Z.; Gao, Y.; Miao, J.; Mao, S.; Jin, W. Effects of fumarate and nitroglycerin on in vitro rumen fermentation, methane and hydrogen production, and on microbiota. Biology 2023, 7, 1011. [Google Scholar] [CrossRef]
  33. Olijhoek, D.W.; Hellwing, A.L.F.; Brask, M.; Weisbjerg, M.R.; Højberg, O.; Larsen, M.K.; Dijkstra, J.; Erlandsen, E.J.; Lund, P. Effect of dietary nitrate level on enteric methane production, hydrogen emission, rumen fermentation, and nutrient digestibility in dairy cows. J. Dairy Sci. 2016, 99, 6191–6205. [Google Scholar] [CrossRef]
  34. Veneman, J.B.; Muetzel, S.; Hart, K.J.; Faulkner, C.L.; Moorby, J.M.; Perdok, H.B.; Newbold, C.J. Does dietary mitigation of enteric methane production affect rumen function and animal productivity in dairy cows? PLoS ONE 2015, 10, e104282. [Google Scholar] [CrossRef]
  35. Asanuma, N.; Yokoyama, S.; Hino, T. Effects of nitrate addition to a diet on fermentation and microbial populations in the rumen of goats, with special reference to selenomonas ruminantium having the ability to reduce nitrate and nitrite. Anim. Sci. J. 2014, 86, 378–384. [Google Scholar] [CrossRef] [PubMed]
  36. Meller, R.A.; Wenner, B.A.; Ashworth, J.; Gehman, A.M.; Lakritz, J.; Firkins, J.L. Potential roles of nitrate and live yeast culture in suppressing methane emission and influencing ruminal fermentation, digestibility, and milk production in lactating jersey cows. J. Dairy Sci. 2019, 102, 6144–6156. [Google Scholar] [CrossRef] [PubMed]
  37. Rebelo, L.R.; Luna, I.C.; Messana, J.D.; Araujo, R.C.; Simioni, T.A.; Granja-Salcedo, Y.T.; Vito, E.S.; Lee, C.; Teixeira, I.A.M.A.; Rooke, J.A.; et al. Effect of replacing soybean meal with urea or encapsulated nitrate with or without elemental sulfur on nitrogen digestion and methane emissions in feedlot cattle. Anim. Feed Sci. Techol. 2019, 257, 114293. [Google Scholar] [CrossRef]
  38. van Zijderveld, S.M.; Gerrits, W.J.J.; Apajalahti, J.A.; Newbold, J.R.; Dijkstra, J.; Leng, R.A.; Perdok, H.B. Nitrate and sulfate: Effective alternative hydrogen sinks for mitigation of ruminal methane production in sheep. J. Dairy Sci. 2010, 93, 5856–5866. [Google Scholar] [CrossRef]
  39. Seyyedsalehi, M.S.; Mohebbi, E.; Tourang, F.; Sasanfar, B.; Boffetta, P.; Zendehdel, K. Association of dietary nitrate, nitrite, and n-nitroso compounds intake and gastrointestinal cancers: A systematic review and meta-analysis. Toxics 2023, 11, 190. [Google Scholar] [CrossRef]
  40. Yin, H.; Li, B.; Wang, X.; Xi, Z. Effect of ammonium and nitrate supplies on nitrogen and sucrose metabolism of cabernet sauvignon. J. Sci. Food Agric. 2020, 100, 5239–5250. [Google Scholar] [CrossRef]
  41. Almeida, K.V.; Santos, G.T.; Daniel, J.L.P.; Nino-de-Guzman, C.; Amaro, F.X.; Sultana, H.; Arriola, K.G.; Araujo, R.C.; Vyas, D. Effects of nitrate sources on in vitro methane production and ruminal fermentation parameters in diets differing in starch degradability. Anim. Feed Sci. Technol. 2022, 292, 115437. [Google Scholar] [CrossRef]
  42. Santos, K.C.; Carvalho, F.F.R.; Carriero, M.M.; Magalhães, A.L.R.; Batista, A.M.V.; Fagundes, G.M.; Bueno, I.C.S. Use of different carbohydrate sources associated with urea and implications for in vitro fermentation and rumen microbial populations. Anim. Prod. Sci. 2020, 60, 1028–1038. [Google Scholar] [CrossRef]
  43. Park, T.; Wijeratne, S.; Meulia, T.; Firkins, J.L.; Yu, Z. The macronuclear genome of anaerobic ciliate entodinium caudatum reveals its biological features adapted to the distinct rumen environment. Genomics 2021, 113, 1416–1427. [Google Scholar] [CrossRef]
  44. Tan, Z.; Liu, J.; Wang, L. Factors affecting the rumen fluid foaming performance in goat fed high concentrate diet. Front. Vet. Sci. 2024, 11, 1299404. [Google Scholar] [CrossRef]
  45. Bokharaeian, M.; Ghoorchi, T.; Toghdory, A.; Esfahani, I.J. The dose-dependent role of sage, clove, and pine essential oils in modulating ruminal fermentation and biohydrogenation of polyunsaturated fatty acids: A promising strategy to reduce methane emissions and enhance the nutritional profile of ruminant products. Appl. Sci. 2023, 13, 11605. [Google Scholar] [CrossRef]
  46. Mahmoudi-Abyane, M.; Alipour, D.; Moghimi, H.R. Effects of different sources of nitrogen on performance, relative population of rumen microorganisms, ruminal fermentation and blood parameters in male feedlotting lambs. Animal 2019, 14, 1438–1446. [Google Scholar] [CrossRef] [PubMed]
  47. Ungerfeld, E.M.; Aedo, M.F.; Martínez, E.D.; Saldivia, M. Inhibiting methanogenesis in rumen batch cultures did not increase the recovery of metabolic hydrogen in microbial amino acids. Microorganisms 2019, 7, 115. [Google Scholar] [CrossRef] [PubMed]
  48. Hassan, F.U.; Guo, Y.; Li, M.; Tang, Z.; Peng, L.; Liang, X.; Yang, C. Effect of methionine supplementation on rumen microbiota, fermentation, and amino acid metabolism in in vitro cultures containing nitrate. Microorganisms 2021, 9, 1717. [Google Scholar] [CrossRef]
  49. Zhou, X.; Stevens, M.J.A.; Neuenschwander, S.; Schwarm, A.; Kreuzer, M.; Bratus-Neuenschwander, A.; Zeitz, J.O. The transcriptome response of the ruminal methanogen methanobrevibacter ruminantium strain m1 to the inhibitor lauric acid. BMC Res. Notes 2018, 11, 135. [Google Scholar] [CrossRef]
  50. Clemens, E.T.; Johnson, R.R. Influence of dietary nitrogen source, concentrate level and biuret level in sheep on the adaptation of rumen microorganisms to biuret as a nonprotein nitrogen source. J. Nutr. 2023, 103, 1406–1413. [Google Scholar] [CrossRef]
  51. Patra, A.K.; Yu, Z. Effects of garlic oil, nitrate, saponin and their combinations supplemented to different substrates on in vitro fermentation, ruminal methanogenesis, and abundance and diversity of microbial populations. J. Appl. Microbiol. 2015, 119, 127–138. [Google Scholar] [CrossRef]
  52. Guyader, J.; Tavendale, M.; Martin, C.; Muetzel, S. Dose-response effect of nitrate on hydrogen distribution between rumen fermentation end products: An in vitro approach. Anim. Prod. Sci. 2016, 56, 224–330. [Google Scholar] [CrossRef]
  53. Guyader, J.; Ungerfeld, E.M.; Beauchemin, K.A. Redirection of metabolic hydrogen by inhibiting methanogenesis in the rumen simulation technique (rusitec). Front. Microbiol. 2017, 8, 393. [Google Scholar] [CrossRef]
  54. Villar, M.L.; Hegarty, R.S.; Clay, J.W.; Smith, K.A.; Godwin, I.R.; Nolan, J.V. Dietary nitrate and presence of protozoa increase nitrate and nitrite reduction in the rumen of sheep. J. Anim. Physiol. Anim. Nutr. 2020, 104, 1242–1255. [Google Scholar] [CrossRef] [PubMed]
  55. Orskov, E.R. Starch digestion and utilization in ruminants. J. Anim. Sci. 1986, 63, 1624–1633. [Google Scholar] [CrossRef] [PubMed]
  56. Nozhevnikova, A.N.; Simankova, M.V.; Parshina, S.N.; Kotsyurbenko, O.R. Temperature characteristics of methanogenic archaea and acetogenic bacteria isolated from cold environments. Water Sci. Technol. 2018, 44, 41–48. [Google Scholar] [CrossRef]
  57. Feng, X.Y.; Dijkstra, J.; Bannink, A.; van Gastelen, S.; France, J.; Kebreab, E. Antimethanogenic effects of nitrate supplementation in cattle: A meta-analysis. J. Dairy Sci. 2020, 103, 11375–11385. [Google Scholar] [CrossRef]
  58. Zhao, L.; Meng, Q.; Ren, L.; Liu, W.; Zhang, X.; Huo, Y.; Zhou, Z. Effects of nitrate addition on rumen fermentation, bacterial biodiversity and abundance. Anim. Biosci. 2015, 28, 1433–1441. [Google Scholar] [CrossRef]
  59. Romero-Pérez, A.; Alemu, A.; Araujo, R.; Beauchemin, K. 98 effect of slow release nitrate and essential oil on animal performance and methane emissions from feedlot cattle fed high-grain finishing diets. J. Anim. Sci. 2018, 96, 409. [Google Scholar] [CrossRef]
  60. Troy, S.M.; Duthie, C.A.; Hyslop, J.J.; Roehe, R.; Ross, D.W.; Wallace, R.J.; Waterhouse, A.; Rooke, J.A. Effectiveness of nitrate addition and increased oil content as methane mitigation strategies for beef cattle fed two contrasting basal diets. J. Anim. Sci. 2015, 93, 1815–1823. [Google Scholar] [CrossRef]
  61. Bharanidharan, R.; Tomple, B.M.; Lee, J.; Nirmal Athauda, A.A.K.; Huh, S.; Hong, W.; Kim, N.Y.; Lim, D.H.; Kim, J.G.; Kim, K.H.; et al. Effects of dietary supplementation of nitrate on enteric methane production, performance, and rumen microbiome of hanwoo steers. J. Anim. Sci. 2025, 103, skaf109. [Google Scholar] [CrossRef]
  62. Ripple, W.J.; Smith, P.; Haberl, H.; Montzka, S.A.; McAlpine, C.; Boucher, D.H. Ruminants, climate change and climate policy. Nat. Clim. Change 2013, 4, 2–5. [Google Scholar] [CrossRef]
  63. Marais, B.J.P.; Therion, J.J.; Mackie, R.I.; Kistner, A.; Dennison, C. Effect of nitrate and its reduction products on the growth and activity of the rumen microbial population. Br. J. Nutr. 1988, 59, 301–313. [Google Scholar] [CrossRef]
  64. Zhou, Z.; Yu, Z.; Meng, Q. Effects of nitrate on methane production, fermentation, and microbial populations in in vitro ruminal cultures. Bioresour. Technol. 2012, 103, 173–179. [Google Scholar] [CrossRef]
  65. Morgavi, D.P.; Forano, E.; Martin, C.; Newbold, C.J. Microbial ecosystem and methanogenesis in ruminants. Animal 2010, 4, 1024–1036. [Google Scholar] [CrossRef]
  66. Iwamoto, M.; Asanuma, N.; Hino, T. Ability of selenomonas ruminantium, veillonella parvula, and wolinella succinogenes to reduce nitrate and nitrite with special reference to the suppression of ruminal methanogenesis. Anaerobe 2002, 8, 209–215. [Google Scholar] [CrossRef]
  67. Nolan, J.V.; Hegarty, R.S.; Hegarty, J.; Godwin, I.R.; Woodgate, R. Effects of dietary nitrate on fermentation, methane production and digesta kinetics in sheep. Anim. Prod. Sci. 2010, 50, 801–806. [Google Scholar] [CrossRef]
  68. Patra, A.K.; Yu, Z. Combinations of nitrate, saponin, and sulfate additively reduce methane production by rumen cultures in vitro while not adversely affecting feed digestion, fermentation or microbial communities. Bioresour. Technol. 2014, 155, 129–135. [Google Scholar] [CrossRef]
Figure 1. Diurnal pattern in CH4 emission in respiration chambers (g/h). At the same time, * above the histogram indicated significant difference (p< 0.05), and ** indicated extremely significant difference (p ≤ 0.01). Abbreviation: CON = control group; CAL = calcium nitrate group.
Animals 16 01150 g001
Figure 2. Diurnal pattern in CO2 emission in respiration chambers (g/h). At the same time, * above the histogram indicated significant difference (p < 0.05), and ** indicated extremely significant difference (p ≤ 0.01). Abbreviation: CON = control group; CAL = calcium nitrate group.
Animals 16 01150 g002
Figure 3. The microbial community’s alpha diversity in the rumen is influenced by the species observed. The indexes used to measure alpha diversity comprise (a) the ACE index, (b) the chao1 index, (c) the Shannon index, and (d) the Simpson index. Abbreviations used include: CON = control group; CAL = calcium nitrate group.
Animals 16 01150 g003
Figure 4. A principal coordinate analysis (PCoA) was performed to illustrate the makeup of the rumen bacterial community subjected to different treatments, Abbreviations: CON = control group; CAL = calcium nitrate group.
Animals 16 01150 g004
Figure 5. The structure of the rumen microbiome at both the phylum and genus levels: (a) the composition of rumen microbiome at phylum level, (b) the composition of major rumen genus level; Abbreviations: CON = control group; CAL = calcium nitrate group.
Animals 16 01150 g005
Figure 6. The comparison of the microbial community composition in goat’s rumen using the LEfSe analysis (LDA = 3.5); Abbreviations: CON = control group; CAL = calcium nitrate group; LDA = linear discriminant analysis.
Animals 16 01150 g006
Figure 7. Analysis of the Spearman correlation between microbiota at the genus and phylum levels and parameters of rumen fermentation. * p < 0.05. ** p < 0.01.
Animals 16 01150 g007
Table 1. Composition and nutrition level of the experiment diets (DM basis).
ItemsTreatments 1
CONCAL
Ingredients, %
Corn straw17.7617.76
Soy husk10.3410.34
Sunflower hull2.002.00
Corn48.6049.65
Soybean meal11.357.55
Sesame cake3.003.00
Molasses5.005.00
Salt0.700.70
Expanded urea0.800.00
Calcium carbonate0.250
Premix 21.001.00
Calcium nitrate0.003.00
Total100.00100.00
Nutrient level 3
DE (MJ/kg)12.3111.92
CP (%)14.3414.70
EE (%)2.482.95
NDF (%)39.2238.09
ADF (%)17.2016.89
Ca (%)0.310.81
P (%)0.210.22
1 Treatments; control group (CON); calcium nitrate group (CAL). 2 Premix ingredients: Fe = 25 mg, Mn = 40 mg, Zn = 40 mg, Cu =8 mg, I = 0.3 mg, Se = 0.3 mg, Co = 0.1 mg, Vit A = 940 IU, Vit D = 111 IU, Vit E = 20 IU. 3 Digestible energy (DE), the digestive energy in the nutritional level was calculated, and the rest were measured; crude protein (CP), ether extract (EE), neutral detergent fiber (NDF), acid detergent fiber (ADF), calcium (Ca), phosphorus (P).
Table 2. Effects of calcium nitrate on methane emission in goats.
Items 1Treatment 2SEM 3p-Value
CONCAL
CH4
CH4 (g/d)13.7386.2721.730.041
CH4 (g/kg DMI)17.7048.0291.190.036
CH4 (g/kg ADG)75.25128.9361.310.055
CH4 (g/kg NDFI)33.99719.0771.880.072
CH4 (g/kg ADFI)49.46139.8284.190.283
CH4-E (MJ/d)0.7650.3490.100.041
CH4/BW0.751.3720.6440.170.042
CO2
CO2 (g/d)546.606275.25350.900.007
CO2 (g/kg DMI)713.616352.07262.870.001
CO2 (g/kg ADG)3133.2881267.421407.050.013
CO2 (g/kg NDFI)1308.544836.50891.800.003
CO2 (g/kg ADFI)2934.2391886.476204.630.003
CO2-E (MJ/d)4.8882.4620.460.007
CO2/BW0.7554.24828.1774.660.003
1 Items; CH4, daily methane emission; CH4/DMI, methane emission from dry matter intake; CH4/ADG, methane emission from average daily gain; CH4/NDFI, methane emission per neutral detergent fiber intake; CH4/ADFI, methane emission per acid detergent fiber intake; CH4-E, methane energy; BW0.75, metabolic body weight; CO2, daily carbon dioxide emission; CO2/DMI, carbon dioxide emission from dry matter intake; CO2/ADG, carbon dioxide emission from average daily gain; CO2/NDFI, carbon dioxide emission per neutral detergent fiber intake; CO2/ADFI, carbon dioxide emission per acid detergent fiber intake; CO2-E, carbon dioxide energy. 2 Treatments; control group (CON); calcium nitrate group (CAL). 3 SEM, standard error of means for treatments.
Table 3. Effects of calcium nitrate addition on apparent digestibility of nutrients in goats.
ItemsTreatment 2SEM 3p-Value
CONCAL
Growth performance 1
DMI, g/d764.750784.10829.620.761
ADG, g/d193.770217.72549.460.423
F/G4.6743.9980.300.297
Apparent nutrient digestibility, %
DM40.86335.1340.030.374
NDF45.71439.5490.030.258
ADF24.48319.0640.030.385
CP67.50262.4870.020.188
1 Growth performance; DMI, dry matter intake; ADG, average daily gain; F/G, feed to gain ratio DM, dry matter; NDF, neutral detergent fiber; ADF, acid detergent fiber; CP, crude protein. 2 Treatments; control group (CON); calcium nitrate group (CAL). 3 SEM, standard error of means for treatments.
Table 4. Effects of calcium nitrate addition on nitrogen metabolism in goats.
ItemsTreatment 1SEM 2p-Value
CONCAL
Nitrogen intake, g/d18.36517.1530.580.321
Faecal nitrogen, g/d6.3736.9550.390.493
Urine nitrogen, g/d6.9546.2550.550.553
Digestive nitrogen, g/d11.99310.2000.560.113
Nitrogen deposition, g/d5.0393.9450.310.074
Nitrogen digestibility, %65.32559.3430.020.149
Net protein utilization, %27.88722.9000.020.165
Biological value of protein, %43.56738.4330.030.436
1 Treatments; control group (CON); calcium nitrate group (CAL). 2 SEM, standard error of means for treatments.
Table 5. Effect of calcium nitrate on ruminal pH, NH3-N, VFAs in goats.
ItemsTreatment 1SEM 2p-Value
CONCAL
Before feeding
pH6.5636.6830.150.489
NH3-N, mg/100 mL10.80912.0440.680.378
TVFAs 3, mmol58.36067.3184.450.325
VFA proportion, mol/100 mol
Acetate60.26662.0990.780.249
Propionate 19.64717.8140.950.350
Butyrate 15.68615.7420.440.950
Valerate0.7551.0550.730.045
Isobutyrate1.3741.2410.070.361
Isovalerate2.2732.0490.110.316
Acetate/Propionate3.3543.5670.170.551
3 h after feeding
pH5.8386.2900.150.022
NH3-N, mg/100 mL13.46115.4340.720.184
TVFAs 3, mmol111.159101.9014.600.325
VFA proportion, mol/100 mol
Acetate62.75353.0141.510.001
Propionate 21.71832.3541.520.001
Butyrate 13.12013.1120.400.917
Valerate 0.6961.0220.070.014
Isobutyrate 0.2950.5600.040.001
Isovalerate 0.4410.8350.060.001
Acetate/Propionate3.0331.7470.200.001
1 Treatments; control group (CON); calcium nitrate group (CAL). 2 SEM, standard error of means for treatments. 3 TVFAs, Total volatile fatty acids.
Table 6. Relative abundance of rumen microorganisms (phylum level, %).
ItemsTreatments 1SEM 2p-Value
CONCAL
Firmicutes46.10737.1680.030.180
Bacteroidota26.48347.0360.040.007
Euryarchaeota11.9114.6640.020.094
Unidentified_Bacteria5.6775.0570.020.871
Actinobacteriota3.4100.8490.010.173
Proteobacteria2.1230.1410.010.366
Spirochaetota0.8411.2270.010.436
Fibrobacterota0.5680.8140.010.473
Cyanobacteria1.1990.0620.010.377
Desulfobacterota0.1300.0920.010.272
1 Treatments; control group (CON); calcium nitrate group (CAL). 2 SEM, standard error of means for treatments.
Table 7. Relative abundance of rumen microorganisms (genus level, %).
ItemsTreatments 1SEM 2p-Value
CONCAL
Prevotella7.97022.9520.030.001
Methanobrevibacter11.8604.6440.020.005
Ruminococcus6.3306.2950.010.991
Acetitomaculum7.1464.2760.010.254
Prevotellaceae_UCG-0012.8407.1150.010.044
Candidatus_Saccharimonas0.7643.5790.020.434
Kandleria2.3580.1620.010.367
Syntrophococcus1.8990.4450.010.335
Olsenella2.1170.1500.010.327
Ruminobacter1.6330.0180.010.363
1 Treatments; control group (CON); calcium nitrate group (CAL). 2 SEM, standard error of means for treatments.
Disclaimer/Publisher’s Note: The statements, opinions and data contained in all publications are solely those of the individual author(s) and contributor(s) and not of MDPI and/or the editor(s). MDPI and/or the editor(s) disclaim responsibility for any injury to people or property resulting from any ideas, methods, instructions or products referred to in the content.