1. Introduction
Exocrine pancreatic insufficiency (EPI) is a chronic gastrointestinal condition that is due to insufficient synthesis and secretion of digestive enzymes by the exocrine pancreas [
1]. EPI in German shepherd dogs (GSDs) is most frequently caused by pancreatic acinar atrophy (PAA), a condition where dogs are born with a normal pancreas, but the pancreas gradually atrophies in early adulthood, leading to clinical signs at around 2–3 years of age [
1,
2,
3]. In sharp contrast, EPI in other breeds of dogs is caused by chronic pancreatitis and can develop at any age [
1]. The two conditions could theoretically be distinguished based on histopathology, where dogs with PAA show no inflammation and fibrosis of the acinar tissue, while dogs with chronic pancreatitis show inflammatory infiltration of the pancreas and various degrees of fibrosis [
2]. Both PAA and chronic pancreatitis, once they have led to EPI, are associated with the same clinical signs, such as weight loss, soft voluminous stools, borborygmus, flatulence, and a poor hair coat [
1]. Many dogs with EPI, regardless of the underlying cause of the disease, respond to pancreatic enzyme replacement therapy (PERT), but both conditions might be associated with different pathophysiological changes in the gut [
4].
Several years ago, it was reported that German shepherd dogs with EPI have small intestinal bacterial overgrowth (SIBO), but it has since been clarified that this secondary disturbance of the intestinal microbiome is better referred to as intestinal dysbiosis [
5]. It has also been demonstrated that, using untargeted metabolomics, EPI is associated with a wide variety of metabolic changes [
6]. Furthermore, intestinal dysbiosis is associated with bile acid dysmetabolism as the metabolism of bile acids in the intestinal lumen mainly relies on bacterial metabolism [
7]. Thus, it would be expected that dogs with EPI show significant intestinal and systemic bile acid dysmetabolism.
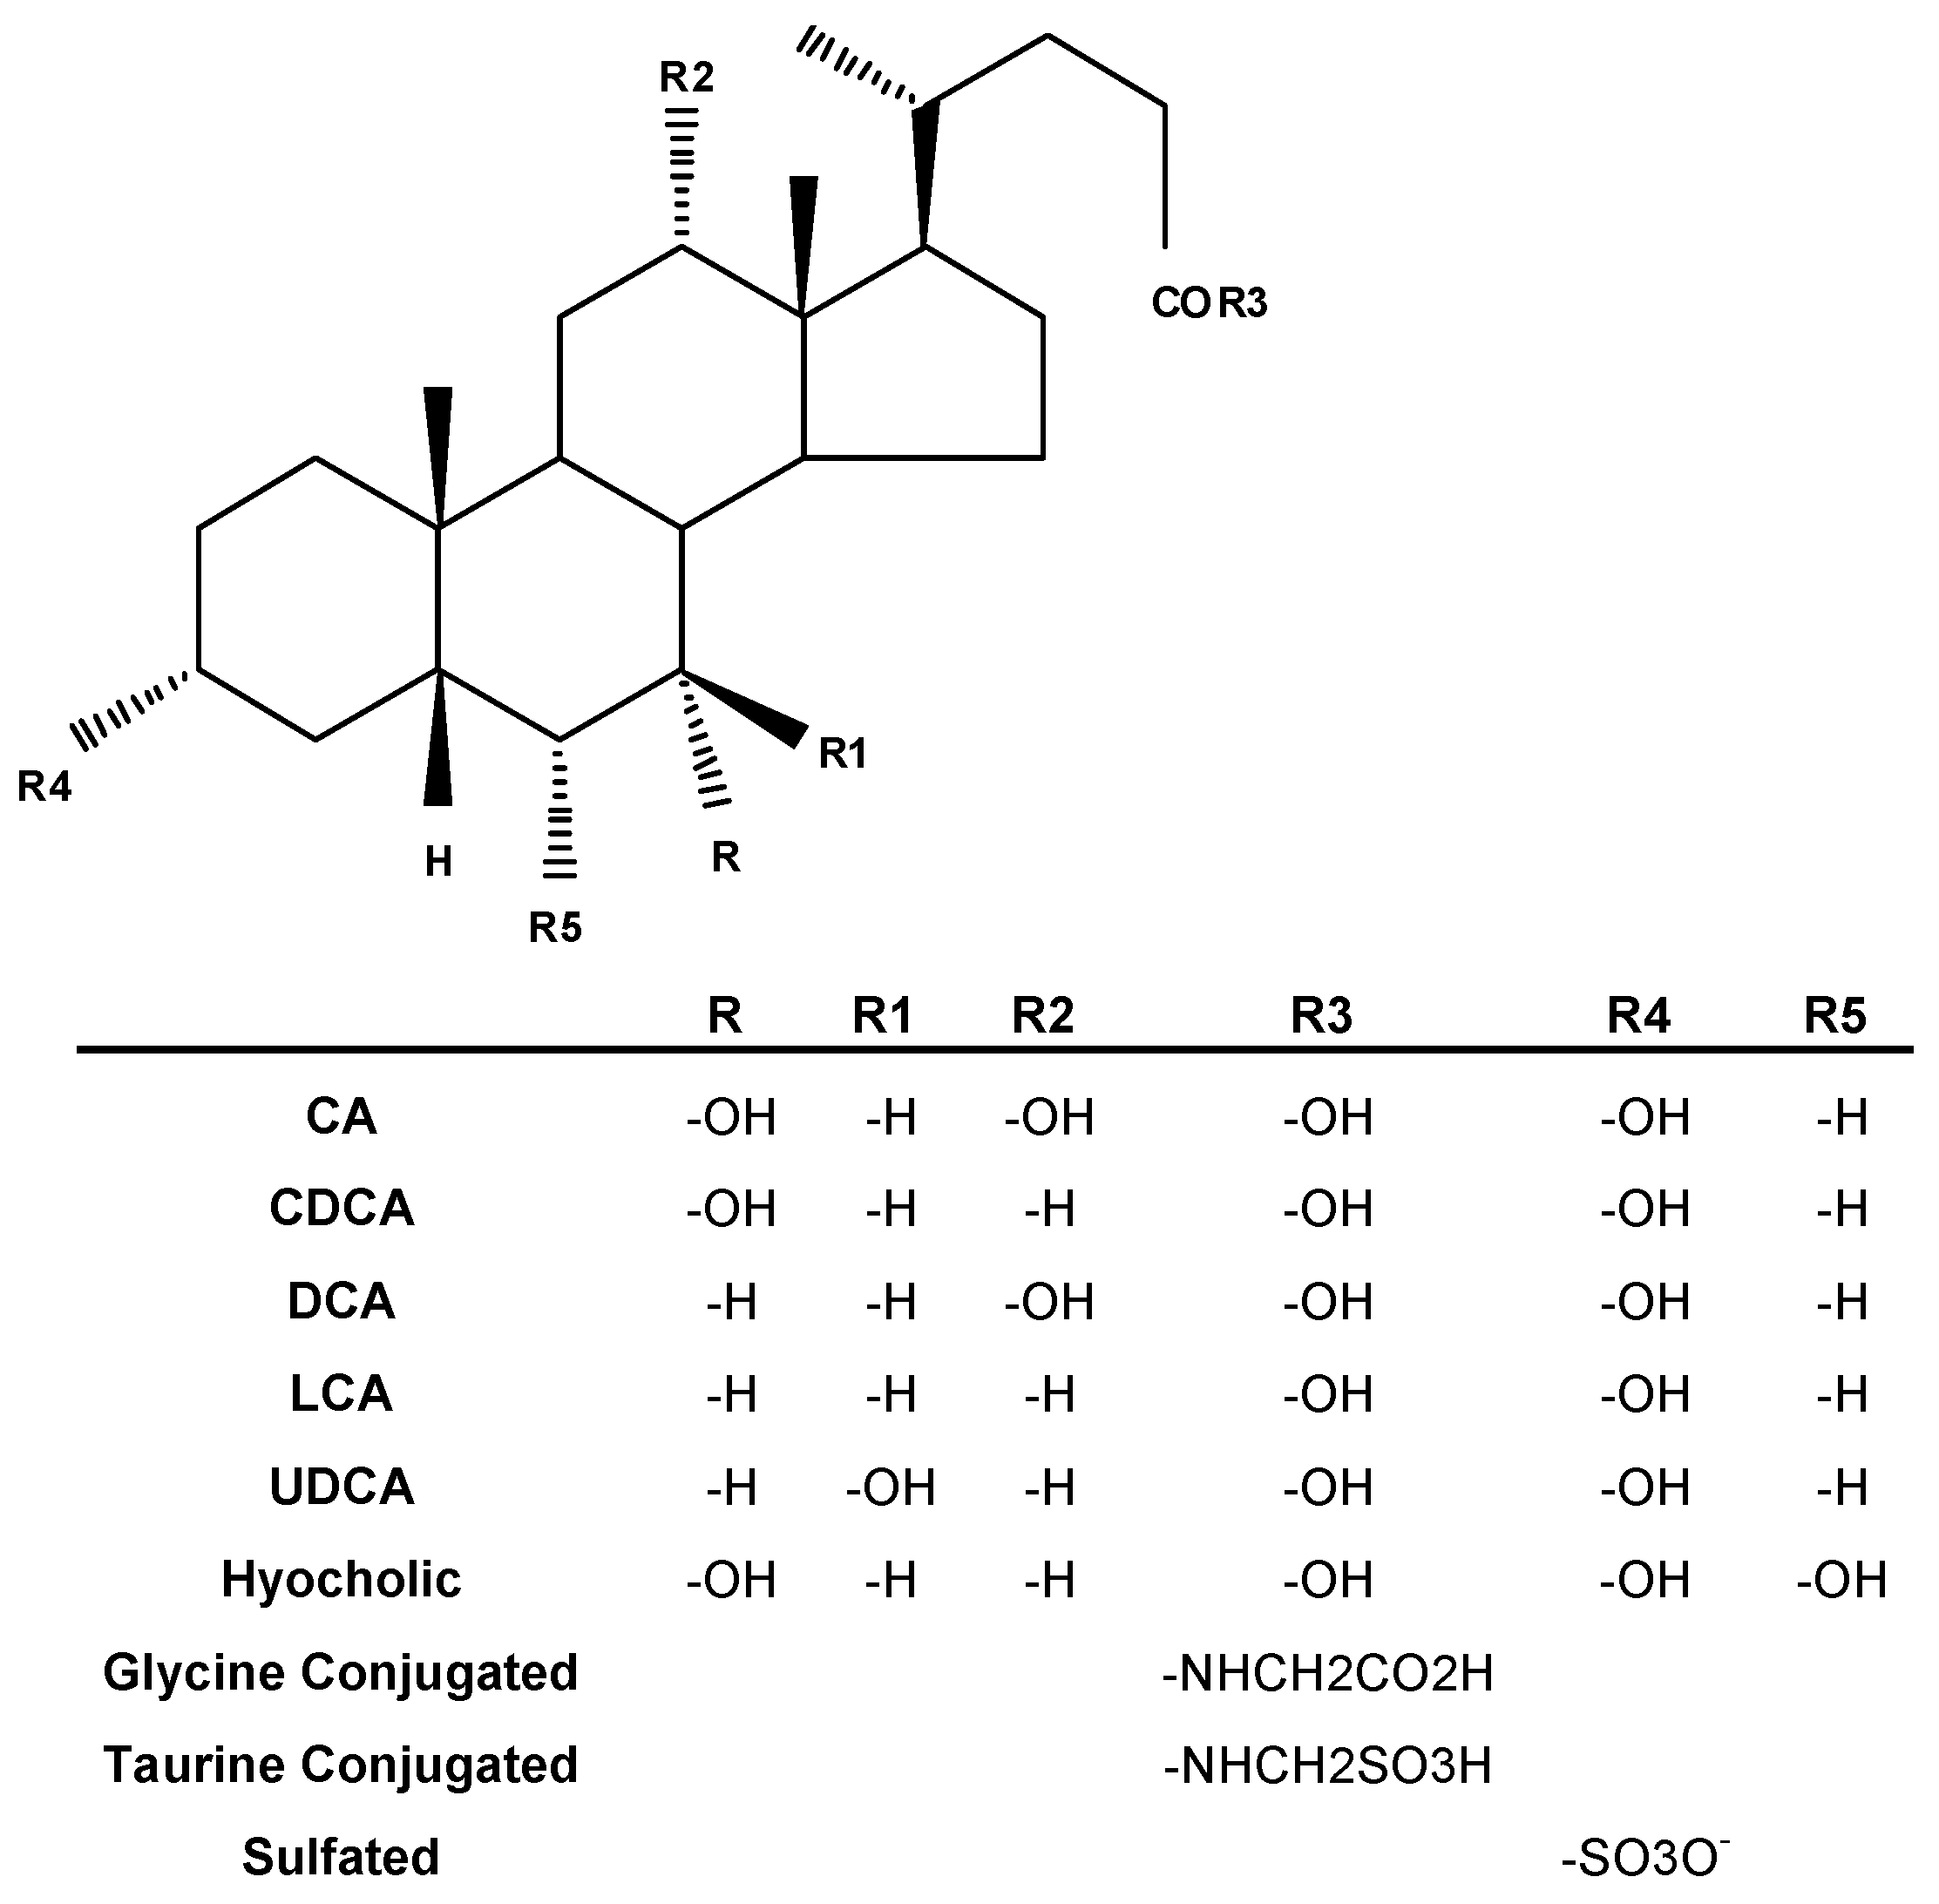
Therefore, the goal of this study was to measure and compare serum concentrations of a wide variety of bile acids (
Figure 1) between dogs with EPI and non-EPI control dogs. Furthermore, in order to be able to demonstrate differences in the pathophysiology between PAA and chronic-pancreatitis-associated EPI, serum concentrations of bile acids were compared between dogs with a high suspicion of PAA (i.e., GSDs with a cTLI ≤ 1.0 µg/L) and those with a high suspicion of chronic pancreatitis (i.e., non-GSDs with a cTLI ≤ 1.0 µg/L) and non-EPI controls of either breed group.
3. Results
Serum samples were available from a total of 99 dogs. One serum sample from one of the German shepherd dogs without EPI that had been identified was not available for analysis. Therefore, we analyzed 25 serum samples from German shepherd dogs with EPI (EPI-GSD), 24 German shepherd dogs without EPI (non-EPI-GSD), 25 dogs of non-German-shepherd dog breed dogs with EPI (EPI-non-GSD), and 25 dogs of non-German-shepherd dog breeds without EPI (non-EPI-non-GSD).
When analyzing two groups, all data sets failed normality testing and therefore Mann–Whitney tests were used for these comparisons. Additionally, when comparing four groups, all data sets failed normality testing and therefore Kruskal–Wallis tests were used for these comparisons.
3.1. Total Bile Acids
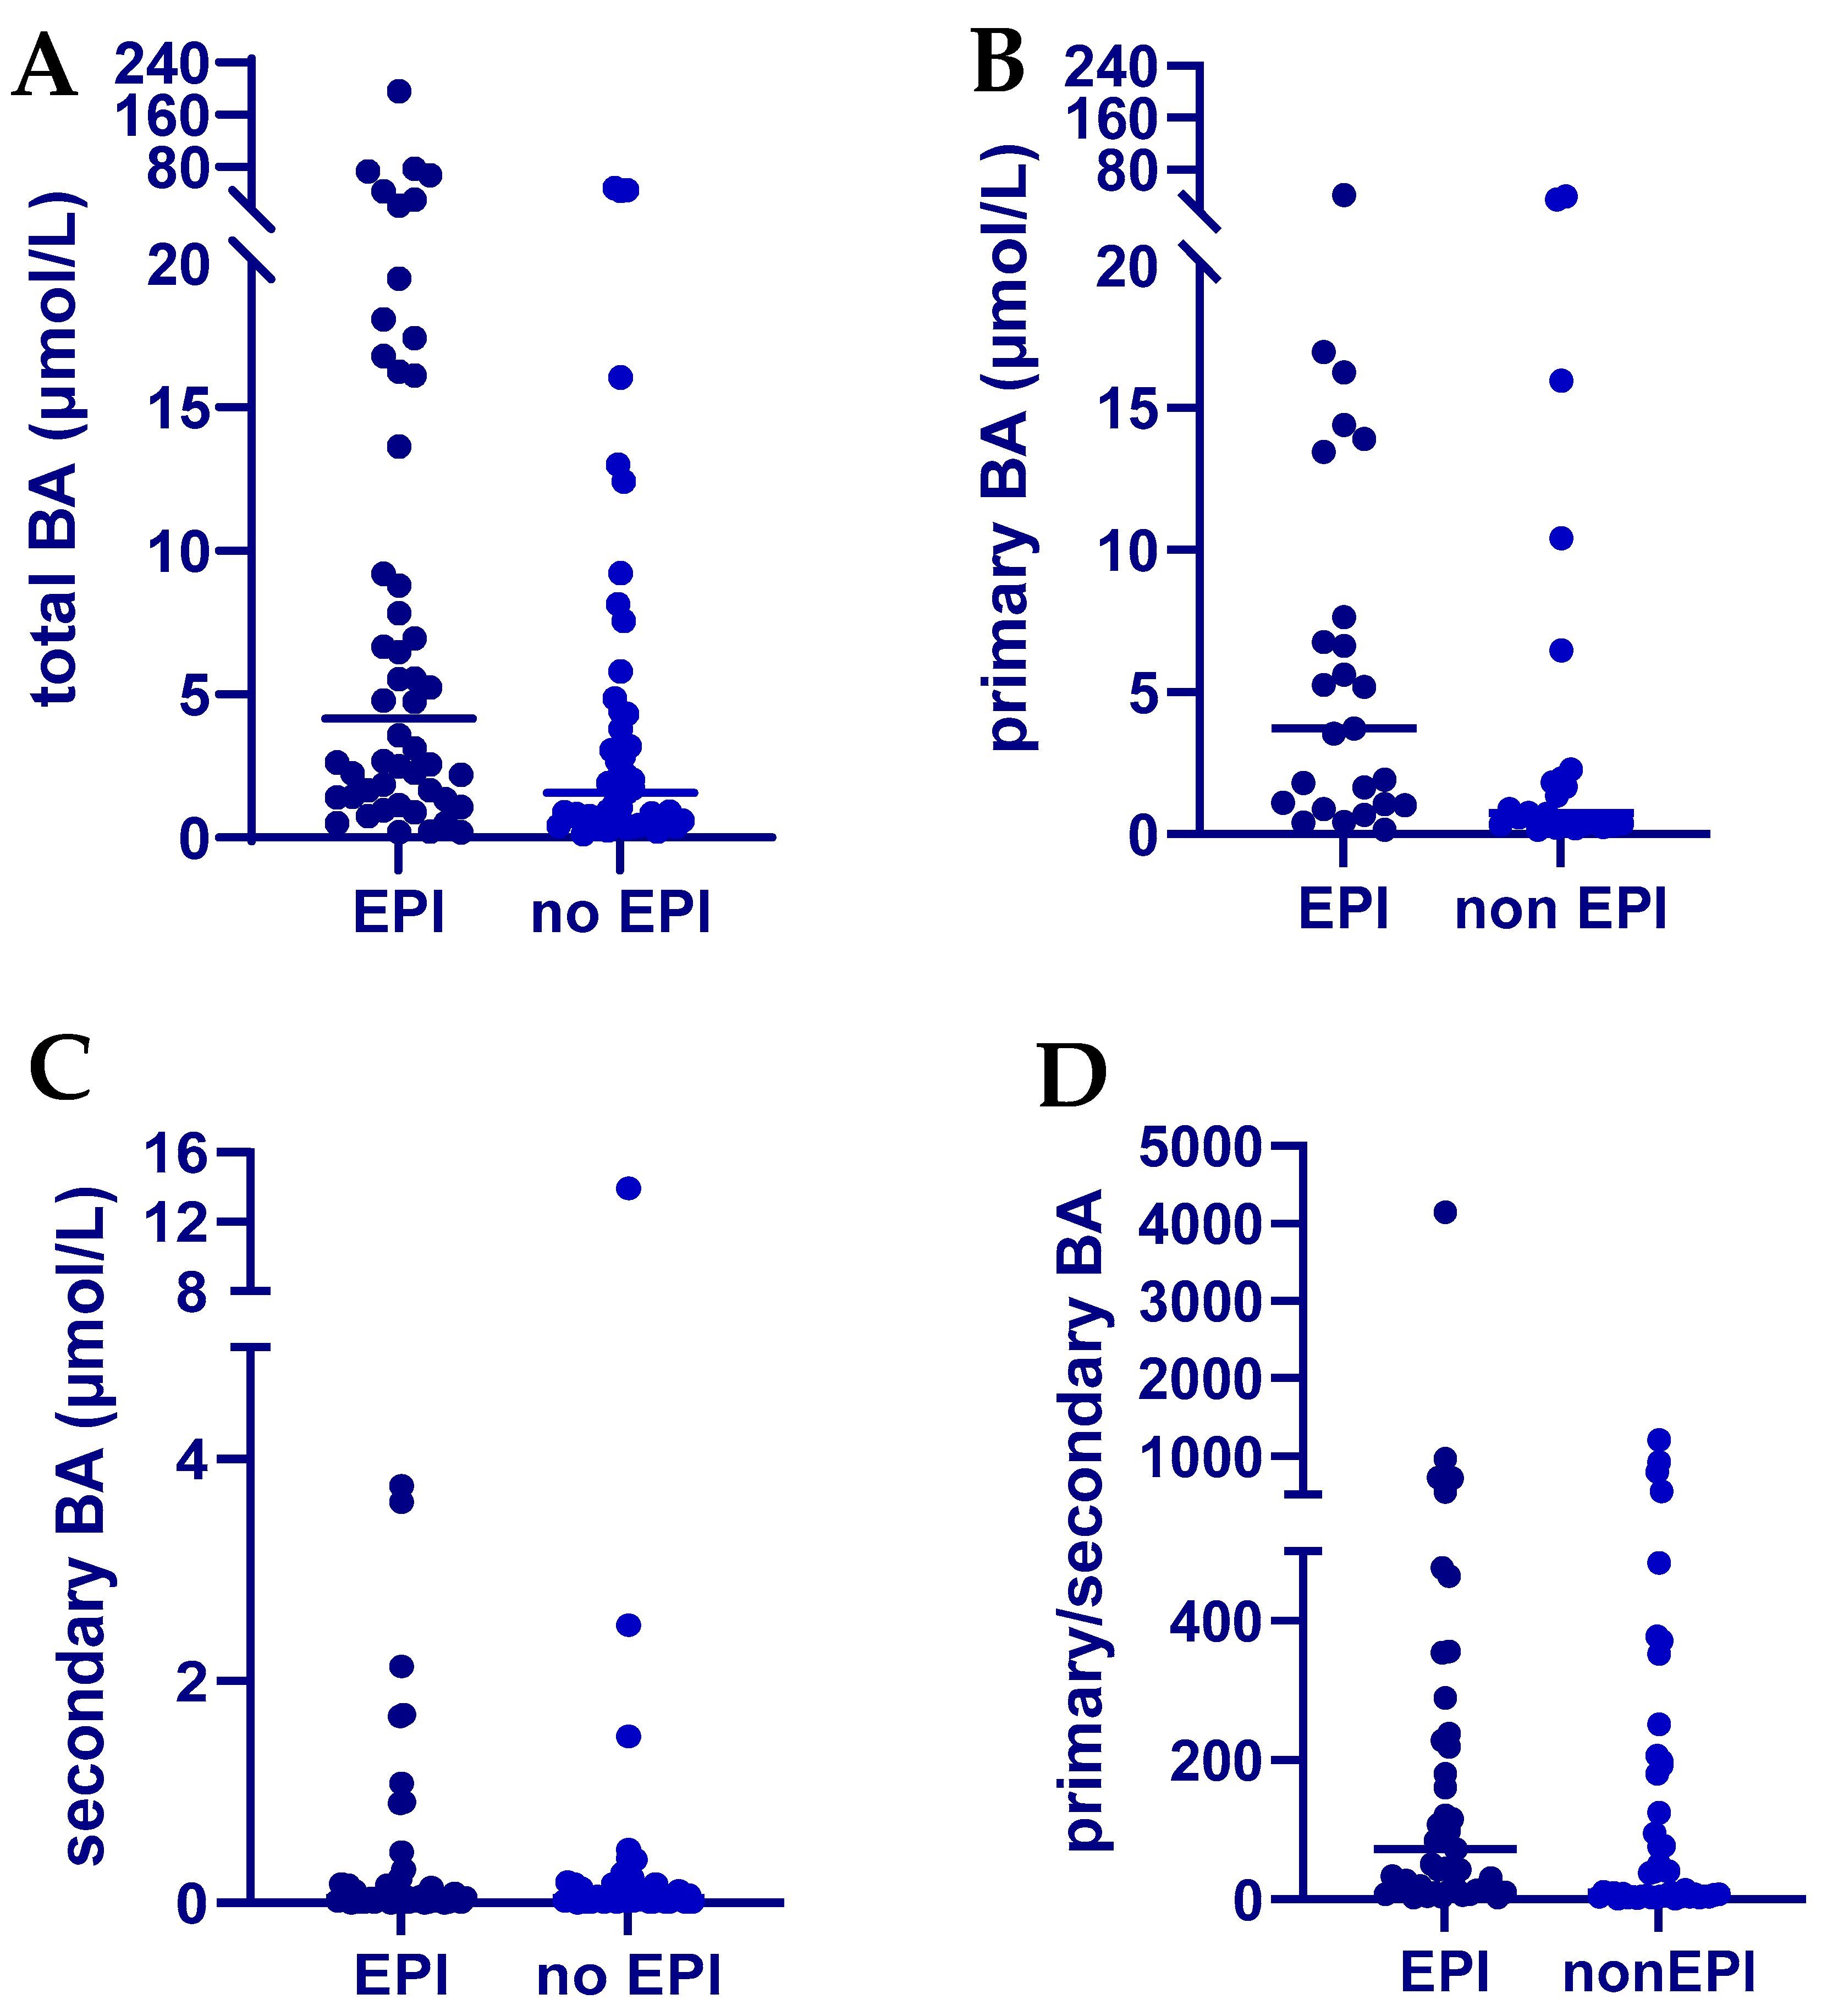
Serum total bile acid concentrations were significantly different between the two groups of dogs with dogs with EPI having a median serum total bile acid concentration of 4.1 µmol/L (range: 0.2 to 196.0 µmol/L) and dogs without EPI having a median serum total bile acid concentration of 1.6 µmol/L (range: 0.1 to 47.7 µmol/L;
p-value: 0.0022;
Table 1;
Figure 2).
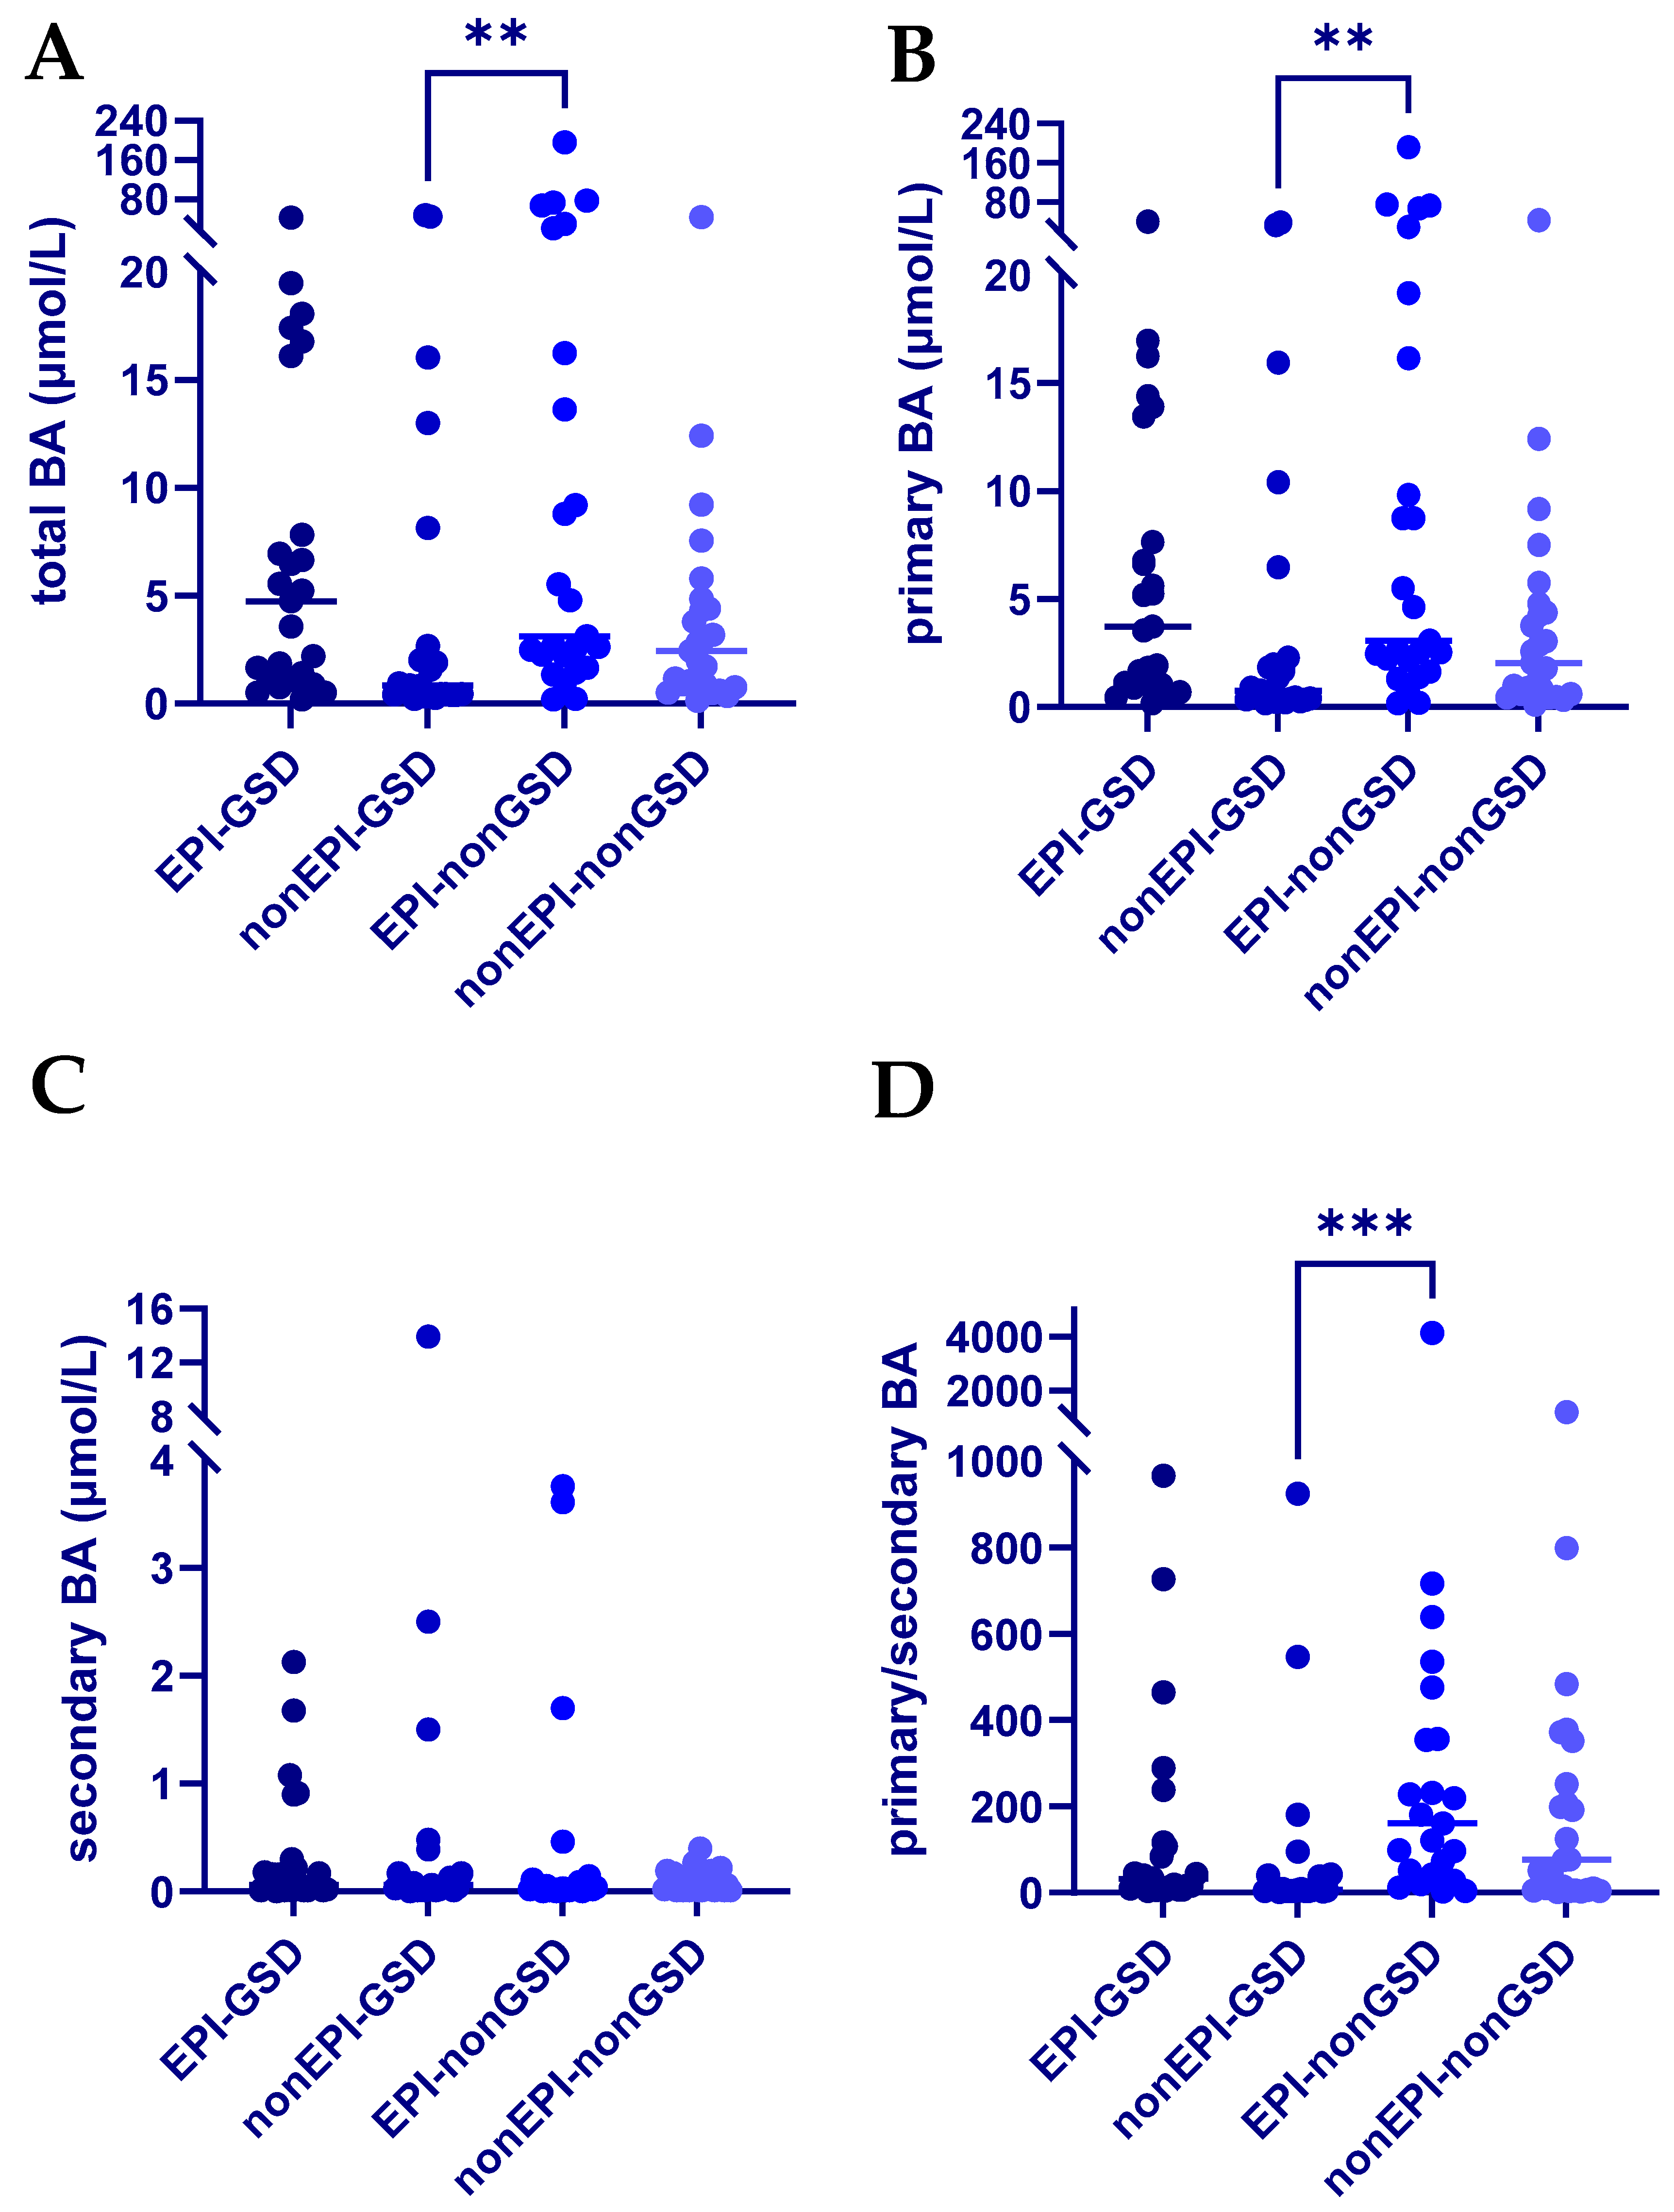
Serum total bile acid concentrations were statistically significantly different between the four groups of dogs (
p-value: 0.0097;
Figure 3). Median (range) serum total bile acid concentrations were 4.7 µmol/L (0.2–42.1 µmol/L) for EPI-GSD, 0.8 µmol/L (0.2–47.7 µmol/L) for non-EPI-GSD, 3.1 µmol/L (0.2–196.0 µmol/L for EPI-non-GSD, and 2.5 µmol/L (0.1–43.6 µmol/L) for non-EPI-non-GSD. Dunn’s multiple comparison tests only identified a statistically significant difference in serum total bile acid concentrations between non-EPI-GSD and EPI-non-GSD (
p-value: 0.0096).
3.2. Primary Bile Acid Profiles
Serum total primary bile acid concentrations represent the sum of all bile acids measured with a C7 hydroxyl group, and they were significantly different between the two groups of dogs with dogs with EPI having a median serum primary bile acid concentration of 3.7 µmol/L (range: 0.2 to 40.5 µmol/L) and dogs without EPI having a median serum primary bile acid concentration of 0.7 µmol/L (range: 0.2 to 38.4 µmol/L;
p-value: 0.0161;
Table 1,
Figure 2). Serum total primary bile acid concentrations were statistically significantly different between the four groups of dogs (
p-value: 0.0072;
Figure 3). Median (range) serum concentrations were 3.7 µmol/L (0.2–40.5 µmol/L) for EPI-GSD, 0.7 µmol/L (0.2–38.4 µmol/L) for non-EPI-GSD, 3.1 µmol/L (0.2–192.1 µmol/L) for EPI-non-GSD, and 2.0 µmol/L (0.1–43.3 µmol/L) for non-EPI-non-GSD. Dunn’s multiple comparison tests only identified a statistically significant difference in serum total primary bile acid concentrations between non-EPI-GSD and EPI-non-GSD (
p-value: 0.0069).
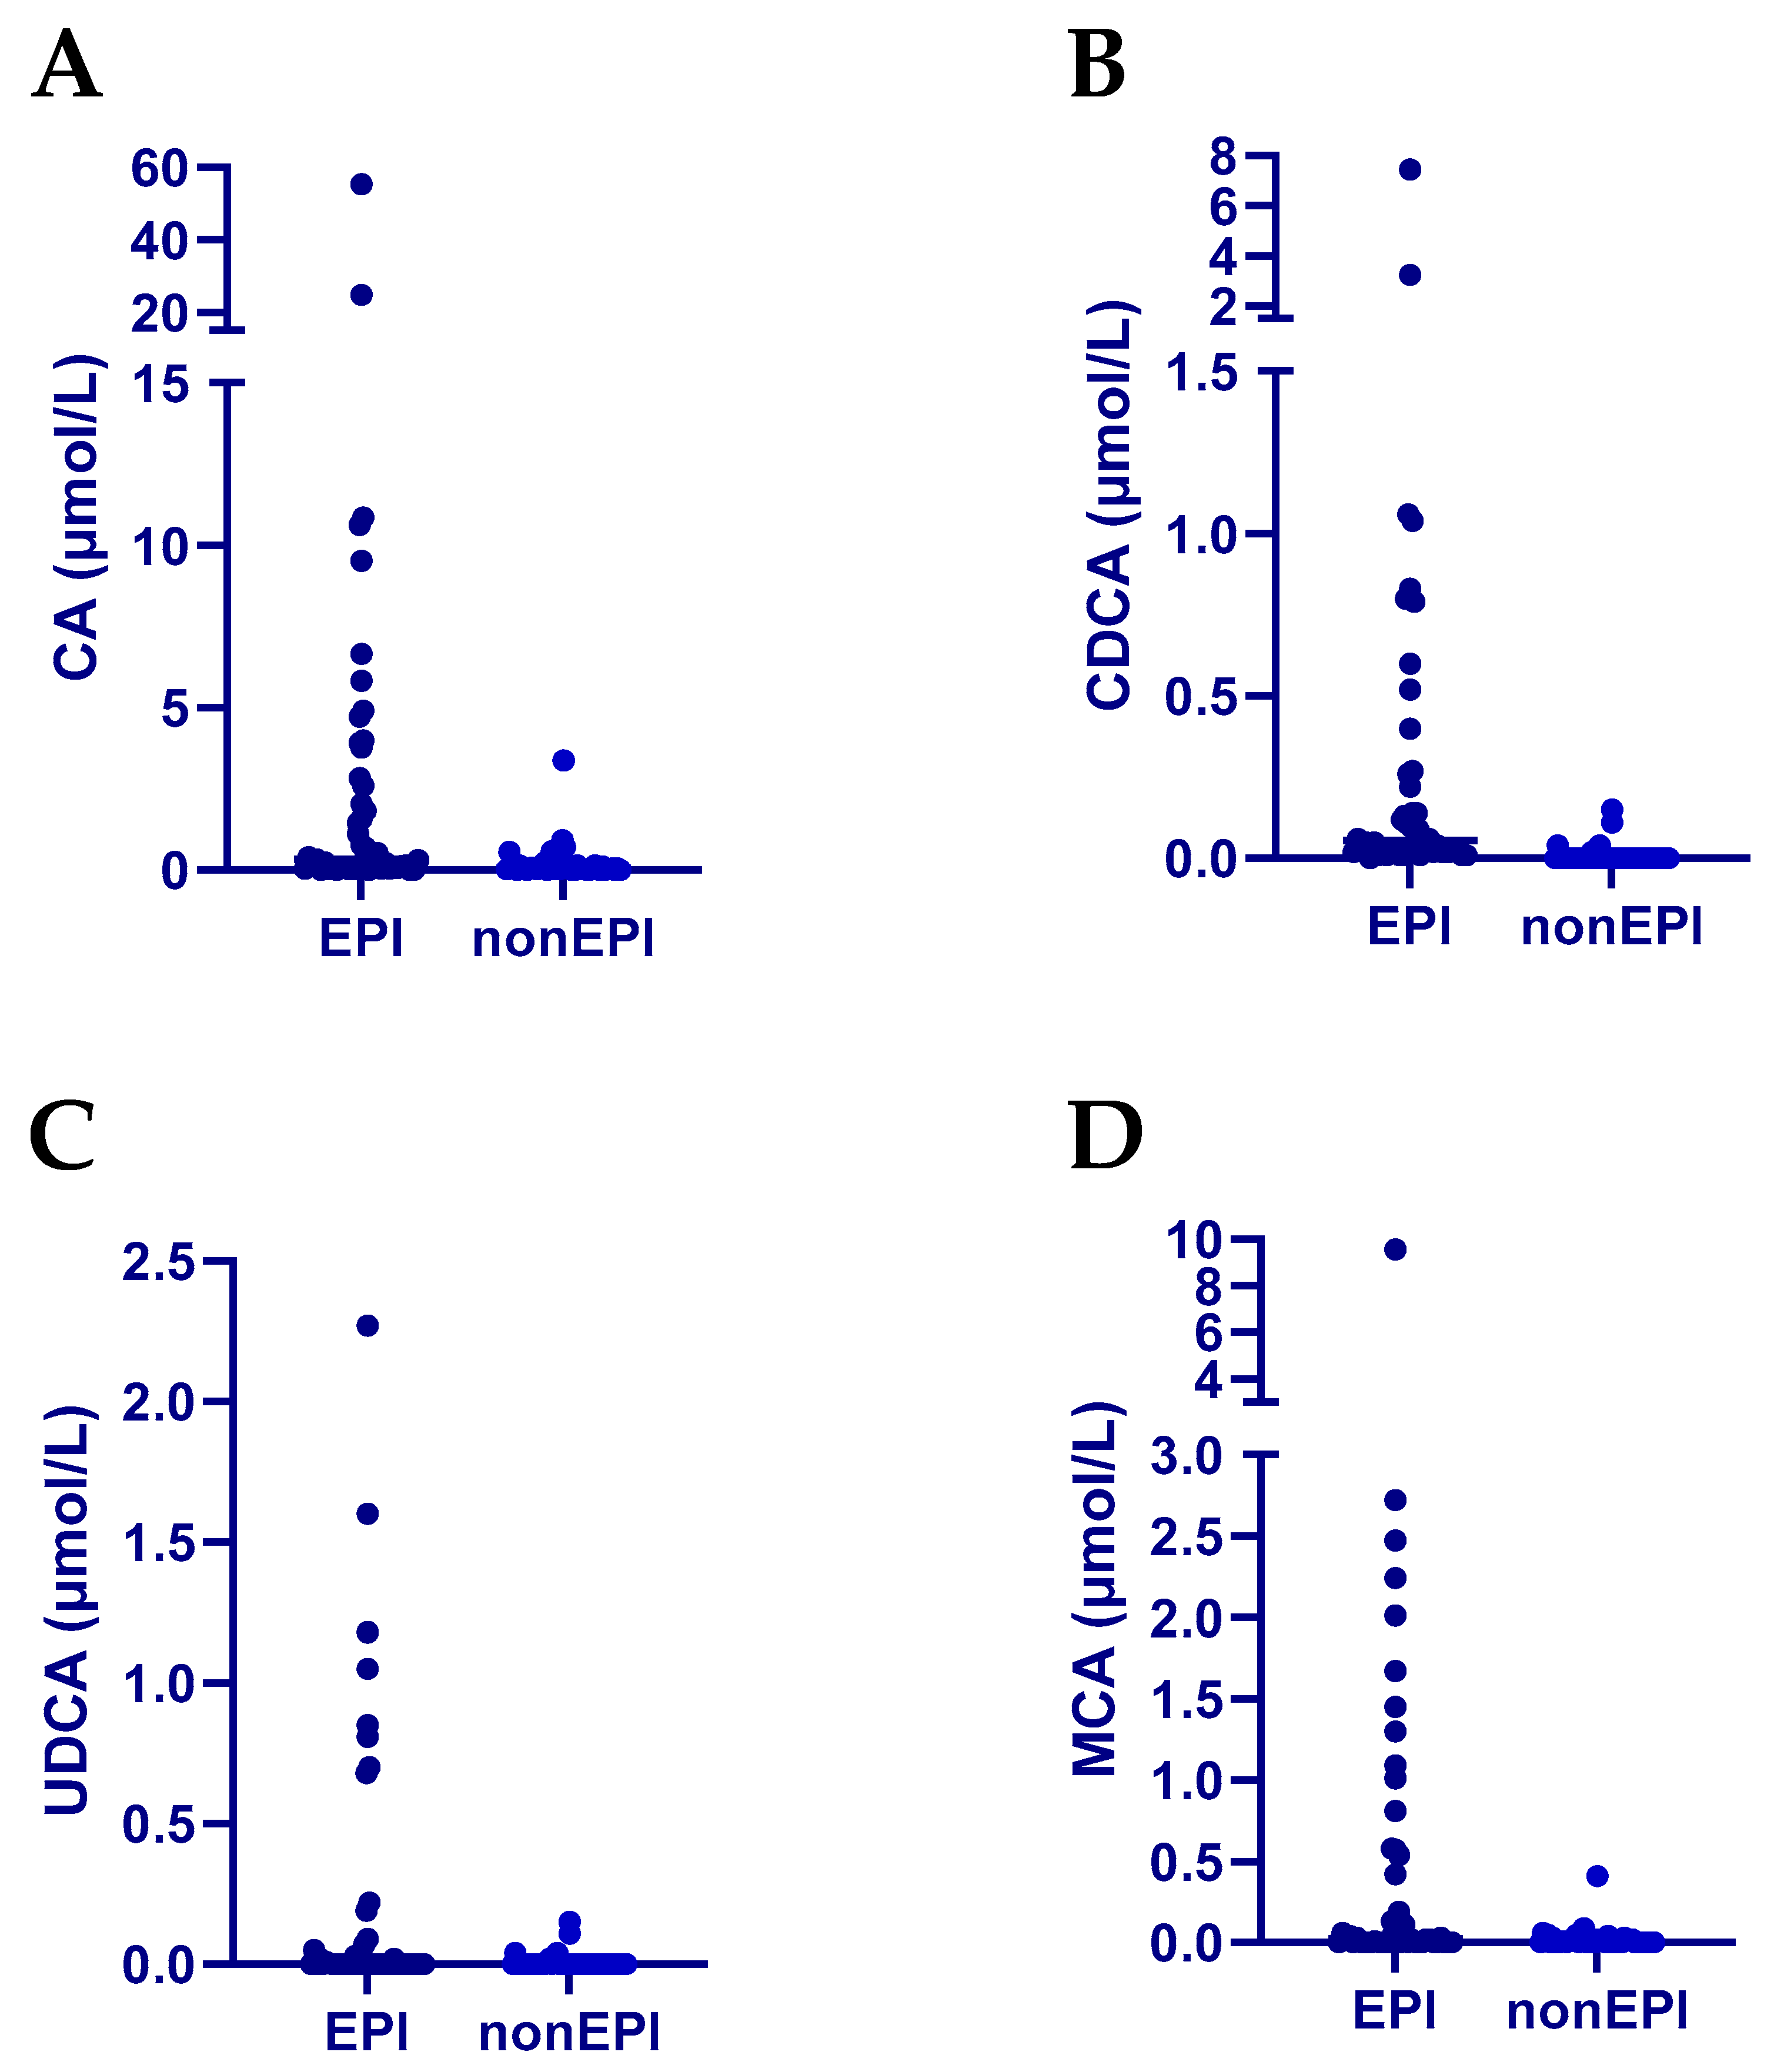
Serum cholic acid (CA) concentrations were significantly different between the two groups of dogs, with dogs with EPI having a median of 0.33 µmol/L (range: 0.00 to 55.34 µmol/L) and dogs without EPI having a median of 0.06 µmol/L (range: 0.00 to 3.38 µmol/L;
p-value: <0.0001;
Table 1,
Figure 4).
Serum CA concentrations were statistically significantly different between the four groups of dogs (p-value: <0.0001). Dunn’s multiple comparison analyses showed a significant difference between EPI-GSD and non-EPI-GSD or non-EPI-non-GSD and between EPI-non-GSD and non-EPI-non-GSD.
While all serum samples from dogs with EPI had measurable chenodeoxycholic acid (CDCA) concentrations, most serum samples from those in the non-EPI group had concentrations that were below the lower limit of detection (43/49). Serum CDCA concentrations were significantly different between the two groups of dogs, with dogs with EPI having a median of 0.06 µmol/L (range: 0.00 to 7.44 µmol/L) and dogs without EPI having a median of 0.00 µmol/L (range: 0.00 to 0.15 µmol/L;
p-value: <0.0001;
Figure 4).
Serum CDCA concentrations were statistically significantly different between the four groups of dogs (p-value: 0.05). Dunn’s multiple comparison analyses showed a significant difference between EPI-GSD and non-EPI-GSD or non-EPI-non-GSD and between EPI-non-GSD or non-EPI-non-GSD and non-EPI-GSD.
Many serum samples from either dogs with EPI (31/50) or those without EPI (43/49) had serum ursodeoxycholic acid (UDCA) concentrations that were below the lower limit of detection. Serum UDCA concentrations were significantly different between the two groups of dogs, with dogs in both groups having a median of 0.00 µmol/L (ranges: 0.00 to 2.27 µmol/L for dogs with EPI and 0.00 to 0.15 µmol/L for those without EPI;
p-value: 0.0023;
Figure 4).
Serum UDCA concentrations were statistically significantly different between the four groups of dogs (p-value: 0.0003). Dunn’s multiple comparison analyses showed a significant difference between EPI-GSD and non-EPI-GSD, EPI-non-GSD, and non-EPI-non-GSD.
Serum MCA concentrations were significantly different between the two groups of dogs, with dogs with EPI having a median of 0.03 µmol/L (range: 0.00 to 9.55 µmol/L) and dogs without EPI having a median of 0.00 µmol/L (range: 0.00 to 0.41 µmol/L;
p-value: 0.0018;
Table 1,
Figure 4).
Serum MCA concentrations were statistically significantly different between the four groups of dogs (p-value: 0.0083). Dunn’s multiple comparison analyses showed a significant difference between EPI-GSD and non-EPI-GSD or non-EPI-non-GSD.
3.3. Secondary Bile Acid Profiles
Serum total secondary bile acid concentrations, represented by the sum of all BA without a C7 hydroxyl group, were not significantly different between all dogs with EPI and all dogs without EPI (
Table 1,
Figure 2). When comparing the four groups separately, there was no statistically significant difference (
Figure 3).
Serum deoxycholic acid (DCA) concentrations were not significantly different between the two groups of dogs, with a median of 0.02 µmol/L (range: 0.00 to 2.35 µmol/L) for EPI dogs and 0.01 µmol/L (range: 0.00 to 1.58 µmol/L) for non-EPI dogs. Serum DCA concentrations were not statistically significantly different between the four groups of dogs.
3.4. Primary to Secondary Bile Acid Ratios
Serum primary to secondary bile acid ratios were significantly different between the two groups of dogs with dogs with EPI having a median ratio of 73 (range: 3 to 4148) and dogs without EPI having a median ratio of 11 (range: 2 to 1213;
p-value: 0.0152;
Table 1,
Figure 2). Serum primary to secondary bile acid ratios were statistically significantly different between the four groups of dogs (
p-value: 0.0019;
Figure 3). Median (range) serum primary to secondary bile acid ratios were 32 (4–967) for EPI-GSD, 8 (2–925) for non-EPI-GSD, 160 (3–4148) for EPI-non-GSD, and 76 (1–1213) for non-EPI-non-GSD. Dunn’s multiple comparison tests only identified a statistically significant difference in serum primary to secondary bile acid ratios between non-EPI-GSD and EPI-non-GSD (
p-value: 0.0008).
3.5. Glycine-Conjugated Bile Acids
Many serum samples from either dogs with EPI (24/50) or those non-EPI (16/49) had serum glycoursodeoxycholic acid (GUDCA) concentrations that were below the lower limit of detection. Serum GUDCA concentrations were not significantly different between the two groups of dogs, with a median of 0.00 µmol/L for both groups (ranges: 0.00 to 0.02 µmol/L for dogs with EPI and 0.00 to 0.03 µmol/L for non-EPI dogs). Data for the subgroups were not further analyzed due to the low concentrations observed.
Most serum samples from dogs with EPI (43/50) and many of those without EPI (34/49) had serum glycochenodeoxycholic acid (GCDCA) concentrations that were below the lower limit of detection. Serum GCDCA concentrations were not significantly different between the two groups of dogs, with a median of 0.00 µmol/L for both groups (ranges: 0.00 to 0.03 µmol/L for dogs with EPI and 0.00 to 0.06 µmol/L for non-EPI dogs). Data for the subgroups were not further analyzed due to the low concentrations observed.
Many serum samples from either dogs with EPI (39/50) or those without EPI (39/49) had serum glycocholic acid (GCA) concentrations that were below the lower limit of detection. Serum GCA concentrations were not significantly different between the two groups of dogs, with a median of 0.00 µmol/L for both groups (ranges: 0.00 to 0.03 µmol/L for dogs with EPI and 0.00 to 0.11 µmol/L for non-EPI dogs). Data for the subgroups were not further analyzed due to the low concentrations that had been observed.
3.6. Taurine-Conjugated Bile Acids
Serum total taurine-conjugated bile acid concentrations were significantly different between the two groups of dogs, with dogs with EPI having a median concentration of 2.5 µmol/L (range: 0.1 to 182.2 µmol/L) and dogs without EPI having a median concentration of 1.1 µmol/L (range: 0.1 to 45.9 µmol/L;
p-value: 0.0205;
Table 1).
Serum total taurine-conjugated bile acid concentrations were statistically significantly different between the four groups of dogs (p-value: 0.0151). Median (range) concentrations were 1.5 µmol/L (0.2–12.6 µmol/L) for EPI-GSD, 0.7 µmol/L (0.2–45.9 µmol/L) for non-EPI-GSD, 3.0 µmol/L (0.1–182.2 µmol/L) for EPI-non-GSD, and 2.1 (0.1–43.3 µmol/L) for non-EPI-non-GSD. Dunn’s multiple comparison tests identified a statistically significant difference in serum taurine-conjugated bile acid concentrations between non-EPI-GSD and EPI-non-GSD (p-value: 0.0074).
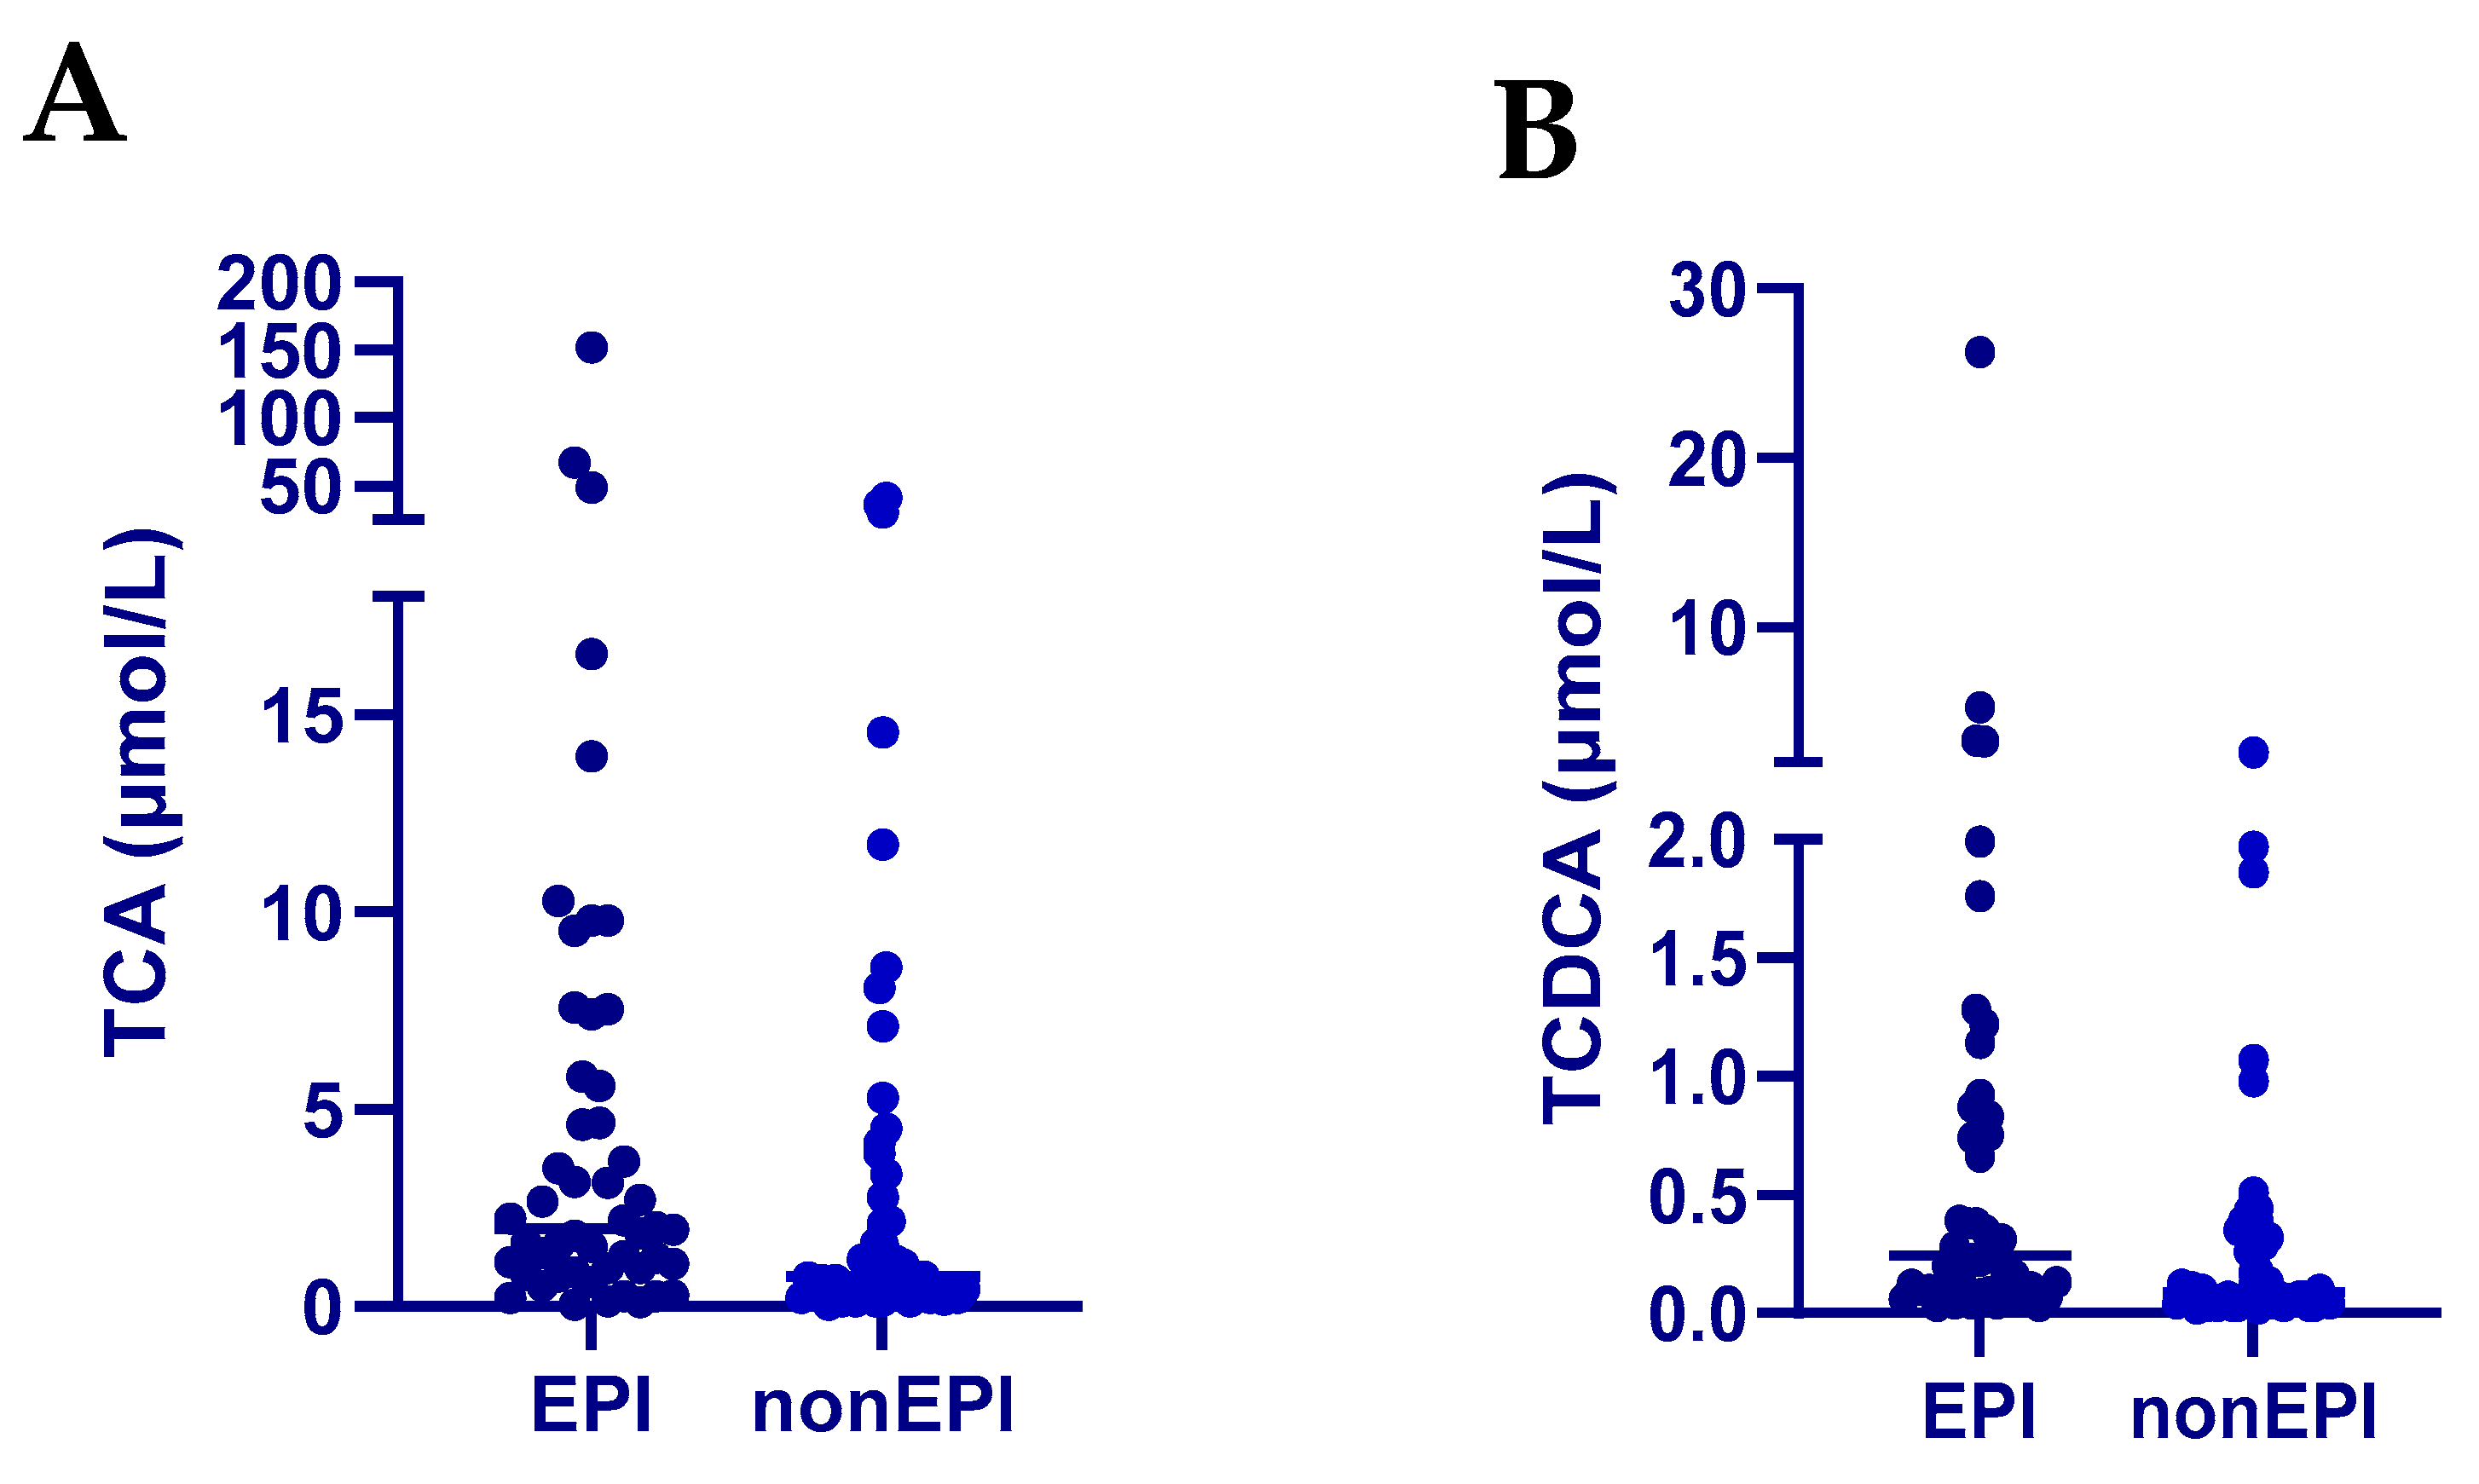
Serum taurocholic acid (TCA) concentrations were significantly different between the two groups of dogs, with dogs with EPI having a median of 2.0 µmol/L (range: 0.1 to 151.9 µmol/L) and dogs without EPI having a median of 0.8 µmol/L (range: 0.1 to 40.9 µmol/L;
p-value: 0.0120;
Table 1,
Figure 5). Serum TCA concentrations were statistically significantly different between the four groups of dogs (
p-value: 0.006). However, Dunn’s multiple comparison analyses only showed a significant difference between non-EPI-GSD and EPI-non-GSDs.
Serum taurochenodeoxycholic acid (TCDCA) concentrations were significantly different between the two groups of dogs, with dogs with EPI having a median of 0.25 µmol/L (range: 0.03 to 26.23 µmol/L) and dogs without EPI having a median of 0.09 µmol/L (range: 0.02 to 2.6 µmol/L;
p-value: 0.0040;
Table 1,
Figure 5). Serum TCDCA concentrations were statistically significantly different between the four groups of dogs (
p-value: 0.014). However, Dunn’s multiple comparison analyses only showed a significant difference between non-EPI-GSD and EPI-non-GSDs.
Serum tauromuricholic acid (TMCA) and taurodeoxycholic acid (TDCA) concentrations were not significantly different between the two groups of dogs. These bile acid concentrations were also not statistically significantly different between the four groups of dogs.
3.7. Bile Acids Below Limits of Detection
A variety of the bile acids analyzed showed concentrations below the level of detection for all samples, regardless of group and thus data were not further analyzed. These included tauroursodeoxycholic acid (TUDCA), taurohyodeoxycholic acid (THDCA), taurolithocholic acid-3-sulfate (TLCA-3S), cholic acid-3-sulfate (CA-3S), glycolithocholic acid (GLCA), and hyocholic acid (HCA).
Furthermore, for a variety of bile acids analyzed, most of the serum samples showed concentrations below the detection limit and once again data for these bile acids were not further analyzed: glycolithocholic acid-3-sulfate (GLCA-3S), ursodeoxycholic acid-3-sulfate (UDCA-3S), chenodeoxycholic acid-3-sulfate (CDCA-3S), lithocholic acid-3-sulfate (LCA-3S), tauroursodeoxycholic acid-3-sulfate (TUDCA-3S), glycoursodeoxycholic acid-3-sulfate (GUDCA-3S), glycodeoxycholic acid (GDCA), taurolithocholic acid (TLCA), lithocholic acid (LCA), and hyodeoxycholic acid (HDCA). The number of samples in each group falling below the limit of detection are shown in
Supplementary Table S1.
4. Discussion
Several of the bile acids that we quantified in the serum samples were below the detection limit of the assay for all of the samples from both groups of dogs, those with EPI and those without EPI. These included taurohyodeoxycholic acid (THDCA), taurolithocholic acid-3-sulfate (TLCA-3S), deoxycholic acid-3-sulfate (DCA-3S), cholic acid-3-sulfate (CA-3S), glycolithocholic acid (GLCA), and hyocholic acid (HCA). For several other BAs, many, but not all, serum samples had results below the detection limit for the assay, including chenodeoxycholic acid-3-sulfate (CDCA-3S), glycolithocholic acid-3-sulfate (GLCA-3S), ursodeoxycholic acid-3-sulfate (UDCA-3S), chenodeoxycholic acid-3-sulfate (CDCA-3S), lithocholic acid-3-sulfate (LCA-3S), tauroursodeoxycholic acid-3-sulfate (TUDCA-3S), glycoursodeoxycholic acid-3-sulfate (GUDCA-3S), glycochenodeoxycholic acid (GCDCA), glycodeoxycholic acid (GDCA), taurolithocholic acid (TLCA), lithocholic acid (LCA), and hyodeoxycholic acid (HDCA).
We were unable to measure any significant concentrations of sulfated bile acids in any of the groups of dogs. Sulfated bile acids are formed in hepatocytes and are important for bile acid detoxification, as the sulfated bile acids are more water soluble than non-sulfated bile acids [
10]. Since these sulfated bile acids are directly excreted through the bile into the small intestines from where very little is re-absorbed, measurable amounts of sulfated bile acids in the serum would only be expected in patients with cholestasis, which does not occur in dogs with EPI [
10]. Thus, finding unmeasurable concentrations of sulfated bile acids was expected.
Serum total bile acid concentrations were significantly higher in dogs with EPI than in dogs without EPI. Higher total bile acid concentrations have also been reported in the serum of human patients with chronic pancreatitis [
9]. While this relationship was not significant for the subgroups of dogs (i.e., the only significant difference shown for subgroups was between non-EPI-GSD and EPI-non-GSD;
p-value: 0.0096), EPI-GSD had the highest median serum total bile acid concentration (4.7 µmol/L), followed by EPI-non-GSD (3.1 µmol/L), non-EPI-non-GSD (2.5 µmol/L), and non-EPI-GSD (0.8 µmol/L). Thus, the difference between the EPI group and the non-EPI group appeared to be much bigger in GSDs than in dogs of other breeds, but this difference did not reach significance. There are several reasons why serum total bile acids could be higher in dogs with EPI than in non-EPI dogs. Dogs with EPI are predisposed to hepatic lipidosis and even mild hepatic lipidosis reduces the liver’s ability to clear portal bile acids on first pass, resulting in increased serum bile acid concentrations [
11]. It should be noted that much higher serum total bile acid concentrations averaging 30 µmol/L (±SD: 33 µmol/L) in healthy adult dogs and measured by similar LC-MS/MS methods were previously reported [
12]. However, we are limited in our ability to directly compare between assays because these assays have not previously been cross-validated and may thus give different absolute concentrations. It is worth noting, however, that the concentrations we report here for dogs are similar to those reported for human patients and healthy control subjects using the same method [
8,
9]. Small intestinal bacterial overgrowth (SIBO) has previously been reported in dogs with EPI and while the term SIBO is no longer being used in dogs, the term has been replaced by intestinal dysbiosis. Intestinal dysbiosis could lead to increased formation of unconjugated bile acids in the intestinal lumen, leading to increased absorption of such unconjugated bile acids and in turn increased serum concentrations of unconjugated bile acids. However, while serum concentrations of two of the unconjugated bile acids, cholic acid (CA) and chenodeoxycholic acid (CDCA), were significantly higher in dogs with EPI than in those without EPI, both CA and CDCA in dogs with EPI were similar to concentrations seen in a previous study of healthy dogs, suggesting that these unconjugated bile acids do not play a major role in dogs with EPI [
12]. Furthermore, Karakus et al. found that serum CA was above the detection limit in only eight out of 40 healthy adult dogs and represented approximately 12% of the total measured serum BA pool [
12]. They also found that serum CDCA represented a negligible 1.6% of the total serum BA pool with an average concentration of 0.473 µmol/L. In the current study, dogs with EPI had 7.9% of the total serum BA pool represented by CA and 1.4% represented by CDCA, which more closely resembles healthy dogs than our non-EPI group.
In human medicine, it has also been speculated that an increase in serum total bile acid concentrations in individuals with exocrine pancreatic malfunction may be due to trapping bile acids in the small intestine, due to a lack of fat digestion, which in turn leads to an increase in hepatic synthesis of bile acids [
13,
14].
Similarly to serum total bile acid concentrations, serum primary bile acid concentrations were significantly higher in dogs with EPI than in non-EPI dogs, while serum secondary bile acid concentrations were not different between the two groups. There was also a significant difference in primary bile acid concentrations when evaluating the four subgroups, but post hoc analysis was only able to identify a significant difference between non-EPI-GSD and EPI-non-GSD (p-value: 0.0069), suggesting that the size of the subgroups was not large enough to identify a significant difference. Accordingly, median serum primary bile acid concentrations were highest in EPI-GSD (3.7 µmol/L), followed by 3.1 µmol/L for EPI-non-GSD, 2.0 µmol/L for non-EPI-non-GSD, and 0.7 µmol/L for non-EPI-GSD.
As secondary bile acids are a reflection of bacterial metabolism in the intestinal lumen through dehydroxylation, deconjugation, and epimerization, there are several possible explanations for not being able to identify a statistically significant difference between EPI and non-EPI dogs. Firstly, this could suggest that in dogs with EPI, bacterial species that form secondary bile acids are either unaltered or that bacterial formation of secondary bile acids occurs mainly in the colon, after reabsorption of the bile acid pool from the intestinal lumen. Another possible explanation is that dogs that did not have EPI in this study did in fact also have intestinal dysbiosis. All samples had been submitted to the GI Lab at Texas A&M University, likely because the dogs showed clinical signs of gastrointestinal disease. Thus, it is possible that non-EPI dogs had intestinal dysbiosis leading to similar alterations of the intestinal microbiome in both EPI and non-EPI dogs. However, the dogs selected for the non-EPI group had serum cobalamin and folate concentrations within the reference interval, suggesting that they did not have significant small intestinal disease, which one would expect in dogs with intestinal dysbiosis. Since primary bile acids were significantly higher in dogs with EPI than in non-EPI dogs and secondary bile acid concentrations were not significantly different, these results were mirrored by the ratio of primary to secondary bile acids, but there is no additional information that can be gleaned from this ratio when compared to the difference in primary bile acids between the groups. It is worth noting that a significant increase in primary to secondary BA ratio has also been observed in human patients with EPI that is due to severe chronic pancreatitis [
9]. In that study, BA concentrations were measured not only in plasma but also simultaneously in small intestinal contents, revealing an altered BA secretion in EPI. Most of the patients in that study had a history of bile duct stenosis. Therefore, it was hypothesized that primary BA that had been synthesized in the liver were re-absorbed into the bile duct before reaching the small intestine through the so-called cholangiohepatic shunt of BA secretion [
15]. However, this explanation appears unlikely for the dogs in this study. Almost all human patients with EPI develop EPI as a sequela to chronic pancreatitis and thus frequently have biliary stenosis. In sharp contrast, GSDs with EPI do not show any significant inflammation in the pancreas or surrounding tissues. If in fact biliary stenosis secondary to biliary inflammation were to have caused the bile acid dysmetabolism observed here, those changes should only have been apparent in dogs with EPI in non-GSD breeds. Instead, the changes we observed were more pronounced in the EPI-GSDs than in the EPI-non-GSDs.
Dogs have two primary bile acids, cholic acid and chenodeoxycholic acid, and the total concentration of both were significantly higher in dogs with EPI than in dogs without EPI. However, overall total serum chenodeoxycholic acid concentrations were much lower than those of total serum cholic acid concentrations (median serum total cholic acid concentrations in dogs with EPI 2.8 µmol/L; median serum total chenodeoxycholic acid concentrations in dogs with EPI 0.33 µmol/L). Bile acids containing a 12α-hydroxyl group, such as cholic acid, are more predominant in dogs than bile acids without a 12α-hydroxyl group, such as chenodeoxycholic acid, because the liver favorably synthesizes and secretes 12α-hydroxylated bile acids through sterol 12-alpha-hydroxylase (CYP8B1) activity in de novo bile acid synthesis [
16,
17,
18].
Muricholic acid is a primary bile acid in rodents and is not usually synthesized in quantifiable amounts in canine hepatocytes. While small amounts of muricholic acid were identified in the serum of some dogs and serum muricholic acid concentrations were significantly higher in dogs with EPI than in dogs without EPI, both had very low median concentrations precluding a more detailed assessment. Isolated dogs had, however, extremely high amounts of serum muricholic acid concentrations (e.g., 9.55 µmol/L), which would suggest significant bile acid dysmetabolism in these isolated dogs. It is unclear whether this could stem from differences in luminal microbial biotransformation reactions (including 6-position hydroxylation, oxidation, and epimerization); an individual difference in bile acid synthesis in hepatocytes or, less likely, could be related to ingestion of a rodent or feed containing rodent tissues or feces and hepatic recirculation of the bile acid pool from that rodent. Other studies have also found low amounts of α-, β-, and ω-MCA in a limited number of serum samples from healthy adult dogs and in fecal samples from dogs [
12,
17,
19]. Also, dogs with chronic inflammatory enteropathy have been reported to have significantly higher fecal concentrations of β-MCA, reaching as high as 41.83 µg/g feces in one study [
17].
When assessing the specific bile acids, many of them showed concentrations below the detection limit of the assay. Those that showed measurable concentrations in most dogs included taurochenodeoxycholic acid, taurocholic acid, ursodeoxycholic acid, and cholic acid, all of which were significantly higher in dogs with EPI. The relatively high serum concentrations of taurocholic acid and taurocheonodeoxycholic acid are not surprising as taurine conjugation is the primary type of bile acid conjugation in dogs and the majority of bile acids excreted in bile are re-absorbed in the distal small intestine.
The median serum ursodeoxycholic acid concentration was 0.00 µmol/L in both dogs with EPI and those without, suggesting low concentrations in both groups of dogs, despite a statistically significant difference. Another study found increased fecal UDCA concentrations in dogs with treated EPI compared to healthy control dogs [
20]. The same study also found significantly lower 7α-dehydroxylated bile acids, DCA and LCA, in the feces of treated EPI dogs compared to healthy controls. This suggests that dogs with EPI may have lower 7α-dehydroxylating bacterial enzyme activity in the lumen, leading to increased CDCA substrate availability for hydroxysteroid dehydrogenase bacterial enzymes to form UDCA. Indeed, all untreated dogs with EPI and a subgroup of dogs with treated EPI had fecal dysbiosis characterized by loss of one of the key bacterial species with 7α-dehydroxylating activity,
Peptacetobacter (
Clostridium)
hiranonis [
20].
Thus, it appears that the amounts of both primary bile acids, cholic acid and chenodeoxycholic acid, are significantly increased in the serum of dogs with EPI, which is associated with a significant increase in total primary bile acids and, in turn, total bile acids. There are several possible explanations for this finding that were, however, not further explored in the current study but represent areas of future studies in this field. The most simplistic explanation would be an upregulation of primary bile acid synthesis in hepatic cells. Both primary bile acids are synthesized from cholesterol in hepatocytes and the rate-limiting enzyme for the synthesis of both is cholesterol 7 alpha-hydroxylase (CYP7A1) [
21]. The activity of CYP7A1 is primarily modulated by the concentration of primary bile acids in the intestines as bile acids bind to the farnesoid X receptor (FXR) [
22]. Thus, increased amounts of bile acids in the intestinal lumen should be self-regulating. It is interesting to speculate that undigested chyme could counteract this decrease in bile acid synthesis mediated through FXR, for example by trapping bile acids. While an impact of undigested chyme in the intestinal lumen has not previously been demonstrated to have an impact on CYP7A1 activity, diet has been demonstrated to have such an effect [
23]. Similarly, several of the cholic acid species that were found to be increased in dogs with EPI in the current study act as FXR antagonists, leading to a decrease in fibroblast growth factor 15 and fibroblast growth factor 19 (FGF15/19), which in turn decreases the inhibition of bile acid synthesis that is usually achieved through FGF15/19 [
24]. Thus, these FXR antagonists would directly stimulate bile acid synthesis in hepatocytes [
24]. Finally, but less likely, the reabsorption of bile acids from the intestinal lumen and thus hepatic recirculation of bile acids may be more efficient in dogs with EPI. This could also be related to the dysbiosis of the intestinal microbiome, as has previously been described in dogs with EPI and may explain increases seen in the bile acids UDCA and MCA.
Overall, German shepherd dogs did not show strong differences in serum bile acids compared to other breeds of dogs in either EPI or non-EPI dogs. This suggests that the underlying etiology of pancreatic dysfunction, PAA or chronic pancreatitis, does not significantly impact the changes seen in bile acid metabolism seen in dogs with EPI, and that GSDs without EPI are not inherently predisposed to significant bile acid dysmetabolism.
There were several limitations to this study, including the retrospective method of sample collection. The non-EPI group consisted of clinical patients with suspected GI disease rather than healthy controls, introducing confounding variables related to ileal malabsorption or subclinical liver disease in the comparison group. Patient history was not available for any of the dogs included in the study, and therefore result interpretation could be limited by the unintentional inclusion of dogs with comorbidities or medications that would affect serum bile acid concentrations. This also limited our ability to tease out contributions of dysbiosis or gastrointestinal disease to the differences seen between groups. However, the intention of including only dogs with serum cobalamin and folate concentrations within their respective reference intervals for the non-EPI group was to exclude those with overt GI disease. This method of sampling may have decreased sampling bias and helped represent the true target population.
One of the important questions our study raises is what the clinical impact of the bile acid dysmetabolism could be in dogs with EPI. Dogs with hepatobiliary disease leading to hepatic failure often have severely increased serum total bile acid concentrations, which often reach 5–10-fold the upper limit of the reference interval [
25]. However, in these dogs the increased serum total bile acid concentrations are not related to any specific clinical signs or complications. Thus, it would be unlikely that the increases in dogs with EPI observed here would be associated with such clinical signs or complications.



 ,
,