Article

Habitat Shifts and Conservation Challenges of Falconidae Under Climate Change in Northwestern China

1
College of Life Science, Shihezi University, Shihezi 832003, China
2
State Key Laboratory of Ecological Safety and Sustainable Development in Arid Lands, Xinjiang Institute of Ecology and Geography, Chinese Academy of Sciences, Urumqi 830011, China
3
China-Tajikistan Belt and Road Joint Laboratory on Biodiversity Conservation and Sustainable Use, Xinjiang Institute of Ecology and Geography, Chinese Academy of Sciences, Urumqi 830011, China
4
Forestry and Grassland Resources Monitoring Center, Xinjiang Production and Construction Corps, Urumqi 830013, China
5
Center for Wildlife Conservation and Monitoring of Xinjiang Uygur Autonomous Region, Urumqi 830000, China
6
Institute of Applied Ecology, Nanjing Xiaozhuang University, Nanjing 211171, China
*
Authors to whom correspondence should be addressed.
Animals 2026, 16(17), 2650; https://doi.org/10.3390/ani16172650
Submission received: 17 June 2026 / Revised: 14 August 2026 / Accepted: 19 August 2026 / Published: 24 August 2026
(This article belongs to the Special Issue Embracing Nature's Guidance: Conservation in Wildlife)

Simple Summary

Climate change and land-use shifts threaten falcons in Xinjiang, China. Using over 2700 occurrence records and environmental data, we modeled current and future habitats for seven species under multiple climate scenarios and assessed habitat quality and protected-area coverage. Suitable habitats now concentrate in mountain foothills and river valleys. Future responses are species-specific: Common Kestrel and Peregrine Falcon may expand, whereas Red-footed Falcon and Saker Falcon are projected to decline sharply under severe warming. Importantly, many climatically suitable areas lie outside protected reserves and face high degradation risk, meaning suitability does not guarantee effective protection. We recommend expanding protected areas, restoring degraded habitats, and maintaining corridors to support climate-adaptive conservation.

Abstract

Xinjiang’s distinctive geography and climate provide important habitats for Falconidae species, yet their climate-driven habitat shifts and conservation gaps remain poorly understood. Using 2731 validated occurrence records and 26 environmental predictors, including bioclimatic, land-use, topographic, hydrological, anthropogenic, and Normalized Difference Vegetation Index (NDVI) predictors, we applied an optimized Maximum Entropy (MaxEnt) framework to project suitable habitats for seven falconid species under current conditions and three Shared Socioeconomic Pathway scenarios (1–2.6, 2–4.5, and 5–8.5) for 2041–2060, 2061–2080 and 2081–2100. Barycenter migration analysis, the Habitat Quality module of the Integrated Valuation of Ecosystem Services and Tradeoffs framework, and protected-area overlays were further integrated to identify conservation priorities. All models showed high discriminatory performance, with mean areas under the receiver operating characteristic curve exceeding 0.90. Current suitable habitats were mainly concentrated along river corridors and mountain foothills in the southern Altai, central-western Tianshan and northern Kunlun regions. Future responses were strongly species-specific. By 2081–2100 under Shared Socioeconomic Pathway 5–8.5, suitable habitat increased by 154.6% for Falco peregrinus and 79.5% for Falco tinnunculus but declined by 81.1% for Falco vespertinus; Falco subbuteo also showed overall expansion, with its suitable-habitat barycenter shifting by up to 291.9 km. Mean relative habitat quality was 0.514 [standard deviation = 0.185], while suitable habitat outside protected areas ranged from 35,346 to 304,866 km2 among species, and high-quality priority conservation gaps reached 102,489 km2 for Falco cherrug. These results demonstrate that climatic suitability does not necessarily correspond to high habitat quality or adequate protection and support species-specific, climate-adaptive conservation strategies for falconids in Xinjiang.

1. Introduction

The reciprocal interaction between species and their environment is a central ecological process governing ecosystem structure, function, and stability [1]. In the Anthropocene, habitat loss, fragmentation, pollution, biological invasions, and climate change are disrupting these relationships at rates that may exceed the adaptive capacity of many species [2,3,4,5]. Among terrestrial vertebrates, birds are especially responsive to such environmental change because climatic and habitat conditions strongly influence their distributions, phenology, and population dynamics [6].
Birds are highly responsive to environmental change because their geographic distributions, migration, breeding phenology, and population dynamics are closely linked to climatic and habitat conditions. Changes in temperature and precipitation can directly alter physiological and energetic constraints and can indirectly affect vegetation phenology, food availability, and the timing of migration and reproduction. Consequently, climate change may cause range expansion or contraction, latitudinal and elevational redistribution, and shifts in the geographic centers of suitable habitats [7]. In China, future climate change is projected to alter the extent and distributional centroids of suitable habitats for migratory birds, while long-term observations indicate that climatic conditions can also modify the migration timing of raptors [8,9]. These responses make birds an informative group for evaluating the ecological consequences of climate change.
Raptors are particularly informative for evaluating environmental change because they occupy high trophic positions and depend on the availability of prey, suitable nesting substrates, and functionally connected landscapes. Their generally large spatial requirements, long lifespans, delayed maturity, and low reproductive rates may limit their capacity to compensate rapidly for habitat loss, increased disturbance, or additional mortality. At the global scale, raptors are more threatened than birds as a whole, and many raptor populations are declining under the combined effects of habitat alteration, agricultural expansion, infrastructure development, and other human pressures [10,11]. Among the raptors occurring in Xinjiang, many Falco species use open or semi-open landscapes, including grasslands, desert steppes, agricultural mosaics, river valleys, and mountain foothills. Their habitat use is therefore likely to respond jointly to climate, topography, vegetation structure, water availability, land-use change, and human disturbance. Differences in migration strategy, prey use, nesting requirements, and habitat specialization may further generate species-specific responses to future environmental change [12,13]. Studies from Southeast Asia further illustrate that raptor habitat use and climate responses are strongly influenced by local habitat conditions. In Peninsular Malaysia, resident Peregrine Falcons (Falco peregrinus ernesti) breed mainly on limestone cliffs, highlighting their dependence on specific nesting substrates and potential exposure to land-use disturbance [14]. In Indonesia, ecological niche modeling of the Javan Hawk-Eagle (Nisaetus bartelsi) projected substantial future habitat contraction under the combined effects of climate change and anthropogenic pressure [15]. These findings emphasize the importance of considering climatic suitability together with habitat condition and human disturbance in raptor conservation.
Xinjiang provides an appropriate regional setting for examining these processes because its mountain-basin topography creates pronounced spatial gradients in temperature, precipitation, vegetation, water availability, and human land use. As a representative arid and semi-arid region of western China, Xinjiang contains diverse but environmentally fragile ecosystems that are highly sensitive to climatic change [16]. The region supports considerable avian diversity, with 425 recorded bird species and 52 raptor species [17]. However, previous studies of raptor distributions in Xinjiang have generally been limited by incomplete occurrence records, restricted spatial coverage, or insufficient consideration of future climate change [12,18,19,20,21]. More importantly, predicted environmental suitability does not necessarily correspond to high habitat quality or adequate protection, yet these dimensions have rarely been evaluated together for Falconidae in the region [22]. In addition, species-specific differences in future habitat change and spatial redistribution remain poorly understood. These gaps limit the identification of conservation priorities and the development of species-specific, climate-adaptive conservation strategies.
Falconid distributions are jointly constrained by climatic, topographic, hydrological, and landscape processes [13]. Temperature and precipitation can affect thermoregulatory and energetic costs, breeding and migration phenology, vegetation productivity, and the abundance or accessibility of prey [23]. Elevation, slope, and aspect modify local temperature and moisture conditions, terrain structure, and the availability of nesting and foraging sites [24]. Land-use/land-cover and NDVI characterize landscape composition, vegetation productivity, and vegetation structure, which may influence prey resources as well as hunting efficiency in open and semi-open environments [25,26]. Proximity to water may be particularly important in arid regions because river valleys, wetlands, reservoirs, and oases concentrate vegetation productivity and potential prey. Human land use and infrastructure can further alter nesting opportunities, disturbance exposure, mortality risk, and landscape connectivity [27]. These ecological mechanisms provide the biological basis for integrating climatic, topographic, vegetation, hydrological, and land-use predictors when modeling falconid habitat suitability. The MaxEnt model is based on the principle of maximum entropy and estimates a distribution of relative habitat suitability across the study area that maximizes entropy subject to constraints derived from species occurrence records and environmental predictors [28,29]. It is widely used for presence-only data and can perform effectively with relatively limited occurrence records, provided that sampling bias and model complexity are carefully addressed. However, default parameter settings may generate unnecessarily complex models and reduce transferability. Species-specific optimization of feature classes and regularization multipliers can therefore reduce overfitting and improve predictive performance [30,31]. Changes in projected suitable-habitat extent and distributional barycenters can provide spatial indicators of potential habitat redistribution under alternative future climate and land-use scenarios [32]. Importantly, shifts in modeled habitat barycenters reflect the spatial redistribution of predicted environmental suitability rather than direct observations of individual movement, dispersal, or migration.
However, environmental suitability predicted by species distribution models does not necessarily correspond to intact or high-quality habitat conditions on the ground. Areas identified as suitable by species distribution models (SDMs) may still be affected by habitat degradation, fragmentation, intensive land-use pressure, or other anthropogenic disturbances, which may reduce their potential conservation value despite otherwise favorable climatic or environmental conditions [13,22]. Therefore, integrating modeled habitat suitability, relative habitat quality, degradation pressure, and protected-area representation can provide a more reliable basis for identifying conservation priorities. In this context, the InVEST Habitat Quality model provides a spatially explicit, land-cover-based assessment of relative habitat condition and degradation pressure. It can therefore complement MaxEnt-based suitability predictions by distinguishing environmentally suitable areas that remain relatively intact from those exposed to substantial anthropogenic disturbance [33,34,35].
In addition, protected areas are central instruments for biodiversity conservation, but their effectiveness depends not only on their total area but also on whether they adequately cover the most important habitats of target species [36,37]. Conservation gap analysis, which overlays species distribution or habitat suitability maps with protected-area boundaries, has been widely used to assess whether priority habitats are sufficiently represented within existing conservation networks and to identify unprotected or underrepresented areas requiring additional conservation attention [38]. For raptors with large home ranges and high sensitivity to habitat disturbance, such spatial overlay analyses are particularly valuable because suitable habitats may extend beyond formal protected areas or occur in landscapes with high degradation risk [39,40]. To address these knowledge gaps, we integrated an optimized MaxEnt framework with barycenter migration analysis, InVEST-based habitat assessment, and protected-area overlay analysis to evaluate current habitat patterns, future redistribution, habitat conditions, and conservation gaps for Falconidae in Xinjiang [28,29,30,41,42]. Accordingly, this study integrates optimized habitat-suitability modeling, barycenter analysis, habitat quality and degradation assessment, and protected-area overlays to move beyond suitability-only evaluations. Specifically, we address the following questions: (1) What are the current spatial patterns of suitable habitats? (2) How will suitable habitats change under future climate scenarios? (3) How will suitable-habitat barycenters shift? (4) Where are the main conservation gaps? (5) How do future responses differ among species? By linking habitat suitability, future redistribution, habitat condition, and protection status, this study provides a basis for species-specific and climate-adaptive conservation in Xinjiang.

2. Materials and Methods

2.1. Study Area

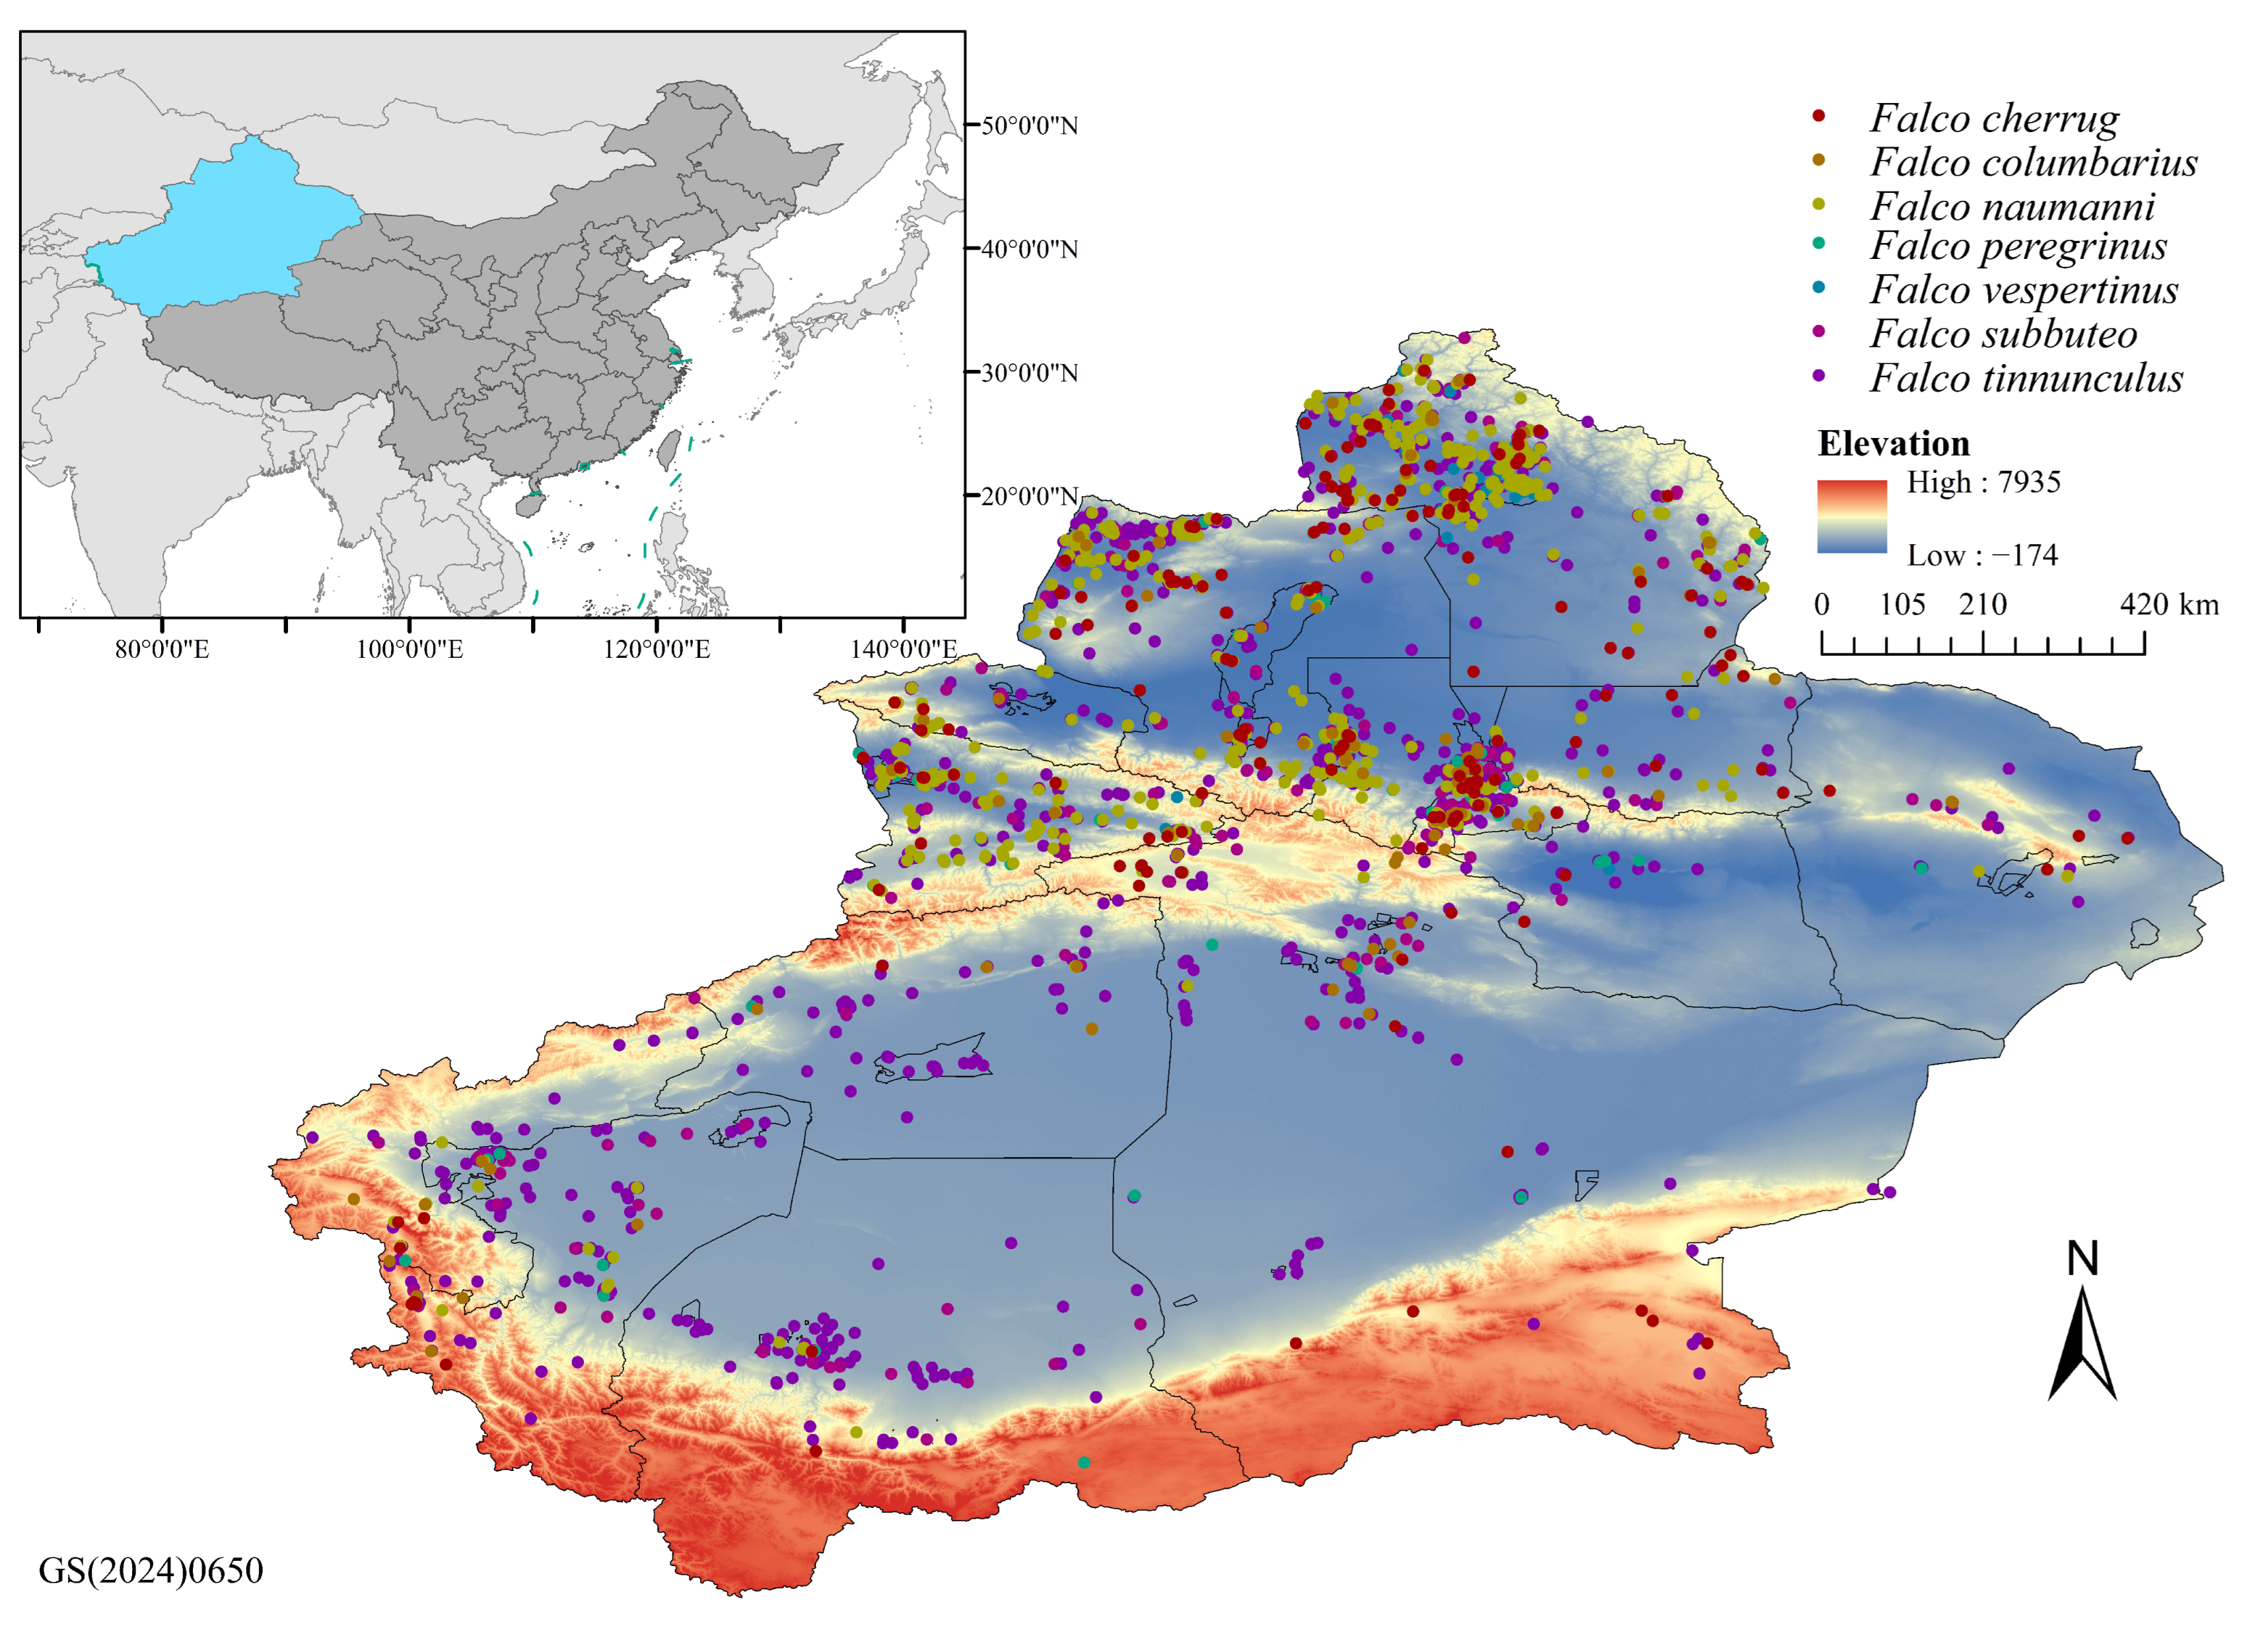
The Xinjiang Uygur Autonomous Region (34°22′–49°33′ N, 73°41′–96°18′ E) covers approximately 1.6649 million km2 in northwestern China and is a typical inland arid-semi-arid region of Eurasia [43]. Its topography is characterized by “three mountain ranges separated by two basins,” comprising, from north to south, the Altai Mountains, Junggar Basin, Tianshan Mountains, Tarim Basin, and Kunlun Mountains. This mountain-basin system includes plateaus, high mountains, hills, and basins and creates pronounced climatic gradients [44]. The Tianshan Mountains act as a major geographic barrier that modulates moisture transport by the westerlies and blocks or channels northerly cold air, concentrating precipitation in northern valleys such as the Ili and Irtysh and producing marked north-south differences in temperature and precipitation [45]. Xinjiang is characterized by an arid continental climate, with limited precipitation, high evaporation, and scarce water resources. Its sparse vegetation, low ecosystem productivity, strong dependence on river runoff and mountain snowmelt, and slow recovery after disturbance make regional ecosystems particularly vulnerable to climate change [17]. Recent warming and humidification trends may further intensify hydrological processes and challenge regional ecological stability [18]. The geographic location, elevation, and occurrence records of the seven falconid species in the study area are shown in Figure 1.

2.2. Data Sources

2.2.1. Bird Occurrence Data

We initially selected nine Falconidae species recorded as occurring in Xinjiang according to A Checklist on the Classification and Distribution of the Birds of China (Fourth Edition) [46]: Amur Falcon (Falco amurensis), Saker Falcon (F. cherrug), Merlin (F. columbarius), Lesser Kestrel (F. naumanni), Peregrine Falcon (F. peregrinus), Gyrfalcon (F. rusticolus), Eurasian Hobby (F. subbuteo), Common Kestrel (F. tinnunculus), and Red-footed Falcon (F. vespertinus). The same checklist was also used as the taxonomic reference for species identification and scientific nomenclature throughout this study.
In total, 10,498 raw occurrence records were assembled [47,48,49] from three sources: (1) 150 falconid records from field surveys across Xinjiang conducted from August 2023 to October 2025, covering reservoirs, lakes, nature reserves, and ecological parks, during which observers recorded species identity, abundance, and geographic coordinates while traveling transects by vehicle (20–40 km/h); (2) 9037 records from citizen science and institutional observations for Xinjiang (January 2002–July 2025) retrieved from the China Bird Report Center (https://www.birdreport.cn) via automated data acquisition using Selenium (version 4.47.0) in Python (version 3.10.11) after cleaning; and (3) 1311 occurrences downloaded from Global Biodiversity Information Facility (GBIF) (https://www.gbif.org) for the same period [50,51,52,53,54,55,56,57,58].
To reduce spatial autocorrelation and sampling bias, the records were first grouped by species and converted into CSV files containing species names and decimal WGS84 coordinates. We performed spatial thinning using the thin() function in the spThin package (version 0.2.0) in R (version 4.5.2) with a 1 km thinning distance, thereby retaining at most one occurrence per 1 km × 1 km grid cell. This resolution was chosen to minimize spatial autocorrelation while aligning with the highest resolution of our environmental predictor variables [59,60]. To ensure adequate sample support for species distribution modeling, only species with ≥100 unique occurrence records after spatial thinning were retained for subsequent analyses [20,61,62,63].

2.2.2. Environmental Variables

Environmental predictors comprised three categories: (1) natural habitat factors, including distance to water bodies, distance to nature reserves, land use and land cover change (LUCC), and normalized difference vegetation index (NDVI); (2) topographic factors, including elevation, slope, and aspect; and (3) climatic factors, including 19 bioclimatic variables.
The distance-to-water and distance-to-nature-reserve layers were derived from hydrographic and reserve boundary data from the 1:1,000,000 National Fundamental Geographic Database (National Geomatics Center of China (https://www.webmap.cn/commres.do?method=result100W, accessed on 18 August 2026)) and the Resource and Environmental Science and Data Platform (https://www.resdc.cn), respectively. Distance rasters were computed using the “Near” analysis in ArcGIS 10.8 (Esri, Redlands, CA, USA) [64].
Current LUCC data (2020) were obtained from the National Geomatics Center of China (https://cloudcenter.tianditu.gov.cn, accessed on 18 August 2026) global land-cover dataset [65]; and future LUCC data (1-km resolution) were obtained from the dataset of Zhang et al. [66] (GCAM+PLUS outputs). To maintain consistency with the climate projections used in this study, only the SSP1-2.6, SSP2-4.5, and SSP5-8.5 scenarios from the original dataset were included in the modeling analyses [66]. NDVI: annual 1-km NDVI (2002–2023) from the Resource and Environmental Science Data Center (https://www.resdc.cn); multi-year mean values were calculated as a static vegetation indicator [67].
Topography: ASTER GDEM (30-m) provided elevation, from which slope and aspect were derived (https://www.gscloud.cn).
Climate: present-day climate used WorldClim v2.1 bioclimatic variables (1970–2000 baseline) (https://www.worldclim.org). Future climate projections were made using the CMIP6 BCC-CSM2-MR model [68,69] under SSP126, SSP245, and SSP585 for three time slices (2041–2060, 2061–2080, and 2081–2100).
All raster layers were resampled to 1-km spatial resolution, reprojected to WGS84, and masked to the administrative boundary of Xinjiang (sourced from the National Geomatics Center of China). The final rasters were exported in ASCII format as input to MaxEnt V3.4.4. (Table 1).

2.3. Modeling Procedures

2.3.1. Model Construction and Variable Selection

We used MaxEnt version 3.4.4 to model the current and future habitat suitability of each retained Falconidae species. Predictor selection and model-complexity optimization were conducted separately for each species using the following procedures. We employed a two-stage process to select the variables, minimizing multicollinearity and overfitting. First, Spearman’s rank correlation coefficients between all candidate predictors were computed using background points (SDMtune package (version 1.3.3) in R). Variable pairs with |ρ| > 0.8 were considered highly correlated; in such cases, we retained the variable with greater ecological relevance for falconids or higher preliminary contribution to the model performance and removed the other variable. Second, we performed stepwise variable elimination based on the model discrimination performance, in which variables were iteratively removed and the resulting model AUC on an independent test set was recorded. The subset of variables that yielded the highest AUC and meaningful ecological contributions was retained. We also used the Jackknife test within MaxEnt to quantify the importance of individual variables and identify redundant variables [70]. The final species-specific predictor subsets obtained through this procedure were used for subsequent MaxEnt calibration.
In the MaxEnt model, the two parameters that most strongly affect the simulation results are feature classes (FCs) and the regularization multiplier (RM). The RM value determines the model complexity, whereas the FC determines the potential shape of the marginal response curves. MaxEnt provides five feature classes: linear (L), quadratic (Q), product (P), threshold (T), and hinge features (H). The more feature types selected, the more complex the model becomes [71]. Therefore, different parameter combinations produce models with different levels of complexity. To avoid overfitting and improve the generalization ability, we used the ENMeval package (version 2.0.5.2) in R to systematically optimize the key hyperparameters of the MaxEnt model. Eight feature-class combinations (FCs), namely L, LQ, LQH, LQHP, LQHPT, QHP, QHPT, and HPT, were combined with eight regularization multipliers (0.5–4.0, with an interval of 0.5), generating 64 parameter sets for analysis. The optimal model parameters were selected based on the ΔAICc (the minimum information criterion AICc value, ΔAICc = AICci − AICcmin), and when the ΔAICc value was minimal, model complexity and predictive performance were considered optimal [72].
The optimized environmental variables and parameter settings were imported into MaxEnt (V3.4.4) for final modeling. Response curves were generated, and a jackknife test was used to evaluate the contribution of environmental variables. The output format was set to “logistic”. To characterize environmental availability, 10,000 background points were randomly sampled from the entire study area. While this approach provides a broad representation of the available conditions, potential interactions with species occurrence sampling bias (as discussed later) are acknowledged. Of the occurrence data, 25% were randomly selected as the validation dataset for model evaluation, and the remaining 75% were used as training datasets. This cross-validation procedure was repeated 10 times, with the replicated run type set to “Crossvalidate,” whereas all other parameters were maintained at their default settings. The corresponding future environmental variables were then incorporated into the analyses under future climate scenarios, yielding predictions of current and future suitable habitats for each species [73].
The ASCII-format distribution maps generated by the model were reclassified in ArcGIS 10.8. The “10 percentile training presence Logistic threshold” was used to distinguish suitable from unsuitable habitats, as this threshold is commonly employed to balance omission and commission errors and is considered robust for identifying areas with a high probability of species presence. Suitable habitats were further divided into low-, medium-, and high-suitability classes using the tertile classification method. The areas of suitable and unsuitable habitats under different periods and climate scenarios were calculated using the Raster Calculator [74,75,76].

2.3.2. Barycenter Migration of Suitable Habitats of Falconid Birds

Climate change may alter the spatial distribution of suitable habitats and drive species to shift toward areas with more favorable environmental conditions. To characterize these spatial changes, the barycenter, defined as the geographic center of the predicted suitable habitat, was used as an indicator of habitat redistribution. By comparing the location and movement of the barycenter among different periods and climate scenarios, changes in the direction and distance of suitable-habitat shifts can be quantified, thereby providing a spatial measure of potential habitat migration patterns under climate change [8,62,77].
To calculate the barycenter (distribution center) of suitable habitats, we first extracted the suitable habitat areas for each species using the Extract by Attributes tool. These raster layers were converted into polygon features using the Raster to Polygon tool. Finally, the Mean Center spatial statistics tool was used to utilize the spatial geometric information of these polygon features to calculate the distribution center. For the multi-period results, barycenter points from different periods were merged, whereas the scenario and period fields were retained to support subsequent grouping and ordering. In ArcGIS 10.8, the merged barycenter points were connected in chronological order to generate migration trajectories using Points to Line. During trajectory construction, the scenario was used as the grouping field (Line Field) and the period as the sorting field (Sort Field), thereby ensuring that barycenter points under the same scenario were correctly connected according to the temporal sequence. This yielded barycenter migration paths for each scenario and enabled spatial visualization [78,79,80,81].
To extract elevation information for the barycenter points and quantitatively calculate their relative changes, while also uniformly outputting migration distance and direction relative to the current period, batch calculations were conducted in the R environment. A digital elevation model (DEM; ASCII raster format, .asc) was read using the terra (version 1.8.80) package, and elevation values were extracted for each barycenter point through raster-point spatial overlay to obtain barycenter elevations for all periods. Subsequently, using the barycenter of the current period (Current) as the common reference, the elevation change for each future period was calculated as ΔElev = Elev_future − Elev_current, and the sign of this value was used to determine whether the elevation increased or decreased. The barycenter migration distance was calculated using the geodesic distance function distGeo() provided by the geosphere (version 1.5.20) package, which converts the spherical/ellipsoidal distance between the current barycenter and each future barycenter into kilometers, thereby avoiding the systematic errors associated with planar distance calculations under geographic coordinates. The migration direction was calculated using geosphere::bearing(), which derives the azimuth (bearing; 0° = true north, increasing clockwise) from the reference point to the target point, and was further classified into eight compass directions (north, northeast, east, southeast, south, southwest, west, and northwest) to facilitate result summarization and comparison.

2.3.3. InVEST-Based Habitat Quality and Degradation Assessment

We used the InVEST Habitat Quality model (version 3.3.2) to assess landscape-based relative habitat quality and habitat degradation risk relevant to Falconidae conservation in Xinjiang. The model estimates habitat degradation and habitat quality by integrating land-use/land-cover (LULC) types, spatial layers of threat factors, threat weights, maximum distances of influence, distance-decay functions, and the sensitivity of each LULC type to different threats [35]. In this study, the InVEST outputs were interpreted as relative habitat conditions derived from land-cover patterns and threat intensity, rather than species-specific realized habitat quality, actual occupancy probability, population density, or absolute ecological thresholds. These outputs were further used in combination with MaxEnt-derived habitat suitability maps to identify areas that were both environmentally suitable and characterized by relatively high current habitat quality [34,36]. The model was run using a 30 m LULC raster, and the LULC classes within the study area were reclassified into cropland, forest, grassland, shrubland, wetland, water, artificial surface, bare land, and glacier/permanent snow. All threat layers were projected, rasterized, resampled, and aligned to the same spatial resolution, extent, coordinate system, and pixel grid as the LULC raster. Parameterization followed the requirements of the Habitat Quality module in the InVEST User’s Guide and was further adjusted within the ranges of maximum influence distance, threat weight, and distance-decay function reported in previous habitat quality studies [82,83,84]. Based on the landscape characteristics of Xinjiang and the habitat ecology of falconids, four threat factors were included: transportation disturbance, artificial surfaces, cropland, and bare land [85,86]. Roads and railways were merged to represent transportation disturbance, whereas artificial surfaces, cropland, and bare land represented construction-related disturbance, agricultural disturbance, and low-vegetation or exposed-surface disturbance, respectively. Transportation disturbance and cropland were assigned linear decay functions to represent a gradual decrease in influence with increasing distance, whereas artificial surfaces were assigned an exponential decay function to reflect stronger near-source disturbance and rapid attenuation with distance [87,88]. The full threat-factor parameters and their ecological interpretations are provided in Table 2.
Habitat suitability scores and threat sensitivity values for each LULC type were assigned according to the InVEST parameter framework, the ecological attributes of land-cover types in Xinjiang, and falconid use of open habitats, piedmont zones, river valleys, desert steppe, and cropland-grassland mosaic landscapes (Table 3). Grassland was assigned a relatively high habitat suitability score because it represents an important open foraging habitat for many falconid species in Xinjiang [89]. Shrubland, wetland, forest, and cropland were assigned moderate or moderate-to-low suitability values because they may provide prey resources or activity space in piedmont areas, river valleys, oasis margins, forest edges, or agricultural mosaic landscapes [27,90]. Water bodies were assigned low suitability because water itself is not a primary habitat for falconids, although riparian and wetland margins may have ecological relevance. Artificial surfaces were considered non-natural habitats and were assigned a habitat suitability score of 0. Bare land was not treated as unsuitable habitat because bare land in Xinjiang includes natural open landscapes such as Gobi, desert, exposed rock, and gravel surfaces, some of which may be used by falconids for foraging, resting, or breeding [26]. Therefore, bare land retained a certain habitat value in the sensitivity table, while being assigned a relatively low threat weight when used as a threat source to avoid overestimating degradation across extensive natural open landscapes. The resulting habitat quality and degradation maps were used for relative conservation prioritization and subsequent overlay analyses with MaxEnt suitability maps and protected-area boundaries; the derived classes indicate relative spatial priority and should not be interpreted as absolute ecological thresholds.

2.3.4. Protected-Area Overlay and Conservation Gap Analysis

To evaluate the extent to which the existing protected-area system covers key habitats for Falconidae in Xinjiang, we extracted 82 protected areas within the Xinjiang Uygur Autonomous Region from the protected-area spatial dataset, including nature reserves, wetland parks, geoparks, forest parks, and scenic areas. The vector boundaries of these protected areas were converted into a binary raster layer, in which pixels located inside protected-area boundaries were assigned a value of 1 and pixels outside protected-area boundaries were assigned a value of 0. The resulting protected-area layer was then aligned with the MaxEnt-derived habitat suitability maps, InVEST-derived habitat quality map, and habitat degradation map using the same projected coordinate system, spatial extent, pixel size, and raster grid alignment.
By overlaying the protected-area layer with habitat quality and degradation classes, we calculated the area and proportion of each habitat quality and degradation class inside and outside protected areas to evaluate the representativeness of the existing protected-area system for key habitat categories [37,38]. Furthermore, for each falconid species, the continuous MaxEnt suitability output was converted into a binary suitable/unsuitable habitat map using the 10th percentile training presence logistic threshold, with suitable habitat including low-, medium-, and high-suitability areas. The binary suitable habitat map was then overlaid with the protected-area layer and the InVEST-derived habitat quality and degradation classes. Suitable habitats located outside protected areas were defined as potential conservation gaps and were further characterized according to their relative habitat quality and degradation risk. Suitable habitats outside protected areas with high relative habitat quality were considered priority conservation gaps, whereas those with low relative habitat quality or high degradation risk were regarded as potential management gaps requiring field validation, habitat restoration, or disturbance control [29,34,81].
The attribute-based conservation-gap categories were calculated independently and were therefore non-mutually exclusive. Consequently, the areas of individual gap categories should not be summed to estimate the total conservation-gap area. For cartographic presentation, a mutually exclusive gap map was generated by assigning each overlapping pixel to a single category according to a predefined priority hierarchy.

3. Results

3.1. Occurrence-Data Filtering, Predictor Selection, and Model Evaluation

Spatial thinning retained 2736 independent occurrence records. Falco amurensis (n = 2) and F. rusticolus (n = 3) did not meet the minimum occurrence threshold and were therefore excluded. Consequently, seven species comprising 2731 occurrence records were retained for MaxEnt modeling (Table 4).
Predictor screening generated species-specific environmental-variable subsets. BIO2, BIO3, BIO15, LUCC, distance to water bodies, distance to protected areas, and NDVI were retained for all seven modeled species, whereas the remaining predictors were retained selectively according to their correlation structure, ecological relevance, and model performance (Table 5).
ENMeval-based tuning produced species-specific optimal combinations of regularization multipliers (RMs) and feature classes (FCs) that substantially reduced the model complexity relative to the default settings (Table 6). For six species, the optimized models achieved ΔAICc = 0 within the tested parameter space, indicating markedly lower AICc than the defaults and suggesting an improved balance between model fit and complexity relative to the default settings. The selected RM-FC combinations were used to generate current and future habitat projections for each species in the study.
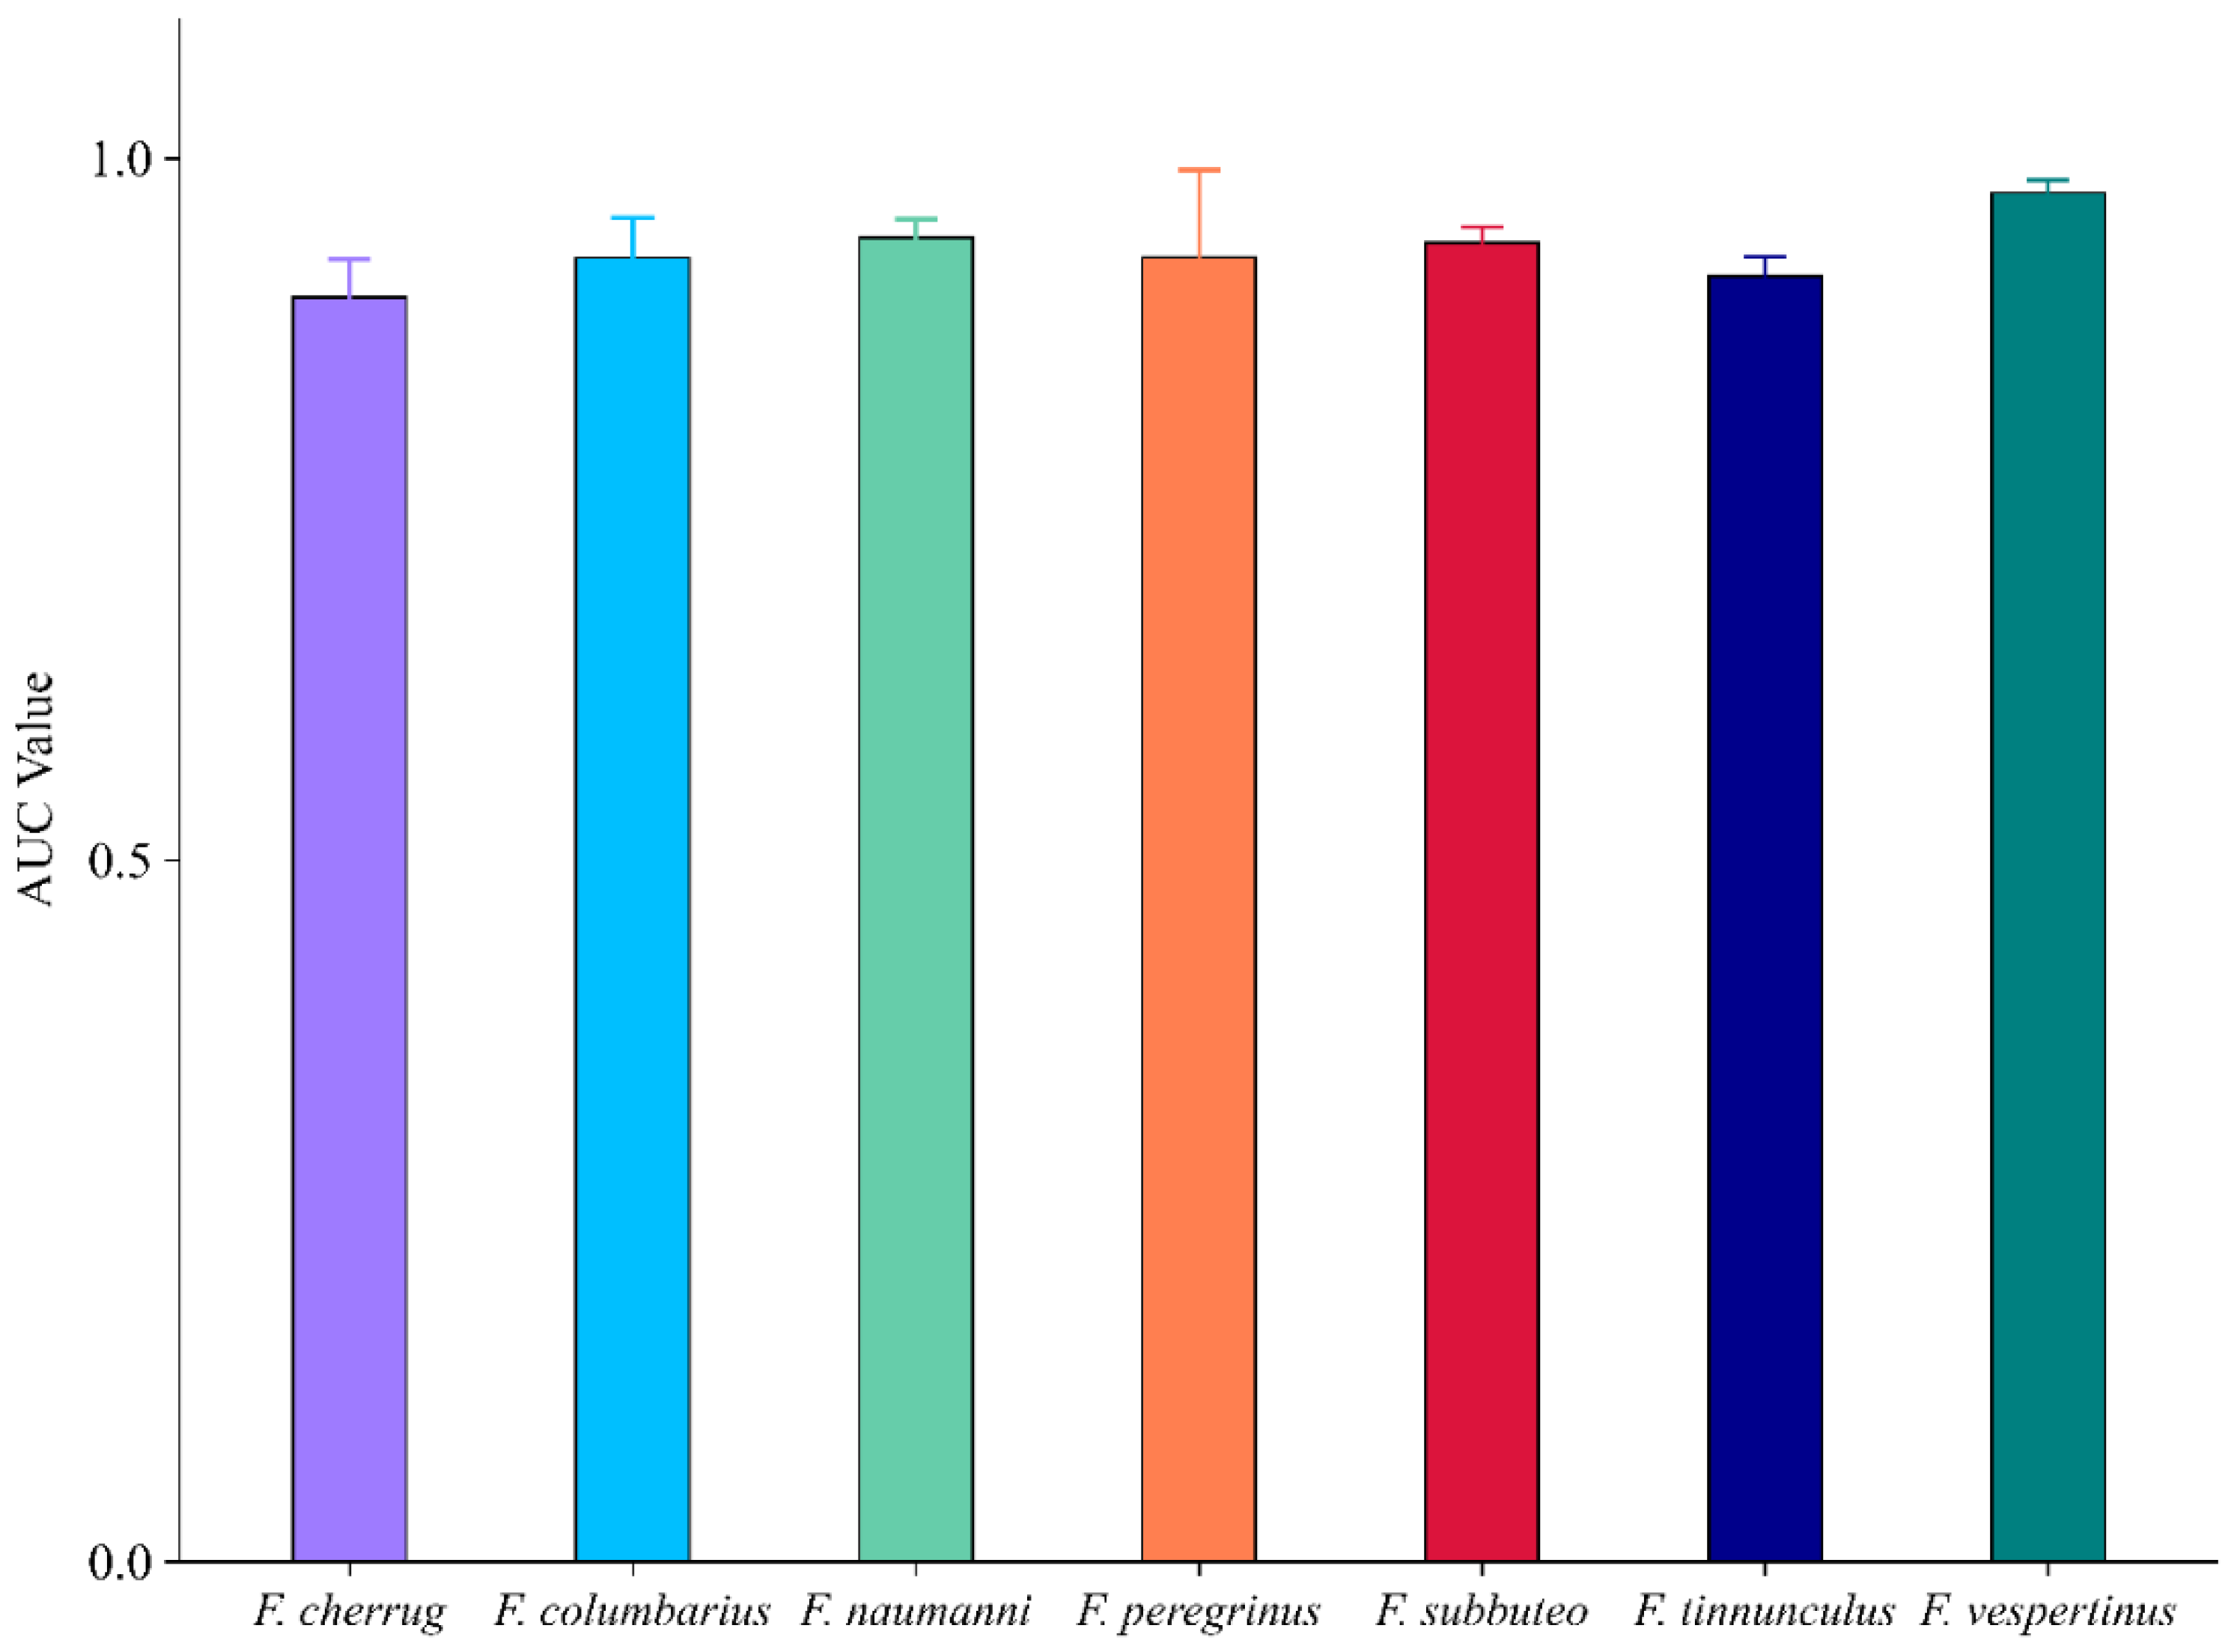
Model discrimination was high, with all species achieving mean AUC values exceeding 0.90 across current and future scenarios (standard deviation < 0.07; Figure 2). Further, inspection of avg.diff.AUC and Mean.OR10% confirmed acceptable training-testing consistency and omission rates (Table 4). These robust diagnostic metrics collectively support the reliability of the optimized MaxEnt models for subsequent spatial analyses.

3.2. Environmental Contributions and Response Curves

The percent contribution and jackknife analyses revealed marked interspecific differences in the key drivers, although some common patterns emerged (Table 7). LUCC (land-use/land-cover) was a dominant contributor for six species (14.3–76.1%), indicating the broad sensitivity of falconids to landscape composition. Precipitation variables, particularly BIO19 (precipitation of the coldest quarter) and BIO15 (precipitation seasonality), were important for several species, emphasizing the role of winter hydrothermal conditions. NDVI notably influenced F. subbuteo (29.7%), whereas distance to water bodies (Dis_ws) and proximity to protected areas (Dis_nr) also contributed to the presence of specific taxa.
Response curves revealed marked interspecific differences in the associations between environmental predictors and habitat suitability. Predicted occurrence probability was generally highest for artificial surfaces, followed by water bodies, wetlands, or cropland (Figure S1). For NDVI, predicted suitability increased markedly once NDVI exceeded approximately 0.2. Falco tinnunculus, F. cherrug, and F. subbuteo approached plateaus at moderate NDVI values, whereas F. columbarius, F. vespertinus, and F. peregrinus peaked at approximately 0.5 and declined at higher values. Falco naumanni showed a renewed increase at high NDVI values (Figure S2). For climatic predictors, F. tinnunculus, F. naumanni, and F. cherrug exhibited unimodal responses to BIO19, with maxima at approximately 27–50 mm. By contrast, the predicted suitability of F. vespertinus declined rapidly when BIO15 exceeded approximately 25 (Figures S3 and S4).

3.3. Current Spatial Patterns of Suitable Habitat

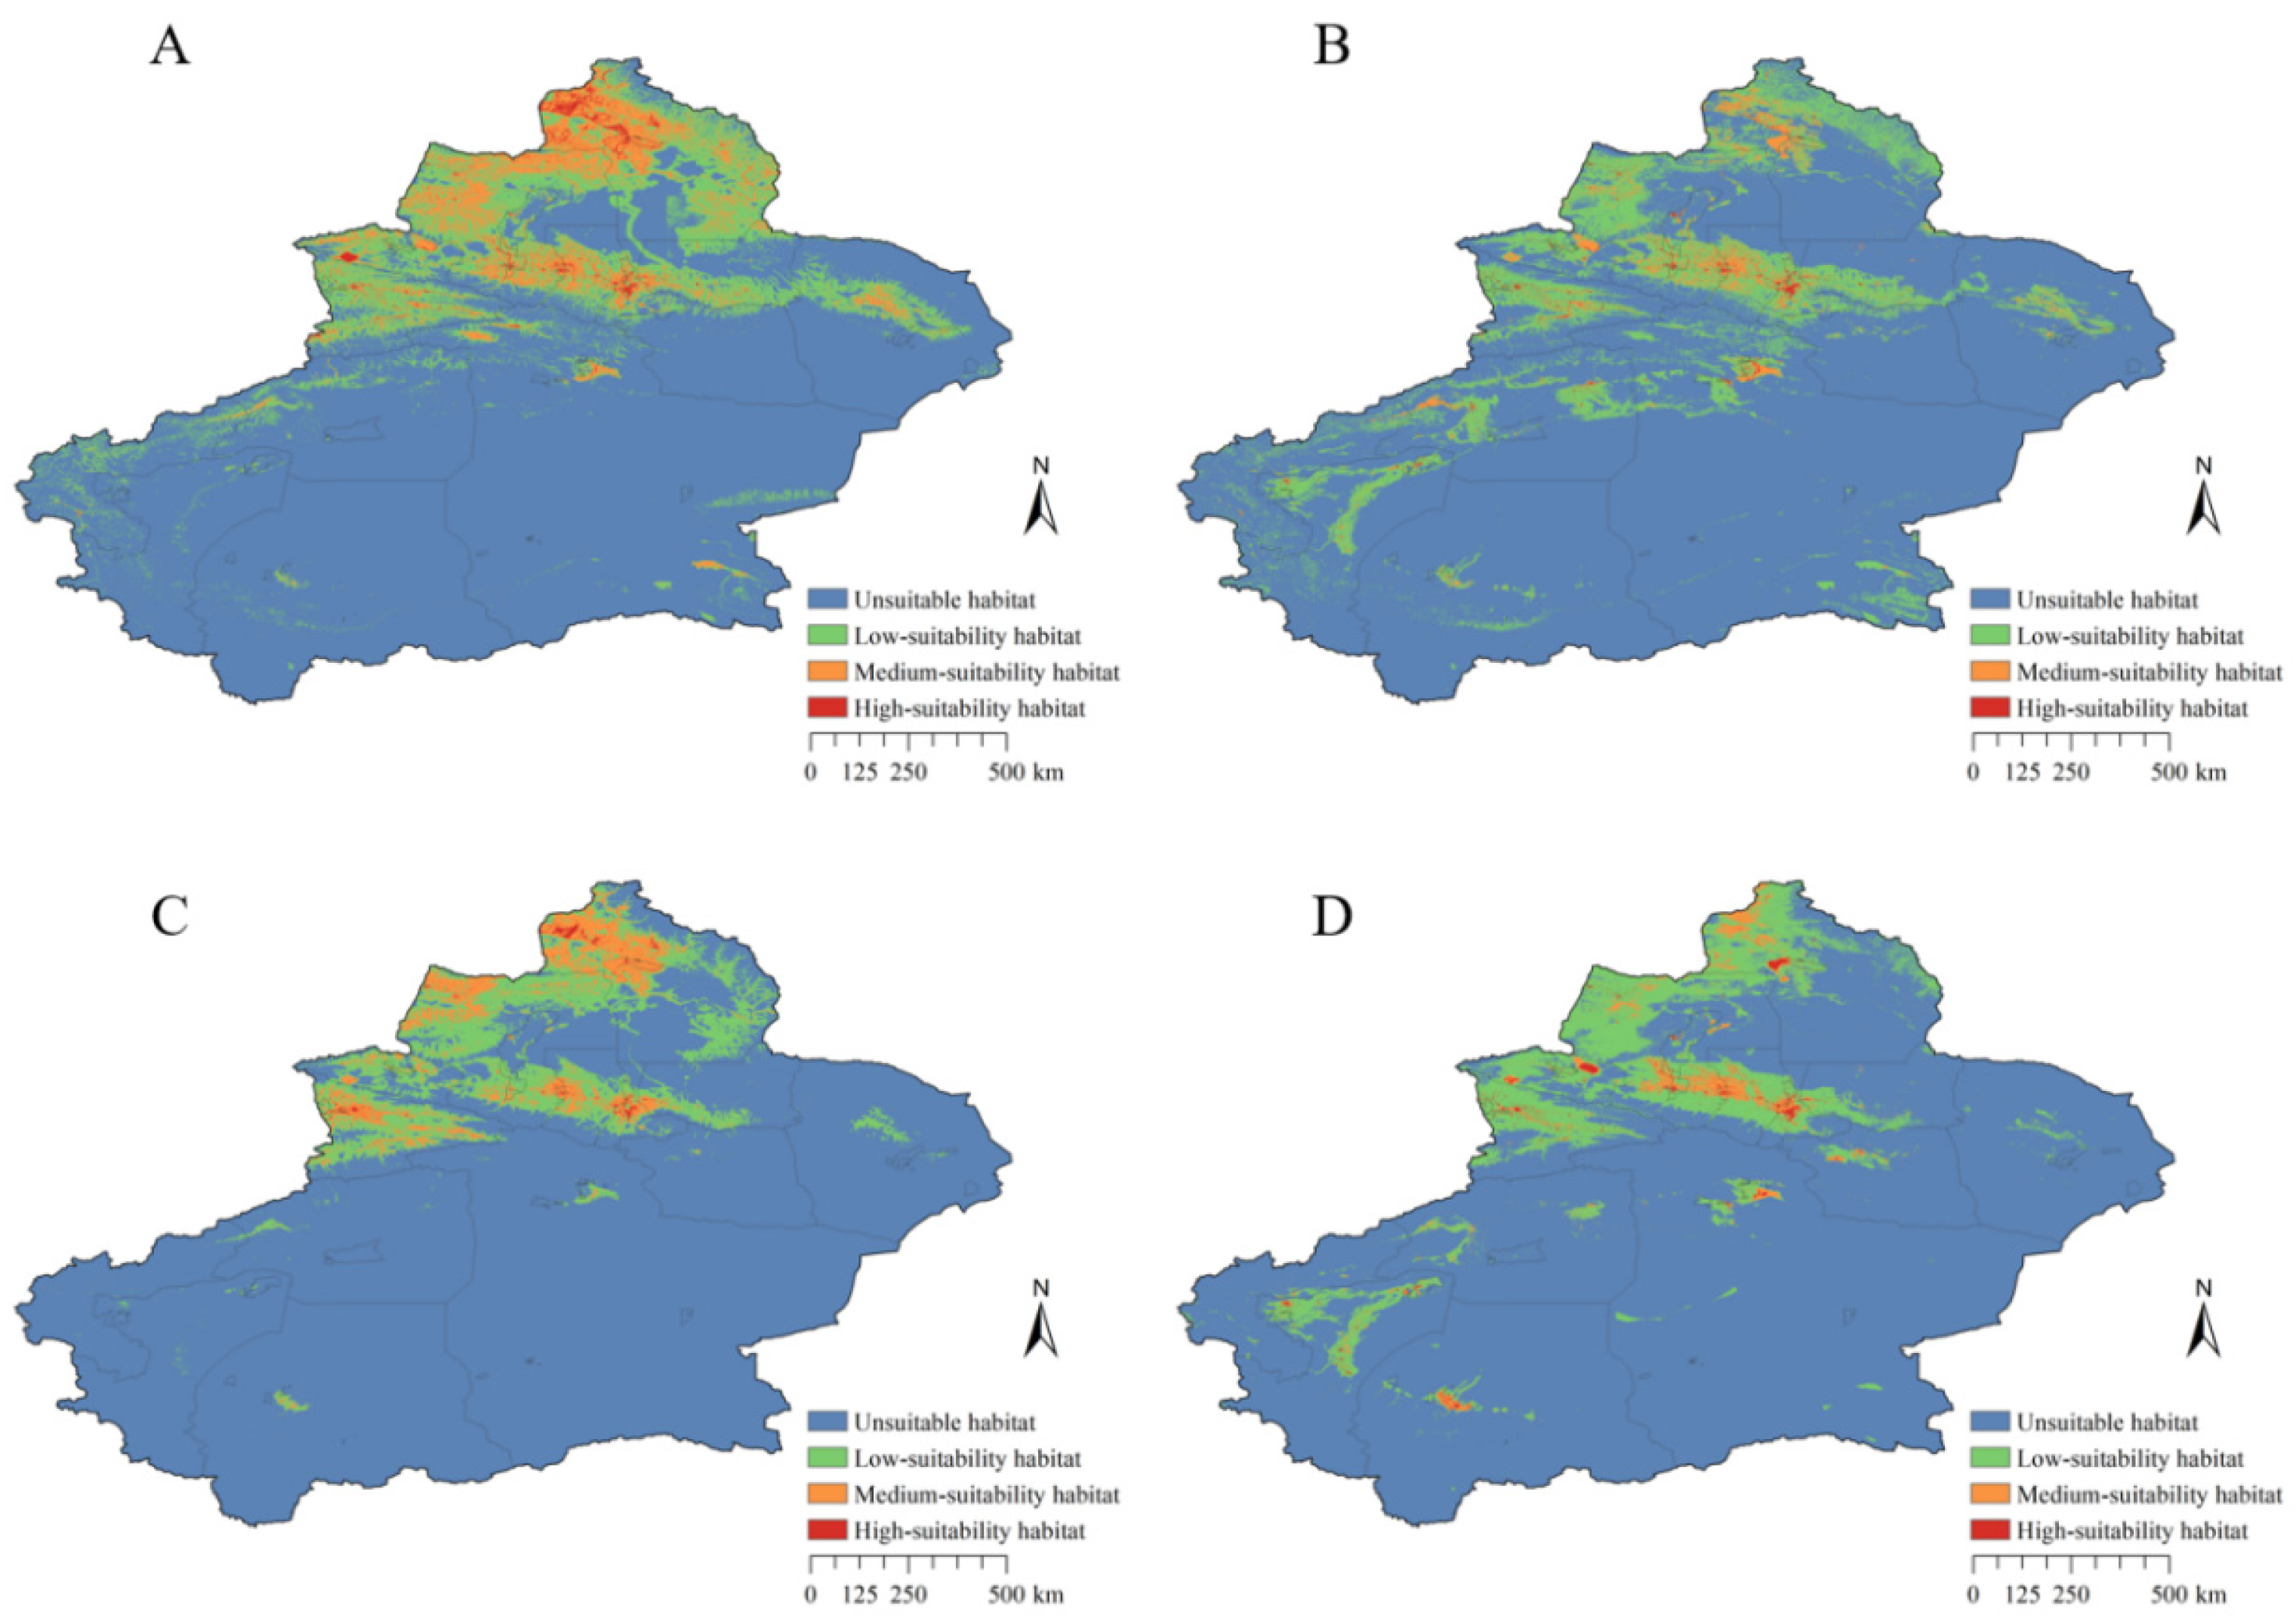
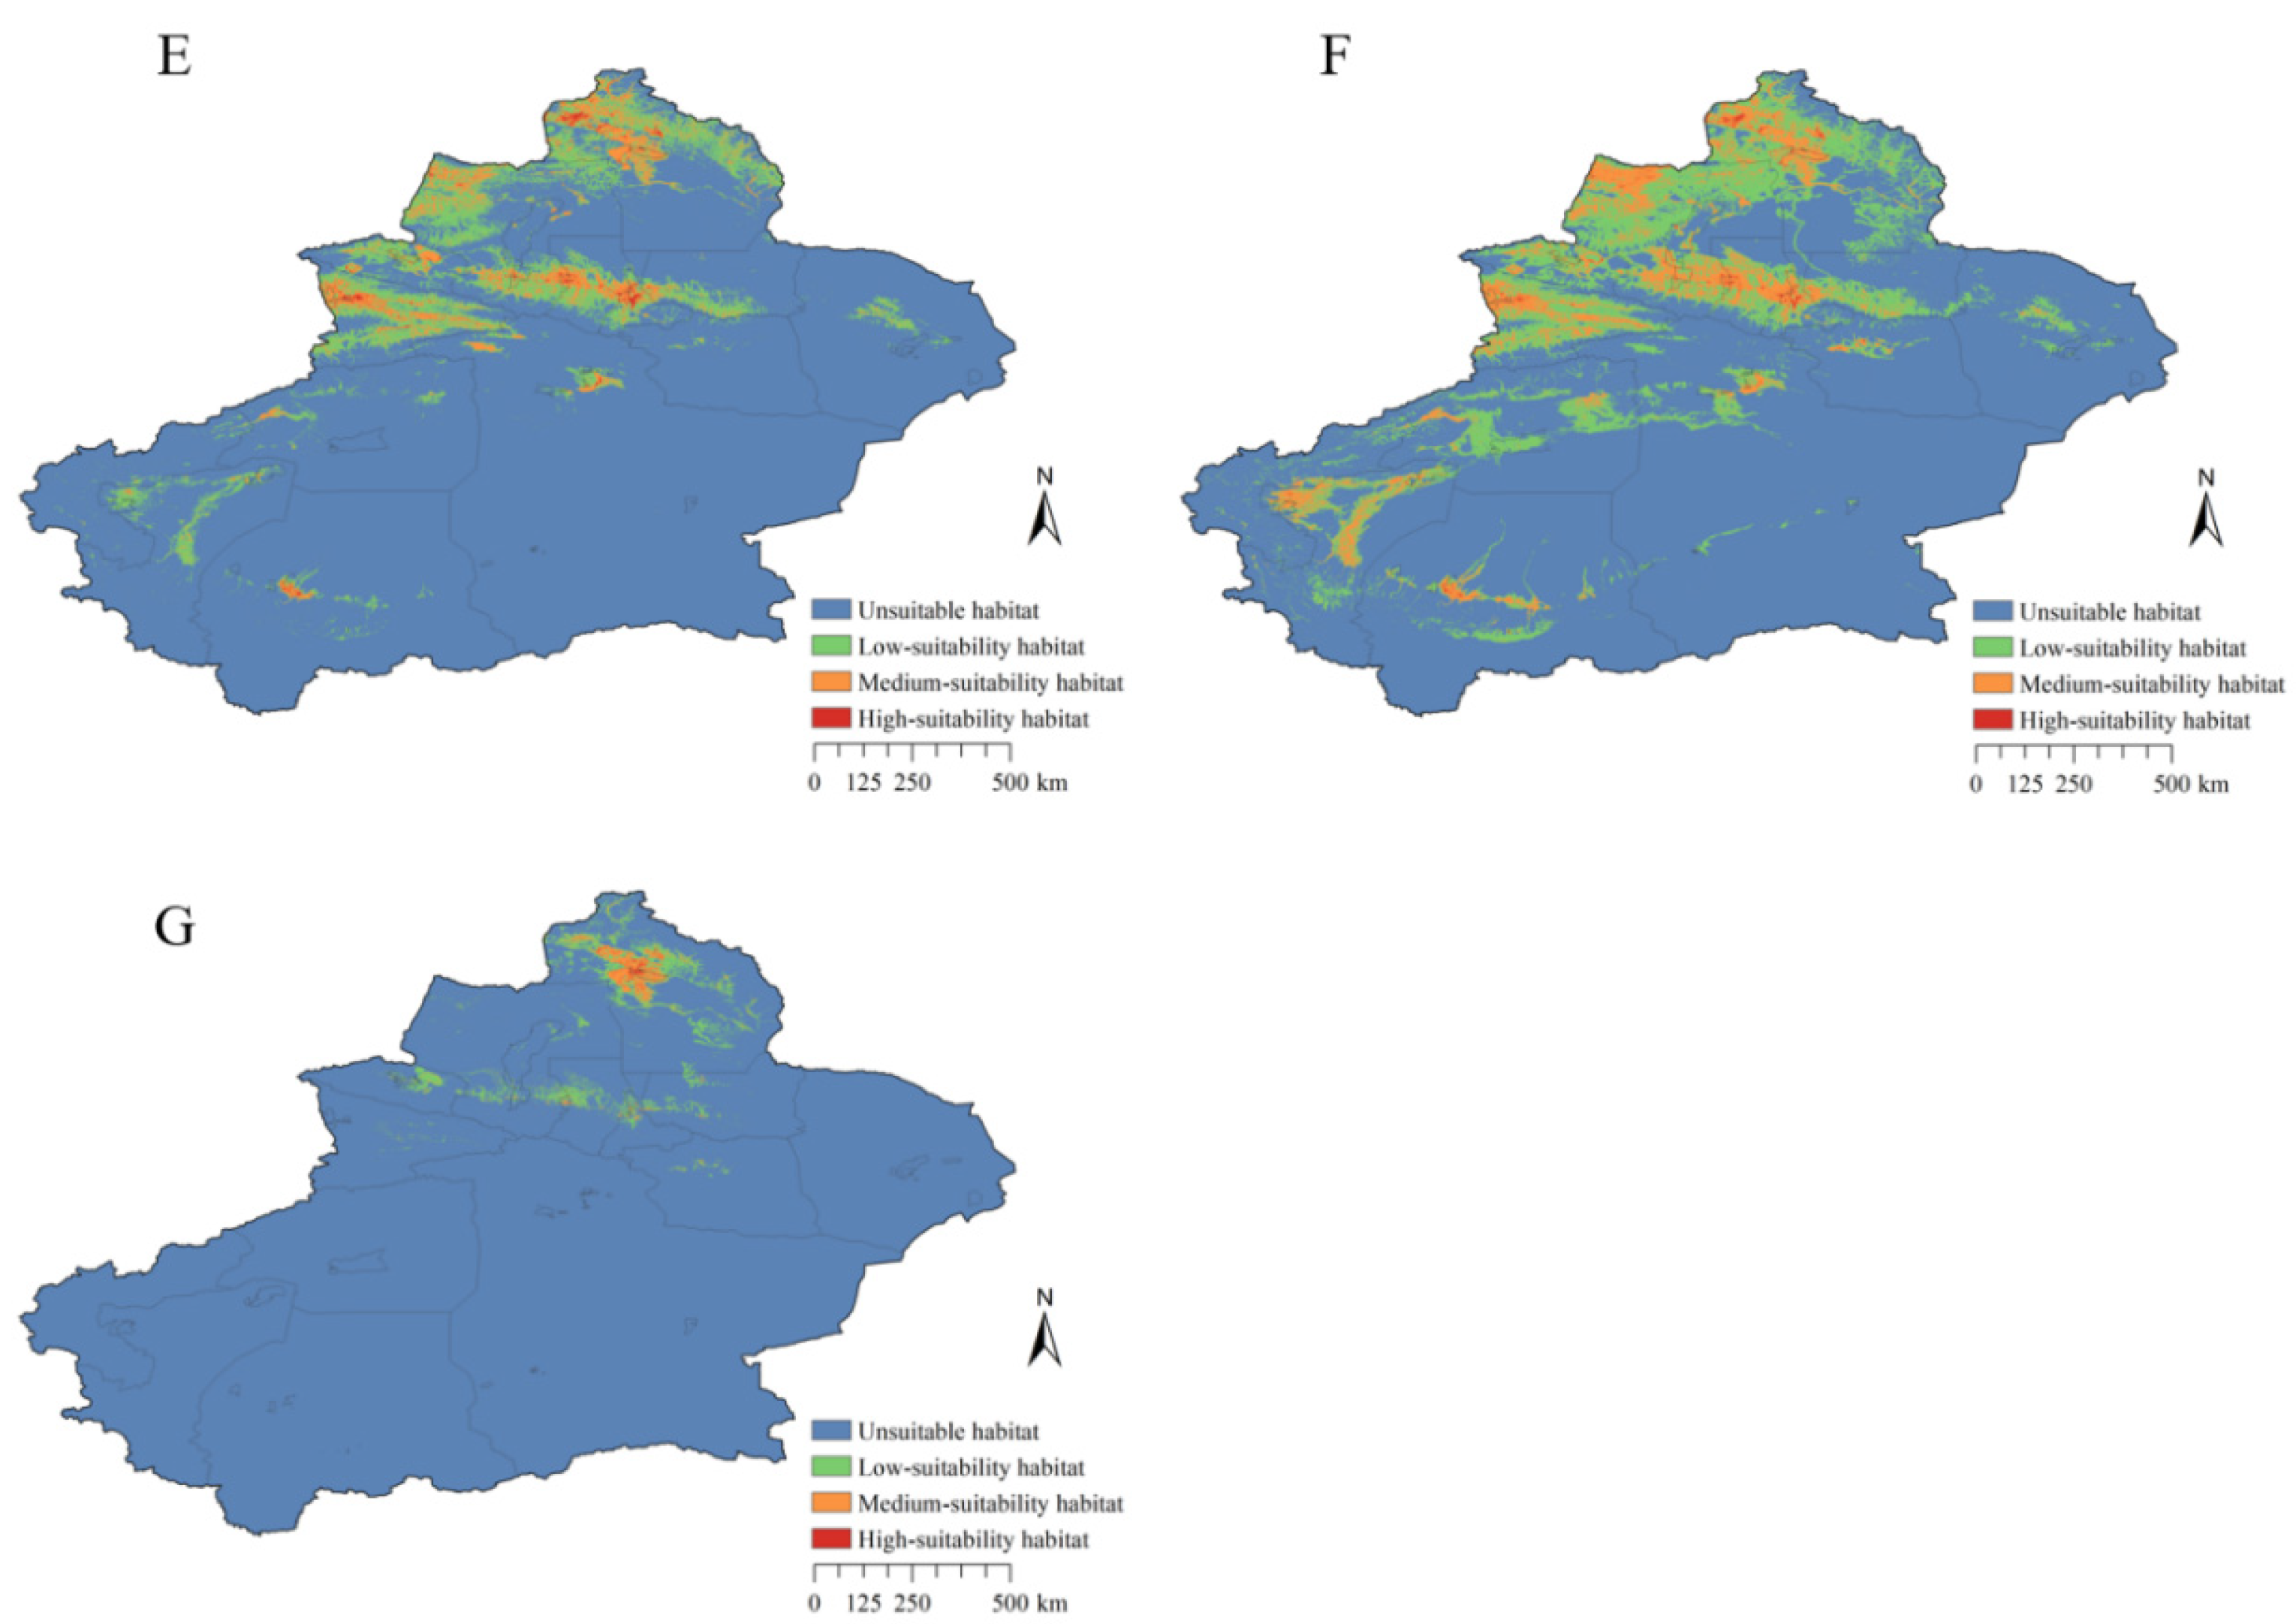
The modeled current distributions align closely with Xinjiang’s topographic template of “three mountain ranges interspersed with two basins.” Medium-high suitability was concentrated along river corridors and piedmonts, including the southern slopes of the Altai and central-western Tianshan and their piedmonts, the Ili River Valley, and the northern Kunlun foothills. The interior basins (Junggar and Tarim) were predominantly low or unsuitable (Figure 3). Except for F. vespertinus, all species showed suitable areas in the central-western Tianshan, Altai, western Junggar mountain valley zones, and Kunlun northern foothills regions.
Two broad distributional patterns emerged: a Northern Xinjiang-biased distribution (e.g., F. vespertinus, F. naumanni), with a core high-suitability in the Irtysh and Ili basins and limited southern presence (a “core area” refers to a region where high-suitability habitats are spatially concentrated). Widespread northern and southern distributions (e.g., F. cherrug, F. columbarius, F. peregrinus), with F. cherrug showing the largest and most heterogeneous high-suitability network.
Quantitatively, the total suitable area (low + medium + high; 104 km2) varied among species: F. cherrug (38.14 × 10⁴ km2; 22.9% of Xinjiang), F. tinnunculus (35.86 × 10⁴ km2; 21.5%), F. columbarius (29.64 × 10⁴ km2; 17.8%), F. peregrinus (24.10 × 10⁴ km2; 14.5%), F. naumanni (23.69 × 10⁴ km2; 14.2%), F. subbuteo (21.85 × 10⁴ km2; 13.1%), and F. vespertinus (4.65 × 10⁴ km2; 2.8%). Across species, unsuitable areas were dominant, followed by low-suitability areas. High-suitability habitats constituted the smallest fraction, with F. cherrug exhibiting the largest high-suitability extent (1.19 × 10⁴ km2) and F. vespertinus the smallest (0.13 × 10⁴ km2) (Table 8).

3.4. Current Relative Habitat Quality and Degradation Patterns

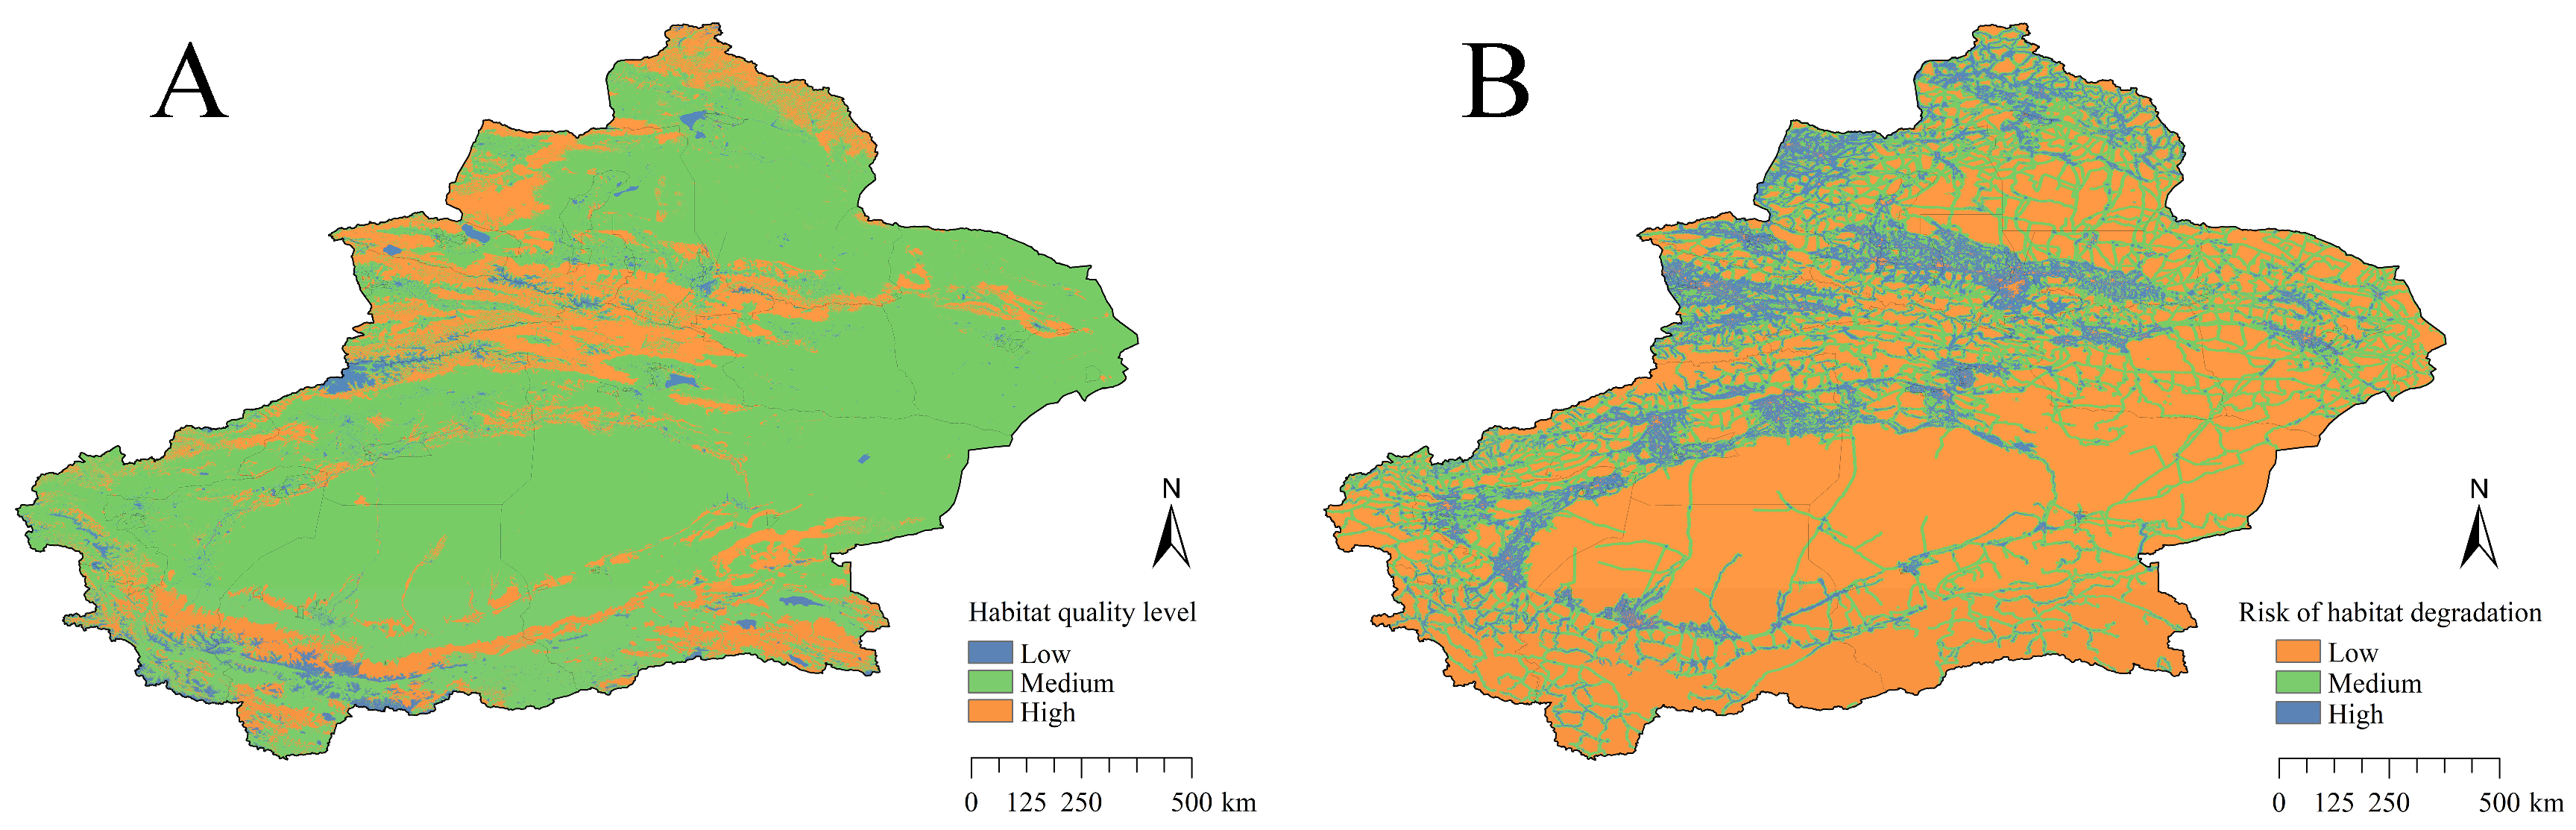
The InVEST Habitat Quality model showed that the mean relative habitat quality index in the Xinjiang Uygur Autonomous Region was 0.514, with a standard deviation of 0.185, indicating an overall moderate level of habitat quality and clear spatial heterogeneity across the study area. Based on the natural breaks classification method, the relative habitat quality index was divided into three classes: low, medium, and high. Medium-quality areas dominated the study region, followed by high-quality areas, whereas low-quality areas accounted for the smallest proportion (Figure 4A; Table 9). Spatially, areas with high relative habitat quality were mainly distributed in the piedmont zones of the Altai Mountains, the central-western Tianshan Mountains, the Ili River Valley, the Turpan-Hami Basin, the Kunlun Mountains, and the peripheral areas surrounding the Tarim Basin. High-quality areas in mountain foothills and river valleys were relatively continuous, whereas those around basin margins and some open landscapes were more patchily distributed. Areas with low relative habitat quality were mainly found in high-elevation mountain and snow-covered regions south of the Kunlun Mountains and in the central-western Tianshan Mountains. Low-quality habitats were also observed within several large water bodies, such as Sayram Lake, Ayding Lake, Ulungur Lake, and Bosten Lake.
The relative habitat degradation risk index was also classified into low, medium, and high levels using the natural breaks method. Low-risk areas accounted for the largest proportion, followed by medium-risk areas, whereas high-risk areas occupied a relatively smaller proportion (Figure 4B; Table 10). Compared with the spatial pattern of relative habitat quality, the distribution of relative degradation risk was more dispersed and showed a clear association with the transportation network. Medium-risk areas were mainly distributed in linear or network-like patterns along roads and railways, whereas high-risk areas were mostly clustered as patches around linear medium-risk zones. The spatial pattern of relative degradation risk was closely associated with transportation corridors. Medium-risk areas formed linear or network-like bands along roads and railways, whereas high-risk areas were mainly distributed as patches adjacent to these linear zones. High-degradation areas also occurred within or near some high-quality habitats.
A shows the spatial distribution of relative habitat quality, and B shows the spatial distribution of relative habitat degradation risk. The classified levels represent relative land-cover-based habitat conditions and degradation risk, rather than absolute ecological thresholds.

3.5. Suitability-Quality Mismatch and Protected-Area Representation

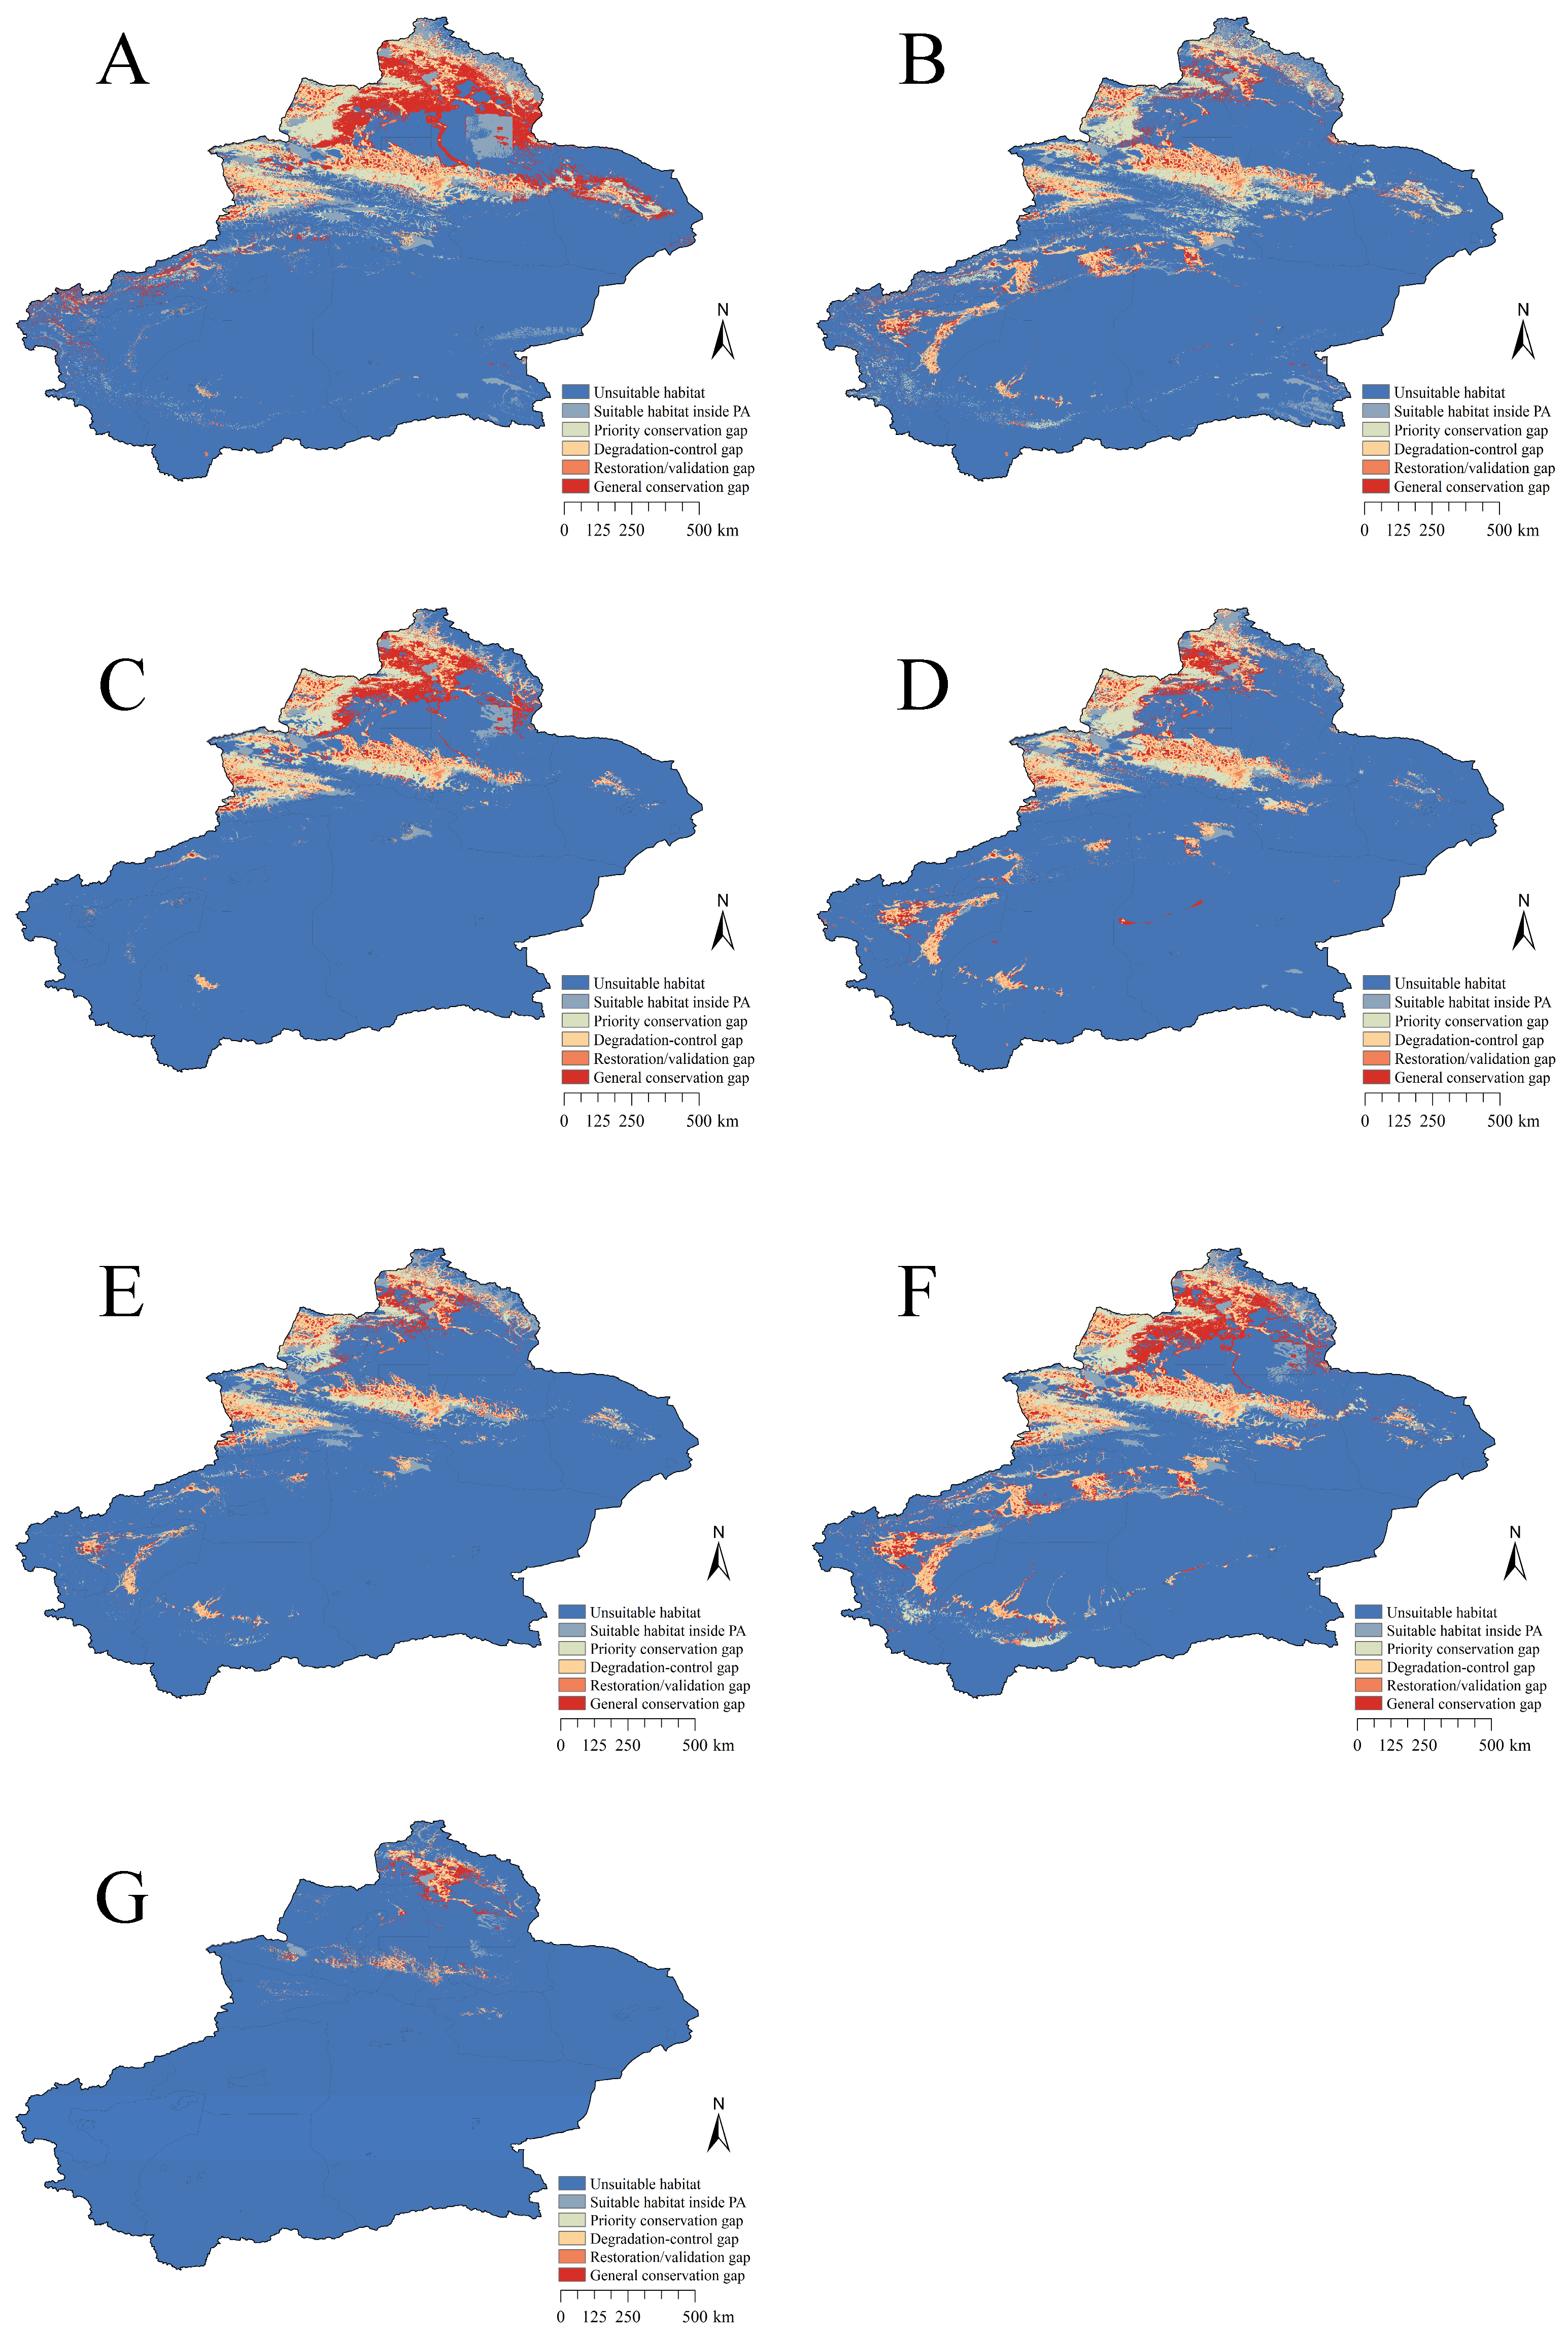
Overlay analyses further revealed extensive conservation gaps between predicted suitable habitats and the current protected-area network for the seven Falconidae species in Xinjiang (Figure 5; Table 11). The largest areas of suitable habitat outside protected areas were identified for F. tinnunculus and F. cherrug (304,866 and 303,205 km2, respectively), followed by F. columbarius (249,156 km2), F. peregrinus (204,335 km2), F. naumanni (193,059 km2), F. subbuteo (176,976 km2) and F. vespertinus (35,346 km2).
High-quality priority conservation gaps were most extensive for F. cherrug, F. columbarius and F. tinnunculus, covering 102,489, 97,490 and 94,413 km2, respectively. Substantial high-quality gaps were also found for F. peregrinus, F. naumanni and F. subbuteo (69,500–61,505 km2), whereas F. vespertinus showed a much smaller high-quality gap of 2752 km2. High-degradation management gaps were widespread, especially for F. tinnunculus, F. columbarius, F. cherrug, F. peregrinus and F. subbuteo, with areas ranging from 86,488 to 133,895 km2. F. naumanni also showed a large high-degradation gap of 80,273 km2, while F. vespertinus had a smaller gap of 16,312 km2.
High-quality and high-degradation areas also overlapped within unprotected suitable habitats for all species. These high-value but threatened gaps were largest for F. tinnunculus, F. cherrug and F. columbarius (36,647, 35,108 and 33,762 km2, respectively), followed by F. naumanni, F. peregrinus and F. subbuteo (23,940–25,630 km2). F. vespertinus showed the smallest overlap area, at 1716 km2.
Values are expressed in 104 km2. Inside PA and Outside PA indicate suitable habitat inside and outside protected areas, respectively; suitable habitat outside protected areas was defined as the total conservation gap. Priority gap, low-quality management gap, high-degradation management gap and high-quality × high-degradation gap indicate unprotected suitable habitats with high habitat quality, low habitat quality, high degradation risk, and both high habitat quality and high degradation risk, respectively. General gap indicates other unprotected suitable habitats. These gap types were calculated as non-mutually exclusive categories and therefore do not necessarily sum to the total conservation gap area. PA is protected area.
Categories were derived from the overlay of predicted suitable habitats, protected-area coverage, relative habitat quality and degradation risk. Priority conservation gaps indicate unprotected suitable habitats with high habitat quality, degradation-control gaps indicate unprotected suitable habitats with high degradation risk, restoration/validation gaps indicate unprotected suitable habitats with low habitat quality, and general conservation gaps indicate other unprotected suitable habitats. PA is protected area.

3.6. Projected Future Fluctuations in Habitat Area

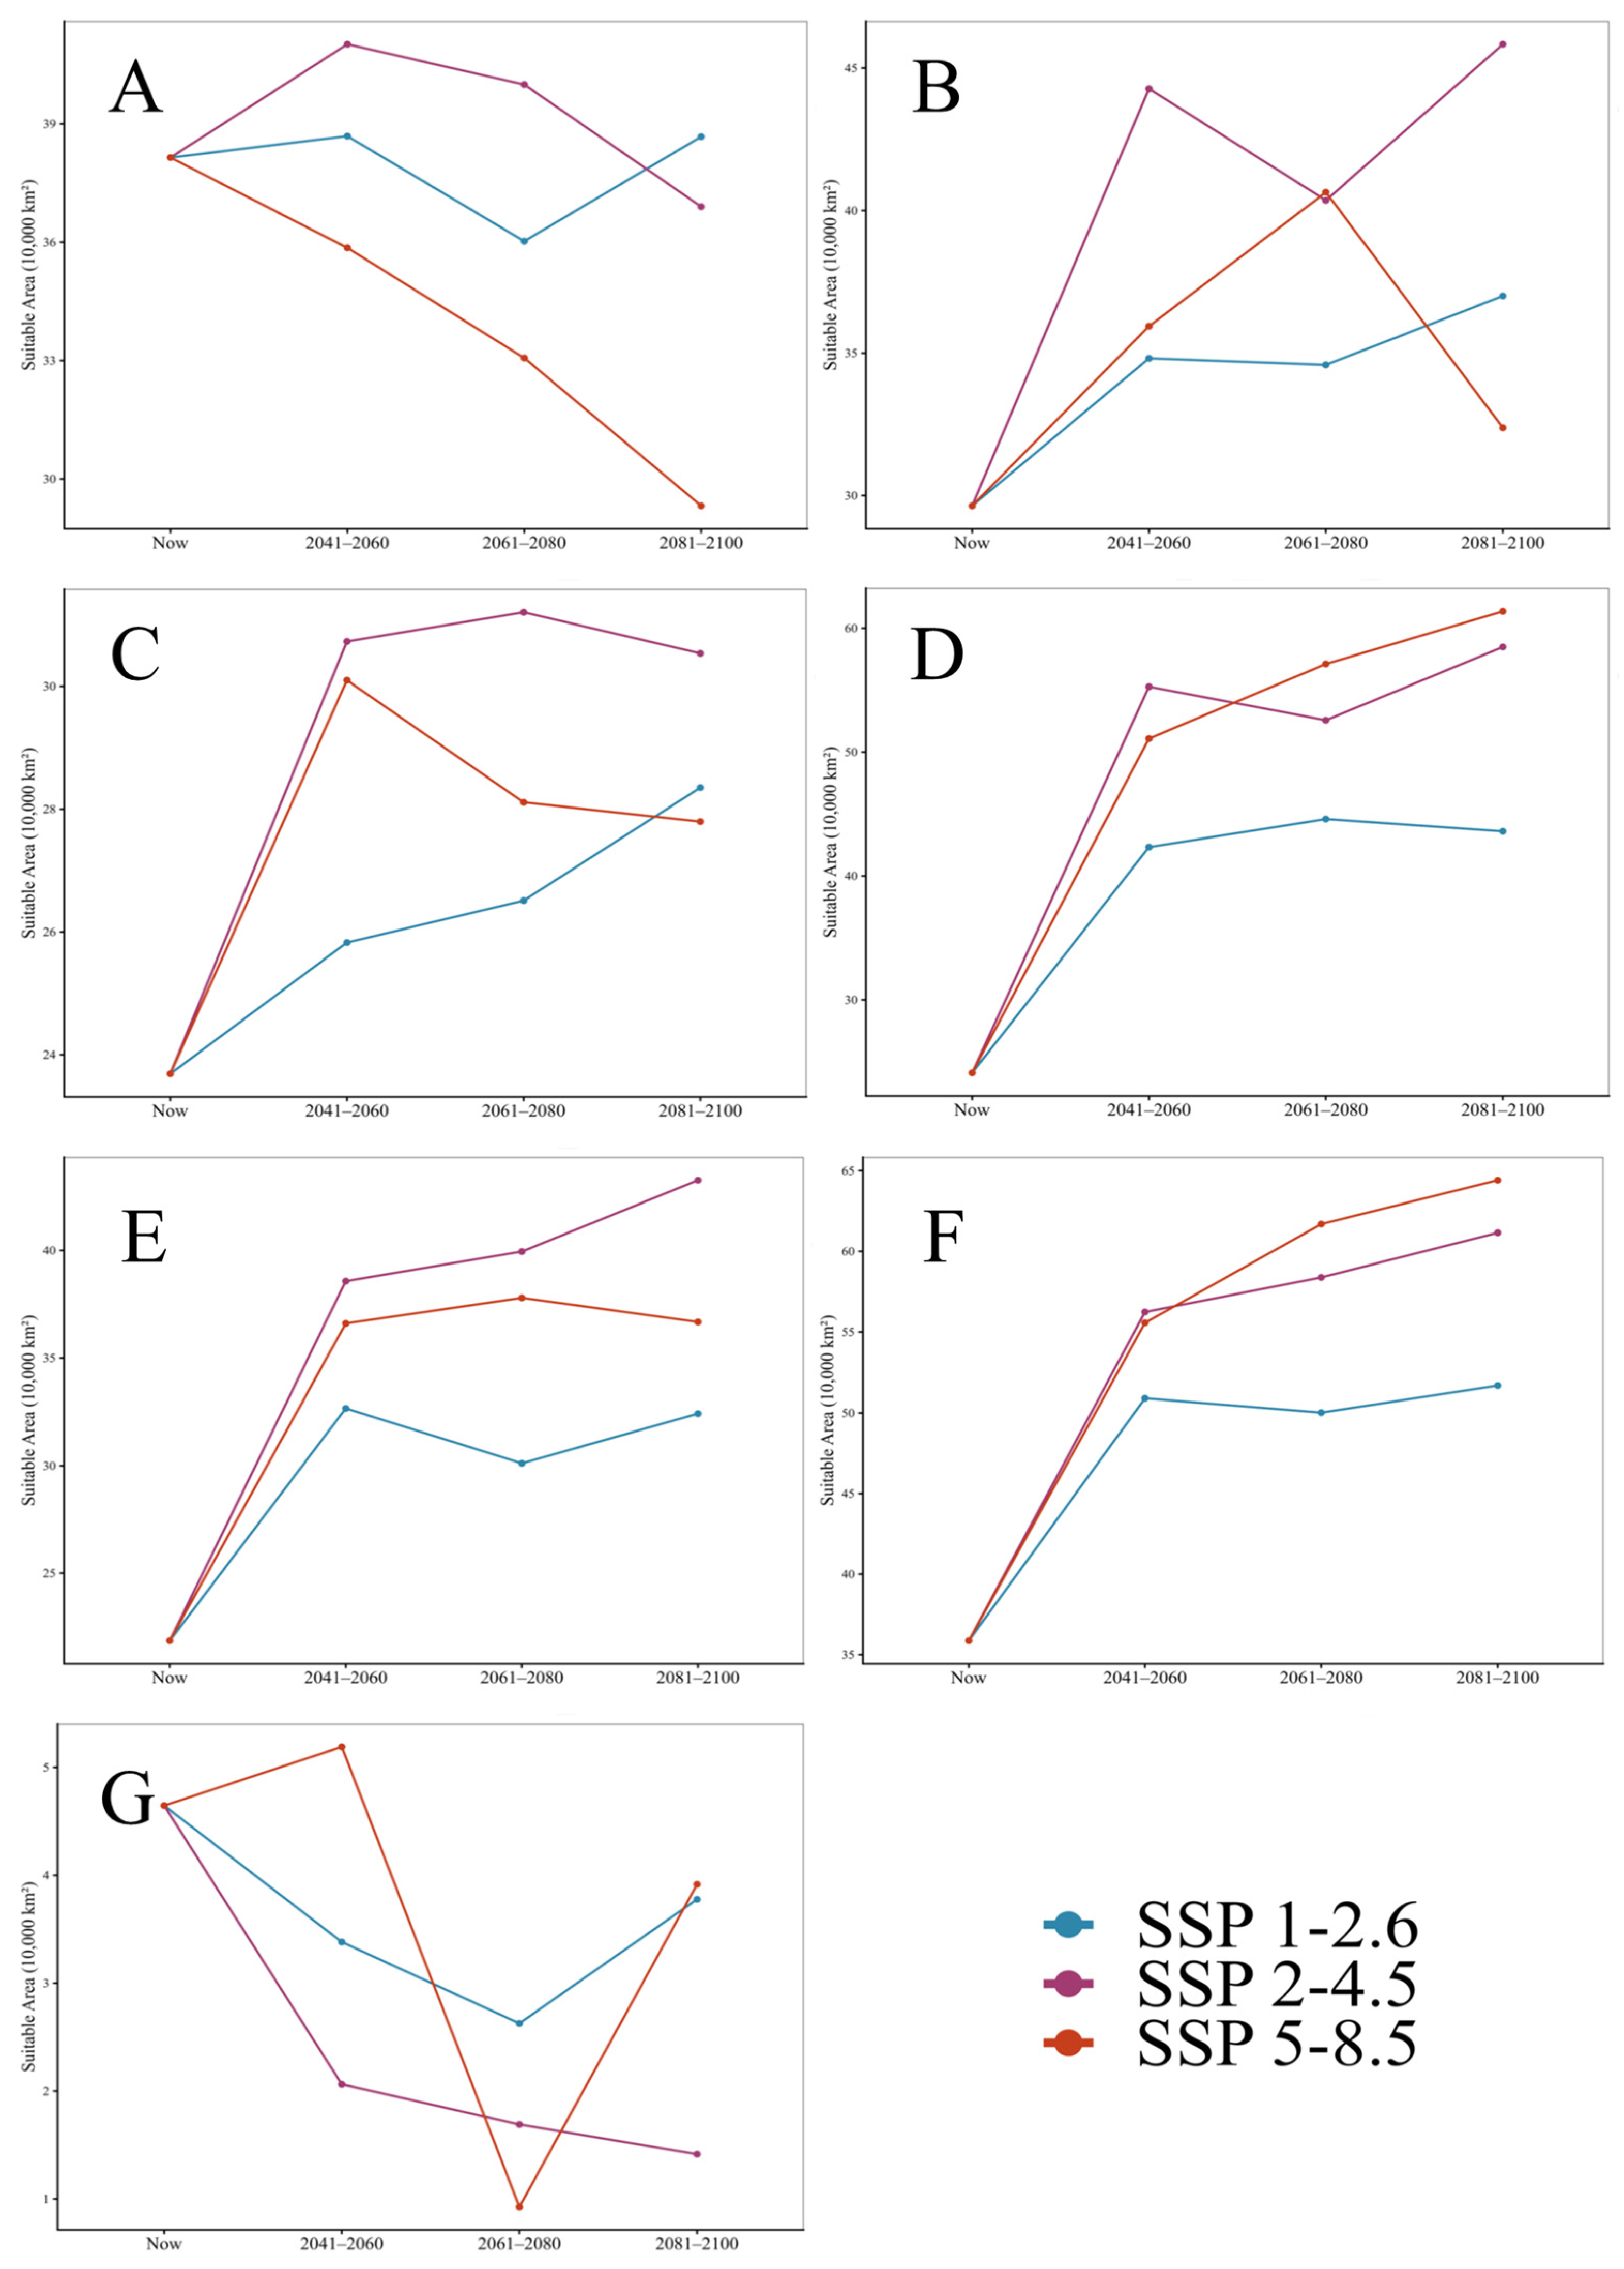
Projected responses to future climate scenarios were strongly species- and scenario-dependent (Figure 6). Three main response types were identified in this study.
Expansion: F. tinnunculus, F. peregrinus, and F. subbuteo showed net increases in the total suitable area across all scenarios. Under SSP5-8.5 (2081–2100), F. peregrinus expanded to 61.35 × 10⁴ km2 (+154.6%) and F. tinnunculus to 64.42 × 10⁴ km2 (+79.5%) relative to current levels. Both also exhibited substantial increases in the high-suitability area (e.g., F. tinnunculus high-suitability +621% under SSP5-8.5).
Fluctuation/variable response: F. columbarius and F. naumanni showed moderate scenario-dependent changes in abundance. F. columbarius peaked under SSP2-4.5 (45.83 × 10⁴ km2; +54.7%) but declined under late SSP5-8.5. F. naumanni experienced limited expansion (maximum +30.5%) with negligible gains in the core high-suitability area.
Declines: F. vespertinus, and under high emissions, F. cherrug exhibited a strong decline. F. vespertinus declined by 81.1% under SSP5-8.5 (to 0.88 × 10⁴ km2 by 2081–2100), with a near loss of highly suitable habitat. F. cherrug showed progressive contraction under SSP5-8.5 (total suitable area decreasing over time).
Scenario effects were pronounced: the high-emission SSP5-8.5 scenario amplified habitat gains in species showing projected expansion and habitat losses in species showing projected contraction, whereas SSP2-4.5 produced comparatively moderate, more stable outcomes for several species. SSP1-2.6 produced the least change but did not fully reverse the decline in the most vulnerable species.

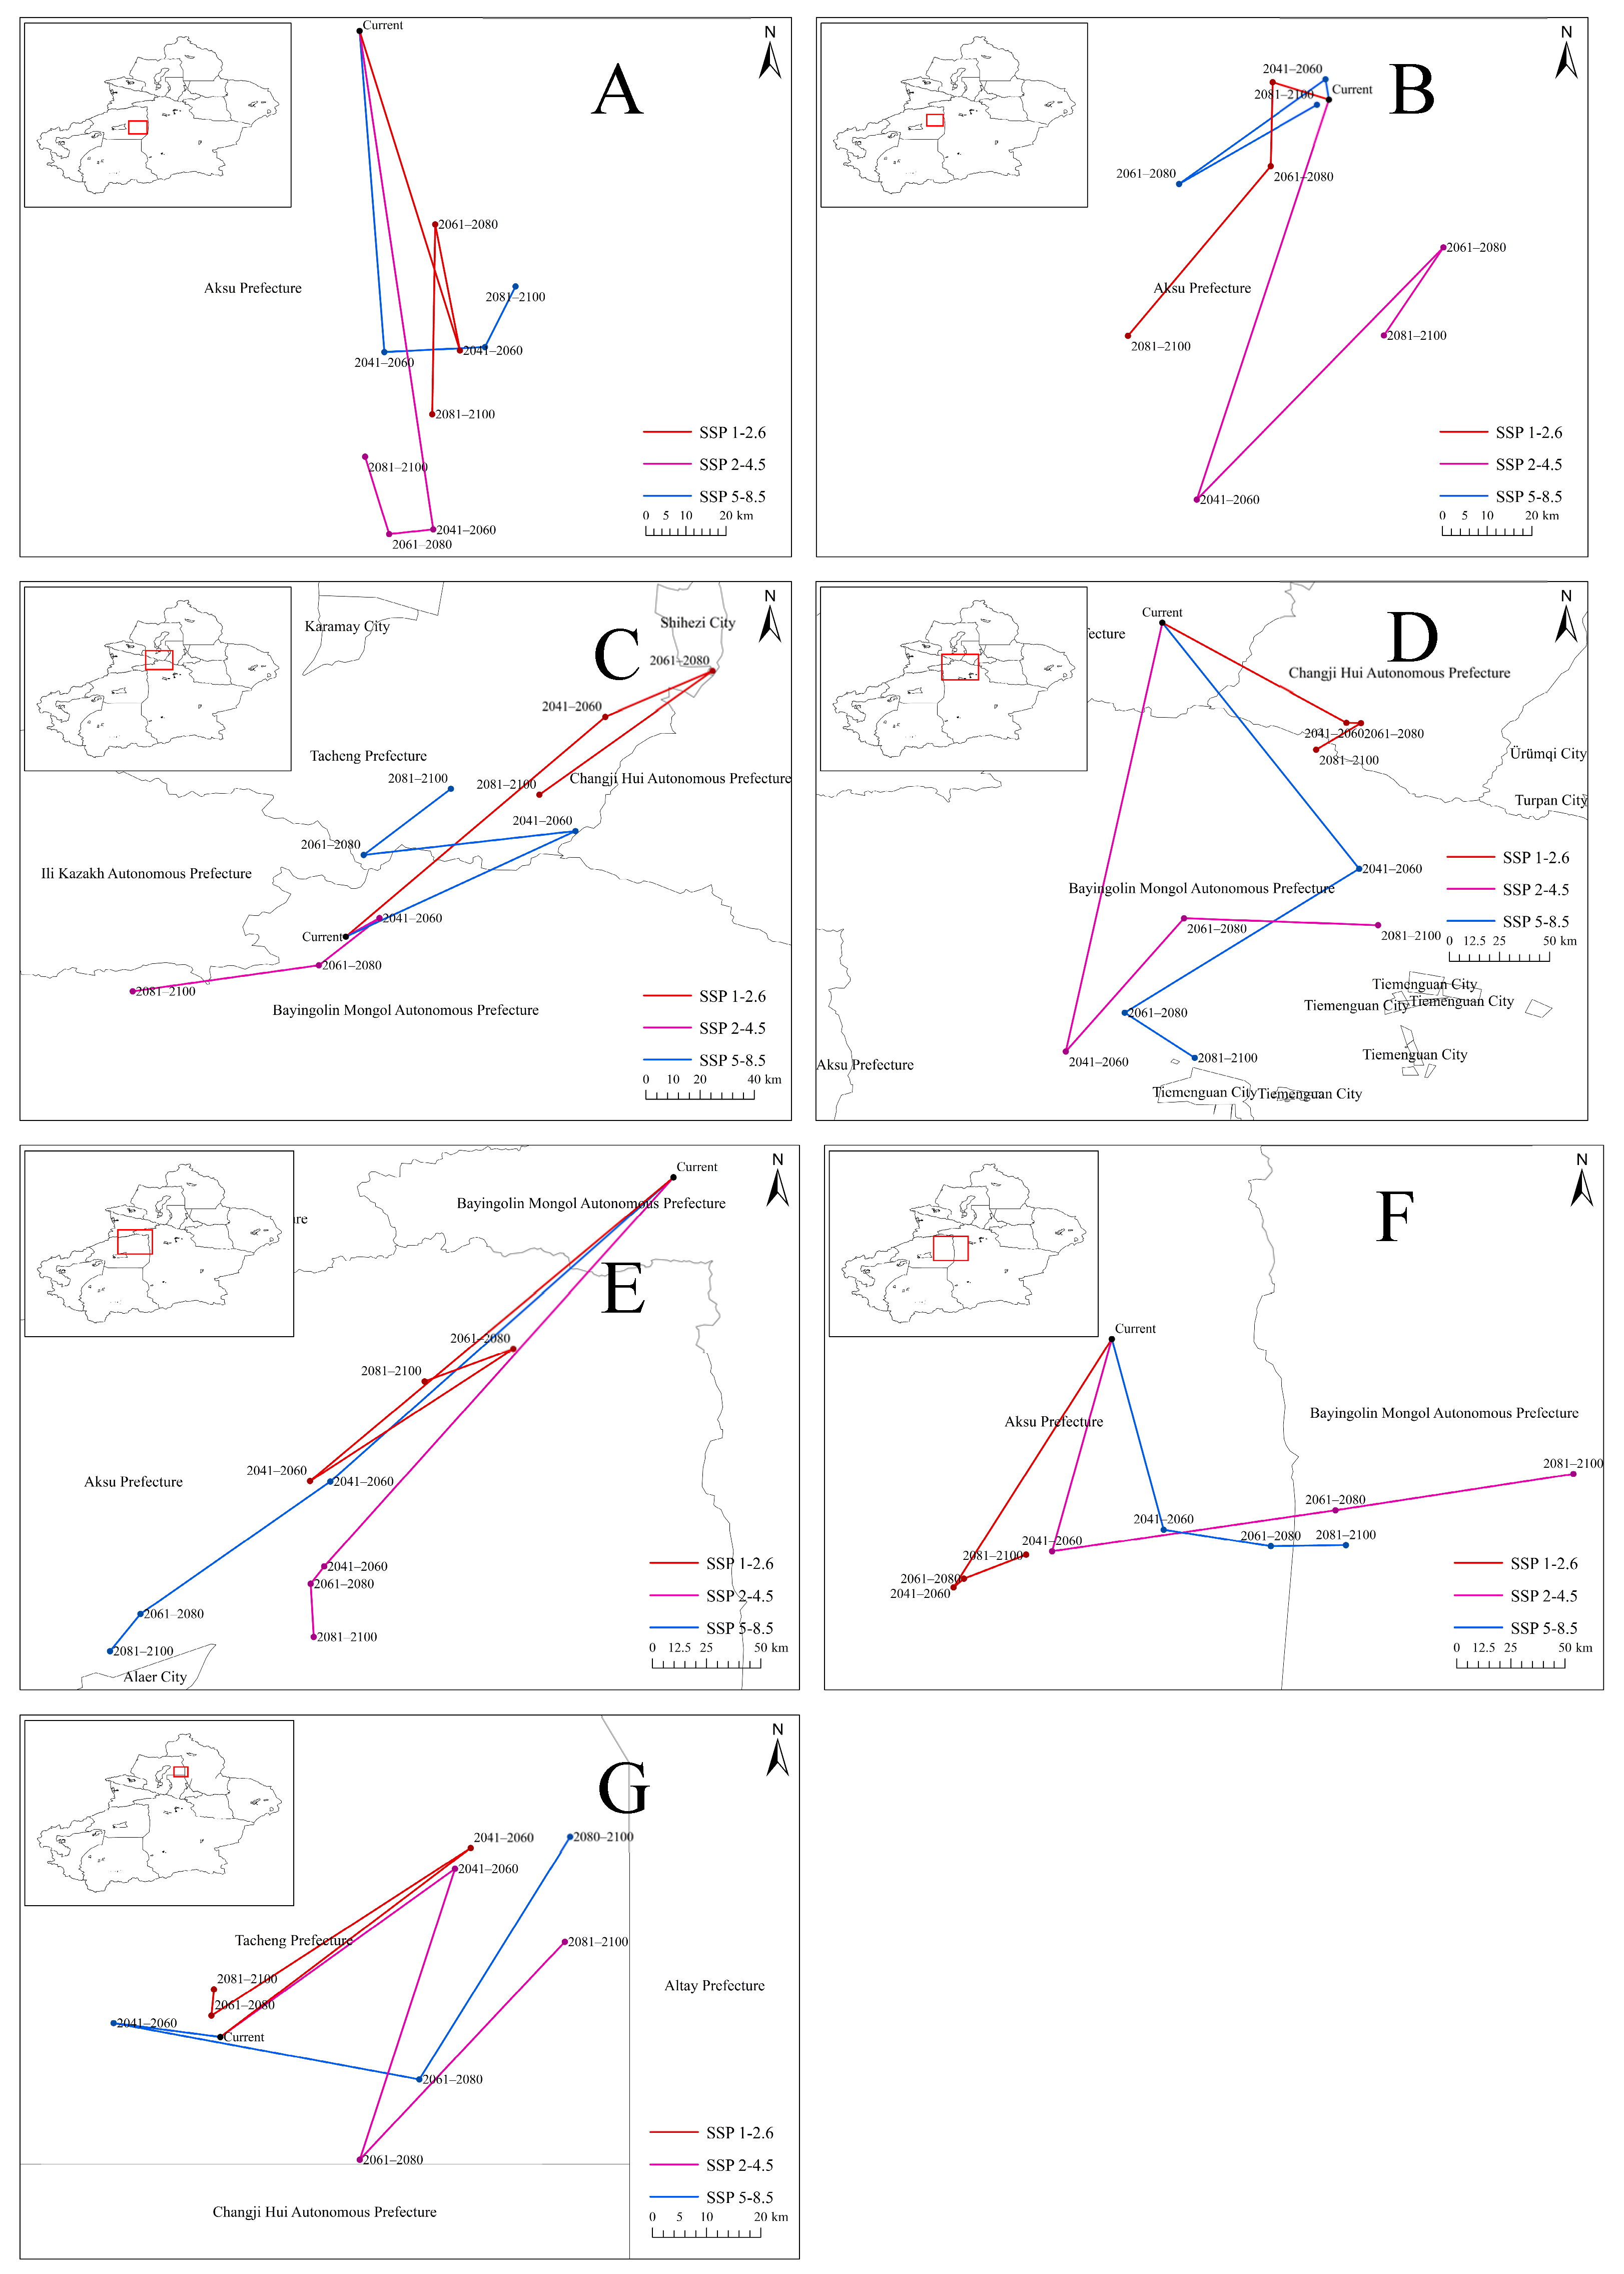
3.7. Barycenter Migration Trends

Across future climate scenarios (SSP1-2.6, SSP2-4.5, and SSP5-8.5) and periods (2041–2060, 2061–2080, and 2081–2100), the barycenters of suitable habitats for all seven falconid species shifted markedly; however, the direction, magnitude, and elevational response of these shifts differed substantially among species and scenarios (Figure 7). Among them, Falco subbuteo showed the strongest directional consistency, with barycenters shifting southwestward (211–223°) in all scenarios and time periods. The shift distance increased with emission intensity and time, reaching 291.89 km under SSP5-8.5 in 2081–2100, whereas centroid elevation declined continuously by 767–1458 m, indicating an increasing tendency toward lower-elevation southwestern areas. In contrast, F. peregrinus showed the strongest scenario dependence. Under SSP1-2.6, its barycenter shifted steadily southeastward (83–88 km) with substantial elevational increases (+954 to +1794 m), whereas under SSP2-4.5 and SSP5-8.5, both horizontal and vertical responses became more complex, including long-distance southward shifts and stage-dependent reversals in elevation trends. Under SSP5-8.5, centroid elevation increased during 2041–2080 (+1056 to +1097 m) but declined in 2081–2100 (−474 m), accompanied by a pronounced southward shift of 216.90 km.
Compared with these strongly shifting species, F. tinnunculus was characterized mainly by medium-distance horizontal redistribution (90–172 km), with the migration direction gradually changing from southward to southeastward or eastward in later periods and only weak elevational variation. In contrast, F. vespertinus showed the shortest barycenter displacement, with shifts of less than 60 km in most periods, variable directions among the northeast, north, and east, and only minor elevational changes. F. cherrug and F. columbarius also exhibited relatively limited spatial adjustments, with horizontal shifts of 50–125 km and 2–92 km, respectively, and only slight elevational fluctuations. F. naumanni differed from the other species by predominantly combining northeastward shifts of moderate distance with strong, stage-dependent elevational declines. Under SSP1-2.6, its barycenter moved continuously northeastward (74–139 km) while elevation dropped sharply by 656–2867 m; under SSP2-4.5, shift magnitude decreased and direction turned southwestward or westward, while elevation continued to decline (−533 to −848 m); under SSP5-8.5, northeastward movement again predominated and was generally accompanied by elevation loss (−317 to −1124 m), except for a temporary northward shift and slight elevational increase (+239 m) during 2061–2080. For several species, barycenter displacement increased under higher-emission scenarios and in later periods.

4. Discussion

4.1. Main Environmental Drives of Falconid Habitat Suitability

LUCC emerged as a dominant predictor for six species, indicating a close association between falconid habitat suitability and landscape composition in Xinjiang. Artificial surfaces, cropland, wetlands, and water-associated landscapes may provide prey resources, foraging opportunities, perching structures, or nesting substrates for some falconid species [91,92,93,94]. However, the comparatively high predicted suitability associated with artificial surfaces should be interpreted cautiously. Occurrence records may be concentrated near roads, settlements, and other accessible locations, and spatial thinning reduces local clustering but does not fully account for uneven observation effort. Therefore, the observed LUCC associations should be treated as ecological hypotheses requiring validation through target-group background sampling, bias surfaces, independent field surveys, or other explicit sampling-bias correction approaches. The threshold-like increase in suitability above an NDVI value of approximately 0.2 suggests that a minimum level of vegetation cover may be required to sustain prey availability and stable falconid activity [95,96]. The subsequent decline at high NDVI values for several species may reflect reduced hunting efficiency in dense vegetation, whereas the different response of F. naumanni may be associated with broader use of productive grassland or agricultural mosaic habitats. These contrasting response shapes emphasize that vegetation cover affects falconid species through species-specific foraging and habitat-use strategies rather than through a uniform positive relationship.
The species-specific responses to BIO19 and BIO15 indicate differences in tolerance to winter moisture availability and precipitation seasonality [97,98]. Moderate winter precipitation may improve vegetation conditions and prey availability, whereas excessive precipitation, rainfall, or snow cover may reduce prey accessibility and hunting efficiency. The strong decline in the predicted suitability of F. vespertinus under increasing precipitation seasonality suggests that this species may be particularly sensitive to unstable moisture regimes.
Taken together, the contributions of LUCC, NDVI, and precipitation variables indicate that falconid distributions in Xinjiang are jointly constrained by climatic conditions and landscape structure rather than by climate alone. This result supports the inclusion of both climatic and non-climatic predictors when modeling raptor distributions in arid and semi-arid landscapes.

4.2. Spatial Patterns and Future Fluctuations in Suitable Habitat

Current suitable habitats display a pronounced “mountain-valley” aggregation: medium-high suitability is concentrated along river corridors on the southern slope of the Altai Mountains, central-western Tianshan Mountains, and northern Kunlun foothills, whereas low suitability dominates the Junggar and Tarim basin interiors. This pattern reflects the hydrothermal gradients imposed by Xinjiang’s “three mountains with two basins” topography: elevational changes create spatial heterogeneity in temperature and precipitation, which drive vegetation patterns and prey distributions, producing more favorable conditions in piedmont oases and river valleys. These findings support the prioritization of conservation efforts in piedmont and riverine corridors, particularly the Altai-Northern Tianshan interface and the Kunlun foothills, where core habitat and connectivity are most critical [99,100,101].
Future projections reveal divergent and species-specific trajectories for these species. Under most scenarios, 60% of the modeled species (e.g., F. tinnunculus and F. peregrinus) showed net habitat expansion, while others (notably F. vespertinus and F. cherrug) were projected to contract, with F. vespertinus being particularly vulnerable under high-emission scenarios (SSP5-8.5). These contrasting responses likely reflect differences in ecological tolerance, life history, and habitat specialization. Some falconids appear capable of exploiting newly favorable areas under warming and humidification, whereas others are confined to narrower climatic envelopes or habitat dependencies. Scenario sensitivity was evident: SSP2-4.5 produced relatively moderate changes for most species, whereas SSP5-8.5 amplified losses for the sensitive taxa. Consequently, contraction-prone species (e.g., F. vespertinus) and their core areas (e.g., the Irtysh River Basin) should be prioritized for targeted protection, and adaptive management should be tailored to species-specific physiology and ecology [102].

4.3. Conservation Gaps and Climate-Adaptive Conservation Priorities

The combined MaxEnt-InVEST-protected-area overlay revealed clear conservation gaps for Falconidae species in Xinjiang. Large areas of predicted suitable habitat occurred outside the current protected-area network, especially for F. tinnunculus, F. cherrug, F. columbarius and F. peregrinus. These findings demonstrate that the existing protected-area network does not fully represent the suitable habitats of Falconidae in Xinjiang, particularly where unprotected suitable habitats coincide with high habitat quality or elevated degradation risk. Conservation planning should therefore distinguish among priority protection gaps, degradation-control gaps, and restoration or field-validation gaps rather than treating all unprotected suitable habitats as equivalent. Such a gap-analysis perspective is central to systematic conservation planning, which aims to assess the representativeness of existing protected areas and identify additional areas needed to meet conservation objectives [37,38].
Unprotected suitable habitats with high relative habitat quality represent priority conservation gaps. These areas were most extensive for F. cherrug, F. columbarius and F. tinnunculus, indicating that they should be prioritized for protected-area expansion, ECRs (ecological conservation redlines, which are designated areas in China with critical ecological functions or high ecological sensitivity, established to safeguard ecological security and biodiversity), other effective area-based conservation measures or targeted habitat management. In contrast, unprotected suitable habitats with high degradation risk should be treated as degradation-control gaps, where disturbance reduction, infrastructure regulation and habitat management are needed. This interpretation is consistent with the logic of the InVEST Habitat Quality model, which evaluates habitat condition by combining land-use/land-cover information with threat sources and habitat sensitivity [103]. Areas with low relative habitat quality should be interpreted cautiously as restoration or validation gaps, because they may represent either genuinely degraded habitats or open arid landscapes still used by falcons for foraging. Field validation is therefore important when model outputs are used to support conservation decisions [104].
These results also show that high MaxEnt suitability does not necessarily indicate high habitat quality. MaxEnt reflects environmental suitability based on climatic and environmental conditions associated with species occurrences, whereas InVEST estimates relative habitat quality from land cover, threat sources and habitat sensitivity [28,29]. Therefore, climatically suitable areas may still have low habitat quality or high degradation risk under strong human disturbance. Integrating both approaches helps distinguish environmental suitability, land-cover-based habitat condition and protection status, thereby reducing the risk of interpreting habitat suitability maps as direct measures of habitat quality [105,106]. The spatial juxtaposition of high relative habitat quality and elevated degradation risk, particularly along transportation corridors, further demonstrates that habitat condition and anthropogenic pressure are not spatially equivalent. Landscapes with favorable land-cover-based habitat conditions may still be exposed to substantial road, construction, or agricultural disturbance. This mismatch supports the joint use of habitat suitability, habitat quality, degradation risk, and protected-area coverage when identifying conservation priorities. The identified gaps are also relevant for climate-adaptive conservation. Because Falconidae species showed different projected habitat shifts, conservation strategies should be species-specific. Species with extensive current gaps and large high-quality unprotected habitats, such as F. cherrug, F. tinnunculus and F. columbarius, require immediate protection of current priority habitats and maintenance of future movement pathways. Species whose suitable habitats overlap strongly with degradation risk, such as F. peregrinus and F. subbuteo, require combined climate-refugia protection and disturbance management. For range-restricted species such as F. vespertinus, even small conservation gaps may increase vulnerability to fragmentation and future climate change. These strategies are consistent with climate-integrated conservation approaches that emphasize protected-area adjustment, connectivity maintenance and management of multiple threats under climate change [107,108].

4.4. Projected Barycenter Shifts and Conservation Implications

All seven species exhibited significant barycenter shifts under future scenarios; however, the directions, distances, and elevational responses varied among species and scenarios. Five species (F. subbuteo, F. peregrinus, F. tinnunculus, F. cherrug, F. columbarius) generally shifted southwestward or southward in many scenarios, whereas F. vespertinus and F. naumanni tended to shift northeastward or showed directional variability. Vertical responses were heterogeneous, with F. subbuteo, F. peregrinus, and F. naumanni showing pronounced elevational adjustments, although not uniformly upward or downward. These patterns align with the general expectations of poleward/upslope redistributions under warming but emphasize that responses are context- and species-dependent [109,110]. The limited elevational variation in F. tinnunculus suggests that its projected redistribution may be driven mainly by horizontal climatic gradients. By contrast, the small barycenter displacement of F. vespertinus, despite substantial habitat contraction, may reflect localized redistribution and increasing fragmentation rather than effective tracking of shifting climatic conditions. The greater displacement of several species under stronger emission scenarios further indicates that future habitat reorganization may extend beyond the capacity of static protected-area boundaries.
F. subbuteo displayed the most consistent southwestward and downslope shifts (elevational changes of −767 to −1458 m). This pattern likely reflects its strong sensitivity to temperature seasonality (BIO3:12.9% contribution) and warmer quarter temperatures (BIO10:3.5% contribution) (Table 5), suggesting a preference shift toward lower-elevation, warmer/humidifying habitats as these conditions expand or become more favorable in those areas. F. peregrinus showed more complex dynamics, including a reversal from an elevational increase to a decline under late SSP5-8.5, indicating nonlinear responses to intensifying climate stressors. Species with limited barycenter movement (e.g., F. vespertinus < 60 km in most periods) are likely to experience local fragmentation and range contraction, increasing the extinction risk owing to isolation. Under the SSP5-8.5 (high-emission) scenario, climate-induced changes in temperature and precipitation may, over time, exceed the survival tolerance thresholds of some species, thereby exerting significant pressure on their persistence and resulting in a substantial loss of suitable habitat. [111,112,113].
Migration distances increased with emission intensity and time, with maximum shifts (e.g., F. subbuteo ~292 km) that, while within the dispersal capacity of many raptors, may be constrained by landscape connectivity, barriers, and availability of stepping-stone habitats. Conservation planning should therefore be dynamic and species-specific: establish cross-regional ecological corridors for long-distance shifting species (F. subbuteo and F. naumanni), particularly focusing on connecting piedmont oases and river valleys in the central-western Tianshan and northern Kunlun foothills, which serve as crucial current and projected future habitat clusters. For fragmentation-prone species such as F. vespertinus, which faces substantial declines and localized shifts, strengthening the protection and habitat quality of the remaining core patches, particularly in the Irtysh River Basin, where its current high-suitability areas are concentrated (Figure 3G) and are projected to face significant contraction, is necessary, as is evaluating the protection value across elevational gradients for species with complex vertical responses (F. peregrinus). Maintaining and restoring habitat connectivity, particularly along predicted migration trajectories and riverine corridors, is essential for facilitating climate-driven range adjustments [8].

4.5. Limitations and Future Research

Several uncertainties should be considered when interpreting the results. First, future projections were based on a single global climate model, BCC-CSM2-MR, and a single future LUCC dataset. The ten MaxEnt replicates quantified internal model variability but did not represent uncertainty among alternative climate models or land-use projections. Second, MaxEnt outputs may have been affected by uneven occurrence-record sampling, predictor selection, and threshold choice. Spatial thinning reduced local clustering but did not fully account for spatial variation in observation effort. Third, the InVEST Habitat Quality model provides a relative land-cover-based index and does not explicitly represent prey availability, nesting-site availability, species-specific disturbance tolerance, or fine-scale habitat conditions [41,114]. Finally, protected-area overlap measures spatial representation rather than management effectiveness. Future studies should incorporate multi-model climate ensembles, alternative LUCC projections, explicit sampling-bias correction, connectivity and demographic models, and independent field or telemetry data to quantify uncertainty and validate the projected habitat changes.

5. Conclusions

Using 2731 occurrence records, 26 environmental predictors, and an optimized MaxEnt framework, we assessed current and future habitat suitability for seven falconid species in Xinjiang. Suitable habitats were mainly concentrated in piedmont oases, river valleys, and mountain foothills. Future responses were strongly species-specific: Falco tinnunculus, F. peregrinus, and F. subbuteo generally showed habitat expansion or persistence, whereas F. vespertinus and F. cherrug were projected to decline, particularly under high-emission scenarios. All species exhibited shifts in suitable-habitat barycenters, although the direction, distance, and elevational response varied among species and scenarios.
Integrating MaxEnt predictions with InVEST-based habitat quality, degradation risk, and protected-area overlays showed that environmental suitability did not necessarily correspond to favorable habitat condition or adequate protection. Extensive suitable habitats occurred outside protected areas, including high-quality priority gaps and areas exposed to substantial degradation risk. Conservation planning should therefore adopt species-specific and climate-adaptive strategies that protect high-quality unprotected habitats, reduce disturbance in threatened areas, restore or validate low-quality suitable habitats, and maintain landscape connectivity. Future studies should incorporate multiple climate and land-use projections, connectivity and demographic models, and independent movement or monitoring data to improve projection robustness.

Supplementary Materials

The following supporting information can be downloaded at: https://www.mdpi.com/article/10.3390/ani16172650/s1.

Author Contributions

Conceptualization, F.X.; methodology, S.W., N.L. and F.X.; software, S.W. and X.M.; validation, S.W.; formal analysis, S.W., X.M., N.L. and F.X.; investigation, S.W., X.M., J.L., H.L., X.J., X.Z., Y.Z. and F.X.; resources, J.L., H.L., X.J., X.Z. and Y.Z.; data curation, S.W.; writing—original draft, S.W., X.M., N.L. and F.X.; writing—review & editing, S.W., X.M., J.L., H.L., X.J., X.Z., Y.Z., N.L. and F.X.; visualization, N.L.; supervision, F.X.; project administration, F.X.; funding acquisition, F.X. All authors have read and agreed to the published version of the manuscript.

Funding

This study was supported by the China Biodiversity Observation Network (Sino-BON).

Institutional Review Board Statement

All field surveys were conducted using non-invasive observational methods and did not involve the capture, handling, or disturbance of birds. Therefore, no specific animal ethical approval was required.

Informed Consent Statement

Not applicable.

Data Availability Statement

The raw data supporting the conclusions of this article will be made available by the authors on request.

Acknowledgments

We thank Xiaolong Li, Hongkui Zhang, and Honggang Bao for help with the field work.

Conflicts of Interest

The authors declare no conflicts of interest.

References

  1. Laland, K.; Odling-Smee, J.; Endler, J. Niche Construction, Sources of Selection and Trait Coevolution. Interface Focus 2017, 7, 20160147. [Google Scholar] [CrossRef] [Scilit] [PubMed]
  2. Armstrong, A. Biodiversity. Nature 2017, 546, 47. [Google Scholar] [CrossRef] [Scilit] [PubMed]
  3. Rands, M.R.W.; Adams, W.M.; Bennun, L.; Butchart, S.H.M.; Clements, A.; Coomes, D.; Entwistle, A.; Hodge, I.; Kapos, V.; Scharlemann, J.P.W.; et al. Biodiversity Conservation: Challenges Beyond 2010. Science 2010, 329, 1298–1303. [Google Scholar] [CrossRef] [Scilit] [PubMed]
  4. Chen, J.; Zhang, B.W.; Ma, K.P.; Jiang, Z.G. Bibliometric Analysis of Status Quo of Conservation Biology in China. Biodivers. Sci. 2009, 17, 423. [Google Scholar] [CrossRef] [Scilit]
  5. Keck, F.; Peller, T.; Alther, R.; Barouillet, C.; Blackman, R.; Capo, E.; Chonova, T.; Couton, M.; Fehlinger, L.; Kirschner, D.; et al. The Global Human Impact on Biodiversity. Nature 2025, 641, 395–400. [Google Scholar] [CrossRef] [Scilit] [PubMed]
  6. Jiang, Z.G.; Ma, K.P. Status quo, challenges and strategy in Conservation Biology. Biodivers. Sci. 2009, 17, 107–116. [Google Scholar] [CrossRef] [Scilit]
  7. Engler, J.O.; Stiels, D.; Schidelko, K.; Strubbe, D.; Quillfeldt, P.; Brambilla, M. Avian SDMs: Current State, Challenges, and Opportunities. J. Avian Biol. 2017, 48, 1483–1504. [Google Scholar] [CrossRef] [Scilit]
  8. Liang, J.; Peng, Y.; Zhu, Z.; Li, X.; Xing, W.; Li, X.; Yan, M.; Yuan, Y. Impacts of Changing Climate on the Distribution of Migratory Birds in China: Habitat Change and Population Centroid Shift. Ecol. Indic. 2021, 127, 107729. [Google Scholar] [CrossRef] [Scilit]
  9. Chen, L.; Liu, C.; Cheng, Y.; Yu, G.; Sun, G.; Zhu, L.; Jiang, H.; Liu, Y. The Influence of Climate Change on the Autumn Migration Timing of Three Common Migratory Raptors in East Asia. Glob. Ecol. Conserv. 2025, 59, e03578. [Google Scholar] [CrossRef] [Scilit]
  10. McClure, C.J.W.; Westrip, J.R.S.; Johnson, J.A.; Schulwitz, S.E.; Virani, M.Z.; Davies, R.; Symes, A.; Wheatley, H.; Thorstrom, R.; Amar, A.; et al. State of the World’s Raptors: Distributions, Threats, and Conservation Recommendations. Biol. Conserv. 2018, 227, 390–402. [Google Scholar] [CrossRef] [Scilit]
  11. O’Bryan, C.J.; Allan, J.R.; Suarez-Castro, A.F.; Delsen, D.M.; Buij, R.; McClure, C.J.W.; Rehbein, J.A.; Virani, M.Z.; McCabe, J.D.; Tyrrell, P.; et al. Human Impacts on the World’s Raptors. Front. Ecol. Evol. 2022, 10, 624896. [Google Scholar] [CrossRef] [Scilit]
  12. Kassara, C.; Gangoso, L.; Mellone, U.; Piasevoli, G.; Hadjikyriakou, T.G.; Tsiopelas, N.; Giokas, S.; López-López, P.; Urios, V.; Figuerola, J.; et al. Current and Future Suitability of Wintering Grounds for a Long-Distance Migratory Raptor. Sci. Rep. 2017, 7, 8798. [Google Scholar] [CrossRef] [Scilit] [PubMed]
  13. Sutton, L.J.; Puschendorf, R. Climatic Niche of the Saker Falcon Falco Cherrug: Predicted New Areas to Direct Population Surveys in Central Asia. Ibis 2020, 162, 27–41. [Google Scholar] [CrossRef] [Scilit]
  14. Ooi, B.Y.; Kéry, M.; Percival, R.; Lee, Z.H.; Chiu, S.C. A Population Study of Tropical Peregrine Falcons (Falco Peregrinus Ernesti) in West Malaysia. Ornis Hung. 2020, 28, 11–27. [Google Scholar] [CrossRef] [Scilit]
  15. Syartinilia; Condro, A.A.; Tsuyuki, S. Projected Impacts of Climate Change and Anthropogenic Effects on Habitat Distribution of Endangered Javan Hawk-Eagle in Indonesia. Geogr. Sustain. 2024, 5, 241–250. [Google Scholar] [CrossRef] [Scilit]
  16. Hu, L.; Long, J.; Lin, Y.; Gu, Z.; Su, H.; Dong, X.; Lin, Z.; Xiao, Q.; Batbayar, N.; Bold, B.; et al. Arctic Introgression and Chromatin Regulation Facilitated Rapid Qinghai-Tibet Plateau Colonization by an Avian Predator. Nat. Commun. 2022, 13, 6413. [Google Scholar] [CrossRef] [Scilit] [PubMed]
  17. Huang, J.; Guan, X.; Ji, F. Enhanced Cold-Season Warming in Semi-Arid Regions. Atmos. Chem. Phys. 2012, 12, 5391–5398. [Google Scholar] [CrossRef] [Scilit]
  18. He, J.Y.; Zhang, M.J.; Wang, P.; Xin, H.; Huang, X.Y. New Progress of the Study on Climate Change in Xinjiang. Arid Zone Res. 2011, 28, 499–508. [Google Scholar] [CrossRef]
  19. Li, L.P.; Yin, L.K.; Tang, Z.Y. Distribution Patterns of the Species Richness of Plants and Animals in Xinjiang, China. Arid Zone Res. 2011, 28, 1–9. [Google Scholar] [CrossRef]
  20. Long, C.Y.; Wan, H.W.; Li, L.P.; Wang, J.D. Spatial Patterns and Correlations in the Richness of Bird and Mammal Species and Environmental Factors in Xinjiang, China. Natl. Remote Sens. Bull. 2019, 23, 155–165. [Google Scholar] [CrossRef] [Scilit]
  21. Li, N.; Ding, C.; Cao, D.; Chu, H.; Qi, Y.; Li, C.; Ping, X.; Sun, Y.; Jiang, Z. Avian Species Census, Richness Patterns and Faunal Composition in the Altay Region, China. Biodivers. Sci. 2020, 28, 401–411. [Google Scholar] [CrossRef] [Scilit]
  22. Araújo, M.B.; Peterson, A.T. Uses and Misuses of Bioclimatic Envelope Modeling. Ecology 2012, 93, 1527–1539. [Google Scholar] [CrossRef] [Scilit] [PubMed]
  23. Marcelino, J.; Silva, J.P.; Gameiro, J.; Silva, A.; Rego, F.C.; Moreira, F.; Catry, I. Extreme Events Are More Likely to Affect the Breeding Success of Lesser Kestrels than Average Climate Change. Sci. Rep. 2020, 10, 7207. [Google Scholar] [CrossRef] [Scilit] [PubMed]
  24. Galipeau, P.; Franke, A.; Leblond, M.; Bêty, J. Multi-Scale Selection Models Predict Breeding Habitat for Two Arctic-Breeding Raptor Species. Arct. Sci. 2020, 6, 24–40. [Google Scholar] [CrossRef] [Scilit]
  25. Rodríguez, C.; Tapia, L.; Ribeiro, E.; Bustamante, J. Crop Vegetation Structure Is More Important than Crop Type in Determining Where Lesser Kestrels Forage. Bird Conserv. Int. 2014, 24, 438–452. [Google Scholar] [CrossRef] [Scilit]
  26. Cioccarelli, S.; Terras, A.; Assandri, G.; Berlusconi, A.; Grattini, N.; Mercogliano, A.; Pazhera, A.; Sbrilli, A.; Cecere, J.G.; Rubolini, D.; et al. Vegetation Height and Structure Drive Foraging Habitat Selection of the Lesser Kestrel (Falco naumanni) in Intensive Agricultural Landscapes. PeerJ 2022, 10, e13979. [Google Scholar] [CrossRef] [Scilit] [PubMed]
  27. Dixon, A.; Li, X.; Rahman, M.L.; Batbayar, N.; Zhan, X. Characteristics of Home Range Areas Used by Saker Falcons (Falco cherrug) Wintering on the Qinghai-Tibetan Plateau. Bird Conserv. Int. 2017, 27, 525–536. [Google Scholar] [CrossRef] [Scilit]
  28. Phillips, S.J.; Anderson, R.P.; Schapire, R.E. Maximum Entropy Modeling of Species Geographic Distributions. Ecol. Model. 2006, 190, 231–259. [Google Scholar] [CrossRef] [Scilit]
  29. Elith, J.; Phillips, S.J.; Hastie, T.; Dudík, M.; Chee, Y.E.; Yates, C.J. A Statistical Explanation of MaxEnt for Ecologists: Statistical Explanation of MaxEnt. Divers. Distrib. 2011, 17, 43–57. [Google Scholar] [CrossRef] [Scilit]
  30. Muscarella, R.; Galante, P.J.; Soley-Guardia, M.; Boria, R.A.; Kass, J.M.; Uriarte, M.; Anderson, R.P. ENMeval: An R Package for Conducting Spatially Independent Evaluations and Estimating Optimal Model Complexity for Maxent Ecological Niche Models. Methods Ecol. Evol. 2014, 5, 1198–1205. [Google Scholar] [CrossRef] [Scilit]
  31. Warren, D.L.; Seifert, S.N. Ecological Niche Modeling in Maxent: The Importance of Model Complexity and the Performance of Model Selection Criteria. Ecol. Appl. 2011, 21, 335–342. [Google Scholar] [CrossRef] [Scilit] [PubMed]
  32. Huang, Q.; Bateman, B.L.; Michel, N.L.; Pidgeon, A.M.; Radeloff, V.C.; Heglund, P.; Allstadt, A.J.; Nowakowski, A.J.; Wong, J.; Sauer, J.R. Modeled Distribution Shifts of North American Birds over Four Decades Based on Suitable Climate Alone Do Not Predict Observed Shifts. Sci. Total Environ. 2023, 857, 159603. [Google Scholar] [CrossRef] [Scilit] [PubMed]
  33. Newbold, T.; Hudson, L.N.; Hill, S.L.L.; Contu, S.; Lysenko, I.; Senior, R.A.; Börger, L.; Bennett, D.J.; Choimes, A.; Collen, B.; et al. Global Effects of Land Use on Local Terrestrial Biodiversity. Nature 2015, 520, 45–50. [Google Scholar] [CrossRef] [Scilit] [PubMed]
  34. Jeong, A.; Kim, M.; Lee, S. Analysis of Priority Conservation Areas Using Habitat Quality Models and MaxEnt Models. Animals 2024, 14, 1680. [Google Scholar] [CrossRef] [Scilit] [PubMed]
  35. Terrado, M.; Sabater, S.; Chaplin-Kramer, B.; Mandle, L.; Ziv, G.; Acuña, V. Model Development for the Assessment of Terrestrial and Aquatic Habitat Quality in Conservation Planning. Sci. Total Environ. 2016, 540, 63–70. [Google Scholar] [CrossRef] [Scilit] [PubMed]
  36. Titeux, N.; Aizpurua, O.; Hollander, F.A.; Sardà-Palomera, F.; Hermoso, V.; Paquet, J.-Y.; Mestdagh, X.; Settele, J.; Brotons, L.; Van Dyck, H. Ecological Traps and Species Distribution Models: A Challenge for Prioritizing Areas of Conservation Importance. Ecography 2020, 43, 365–375. [Google Scholar] [CrossRef] [Scilit]
  37. Margules, C.R.; Pressey, R.L. Systematic Conservation Planning. Nature 2000, 405, 243–253. [Google Scholar] [CrossRef] [Scilit] [PubMed]
  38. Rodrigues, A.S.L.; Andelman, S.J.; Bakarr, M.I.; Boitani, L.; Brooks, T.M.; Cowling, R.M.; Fishpool, L.D.C.; da Fonseca, G.A.B.; Gaston, K.J.; Hoffmann, M.; et al. Effectiveness of the Global Protected Area Network in Representing Species Diversity. Nature 2004, 428, 641–643. [Google Scholar] [CrossRef] [Scilit] [PubMed]
  39. Rodrigues, A.S.L.; Akçakaya, H.R.; Andelman, S.J.; Bakarr, M.I.; Boitani, L.; Brooks, T.M.; Chanson, J.S.; Fishpool, L.D.C.; Da Fonseca, G.A.B.; Gaston, K.J.; et al. Global Gap Analysis: Priority Regions for Expanding the Global Protected-Area Network. Bioscience 2004, 54, 1092–1100. [Google Scholar] [CrossRef] [Scilit]
  40. Cruz, C.; Santulli-Sanzo, G.; Ceballos, G. Global Patterns of Raptor Distribution and Protected Areas Optimal Selection to Reduce the Extinction Crises. Proc. Natl. Acad. Sci. USA 2021, 118, e2018203118. [Google Scholar] [CrossRef] [Scilit] [PubMed]
  41. Kramer-Schadt, S.; Niedballa, J.; Pilgrim, J.D.; Schröder, B.; Lindenborn, J.; Reinfelder, V.; Stillfried, M.; Heckmann, I.; Scharf, A.K.; Augeri, D.M.; et al. The Importance of Correcting for Sampling Bias in MaxEnt Species Distribution Models. Divers. Distrib. 2013, 19, 1366–1379. [Google Scholar] [CrossRef] [Scilit]
  42. Radosavljevic, A.; Anderson, R.P. Making Better Maxent Models of Species Distributions: Complexity, Overfitting and Evaluation. J. Biogeogr. 2014, 41, 629–643. [Google Scholar] [CrossRef] [Scilit]
  43. Zhou, Y.; Li, Y.; Li, W.; Li, F.; Xin, Q. Ecological Responses to Climate Change and Human Activities in the Arid and Semi-Arid Regions of Xinjiang in China. Remote Sens. 2022, 14, 3911. [Google Scholar] [CrossRef] [Scilit]
  44. Yao, J.; Chen, Y.; Guan, X.; Zhao, Y.; Chen, J.; Mao, W. Recent Climate and Hydrological Changes in a Mountain—Basin System in Xinjiang, China. Earth Sci. Rev. 2022, 226, 103957. [Google Scholar] [CrossRef] [Scilit]
  45. Wang, S.; Zhang, M.; Hughes, C.E.; Zhu, X.; Dong, L.; Ren, Z.; Chen, F. Factors Controlling Stable Isotope Composition of Precipitation in Arid Conditions: An Observation Network in the Tianshan Mountains, Central Asia. Tellus B Chem. Phys. Meteorol. 2016, 68, 26206. [Google Scholar] [CrossRef] [Scilit]
  46. Zheng, G.M. A Checklist on the Classification and Distribution of the Birds of China, 4th ed.; Science Press: Beijing, China, 2023; ISBN 978-7-03-075416-5. [Google Scholar]
  47. Rosenberg, K.V.; Dokter, A.M.; Blancher, P.J.; Sauer, J.R.; Smith, A.C.; Smith, P.A.; Stanton, J.C.; Panjabi, A.; Helft, L.; Parr, M.; et al. Decline of the North American Avifauna. Science 2019, 366, 120–124. [Google Scholar] [CrossRef] [Scilit] [PubMed]
  48. Tian, X.; Liu, Z.; Zhang, Y.; Guo, S.; Wang, Y. Waterbird Diversity as an Indicator for Identifying Key Habitats in the Yangtze River Basin. Ecol. Indic. 2025, 179, 114230. [Google Scholar] [CrossRef] [Scilit]
  49. Li, C.; Shi, Q.; Zhang, Z.; Zhang, Y. Habitat Suitability Assessment and Ecological Network Construction for Shorebirds in Hainan Island, China. Ecol. Indic. 2025, 178, 113833. [Google Scholar] [CrossRef] [Scilit]
  50. GBIF.org. GBIF Occurrence Download. Available online: https://doi.org/10.15468/dl.yxr6a8 (accessed on 4 August 2025). [CrossRef]
  51. GBIF.org. GBIF Occurrence Download. Available online: https://doi.org/10.15468/dl.yqzksg (accessed on 31 July 2025). [CrossRef]
  52. GBIF.org. GBIF Occurrence Download. Available online: https://doi.org/10.15468/dl.hnu6ck (accessed on 4 August 2025). [CrossRef]
  53. GBIF.org. GBIF Occurrence Download. Available online: https://doi.org/10.15468/dl.rt5ztb (accessed on 4 August 2025). [CrossRef]
  54. GBIF.org. GBIF Occurrence Download. Available online: https://doi.org/10.15468/dl.gpzxn4 (accessed on 4 August 2025). [CrossRef]
  55. GBIF.org. GBIF Occurrence Download. Available online: https://doi.org/10.15468/dl.vbz8cz (accessed on 4 August 2025). [CrossRef]
  56. GBIF.org. GBIF Occurrence Download. Available online: https://doi.org/10.15468/dl.earz4d (accessed on 4 August 2025). [CrossRef]
  57. GBIF.org. GBIF Occurrence Download. Available online: https://doi.org/10.15468/dl.78cdup (accessed on 4 August 2025). [CrossRef]
  58. GBIF.org. GBIF Occurrence Download. Available online: https://doi.org/10.15468/dl.w3a3vu (accessed on 4 August 2025). [CrossRef]
  59. Aiello-Lammens, M.E.; Boria, R.A.; Radosavljevic, A.; Vilela, B.; Anderson, R.P. spThin: An R Package for Spatial Thinning of Species Occurrence Records for Use in Ecological Niche Models. Ecography 2015, 38, 541–545. [Google Scholar] [CrossRef] [Scilit]
  60. Wang, Y.; Xie, L.; Zhou, X.; Chen, R.; Zhao, G.; Zhang, F. Prediction of the Potentially Suitable Areas of Leonurus Japonicus in China Based on Future Climate Change Using the Optimized MaxEnt Model. Ecol. Evol. 2023, 13, e10597. [Google Scholar] [CrossRef] [Scilit] [PubMed]
  61. Gebremedhn, H.; Gebrewahid, Y.; Hadgu, G.; de Graaf, D.C. Projecting the Impacts of Climate Change on Habitat Distribution of Varroa Destructor in Ethiopia Using MaxEnt Ecological Modeling. Sci. Total Environ. 2025, 968, 178904. [Google Scholar] [CrossRef] [Scilit] [PubMed]
  62. Jiang, F.; Zhang, J.; Gao, H.; Cai, Z.; Zhou, X.; Li, S.; Zhang, T. Musk Deer (Moschus Spp.) Face Redistribution to Higher Elevations and Latitudes under Climate Change in China. Sci. Total Environ. 2020, 704, 135335. [Google Scholar] [CrossRef] [Scilit] [PubMed]
  63. Ten Caten, C.; Dallas, T. Thinning Occurrence Points Does Not Improve Species Distribution Model Performance. Ecosphere 2023, 14, e4703. [Google Scholar] [CrossRef] [Scilit]
  64. Li, M.Y.; Ju, Y.W.; Sunil, K.; Thomas, J.S. Modeling Potential Habitats for Alien Species Dreissena Polymorpha in Continental USA. Acta Ecol. Sin. 2008, 28, 4253–4258. [Google Scholar] [CrossRef] [Scilit]
  65. Wang, G.; Wang, C.; Guo, Z.; Dai, L.; Wu, Y.; Liu, H.; Li, Y.; Chen, H.; Zhang, Y.; Zhao, Y.; et al. Integrating Maxent Model and Landscape Ecology Theory for Studying Spatiotemporal Dynamics of Habitat: Suggestions for Conservation of Endangered Red-Crowned Crane. Ecol. Indic. 2020, 116, 106472. [Google Scholar] [CrossRef] [Scilit]
  66. Zhang, T.; Cheng, C.; Wu, X. Mapping the Spatial Heterogeneity of Global Land Use and Land Cover from 2020 to 2100 at a 1 Km Resolution. Sci. Data 2023, 10, 748–763. [Google Scholar] [CrossRef] [Scilit] [PubMed]
  67. Teng, J.; Zhu, Y.; Duan, H.; Yu, X.; Xia, S.; Wang, R.; Yang, H. Linking Hydrological Connectivity and Waterbirds Habitat Suitability in Floodplain Wetlands: Implications for Wetland Management. Ecol. Indic. 2025, 176, 113663. [Google Scholar] [CrossRef] [Scilit]
  68. Wu, T.; Lu, Y.; Fang, Y.; Xin, X.; Li, L.; Li, W.; Jie, W.; Zhang, J.; Liu, Y.; Zhang, L.; et al. The Beijing Climate Center Climate System Model (BCC-CSM): The Main Progress from CMIP5 to CMIP6. Geosci. Model Dev. 2019, 12, 1573–1600. [Google Scholar] [CrossRef] [Scilit]
  69. O’Neill, B.C.; Tebaldi, C.; Van Vuuren, D.P.; Eyring, V.; Friedlingstein, P.; Hurtt, G.; Knutti, R.; Kriegler, E.; Lamarque, J.-F.; Lowe, J.; et al. The Scenario Model Intercomparison Project (ScenarioMIP) for CMIP6. Geosci. Model Dev. 2016, 9, 3461–3482. [Google Scholar] [CrossRef] [Scilit]
  70. Stachura-Skierczyńska, K.; Tumiel, T.; Skierczyński, M. Habitat Prediction Model for Three-Toed Woodpecker and Its Implications for the Conservation of Biologically Valuable Forests. For. Ecol. Manag. 2009, 258, 697–703. [Google Scholar] [CrossRef] [Scilit]
  71. Sorbe, F.; Gränzig, T.; Förster, M. Evaluating Sampling Bias Correction Methods for Invasive Species Distribution Modeling in Maxent. Ecol. Inform. 2023, 76, 102124. [Google Scholar] [CrossRef] [Scilit]
  72. Low, B.W.; Zeng, Y.; Tan, H.H.; Yeo, D.C.J. Predictor Complexity and Feature Selection Affect Maxent Model Transferability: Evidence from Global Freshwater Invasive Species. Divers. Distrib. 2021, 27, 497–511. [Google Scholar] [CrossRef] [Scilit]
  73. Fang, T.; Jin, J.; Chen, C.; Zhang, L.; Li, Y.; Li, C. Prediction of Suitable Habitat for Tundra Swans in the Nanji Wetland Nature Reserve of Poyang Lake under Different Water Level Conditions. Ecol. Indic. 2025, 170, 113030. [Google Scholar] [CrossRef] [Scilit]
  74. Liu, C.; White, M.; Newell, G. Selecting Thresholds for the Prediction of Species Occurrence with Presence-Only Data. J. Biogeogr. 2013, 40, 778–789. [Google Scholar] [CrossRef] [Scilit]
  75. Pearson, R.G.; Raxworthy, C.J.; Nakamura, M.; Townsend Peterson, A. ORIGINAL ARTICLE: Predicting Species Distributions from Small Numbers of Occurrence Records: A Test Case Using Cryptic Geckos in Madagascar. J. Biogeogr. 2007, 34, 102–117. [Google Scholar] [CrossRef] [Scilit]
  76. Reshamwala, H.S.; Bhattacharya, A.; Khan, S.; Shrotriya, S.; Lyngdoh, S.B.; Goyal, S.P.; Kanagaraj, R.; Habib, B. Modeling Potential Impacts of Climate Change on the Distribution of Wooly Wolf (Canis Lupus Chanco). Front. Ecol. Evol. 2022, 10, 815621. [Google Scholar] [CrossRef] [Scilit]
  77. He, F.; Liang, L.; Wang, H.; Li, A.; La, M.; Wang, Y.; Zhang, X.; Zou, D. Amphibians Rise to Flourishing under Climate Change on the Qinghai-Tibetan Plateau. Heliyon 2024, 10, e35860. [Google Scholar] [CrossRef] [Scilit] [PubMed]
  78. Lu, Z.; Wang, G.; Shao, Y.; Yan, L.; Huang, L.; Fan, Z.; Han, S.; Ren, X.; Han, R.; Zhang, C.; et al. Assessing the Impacts of Climate Change and Human Activities on Distribution of Lophatherum Gracile in China Using the Maxent Model. Sci. Rep. 2025, 15, 29945. [Google Scholar] [CrossRef] [Scilit] [PubMed]
  79. Chi, Y.; Wang, G.G.; Zhu, M.; Jin, P.; Hu, Y.; Shu, P.; Wang, Z.; Fan, A.; Qian, P.; Han, Y.; et al. Potentially Suitable Habitat Prediction of Pinus Massoniana Lamb. in China under Climate Change Using Maxent Model. Front. For. Glob. Change 2023, 6, 1144401. [Google Scholar] [CrossRef] [Scilit]
  80. Hu, X.-G.; Jin, Y.; Wang, X.-R.; Mao, J.-F.; Li, Y. Predicting Impacts of Future Climate Change on the Distribution of the Widespread Conifer Platycladus Orientalis. PLoS ONE 2015, 10, e0132326. [Google Scholar] [CrossRef] [Scilit] [PubMed]
  81. Brown, J.L. SDMtoolbox: A Python-Based GIS Toolkit for Landscape Genetic, Biogeographic and Species Distribution Model Analyses. Methods Ecol. Evol. 2014, 5, 694–700. [Google Scholar] [CrossRef] [Scilit]
  82. Berta Aneseyee, A.; Noszczyk, T.; Soromessa, T.; Elias, E. The InVEST Habitat Quality Model Associated with Land Use/Cover Changes: A Qualitative Case Study of the Winike Watershed in the Omo-Gibe Basin, Southwest Ethiopia. Remote Sens. 2020, 12, 1103. [Google Scholar] [CrossRef] [Scilit]
  83. Luo, P.; Li, Y.; Xu, H.; Song, Y. Analysis of Biodiversity Distribution Patterns around the Plateau Lake Based on the MaxEnt and InVest Models. Sci. Rep. 2025, 16, 354–384. [Google Scholar] [CrossRef] [Scilit] [PubMed]
  84. Xu, C.; Yu, Q.; Wang, F.; Qiu, S.; Ai, M.; Zhao, J. Identifying and Optimizing Ecological Spatial Patterns Based on the Bird Distribution in the Yellow River Basin, China. J. Environ. Manag. 2023, 348, 119293. [Google Scholar] [CrossRef] [Scilit] [PubMed]
  85. Forman, R.T.T.; Alexander, L.E. Roads and Their Major Ecological Effects. Annu. Rev. Ecol. Evol. Syst. 1998, 29, 207–231. [Google Scholar] [CrossRef] [Scilit]
  86. Venter, O.; Sanderson, E.W.; Magrach, A.; Allan, J.R.; Beher, J.; Jones, K.R.; Possingham, H.P.; Laurance, W.F.; Wood, P.; Fekete, B.M.; et al. Sixteen Years of Change in the Global Terrestrial Human Footprint and Implications for Biodiversity Conservation. Nat. Commun. 2016, 7, 12558. [Google Scholar] [CrossRef] [Scilit] [PubMed]
  87. Zhao, H.; Xu, X.; Tang, J.; Wang, Z.; Miao, C. Spatial Pattern Evolution and Prediction Scenario of Habitat Quality in Typical Fragile Ecological Region, China: A Case Study of the Yellow River Floodplain Area. Heliyon 2023, 9, e14430. [Google Scholar] [CrossRef] [Scilit] [PubMed]
  88. Wang, D.; Hao, H.; Liu, H.; Sun, L.; Li, Y. Spatial—Temporal Changes of Landscape and Habitat Quality in Typical Ecologically Fragile Areas of Western China over the Past 40 Years: A Case Study of the Ningxia Hui Autonomous Region. Ecol. Evol. 2024, 14, e10847. [Google Scholar] [CrossRef] [Scilit] [PubMed]
  89. Casagrande, S.; Nieder, L.; Di Minin, E.; La Fata, I.; Csermely, D. Habitat Utilization and Prey Selection of the Kestrel Falco tinnunculus in Relation to Small Mammal Abundance. Ital. J. Zool. 2008, 75, 401–409. [Google Scholar] [CrossRef] [Scilit]
  90. Assandri, G.; Cecere, J.G.; Sarà, M.; Catoni, C.; De Pascalis, F.; Morinay, J.; Berlusconi, A.; Cioccarelli, S.; Mercogliano, A.; Pazhera, A.; et al. Context-Dependent Foraging Habitat Selection in a Farmland Raptor along an Agricultural Intensification Gradient. Agric. Ecosyst. Environ. 2022, 326, 107782. [Google Scholar] [CrossRef] [Scilit]
  91. Cardinale, B.J.; Duffy, J.E.; Gonzalez, A.; Hooper, D.U.; Perrings, C.; Venail, P.; Narwani, A.; Mace, G.M.; Tilman, D.; Wardle, D.A.; et al. Biodiversity Loss and Its Impact on Humanity. Nature 2012, 486, 59–67. [Google Scholar] [CrossRef] [Scilit] [PubMed]
  92. Naimi, B.; Capinha, C.; Ribeiro, J.; Rahbek, C.; Strubbe, D.; Reino, L.; Araújo, M.B. Potential for Invasion of Traded Birds under Climate and Land-Cover Change. Glob. Change Biol. 2022, 28, 5654–5666. [Google Scholar] [CrossRef] [Scilit] [PubMed]
  93. Lathouwers, M.; Beenaerts, N.; Evens, R.; Artois, T.; Conway, G.; Henderson, I.; Shewring, M.; Cross, T.; Ulenaers, E.; Dendoncker, N. Impact of Future Climate Change and Land-Use Change on Habitat Suitability for a Long-Distance Avian Migrant under Diverse Socioeconomic-Emission Scenarios. Glob. Ecol. Conserv. 2025, 62, e03777. [Google Scholar] [CrossRef] [Scilit]
  94. Liu, W.; Wang, R.; Fan, T.; Abudulijiang, N.; Song, X.; Xiao, S.; Guo, N.; Shuai, L. Habitat Suitability for the Aviceda Leuphotes in Mingxi County, Fujian Province. Biodivers. Sci. 2023, 31, 22660. [Google Scholar] [CrossRef] [Scilit]
  95. Huang, Z.; Lu, Y.; Meng, W.; Mo, X.; Xu, W.; Yun, H.; He, M.; Wang, Y. Study on Suitability Assessment of Waterbird Habitats along the Bohai Rim. Ecol. Indic. 2023, 150, 110229. [Google Scholar] [CrossRef] [Scilit]
  96. Kalarikkal, R.K.; Kim, Y.; Ksiksi, T. Incorporating Satellite Remote Sensing for Improving Potential Habitat Simulation of Prosopis Cineraria (L.) Druce in United Arab Emirates. Glob. Ecol. Conserv. 2022, 37, e02167. [Google Scholar] [CrossRef] [Scilit]
  97. Hughes, L. Biological Consequences of Global Warming: Is the Signal Already Apparent? Trends Ecol. Evol. 2000, 15, 56–61. [Google Scholar] [CrossRef] [Scilit] [PubMed]
  98. Singh, H.; Kumar, N.; Kumar, M.; Singh, R. Modelling Habitat Suitability of Western Tragopan (Tragopan Melanocephalus) a Range-Restricted Vulnerable Bird Species of the Himalayan Region, in Response to Climate Change. Clim. Risk Manag. 2020, 29, 100241. [Google Scholar] [CrossRef] [Scilit]
  99. Duan, S.; Yang, Z.; Han, F.; Liu, T. Habitat Identification and Fragmentation Risk Assessment of Key Species in the Altai Mountains Transboundary Region. Environ. Sustain. Indic. 2025, 27, 100816. [Google Scholar] [CrossRef] [Scilit]
  100. Wang, P.; Yu, S.-L.; Li, R.-Q.; Song, Z.-M.; Duan, J.-Q.; Xu, Z.; Ning, L.-H.; Liu, J.-C. Multispecies Conservation Corridors in China: For Climate Change Adaptation. Adv. Clim. Change Res. 2025, 16, 762–774. [Google Scholar] [CrossRef] [Scilit]
  101. Wang, R.; Zhu, S.; Peng, Y.; Lin, L.; Li, W.; Cui, G. Ecological Connectivity of Umbrella and Flagship Species in the Altai Mountains, China. Ecol. Indic. 2025, 178, 113872. [Google Scholar] [CrossRef] [Scilit]
  102. Li, B.; Liang, C.; Song, P.; Liu, D.; Qin, W.; Jiang, F.; Gu, H.; Gao, H.; Zhang, T. Threatened Birds Face New Distribution under Future Climate Change on the Qinghai-Tibet Plateau (QTP). Ecol. Indic. 2023, 150, 110217. [Google Scholar] [CrossRef] [Scilit]
  103. Sharp, R.; Chaplin-Kramer, R.; Wood, S.; Guerry, A.; Tallis, H.; Ricketts, T.; Nelson, E.; Ennaanay, D.; Wolny, S.; Olwero, N.; et al. InVEST User’s Guide; The Natural Capital Project, Stanford University: Stanford, CA, USA; University of Minnesota: Minneapolis, MN, USA; The Nature Conservancy: Arlington, VA, USA; World Wildlife Fund: Washington, DC, USA, 2018. [Google Scholar]
  104. Johnson, S.; Molano-Flores, B.; Zaya, D. Field Validation as a Tool for Mitigating Uncertainty in Species Distribution Modeling for Conservation Planning. Conserv. Sci. Pract. 2023, 5, e12978. [Google Scholar] [CrossRef] [Scilit]
  105. Di Marco, M.; Watson, J.E.M.; Possingham, H.P.; Venter, O. Limitations and Trade-Offs in the Use of Species Distribution Maps for Protected Area Planning. J. Appl. Ecol. 2017, 54, 402–411. [Google Scholar] [CrossRef] [Scilit]
  106. Guisan, A.; Thuiller, W. Predicting Species Distribution: Offering More than Simple Habitat Models. Ecol. Lett. 2005, 8, 993–1009. [Google Scholar] [CrossRef] [Scilit] [PubMed]
  107. Hannah, L.; Midgley, G.F.; Millar, D. Climate Change-Integrated Conservation Strategies. Glob. Ecol. Biogeogr. 2002, 11, 485–495. [Google Scholar] [CrossRef] [Scilit]
  108. Heller, N.E.; Zavaleta, E.S. Biodiversity Management in the Face of Climate Change: A Review of 22 Years of Recommendations. Biol. Conserv. 2009, 142, 14–32. [Google Scholar] [CrossRef] [Scilit]
  109. Liang, Q.; Xu, X.; Mao, K.; Wang, M.; Wang, K.; Xi, Z.; Liu, J. Shifts in Plant Distributions in Response to Climate Warming in a Biodiversity Hotspot, the Hengduan Mountains. J. Biogeogr. 2018, 45, 1334–1344. [Google Scholar] [CrossRef] [Scilit]
  110. Inouye, D.W.; Barr, B.; Armitage, K.B.; Inouye, B.D. Climate Change Is Affecting Altitudinal Migrants and Hibernating Species. Proc. Natl. Acad. Sci. USA 2000, 97, 1630–1633. [Google Scholar] [CrossRef] [Scilit] [PubMed]
  111. Opdam, P.; Wascher, D. Climate Change Meets Habitat Fragmentation: Linking Landscape and Biogeographical Scale Levels in Research and Conservation. Biol. Conserv. 2004, 117, 285–297. [Google Scholar] [CrossRef] [Scilit]
  112. White, R.L.; Bennett, P.M. Elevational Distribution and Extinction Risk in Birds. PLoS ONE 2015, 10, e0121849. [Google Scholar] [CrossRef] [Scilit] [PubMed]
  113. Ramírez-Delgado, J.P.; Di Marco, M.; Watson, J.E.M.; Johnson, C.J.; Rondinini, C.; Corredor Llano, X.; Arias, M.; Venter, O. Matrix Condition Mediates the Effects of Habitat Fragmentation on Species Extinction Risk. Nat. Commun. 2022, 13, 595. [Google Scholar] [CrossRef] [Scilit] [PubMed]
  114. Fourcade, Y.; Engler, J.O.; Rödder, D.; Secondi, J. Mapping Species Distributions with MAXENT Using a Geographically Biased Sample of Presence Data: A Performance Assessment of Methods for Correcting Sampling Bias. PLoS ONE 2014, 9, e97122. [Google Scholar] [CrossRef] [Scilit] [PubMed]
Figure 1. Geographic location, elevation, and validated occurrence records of seven falconid species in Xinjiang, China. The main map shows the elevation of the study area and species occurrence records, and the inset shows the location of Xinjiang within China.
Animals 16 02650 g001
Figure 2. Simulated AUC values of Falconidae species in Xinjiang based on the MaxEnt model.
Animals 16 02650 g002
Figure 3. Distribution of suitable habitats of falconid birds in Xinjiang. (A) F. cherrug; (B) F. columbarius; (C) F. naumanni; (D) F. peregrinus; (E) F. subbuteo; (F) F. tinnunculus; (G) F. vespertinus.
Animals 16 02650 g003aAnimals 16 02650 g003b
Figure 4. Relative habitat quality and habitat degradation risk in Xinjiang estimated using the InVEST Habitat Quality model: (A) relative habitat quality; (B) habitat degradation risk.
Animals 16 02650 g004
Figure 5. Spatial distribution of mutually exclusive conservation-gap categories for Falconidae species in Xinjiang. (A) F. cherrug; (B) F. columbarius; (C) F. naumanni; (D) F. peregrinus; (E) F. subbuteo; (F) F. tinnunculus; (G) F. vespertinus.
Animals 16 02650 g005
Figure 6. Future fluctuations in the suitable habitat area of falconid birds. (A) F. cherrug; (B) F. columbarius; (C) F. naumanni; (D) F. peregrinus; (E) F. subbuteo; (F) F. tinnunculus; (G) F. vespertinus.
Animals 16 02650 g006
Figure 7. Future barycenter migration of suitable habitats of falconid birds. (A) F. cherrug; (B) F. columbarius; (C) F. naumanni; (D) F. peregrinus; (E) F. subbuteo; (F) F. tinnunculus; (G) F. vespertinus.
Animals 16 02650 g007
Table 1. Environmental variables included in this study.
Data TypeEnvironmental FactorCodeUnit
Climatic FactorAnnual mean temperatureBIO1°C
Mean diurnal rangeBIO2°C
IsothermalityBIO3%
Temperature seasonalityBIO4-
Max temperature of the warmest monthBIO5°C
Min temperature of the coldest monthBIO6°C
Temperature annual rangeBIO7°C
Mean temperature of the wettest quarterBIO8°C
Mean temperature of the driest quarterBIO9°C
Mean temperature of the warmest quarterBIO10°C
Mean temperature of the coldest quarterBIO11°C
Annual precipitationBIO12mm
Precipitation of the wettest monthBIO13mm
Precipitation of the driest monthBIO14mm
Precipitation seasonalityBIO15-
Precipitation of the wettest quarterBIO16mm
Precipitation of the driest quarterBIO17mm
Precipitation of the warmest quarterBIO18mm
Precipitation of the coldest quarterBIO19mm
Topographic FactorElevationELEm
AspectASPECT-
SlopeSLOPE-
Natural FactorLand use and land cover changeLUCC-
Distance to water systemDis_wsm
Distance to the nature reserveDis_nr
Normalized difference vegetation indexNDVI-
Table 2. Threat factor parameters.
ThreatMax_Dist/kmWeightDecay
roads50.7linear
builtupland80.8exponential
cropland30.5linear
bareland40.4linear
Table 3. Habitats suitability of different land use types and sensitivities.
Land Use TypeHabitat SuitabilityRoadsBuiltuplandCroplandBareland
cropland0.50.40.40.20.2
forest0.50.70.70.50.4
grassland0.90.70.80.50.4
shrubland0.650.70.70.50.4
wetland0.60.60.60.50.3
water0.20.30.30.20.2
builtupland00000
bareland0.450.50.50.20.1
snow_ice0.050.10.100.1
Table 4. Protection status and numbers of valid occurrence records of Falconidae species in Xinjiang.
English NameScientific NameIUCN Red List
Conservation
Category
National Priority
Conservation
Category in China
Valid Occurrence
Sites
Amur FalconF. amurensisLCII2
Saker FalconF. cherrugENI163
MerlinF. columbariusLCII105
Lesser KestrelF. naumanniLCII517
Peregrine FalconF. peregrinusLCII114
GyrfalconF. rusticolusLCI3
Eurasian HobbyF. subbuteoLCII405
Common KestrelF. tinnunculusLCII1327
Red-footed FalconF. vespertinusVUII100
Table 5. Results of environmental variable screening for seven Falconidae species in Xinjiang.
CodeF. cherrugF. columbariusF. naumanniF. peregrinusF. subbuteoF. tinnunculusF. verspertinus
BIO1
BIO2
BIO3
BIO4
BIO5
BIO6
BIO7
BIO8
BIO9
BIO10
BIO11
BIO12
BIO13
BIO14
BIO15
BIO16
BIO17
BIO18
BIO19
Elevation
ASPECT
SLOPE
LUCC
Dis_ws
Dis_nr
NDVI
○ indicates that the variable was excluded from the MaxEnt model for the corresponding species. ● indicates that a variable was included in the MaxEnt model for the corresponding species.
Table 6. Enmeval optimization metrics for the MaxEnt model.
SpeciesTypeRMFCDelta.AICcAvg.Diff.AUCMean.OR10%
F. cherrugDefault1LQHP125.9180.0230.178
Optimized2.5LQH0.0000.0250.142
F. columbariusDefault1LQHP163.9240.0410.259
Optimized0.5LQ0.0000.0290.153
F. naumanniDefault1LQHP3.0900.0120.124
Optimized1QHP0.0000.0120.126
F. peregrinusDefault1LQHP126.4970.0520.169
Optimized2LQ0.0000.0520.122
F. subbuteoDefault1LQHP2.3980.0110.126
Optimized1.5LQHPT0.0000.0090.121
F. tinnunculusDefault1LQHP0.0000.0120.106
Optimized-----
F. vespertinusDefault1LQHP95.9580.0130.190
Optimized0.5LQ0.0000.0100.160
AICc: Akaike information criterion corrected; Delta.AICc: AICc minimum information criterion AICc value; Avg.diff.AUC: Average difference between the training and testing AUC; Mean.OR10:10% test omission rate. The optimization metrics for F. tinnunculus were not applicable, as its default settings already yielded ΔAICc = 0, indicating optimal complexity.
Table 7. Percent contribution (%) of environmental variables for seven Falconidae species in Xinjiang.
CodeF. cherrugF. columbariusF. naumanniF. peregrinusF. subbuteoF. tinnunculusF. vespertinus
BIO15.74.32.97.0
BIO25.32.43.48.62.21.62.3
BIO30.43.93.37.712.92.310.4
BIO40.21.43.32.5
BIO5
BIO61.00.8
BIO73.41.8
BIO80.1
BIO91.6
BIO103.5
BIO11
BIO120.10.6
BIO131.3
BIO140.3
BIO151.24.31.410.79.24.536.6
BIO160.7
BIO173.0
BIO180.31.2
BIO1936.70.155.46.618.3
Elevation1.4
ASPECT0.11.20.30.11.3
SLOPE3.11.80.10.50.50.3
LUCC18.176.114.364.920.437.029.4
Dis_ws15.32.27.41.08.711.04.5
Dis_nr2.31.51.20.41.61.17.4
NDVI11.62.95.10.929.713.01.7
○ indicates that the variable was excluded from the MaxEnt model for the corresponding species; numbers indicate that the variable was included in the MaxEnt model for the corresponding species and represents its percentage contribution.
Table 8. Current suitable habitat area of falconid birds in Xinjiang (104 km2).
Habitat ClassF. cherrugF. columbariusF. naumanniF. peregrinusF. subbuteoF. tinnunculusF. vespertinus
Proportion of un habitat0.770890.821970.857720.855270.868730.784590.97210
Proportion of low habitat0.157240.152750.101100.123460.093530.154560.02088
Proportion of medium habitat0.064720.020970.038530.016740.034450.058900.00625
Proportion of high habitat0.007150.004310.002640.004520.003290.001950.00078
Area of un habitat128.34539136.84921142.80252142.39448144.63557130.62613161.84429
Area of low habitat26.1783625.4308216.8318220.5548215.5725925.732773.47605
Area of medium habitat10.775983.492116.415562.787545.734799.805681.04056
Area of high habitat1.190280.717860.440100.753150.547050.325420.12910
Total habitat area38.1446129.6407923.6874824.0955221.8544335.863874.64571
“un habitat” denotes unsuitable habitat; “low habitat” denotes low-suitability habitat; “medium habitat” denotes medium-suitability habitat; and “high habitat” denotes high-suitability habitat.
Table 9. Areas and percentages of relative habitat quality classes in Xinjiang (104 km2).
Habitat Quality LevelsArea (104 km2)Percentage (%)
Low5.873.53%
Medium126.6776.09%
High33.9520.38%
Table 10. Areas and percentages of relative habitat degradation risk classes in Xinjiang (104 km2).
Habitat Degradation Severity LevelsArea (104 km2)Percentage (%)
Low95.9657.63%
Medium49.3229.63%
High21.2112.74%
Table 11. Areas of protected-area coverage and conservation-gap types for suitable habitats of falconid birds in Xinjiang (104 km2).
Habitat CategoryF. cherrugF. columbariusF. naumanniF. peregrinusF. subbuteoF. tinnunculusF. vespertinus
Inside PA5.593563.494582.709852.318602.864703.754460.70075
Outside PA30.3204624.9156119.3058920.4334617.6975930.486603.53464
Priority gap10.248869.749036.521556.950016.150549.441250.27523
Low-quality management gap0.987161.255490.765511.167430.955851.306830.31621
High-degradation management gap10.0642211.554788.027269.654378.648813.389511.63118
High-quality × high-degradation gap3.510843.376232.563032.534972.394043.664680.17163
General gap12.550695.755636.569955.217364.357810.040631.48903
Disclaimer/Publisher’s Note: The statements, opinions and data contained in all publications are solely those of the individual author(s) and contributor(s) and not of MDPI and/or the editor(s). MDPI and/or the editor(s) disclaim responsibility for any injury to people or property resulting from any ideas, methods, instructions or products referred to in the content.