1. Introduction
Hypertension is a widespread chronic disease worldwide, mainly characterized by persistently high arterial blood pressure. It not only has a high incidence in humans but is also a major risk factor for heart disease [
1]. Hypertension can be divided into primary and secondary types, with most cases being primary hypertension of unknown origin. Factors such as genetic predisposition, dietary habits, high salt intake, obesity, and lack of exercise are considered significant triggers of hypertension [
2]. In recent years, hypertension in animals, particularly wild ones, has increasingly garnered attention. Although there have been few systematic studies, reports have indicated that many animals in captivity experience health issues similar to those in humans, such as hypertension [
3]. During the conservation of endangered animals, health monitoring shows that hypertension may be linked to shifts in their living conditions and diet. For instance, the food provided to captive animals by caretakers might lack the variety of natural foods available in the wild, potentially leading to hypertension, which underscores the importance of addressing these dietary adjustments in captivity. In addition, animals subjected to mental stress or environmental changes, such as long-distance transportation and habitat alterations, are prone to hypertension-like symptoms [
4]. In recent years, multiple cases of giant pandas have shown signs of elevated blood pressure, especially elderly giant pandas, severely affecting their health. For example, studies have shown that chronic kidney disease in captive elderly giant pandas can lead to persistent hypertension, and this hypertension can cause myocardial damage and heart failure [
5]. Furthermore, studies have shown that the stress-inducing operation in captivity can cause acute hypertension in giant pandas. This confirms that giant pandas have a predisposition to hypertension and that the stress from the captivity environment leads to abnormal blood pressure [
6]. All along, we have been continuously measuring the blood pressure of elderly giant pandas and providing antihypertensive treatment for hypertensive giant pandas. However, research on the molecular signatures responsible for hypertension in giant pandas has not yet been reported.
ATAC-seq and RNA-seq are two powerful high-throughput sequencing technologies. Combining them can comprehensively reveal the transcriptional regulatory mechanisms and gene expression dynamics of cells. ATAC-seq identifies accessible regions by detecting open chromatin areas, thus inferring the locations of potential regulatory elements such as promoters and enhancers, etc [
7]. By analyzing chromatin accessibility, researchers can identify which genes might be activated or suppressed. RNA-seq directly measures mRNA transcription levels within cells, offering a comprehensive view of gene expression [
8]. Combining ATAC-seq and RNA-seq results allows for the analysis of gene regulatory networks from different dimensions: ATAC-seq provides information on the accessibility of regulatory regions, while RNA-seq offers actual data on gene expression levels. Together, they allow for a more in-depth analysis of which chromatin accessibility changes are potentially related to changes in gene expression.
scRNA-seq is a breakthrough technology that allows for the detailed analysis and comprehension of the gene expression profiles at the cellular level. It enables an in-depth exploration of cellular interactions, identification of rare cell types, and monitoring changes in cellular states. It is a crucial instrument for revealing the mechanisms of tissue development, immune responses, and diseases, including cancer [
9,
10].
scRNA-seq technology has been demonstrating great potential in hypertension research, revolutionizing the field by illuminating complex pathological mechanisms with the precision of single-cell analysis [
11]. Hypertension is a complex disease influenced by multiple factors, involving the intricate interplay between various tissues and cell types during its development [
12]. Bulk cell research methods provide an overview of overall expression, yet cannot reveal cell-to-cell heterogeneity and molecular features specific to individual cells [
13]. scRNA-seq technology addresses the limitation of traditional methods in analyzing gene expression in bulk samples. By performing single-cell analysis of gene expression, scRNA-seq not only compensates for these limitations but also provides novel insights into advancing hypertension research [
14]. In recent years, researchers have used scRNA-seq to discover various cell subpopulations involved in blood pressure regulation and their specific expression patterns in the cardiovascular system [
12]. Through analyses of transcriptome data from singular heart and artery cells, the dynamic expression changes in endothelial cells and smooth muscle cells during the onset of hypertension have been identified [
11]. In particular, the role of endothelial cells in the remodeling and dysfunction of blood vessels is regarded as one of the key factors in the occurrence of hypertension [
15]. The pathological process of hypertension is significantly influenced by inflammatory responses, and scRNA-seq technology reveals the complex roles of immune cells such as macrophages and T cells in hypertension [
12]. For example, these cells modulate vasoconstriction within inflammatory environments, thereby affecting overall blood pressure control [
15]. These studies not only deepen our understanding of the molecular mechanisms of hypertension but also provide a foundation for developing new therapeutic targets and diagnostic markers. However, as of now, there have been no reports on using scRNA-seq to study the molecular mechanisms of hypertension onset in giant pandas.
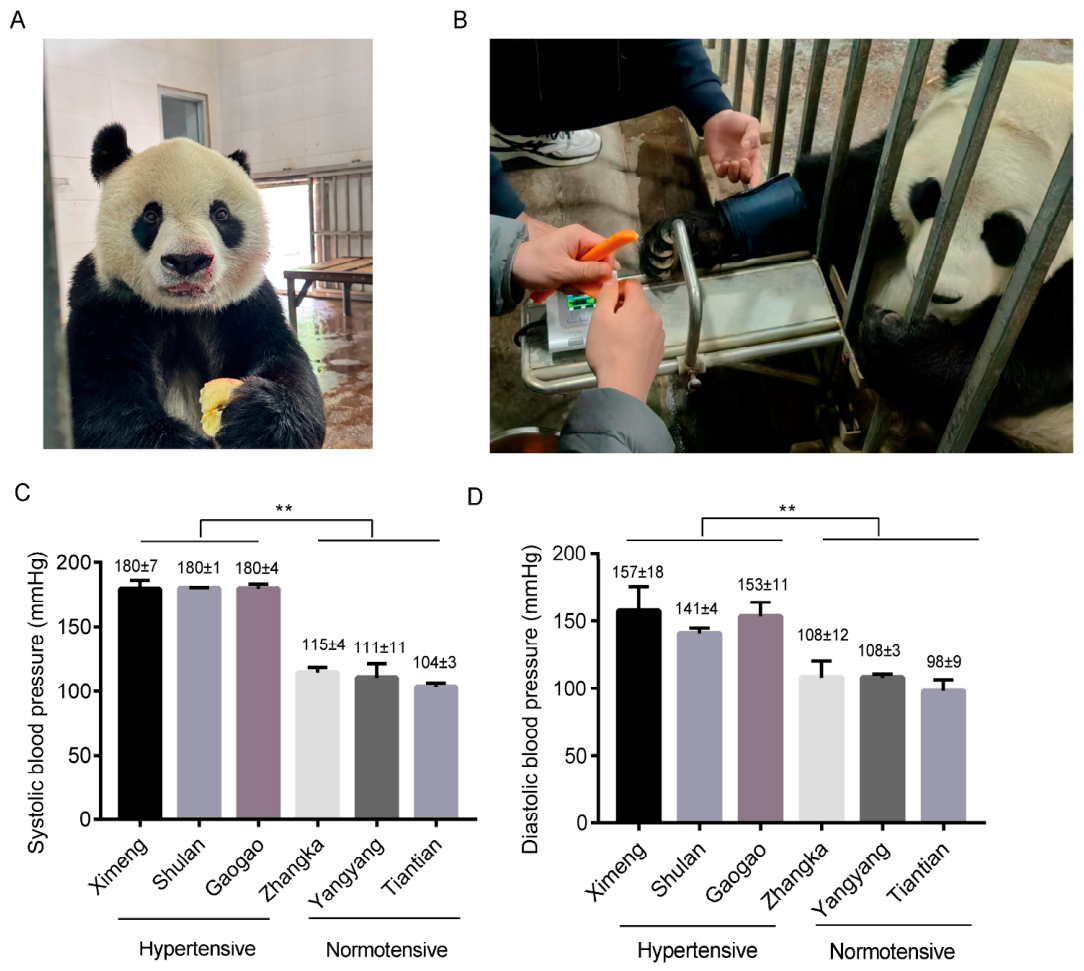
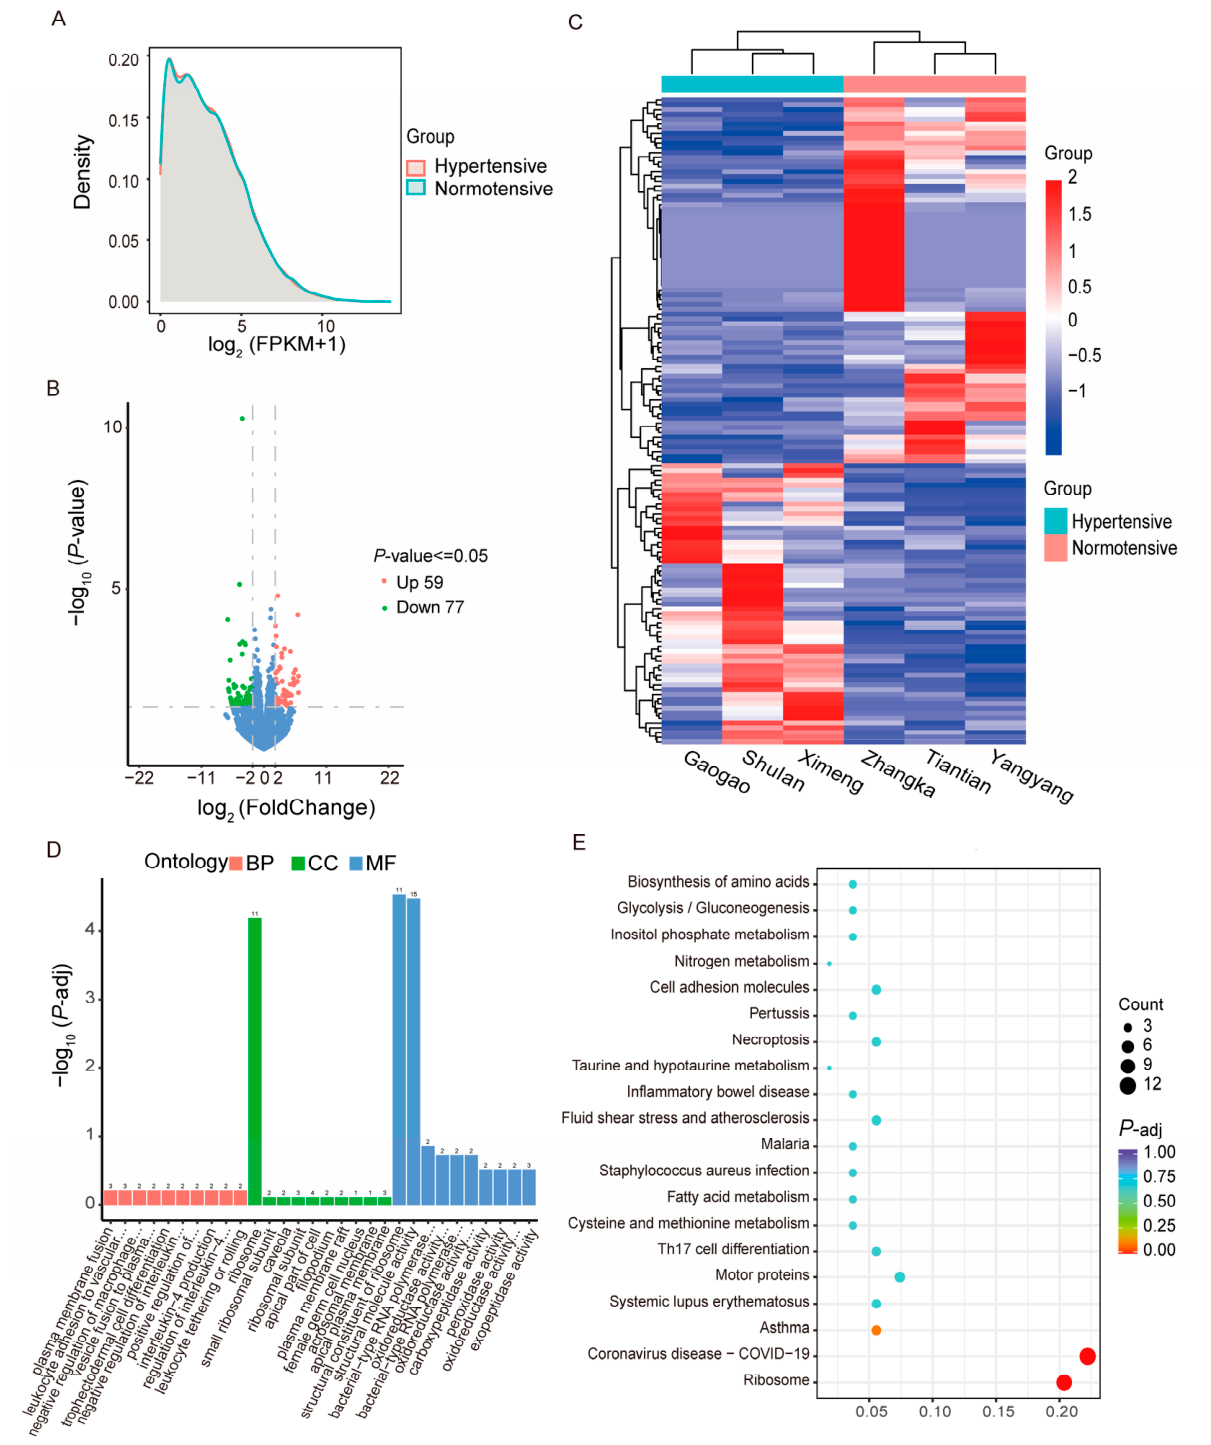
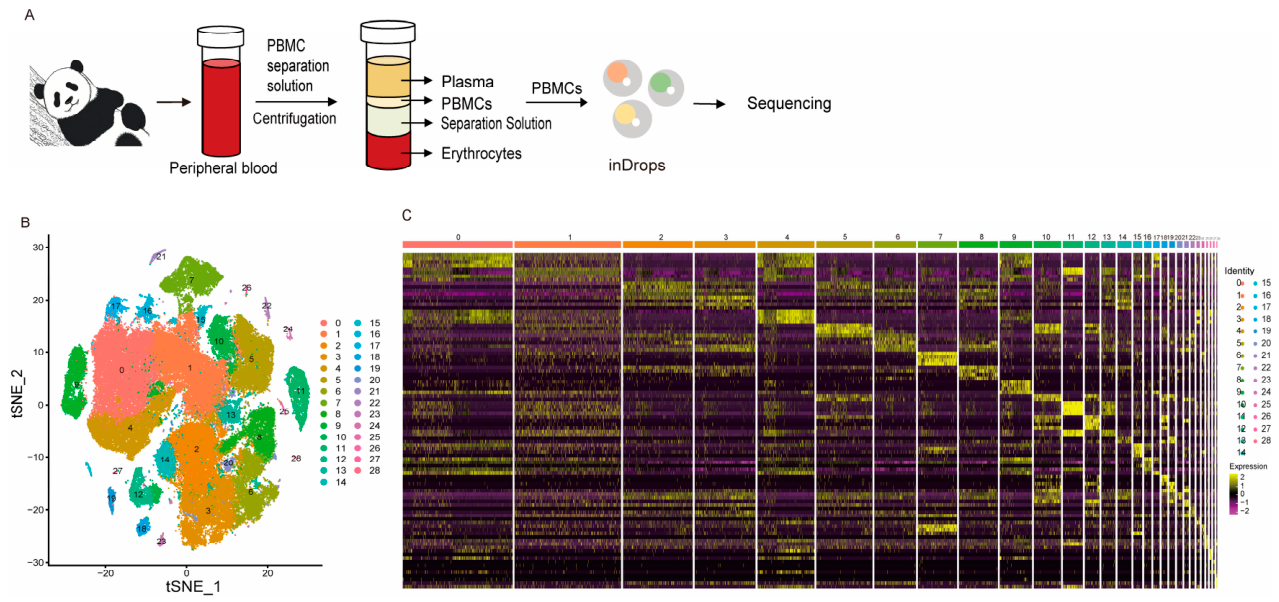
This study employed multi-omics sequencing to investigate the molecular mechanisms underlying hypertension and the pharmacodynamic effects of levamlodipine in aged giant pandas. Six elderly individuals were classified into hypertensive and normotensive groups (n = 3 each) based on clinical phenotypes and blood pressure readings. Integrated multi-omics analyses were performed, including bulk RNA-seq, ATAC-seq, single-cell RNA-seq (scRNA-seq) of peripheral blood mononuclear cells, and time-series transcriptomic profiling during levamlodipine treatment. The results demonstrated significantly decreased expression of ACE2 (Padj < 0.01), suggesting dysregulation of the renin–angiotensin system. The single-cell analysis of 88,693 cells further revealed that hypertension-related genes were mainly enriched in monocytes and T cells, implying the involvement of immune cell activation. Moreover, levamlodipine induced time-dependent transcriptional alterations, characterized by early activation of metabolic pathways followed by late suppression of ion channels and calcium signaling. This is the first multi-omics analysis of hypertension in giant pandas, the first PBMC scRNA-seq dataset in hypertensive giant pandas and the first transcriptomic evaluation after levamlodipine treatment in this species. These findings not only clarify some of the molecular regulatory process of hypertension in giant pandas, but also offer new insights into clinical treatment strategies, thereby providing crucial scientific evidence for safeguarding the health of this endangered species.
4. Discussion
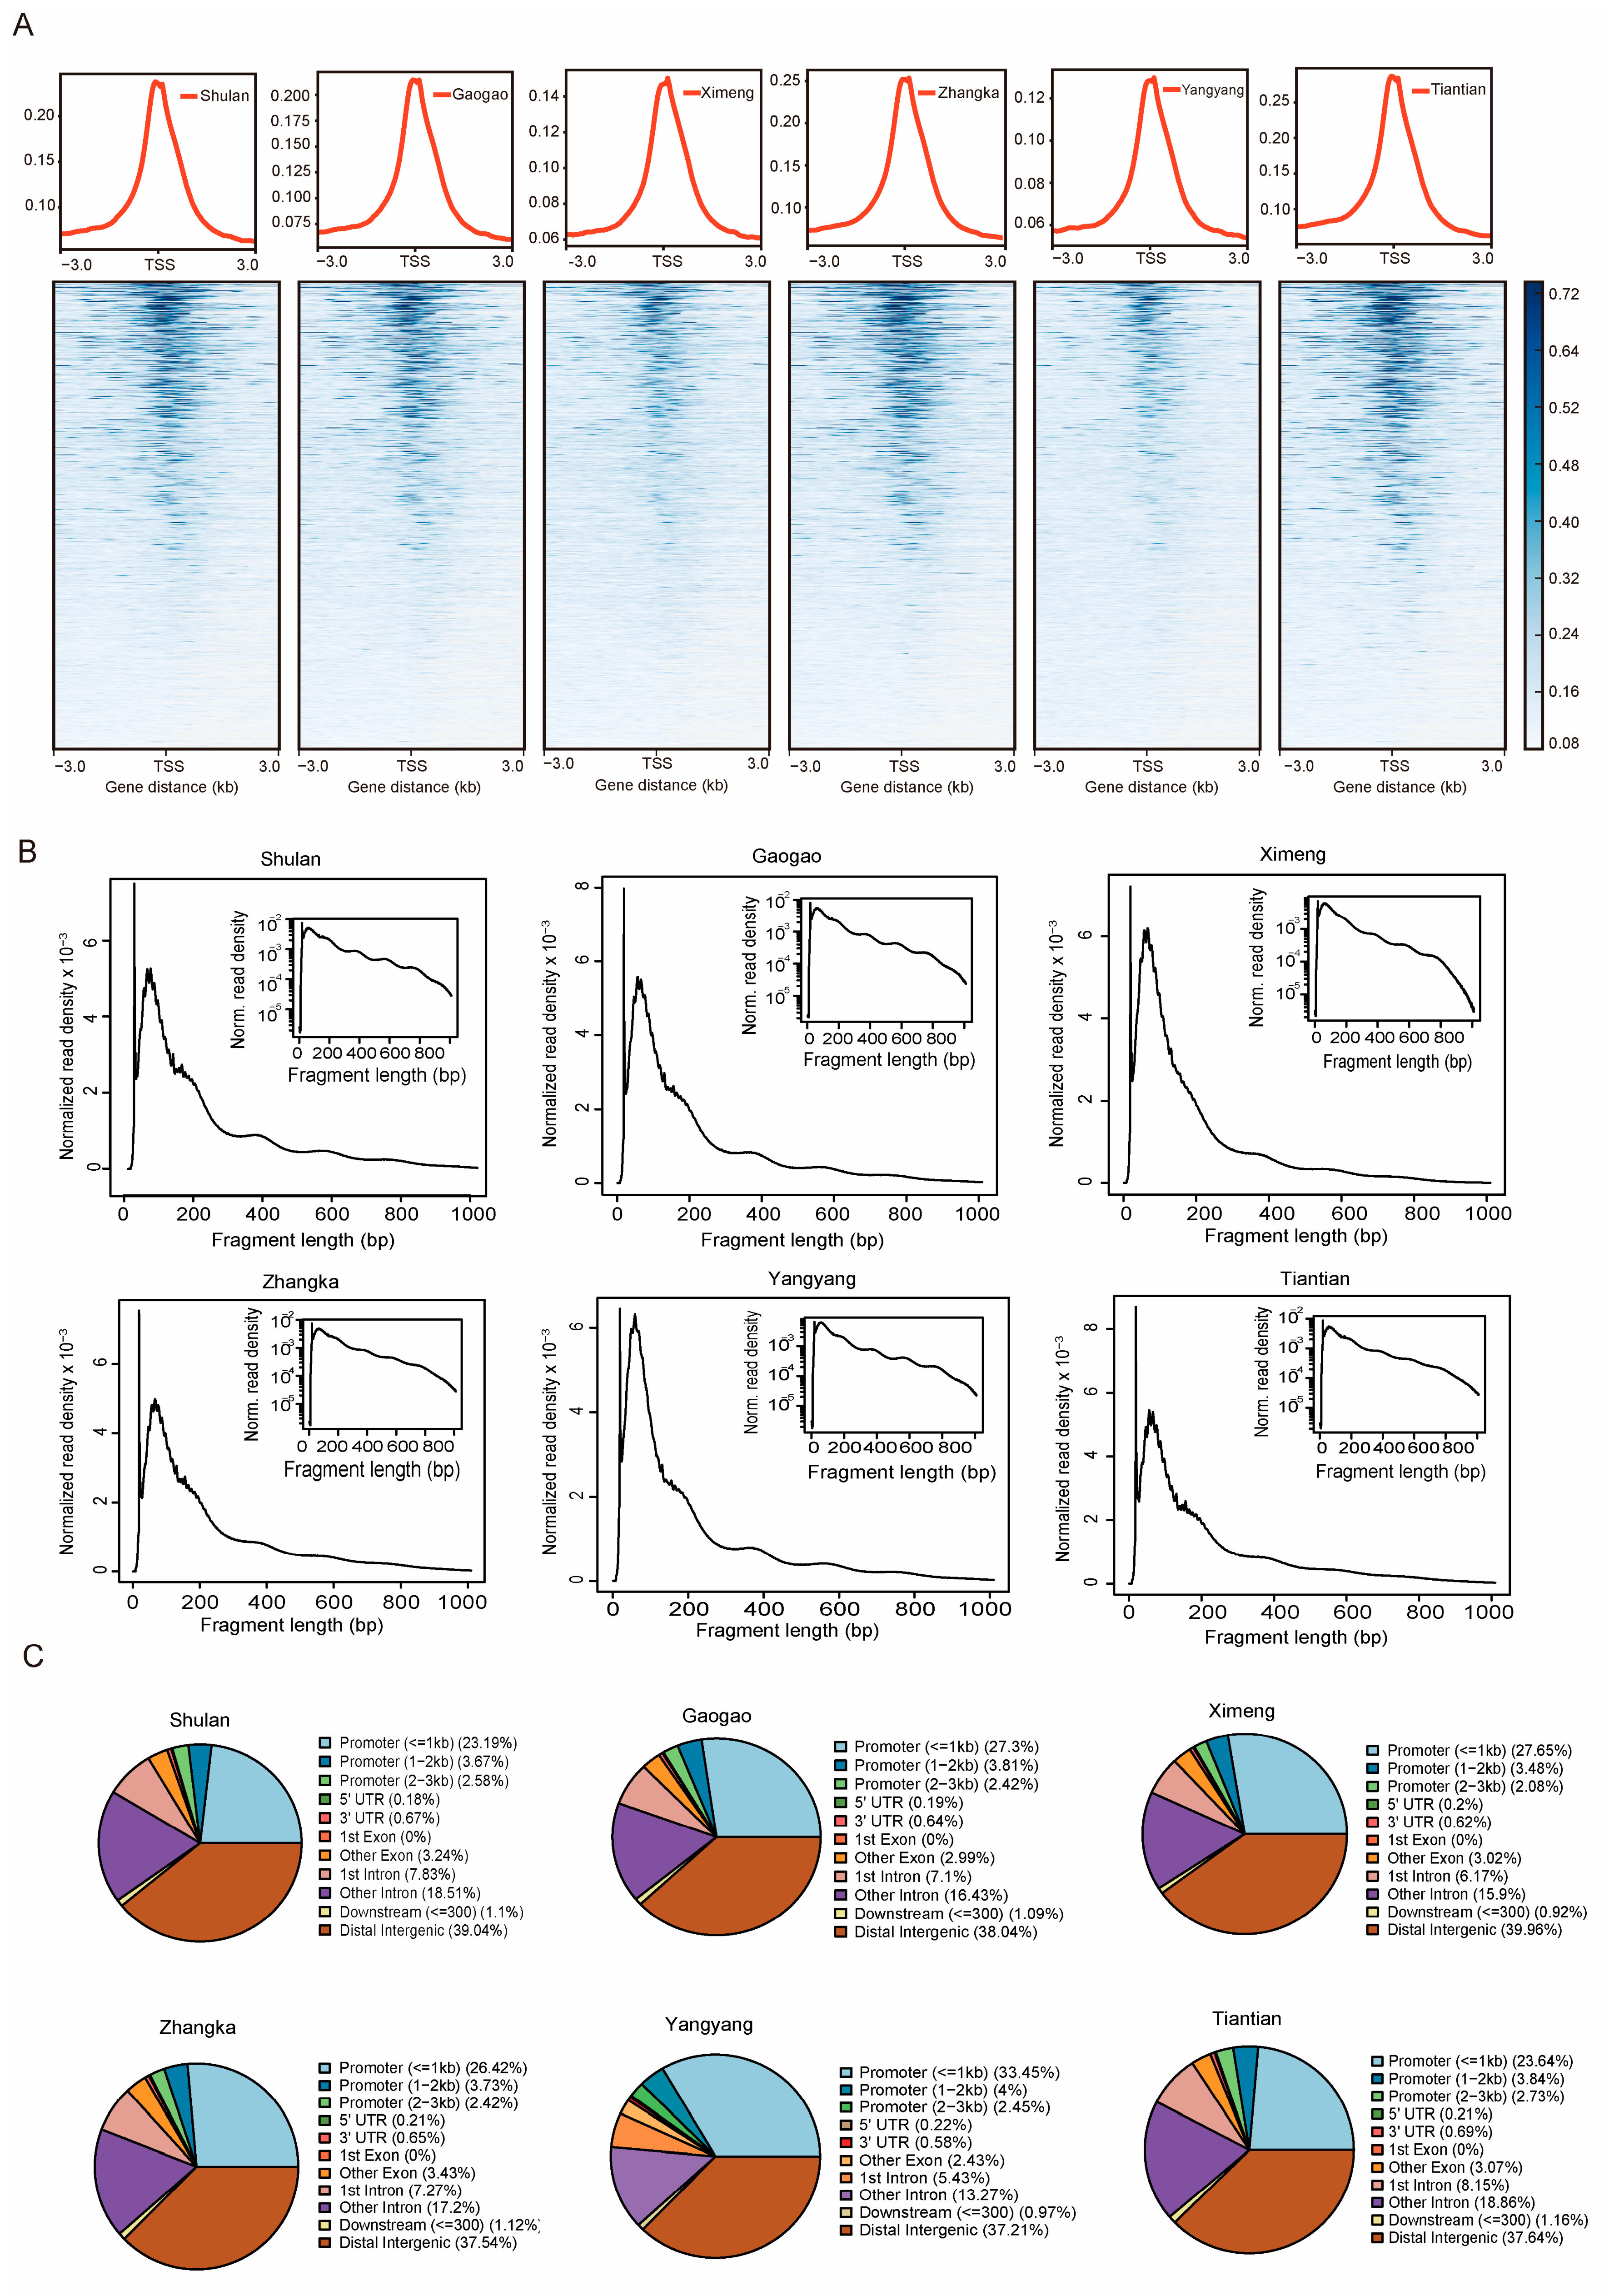
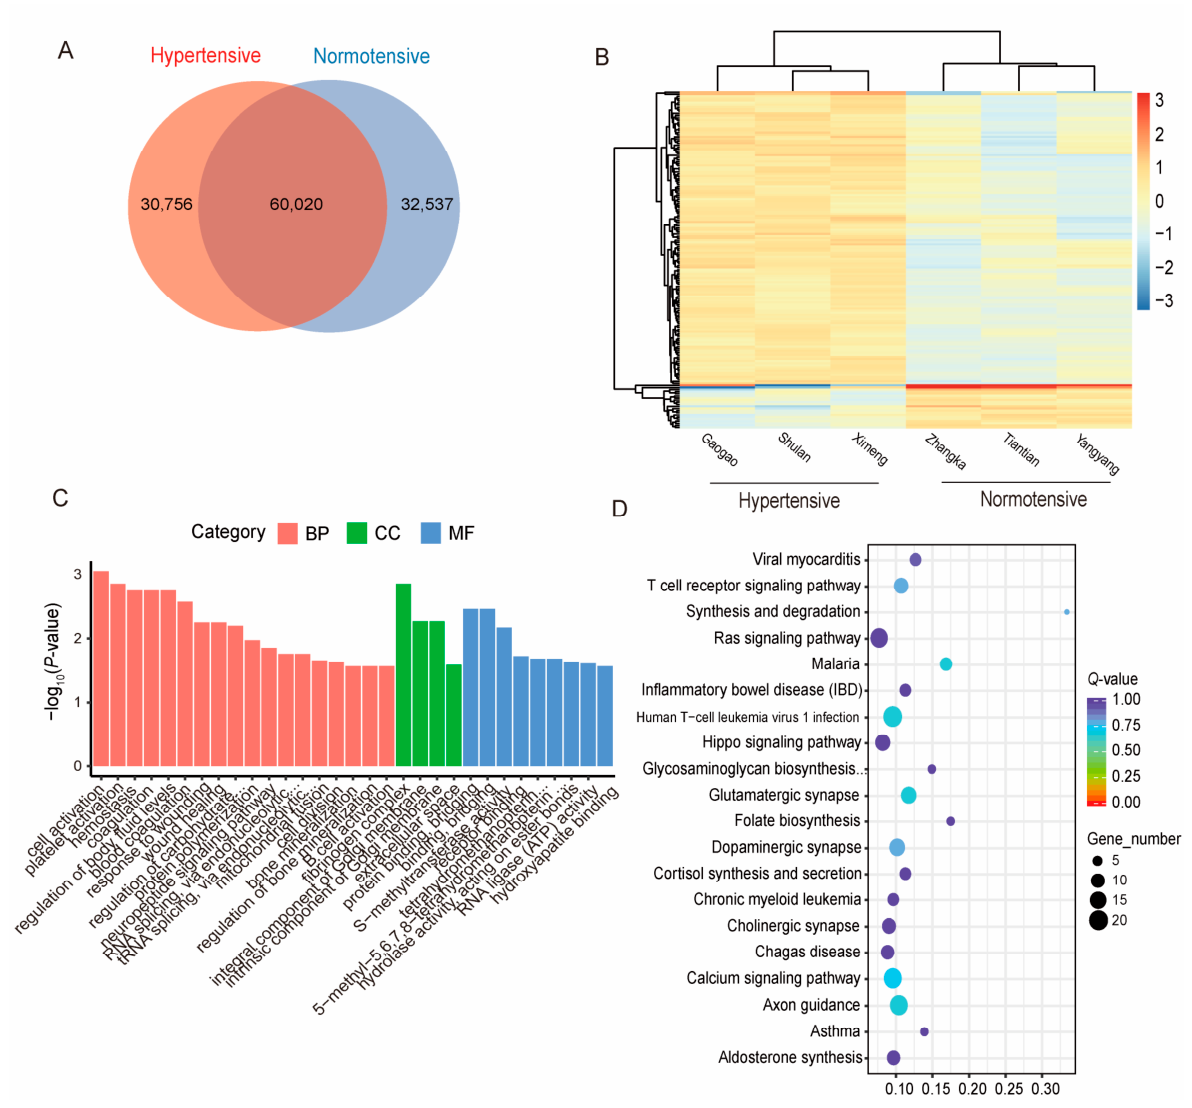
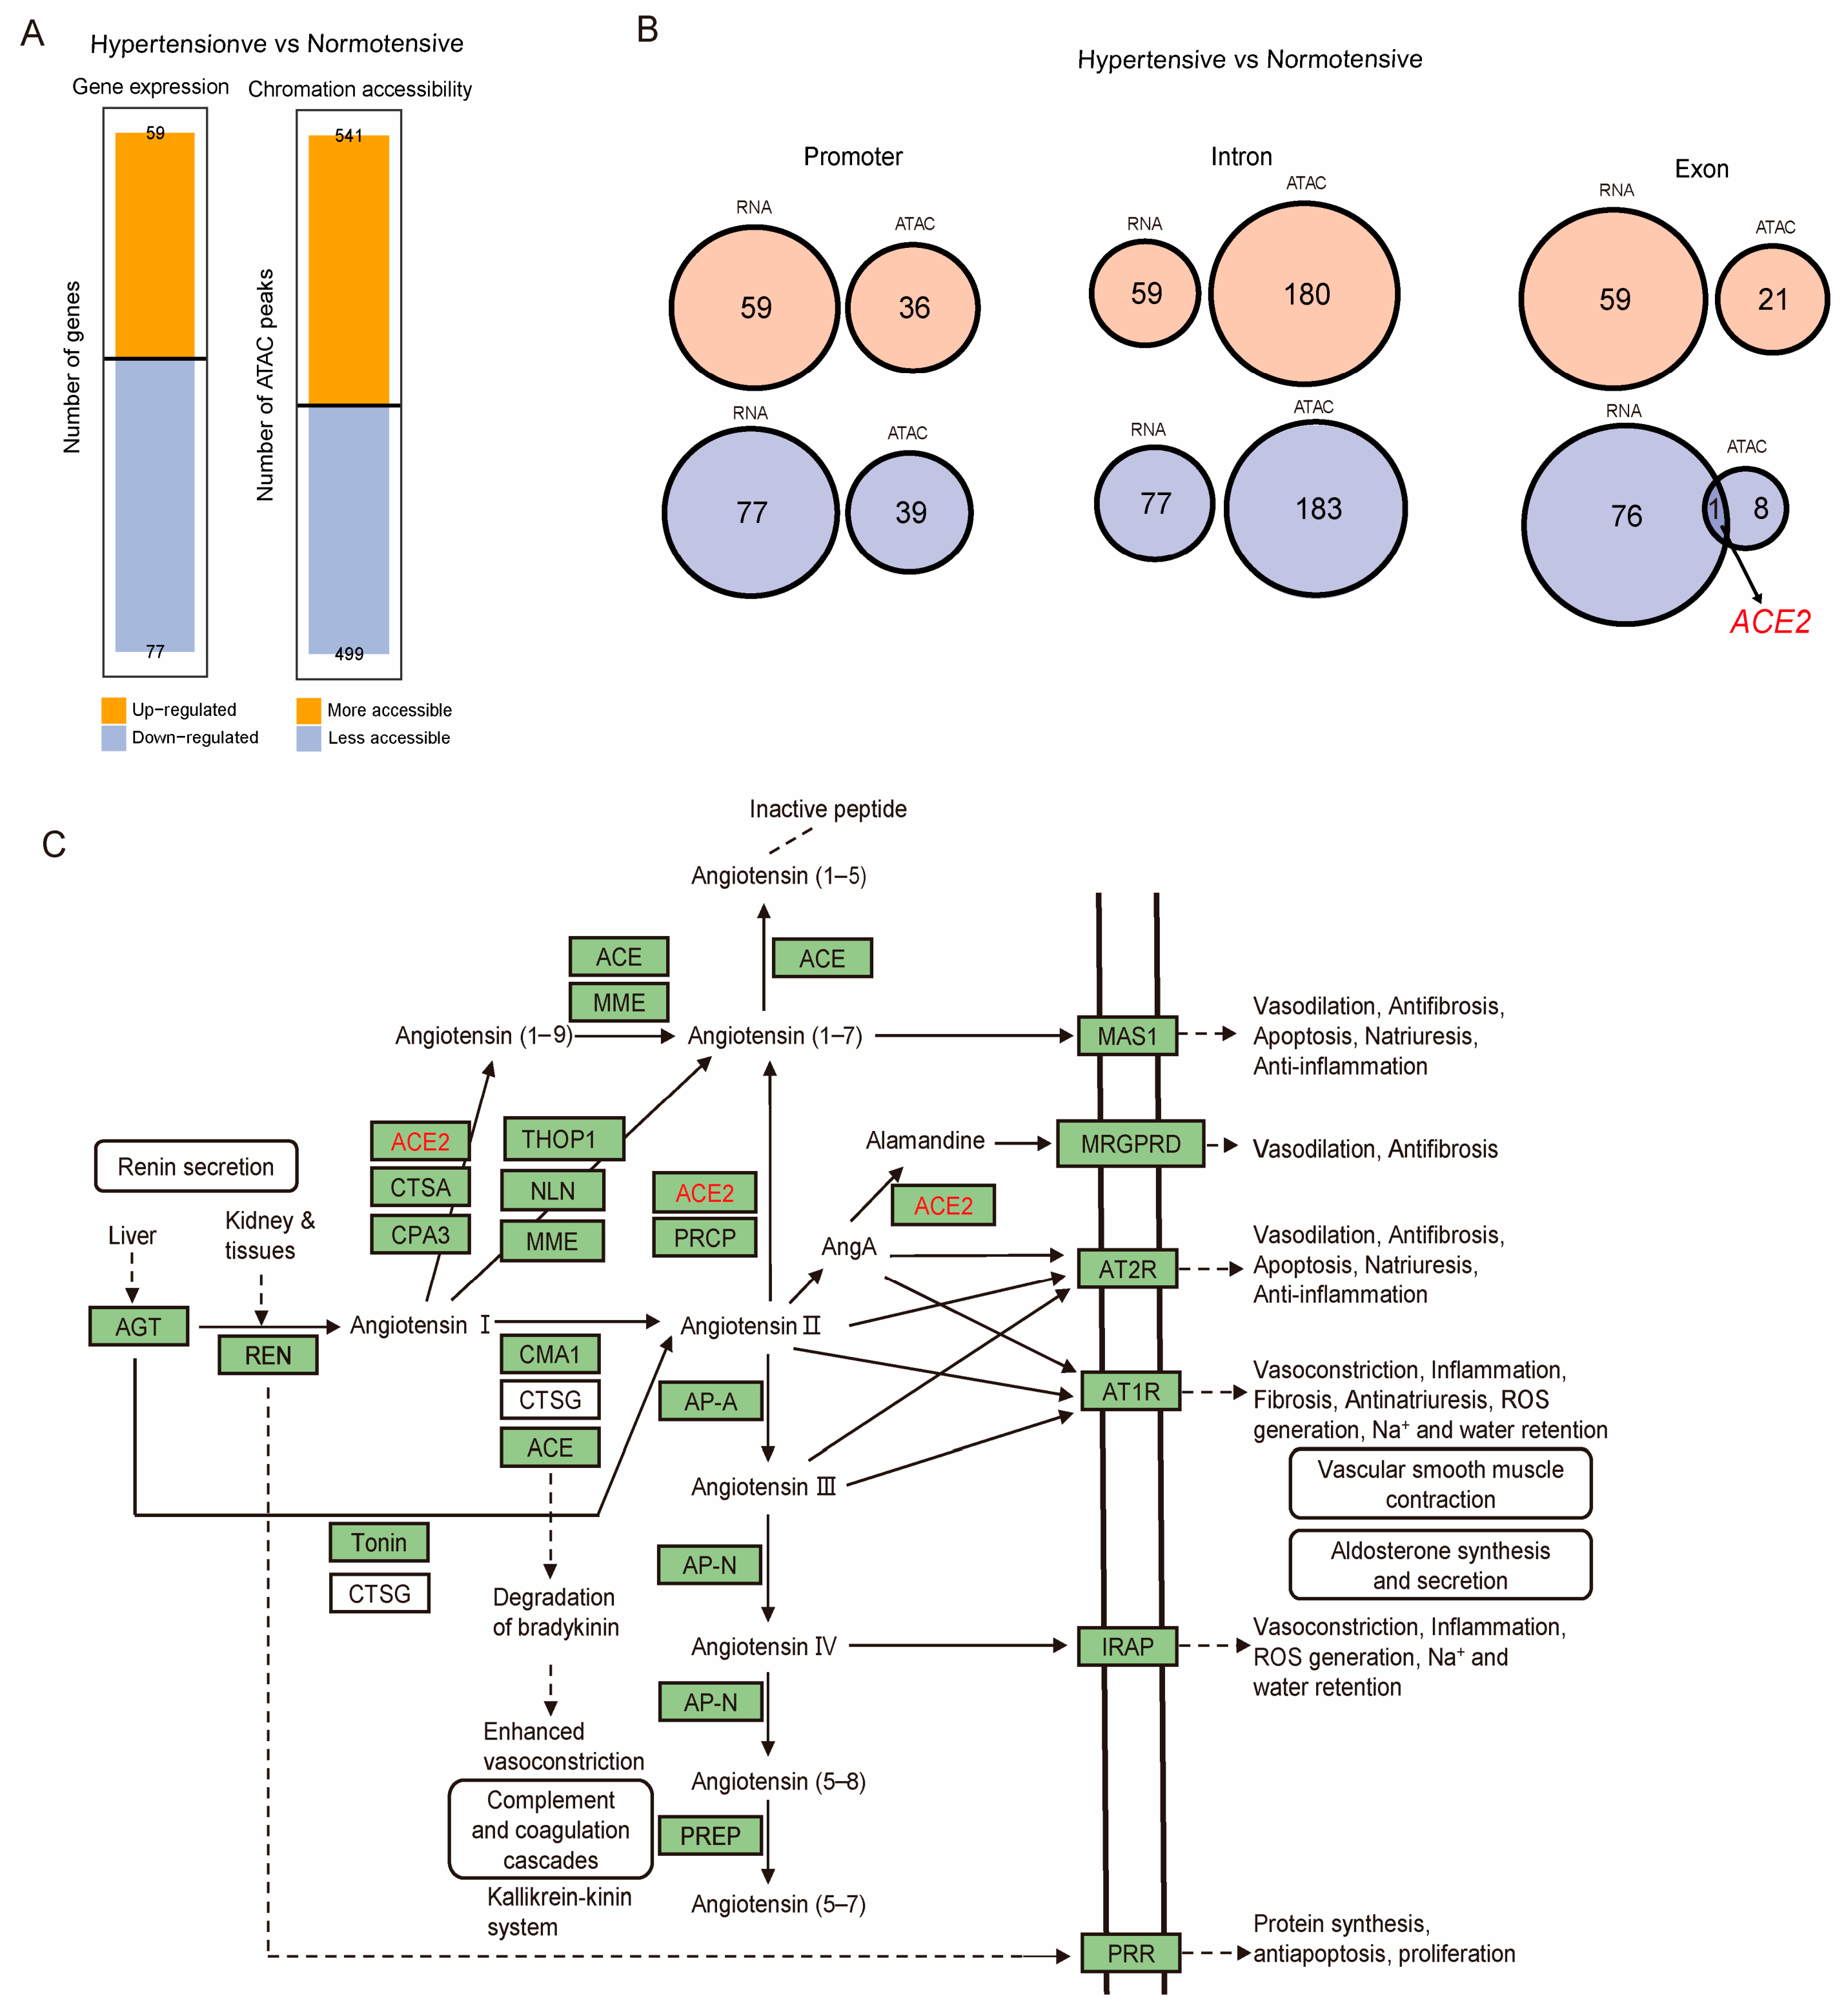
Integrated RNA-seq and ATAC-seq data revealed widespread differences in chromatin accessibility and gene transcription between hypertensive and normotensive giant pandas. Notably, the
ACE2 gene exhibited distinct chromatin accessibility alterations within exon regions, implying its critical involvement in hypertension regulation [
21]. The renin–angiotensin system (RAS) constitutes an intricate signaling network, where multiple enzymes and receptors coordinate angiotensin metabolism and downstream physiological outcomes. Within this cascade, hepatic angiotensinogen (AGT) is cleaved by renin to generate angiotensin I, which is subsequently processed into bioactive angiotensin II by ACE. Angiotensin II elevates blood pressure via AT1 receptor (AT1R) binding, triggering vasoconstriction, sodium and water retention, and other pro-hypertensive effects. Overall, RAS is central to blood pressure homeostasis and fluid balance [
22]. Perturbations to this system, particularly an altered ACE/ACE2 activity ratio, are frequently linked to hypertension and cardiovascular disorders [
23]. ACE2 plays a protective role in the cardiovascular system by promoting the production of Ang-(1–7), a metabolite that can promote vasodilation and anti-inflammatory responses through Mas receptors [
24]. Therefore, the function of ACE2 is considered to have potential value in treating hypertension and related cardiovascular abnormalities. Current research indicates that abnormal activation of RAS is not only associated with hypertension but also closely related to metabolic syndrome and renal lesions. This is because the AT1 signaling pathway not only affects the contraction of vascular smooth muscle but also regulates the synthesis of aldosterone, a hormone that controls sodium reabsorption and potassium secretion [
25]. Further research indicates that a decrease in
ACE2 levels may increase the risk of cardiovascular events, while its moderate expression can slow down the progression of hypertension [
26]. Nevertheless, it should be noted that
ACE2 transcript and chromatin accessibility signals detected in peripheral whole blood cannot fully recapitulate local RAS activity in vascular, renal or cardiac tissues. Peripheral blood
ACE2 levels are largely shaped by circulating immune cell proportions and systemic inflammatory status, which represent systemic inflammatory signatures rather than tissue-specific cardiovascular RAS function. Despite this limitation, the coordinated transcriptional and chromatin-level suppression of
ACE2 observed in hypertensive blood samples still reflects systemic RAS disturbance under hypertensive status, providing a molecular signature linked to hypertension progression in giant pandas.
Our multi-omics integration analysis identified coordinated reduced transcription and exon chromatin accessibility of ACE2 in hypertensive giant pandas, but we acknowledge several limitations of this correlative observation. First, only a single overlapping gene (ACE2) was detected within exon regions when intersecting DEGs and DAP-associated genes, which restricts the robustness of our integrated regulatory inference. Furthermore, concurrent changes in mRNA abundance and chromatin accessibility do not constitute definitive proof that chromatin opening status mechanistically controls ACE2 transcription; ATAC-seq only reflects bulk chromatin accessibility rather than direct transcription factor binding events. In addition, independent qPCR validation of ACE2 expression could not be implemented in the present study. As an endangered protected species, blood sampling of giant pandas is highly restricted by conservation protocols, and all collected peripheral blood from the six experimental individuals was fully consumed for RNA-seq and ATAC-seq library preparation, leaving no residual specimen for orthogonal verification. We plan to continuously monitor captive geriatric giant pandas with stable hypertensive phenotypes and recruit additional age-matched normotensive controls in subsequent years, and we will perform qPCR validation of ACE2 expression using newly acquired blood samples to verify the candidate molecular signature reported in this exploratory small cohort study.
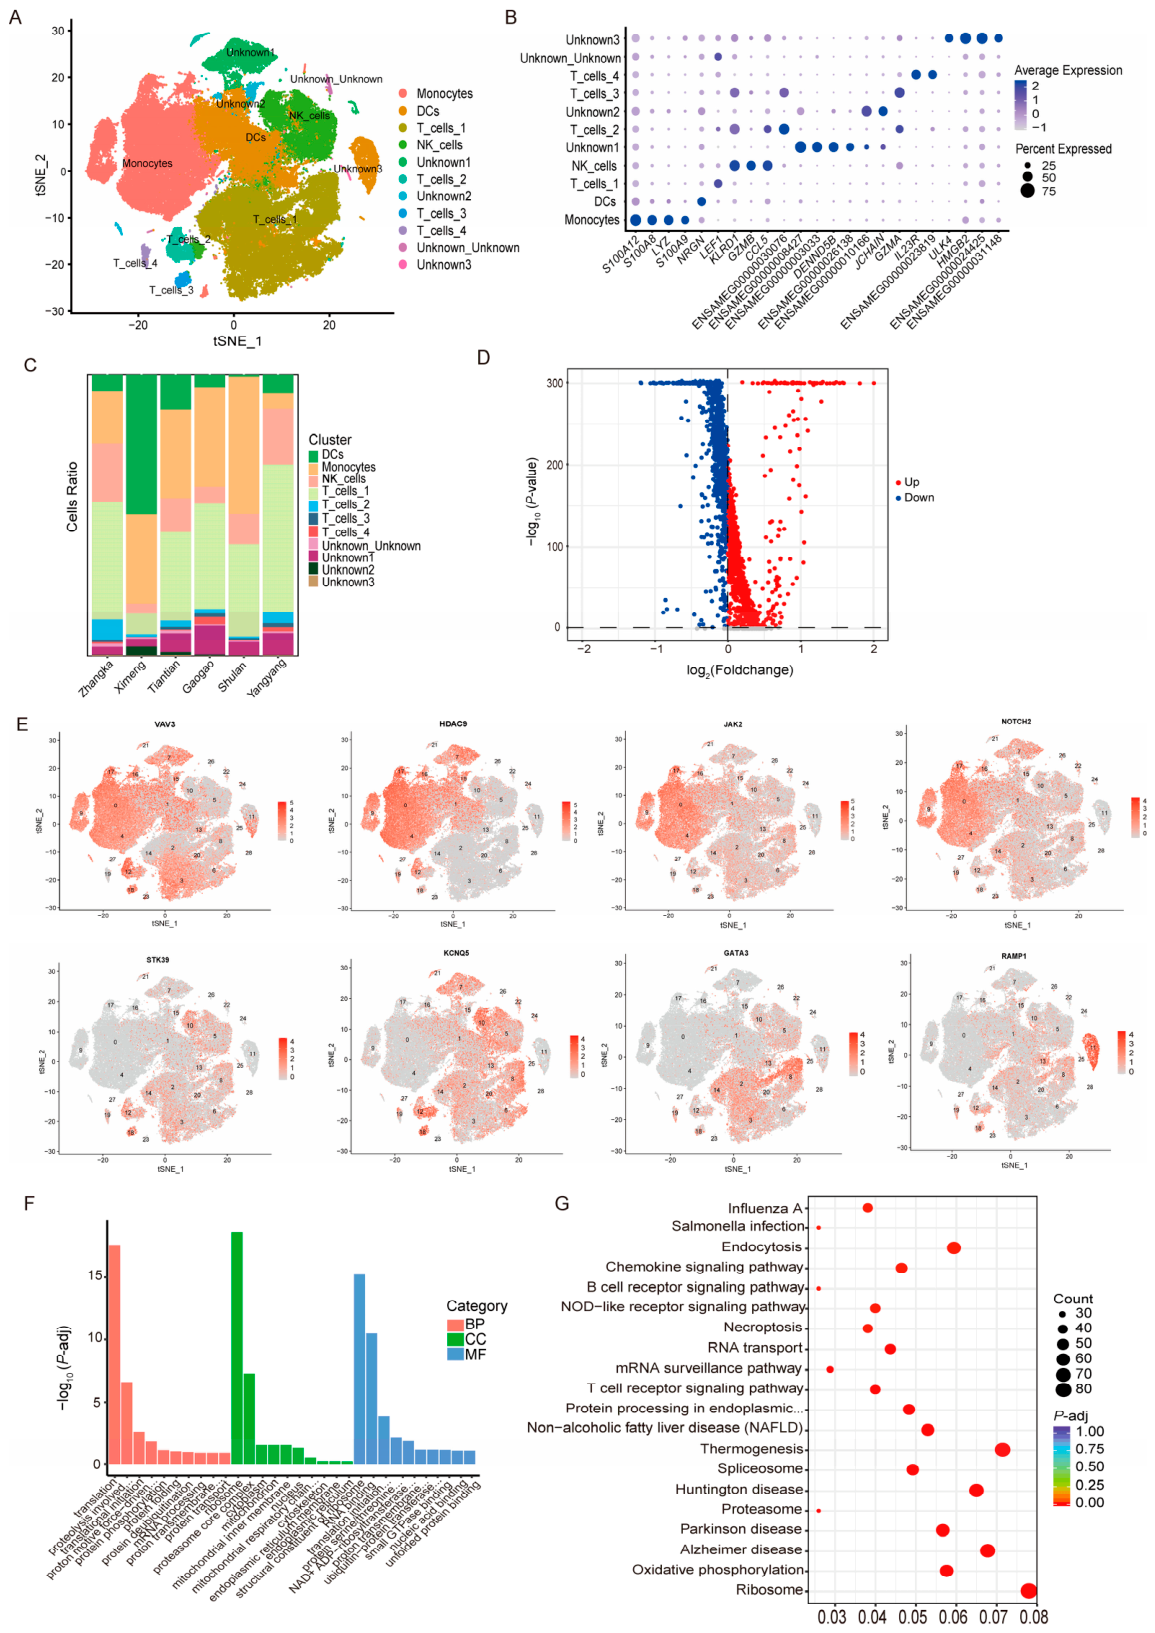
The exploration and analysis of cell-type-specific marker genes have enabled us to uncover the complex changes in cell populations under pathological conditions such as hypertension. By annotating and classifying cells using specific marker genes, we identified 11 clusters, including the known monocytes, DCs, NK cells, various T cell subgroups, and multiple unknown cell clusters. This classification method relies on marker genes such as
IL7R,
S100A8,
FRY and
KLRD1, etc., to help identify specific immune cell types and highlight the potential function of each cell in immune responses and diseases [
27]. However, this study lacks a species-matched giant panda immune cell reference transcriptome atlas for robust cell type classification. The putative dendritic cell populations (clusters 1, 11, 13, 28) were annotated based on non-canonical enriched genes FRY, NRGN and CADPS2, and this assignment carries moderate confidence and should be interpreted cautiously. Definitive DC identity validation will require future multi-species comparative immune profiling and immunophenotyping experiments. All poorly characterized unclassified cell clusters with low annotation confidence are listed in
Supplementary Table S4, and we should avoid functional speculation for these ambiguous populations throughout the analysis. It is well acknowledged that transcriptional signals captured by bulk whole blood RNA-seq are strongly confounded by dynamic shifts in peripheral immune cell composition, which makes it difficult to distinguish whether gene expression changes originate from altered cell proportions or intrinsic transcriptional regulation within specific cell populations. To resolve this confounding factor, we leveraged our single-cell RNA-seq dataset to map the cell type distribution of
ACE2 and other hypertension-associated differentially expressed genes across all annotated immune clusters. Our research found that the differential genes related to blood pressure are concentrated in monocytes, T cells and unknown cells, revealing the key role of these cells in blood pressure regulation. For instance, genes such as
VAV3, HDAC9 and
JAK2 play significant roles in immune responses and signal transduction, suggesting their contribution to the development of hypertension [
28]. In addition, genes such as
STK39,
KCNQ5 and
RAMP1 are associated with ion channels and signaling pathways, suggesting that the dysfunction of ion channels may be associated with an important mechanism of hypertension [
29]. However, we did not detect specific expression of
ACE2 in monocytes or T cells at single-cell resolution;
ACE2 transcripts were barely detectable across the major circulating immune cell clusters profiled herein. This discrepancy between bulk and single-cell transcriptomic profiles implies that the overall reduction in
ACE2 abundance observed in bulk peripheral blood may not stem from intrinsic transcriptional suppression within mainstream monocytic and T lymphocyte populations. Instead, the bulk-level
ACE2 downregulation is likely driven by rare non-lymphoid blood cell populations, or indirectly mediated by systemic inflammatory remodeling of peripheral immune microenvironment under hypertensive conditions. The GO and KEGG analyses further supported the enrichment of these genes in the structural and functional participation of ribosomes, highlighting the significance of protein synthesis and its regulation in the pathology of hypertension. The enrichment of ribosome-related pathways may indicate metabolic adjustments in cells in response to hypertensive stress, suggesting that specific protein translation processes may be affected, thereby participating in the progression and regulation of the disease [
30].
The accuracy of cell subtype classification in this study is constrained by the extreme scarcity of species-specific immune transcriptomic resources for giant pandas. No dedicated giant panda immune single-cell reference atlas has been established to enable high-confidence label transfer. Although we integrated conserved mammalian canonical immune markers and cluster-specific signature genes for cell assignment, many classic human and mouse immune marker homologs show weak or absent expression in giant panda peripheral blood cells, limiting their utility for annotation. Accordingly, multiple cell clusters could not be reliably assigned to known immune subtypes and were labeled as “unknown”. For the identified dendritic cell population, FRY, NRGN and CADPS2 were the most statistically specific signature genes detected in our dataset, rather than canonical DC markers commonly reported in model mammals. Future large-scale single-cell profiling of giant panda immune cells across more individuals will help build a species-specific reference atlas, resolve uncharacterized unknown clusters, and validate cell-type-specific marker genes unique to giant pandas.
We only described visual trends in cell type relative abundance across samples without formal compositional statistical analysis to quantify group differences. Moreover, the study cohort is limited to merely three giant pandas in each group, which results in low statistical power to distinguish hypertension-specific cell composition shifts from natural inter-individual variation. The visually observed divergent trends in cell abundance should only be regarded as preliminary observational clues rather than reliable disease-linked signatures. Expanded cohorts of age-matched hypertensive and normotensive giant pandas are needed in follow-up research to conduct rigorous compositional analysis and validate whether immune cell composition correlates with hypertensive phenotypes.
Our study included only six giant pandas, a small cohort that limits statistical power and the generalizability of our correlative molecular signatures. Constraints on sampling endangered giant pandas prevent recruitment of a larger sample set at this stage. Thus, all candidate hypertension-associated transcriptional and chromatin signatures discovered in this exploratory multi-omics work necessitate follow-up validation in enlarged independent giant panda cohorts before definitive biological interpretations can be drawn. In addition to the limited sample size, chronological age constitutes an important biological confounder between our hypertensive and normotensive cohorts. The three hypertensive giant pandas were born earlier than the normotensive individual. Notably, per the standard age grading criteria for captive giant pandas, all six experimental animals are classified as geriatric individuals, meaning no juvenile or middle-aged pandas were enrolled in this study, and all molecular profiling was performed exclusively on aged subjects. However, the age gap between groups still prevents us from completely separating hypertension-specific transcriptional and chromatin remodeling from progressive age-related molecular shifts in peripheral blood. In captive breeding systems, spontaneous sustained hypertension is almost exclusively diagnosed in geriatric giant pandas. Normotensive giant pandas of the exact same advanced age as our hypertensive cohort are extremely scarce and unavailable for sampling at present. We propose that future multi-omics studies recruiting perfectly age-balanced elderly hypertensive and normotensive giant pandas will be required to fully decouple progressive aging molecular changes from hypertension-specific alterations.
Our longitudinal RNA-seq profiling of hypertensive giant pandas following levamlodipine administration carries prominent interpretive limitations originating from the sampling schedule. We only collected a single baseline sample (h0) right before initial drug intake, without a prolonged series of matched no-drug baseline time points from identical individuals to establish rigorous within-animal self-control. Parallel untreated hypertensive cohorts and placebo groups were also unavailable due to giant panda conservation and veterinary clinical safety restrictions. This design deficit prevents us from fully disentangling levamlodipine-specific transcriptional responses from time-dependent background variation, including cumulative stress from repeated venipuncture, diurnal circadian transcriptional oscillation, consistent feeding routines and standardized animal handling procedures. Accordingly, all time-series gene expression patterns reported herein are only described as sequential molecular alterations observed across sampling time points after levamlodipine administration, rather than confirmed drug-specific pharmacodynamic transcriptional signatures. Future intervention studies on hypertensive giant pandas will integrate multiple matched pre-treatment baseline samples for each individual to strengthen the discrimination of drug-triggered molecular signals from non-specific temporal background fluctuations.
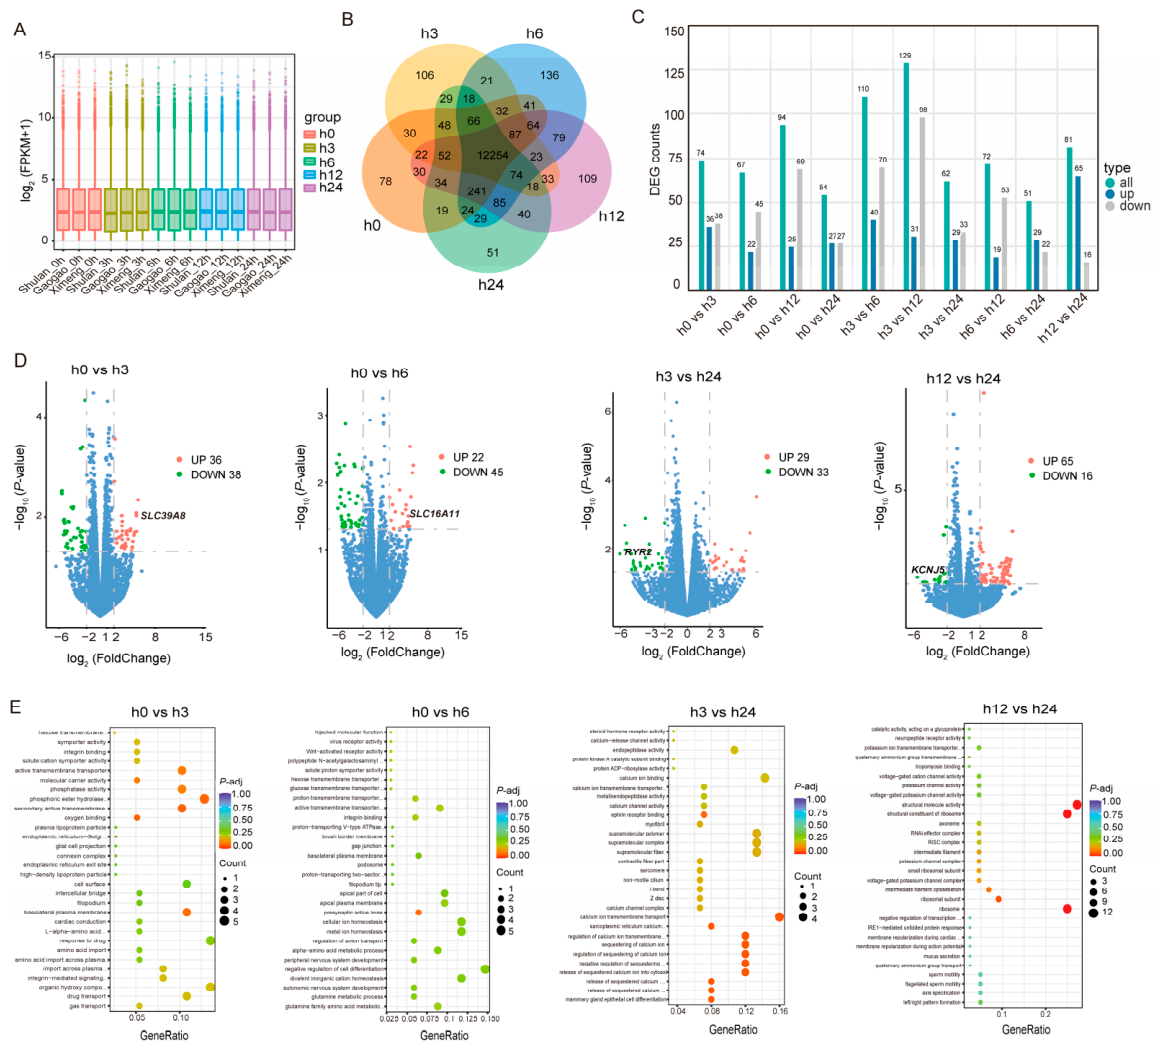
In this study, levamlodipine besylate tablets were orally administered to hypertensive giant pandas for routine clinical antihypertensive management, and serial peripheral blood RNA-seq was performed to characterize time-resolved transcriptomic alterations following drug exposure. Differential expression analysis identified elevated transcript levels of SLC39A8 and SLC16A11 from h0 to h6, corresponding to enrichment of metabolic biological processes. GO functional enrichment highlighted prominent enrichment of phosphate hydrolysis and oxygen transport activities, reflecting shifts in transcriptional programs linked to cellular metabolic and oxygen transport homeostasis across this early-to-middle sampling window. We also observed sustained reduced transcript abundance of RYR2 and KCNJ5 from mid to late time points, two genes functionally associated with calcium channel activity. This expression trend overlaps with suppressed transcriptional signatures of intracellular calcium storage and calcium signaling pathways reported in prior mammalian research [
31]. Time-series functional enrichment further revealed dynamic shifts in activated biological programs across sampling time points: early-stage transcriptional upregulation centered on oxygen transport and synaptic assembly processes, while later time points featured enhanced transcription linked to protein synthesis and ribosomal function. These sequential molecular shifts reflect layered, time-ordered transcriptional remodeling in peripheral blood cells following levamlodipine administration, capturing a progressive cellular transcriptional adaptation process across the 24 h sampling window. Notably, this dataset lacks synchronized serial blood pressure measurements collected at each RNA-seq time point, so the detected time-dependent transcriptomic changes cannot be definitively linked to levamlodipine-induced blood pressure reduction or validated antihypertensive pharmacodynamic effects. All observed gene and pathway transcriptional trajectories only represent descriptive molecular profiles captured after drug administration, and do not serve as direct evidence of phenotypic cardiovascular regulation or hypotensive activity. Future matched multi-omics research integrating parallel dynamic blood pressure monitoring will be required to verify whether these temporal transcriptional signatures correlate with actual hemodynamic improvements in hypertensive giant pandas. Further mechanistic exploration of these time-resolved molecular patterns may help inform optimized clinical medication regimens and improve understanding of long-term levamlodipine molecular responses in captive giant pandas.