
Transcriptomic and Proteomic Analyses of the Liver and Ileum Identify Key Genes and Pathways Associated with Low and High Groups of Social Genetic Effect of Residual Feed Intake

 , ,
, ,
Simple Summary
Abstract
1. Introduction
2. Methods
2.1. Ethical Approval
2.2. Animals
2.3. Data Collection and Social Status Evaluation
RFI and SGE Calculation
2.4. Sample Collection
2.5. RNA Sequencing and Quantification of Expression Levels
2.6. iTRAQ-Based Quantitative Proteomic Analysis
2.7. Weighted Gene Co-Expression Network Analysis
2.8. Analysis of DEG, DEP, and Module Enrichment Pathways
2.9. Validation of RT-qPCR
2.10. Statistical Analysis
3. Results
3.1. Variance Components of Residual Feed Intake from a Social Genetic Model
3.2. Comparative Analysis of Feeding Behavior and Growth Traits in Pigs with Extreme Social Genetic Effects
3.3. Differences in Transcriptome Profiles with Different Social Genetic Effects
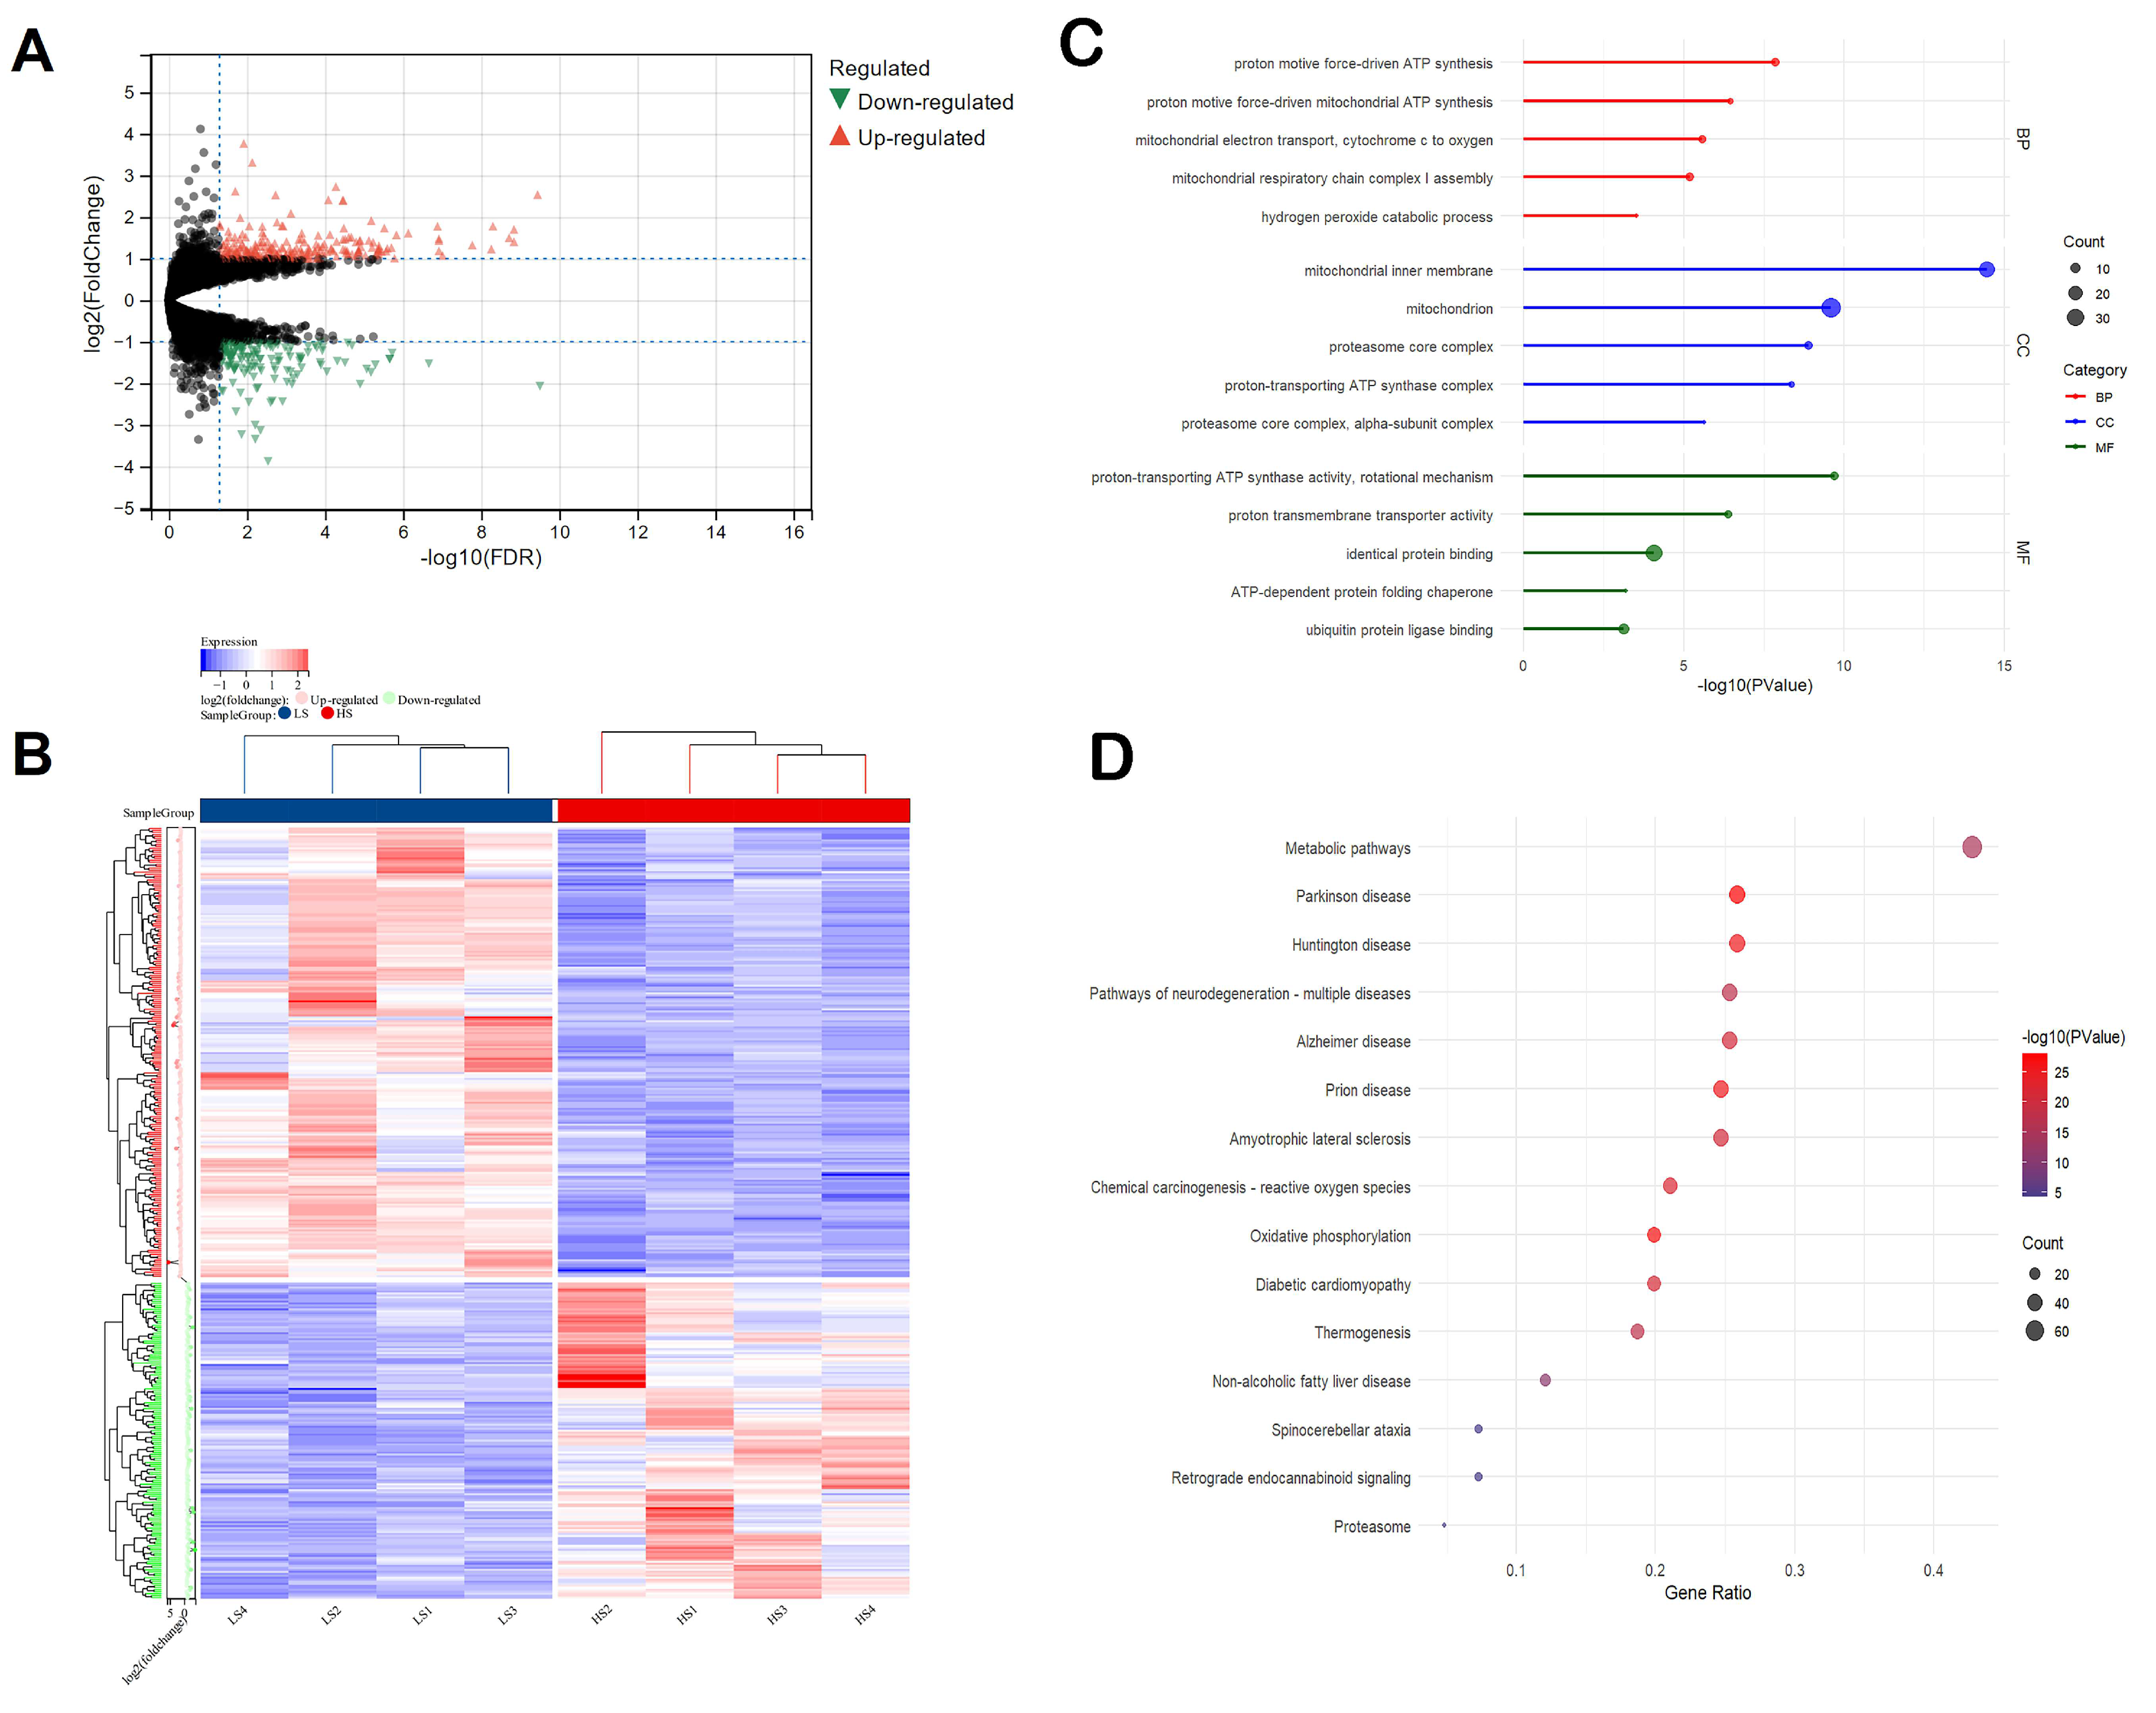
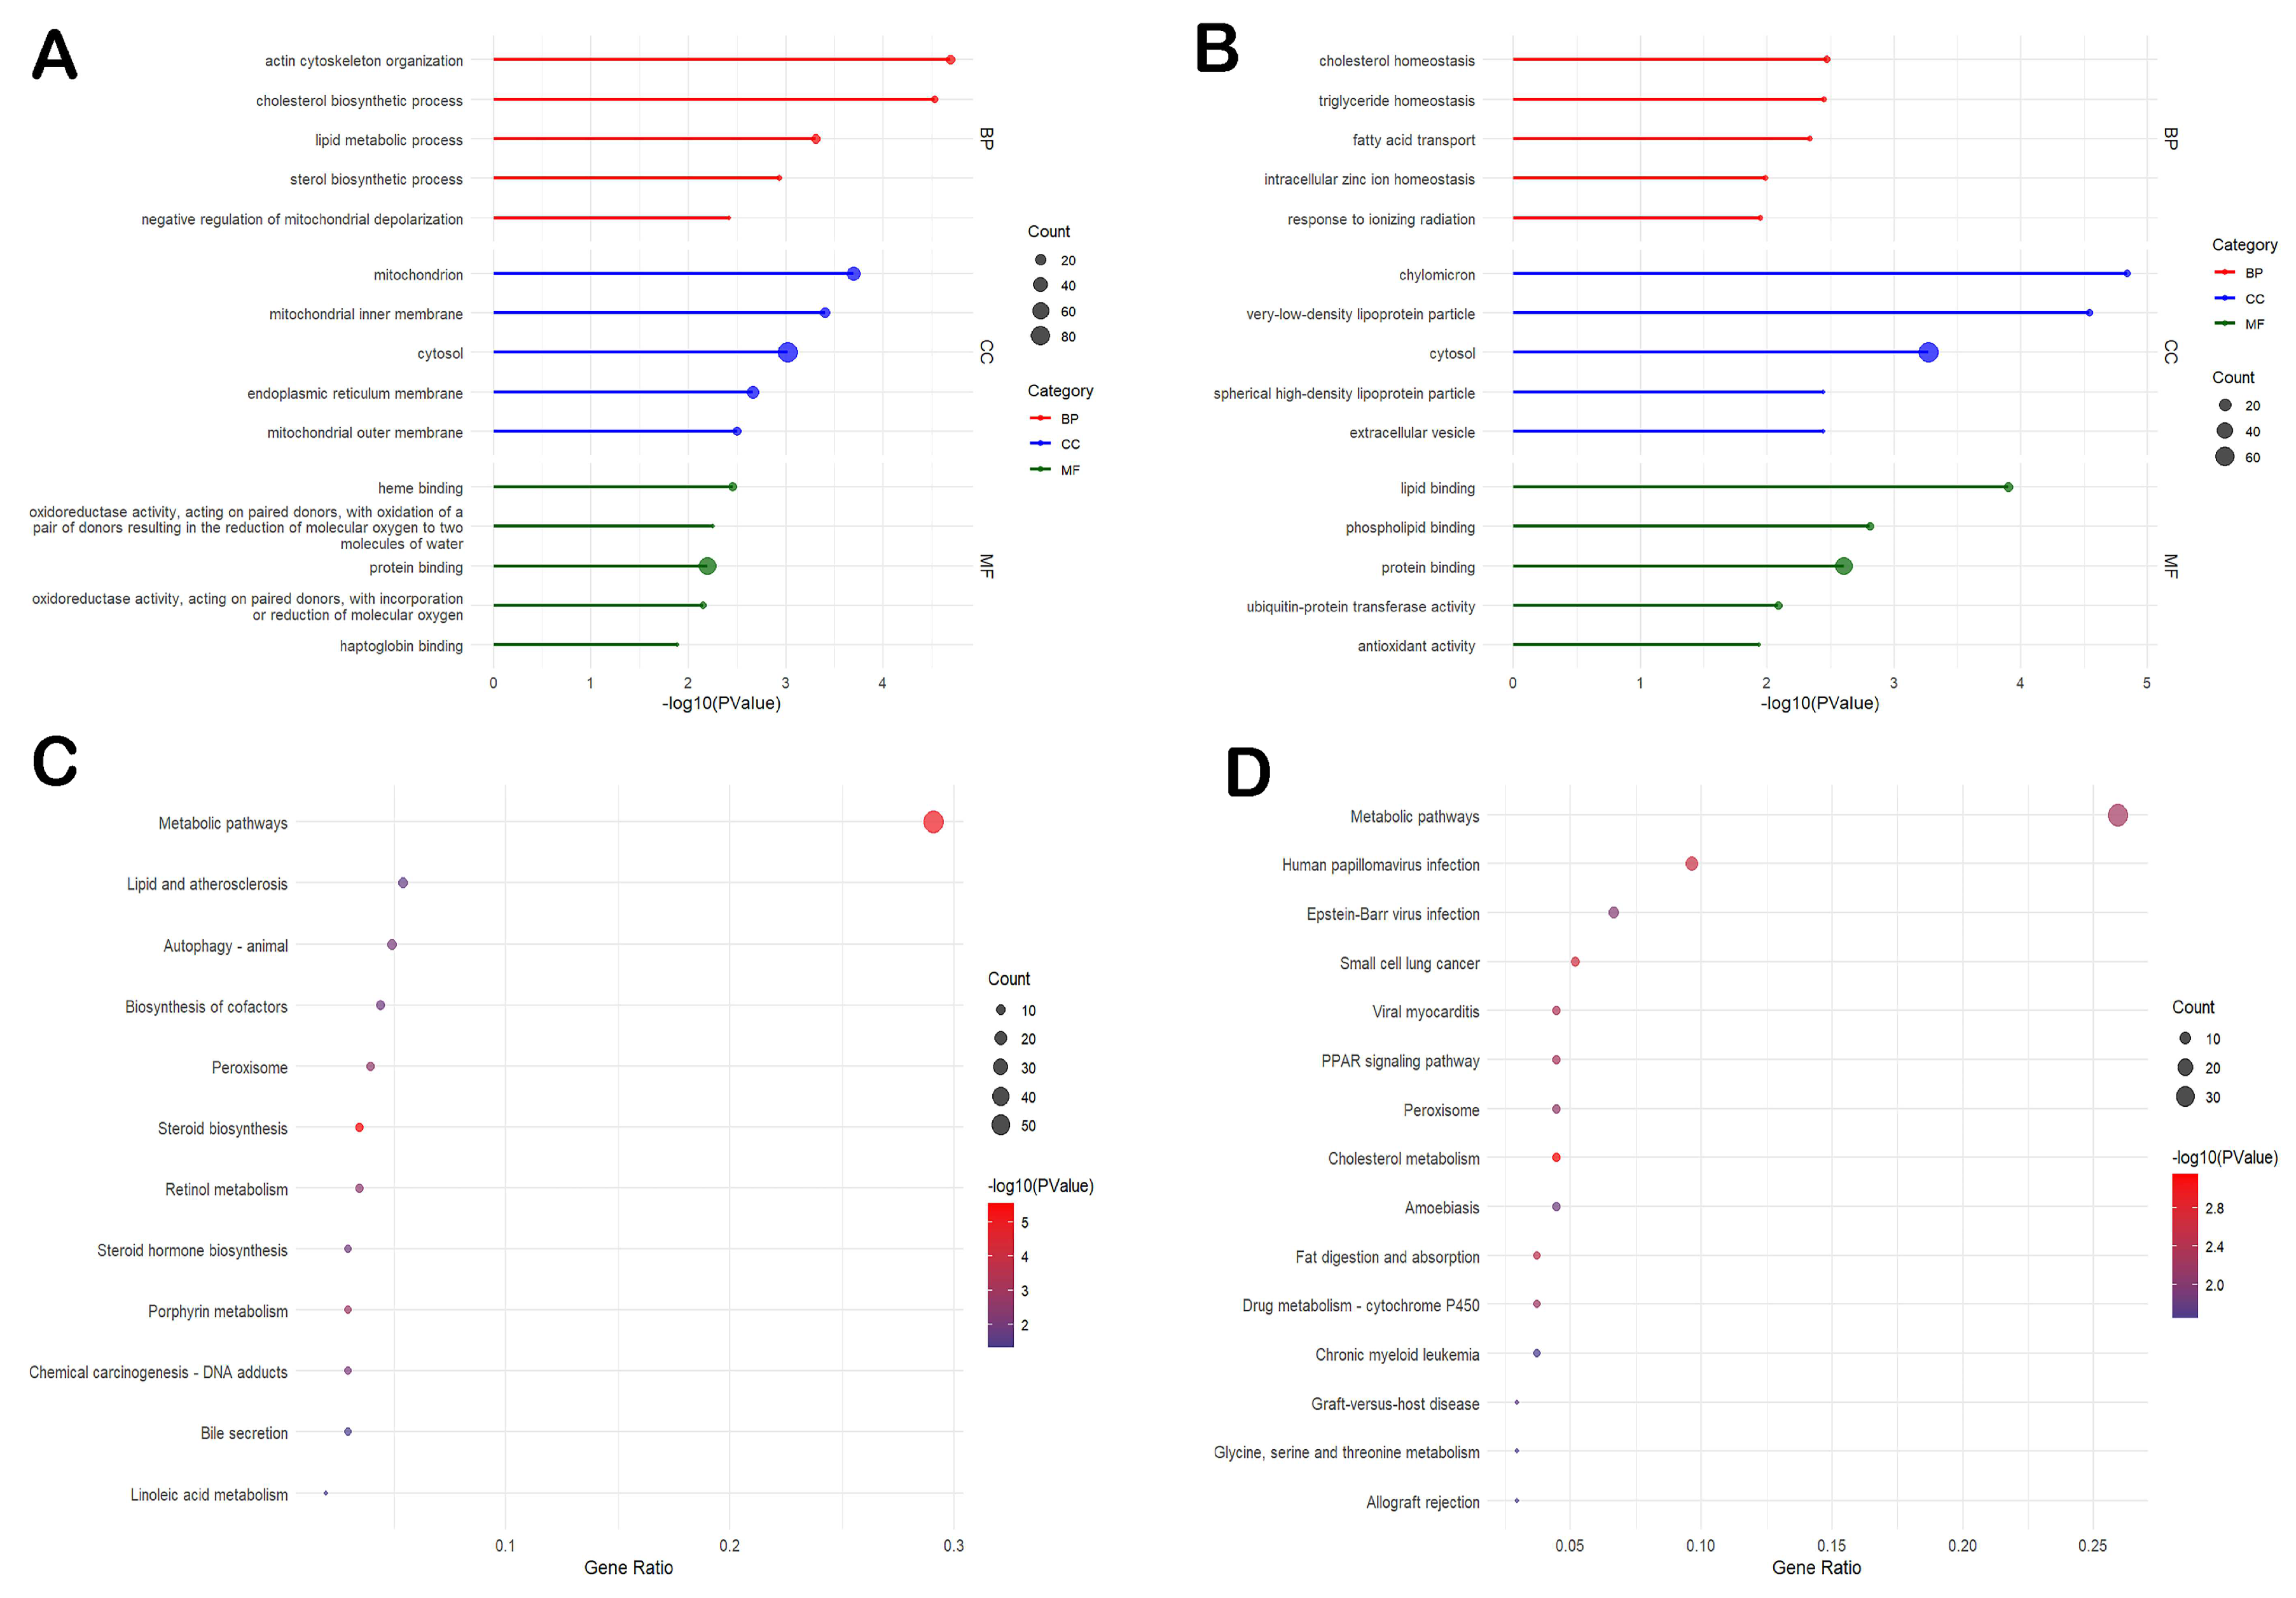
3.4. Differential Gene Expression in the Liver Is Mainly Related to Mitochondria Functions and Oxidative Phosphorylation
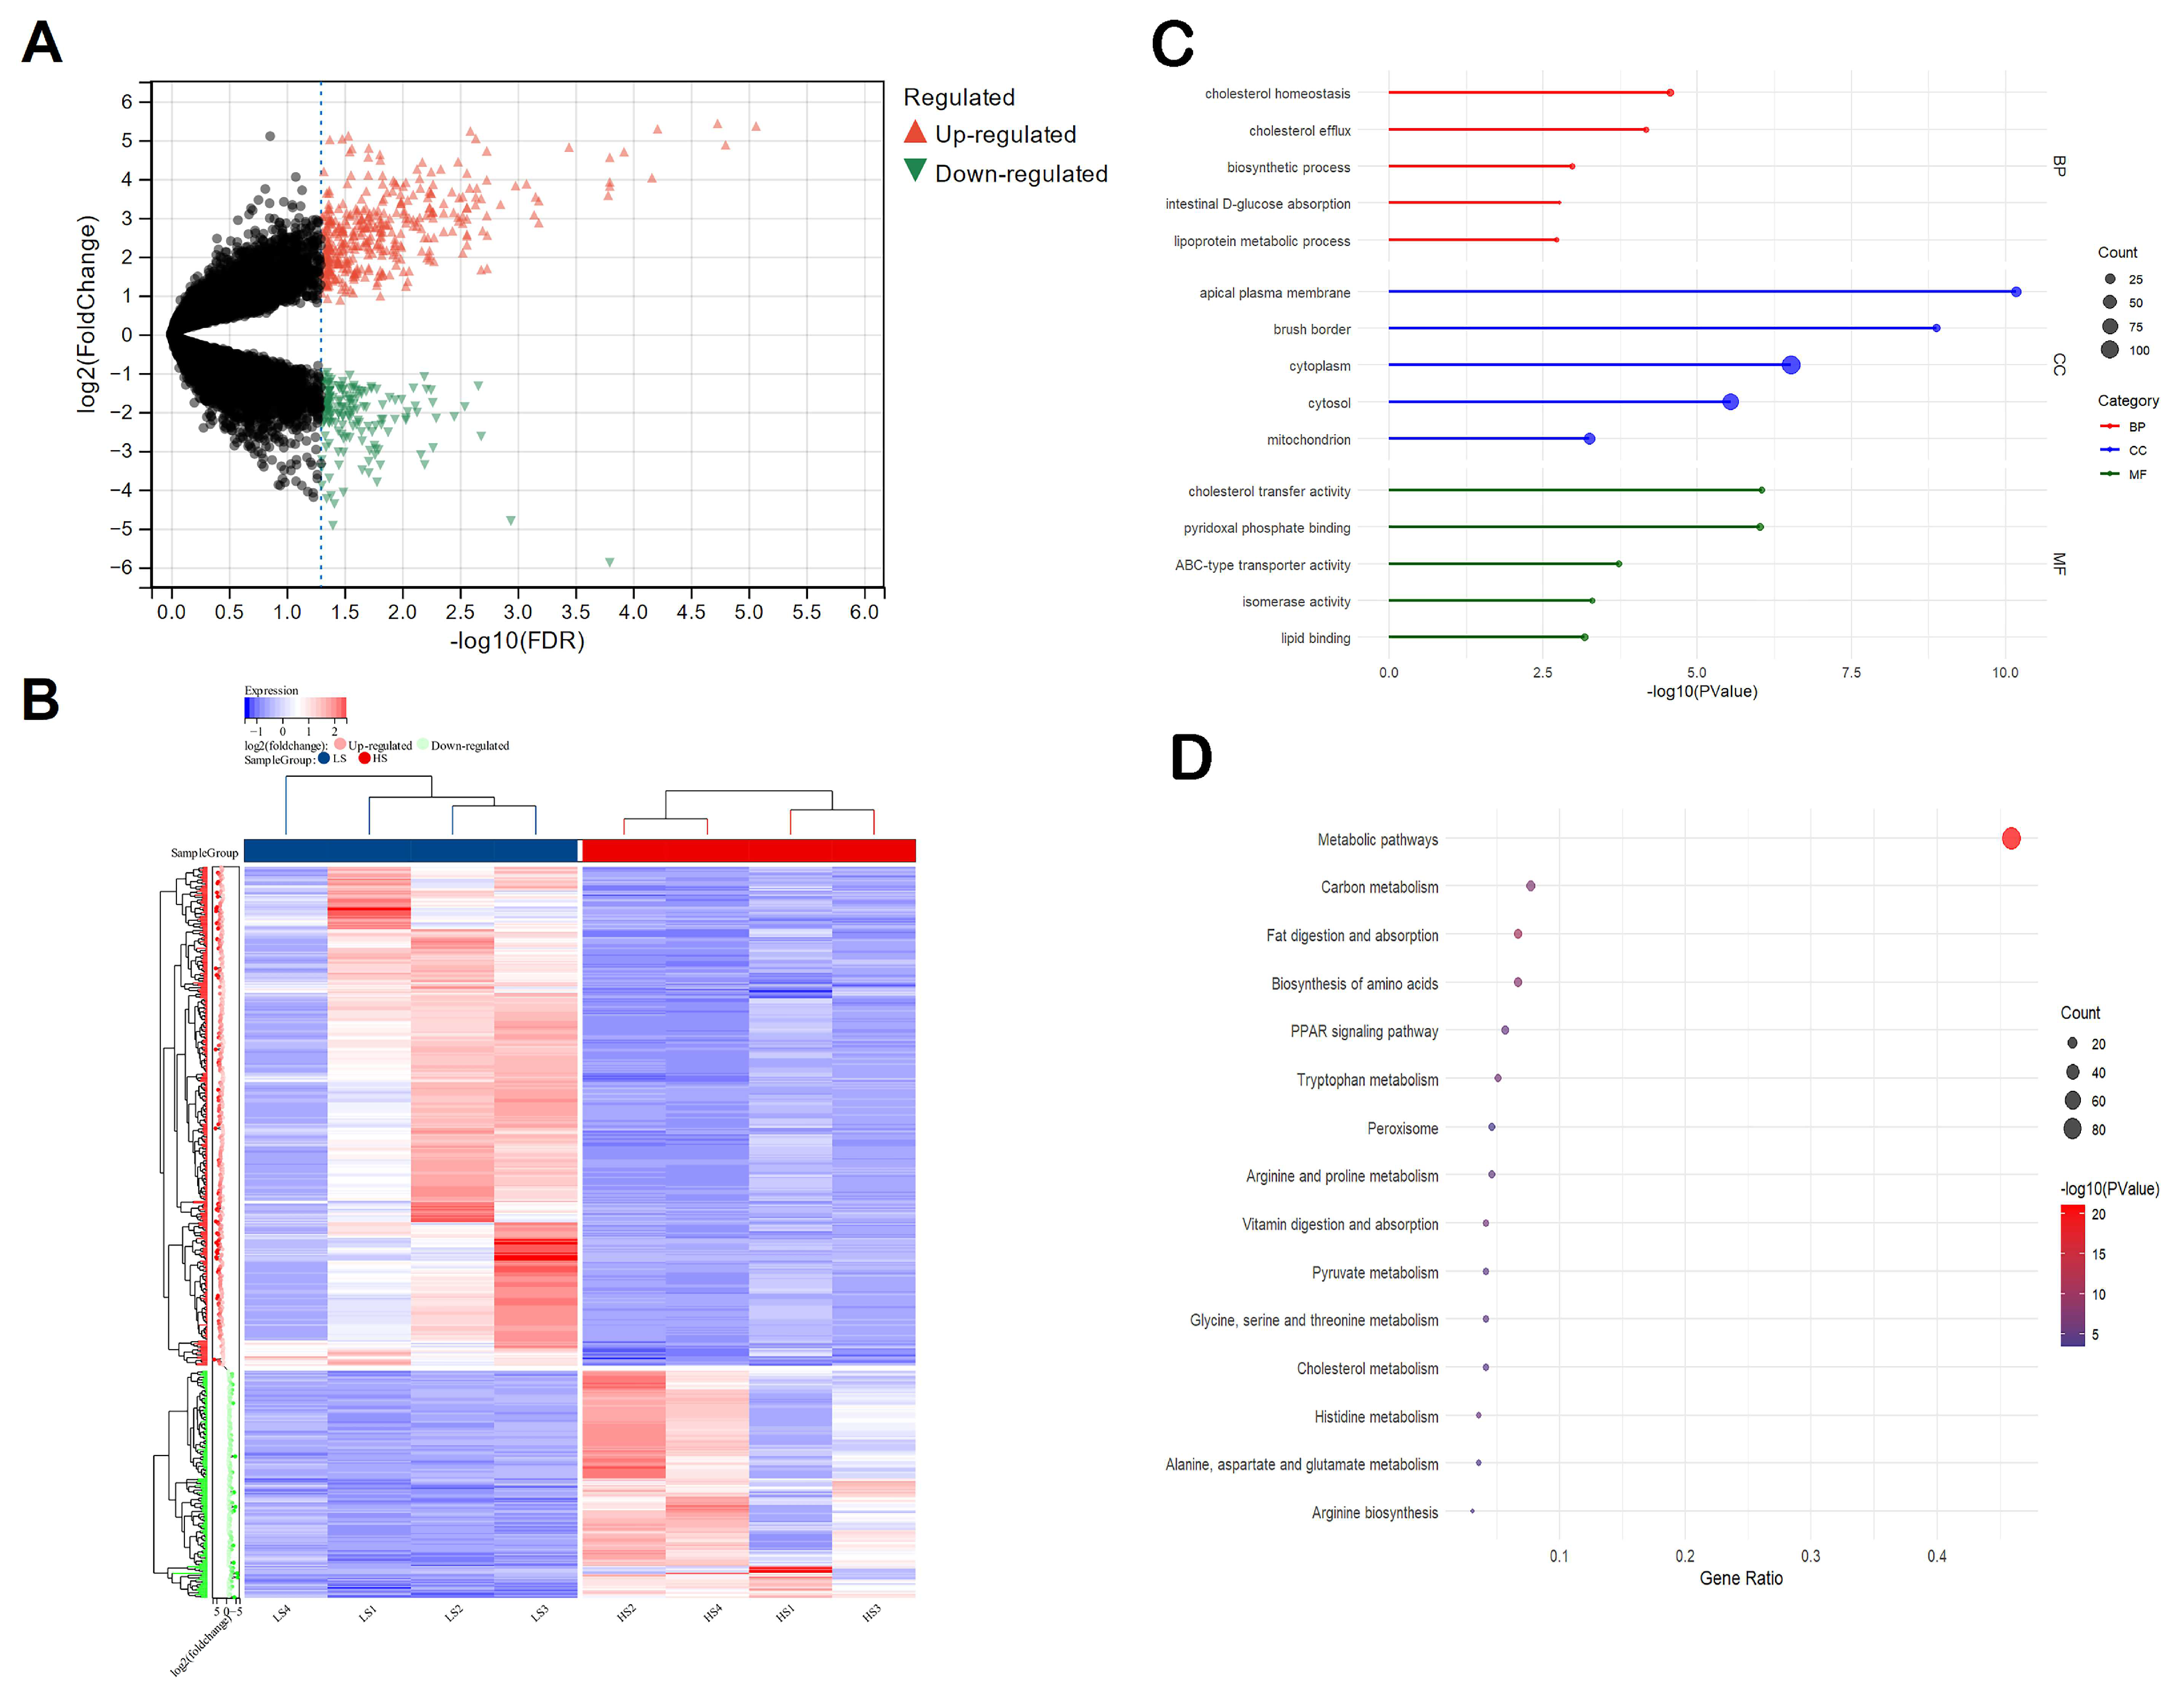
3.5. Differential Gene Expression in the Ileum Is Mainly Related to Cholesterol Metabolism, Fat Digestion and Absorption, and Amino Acid Biosynthesis
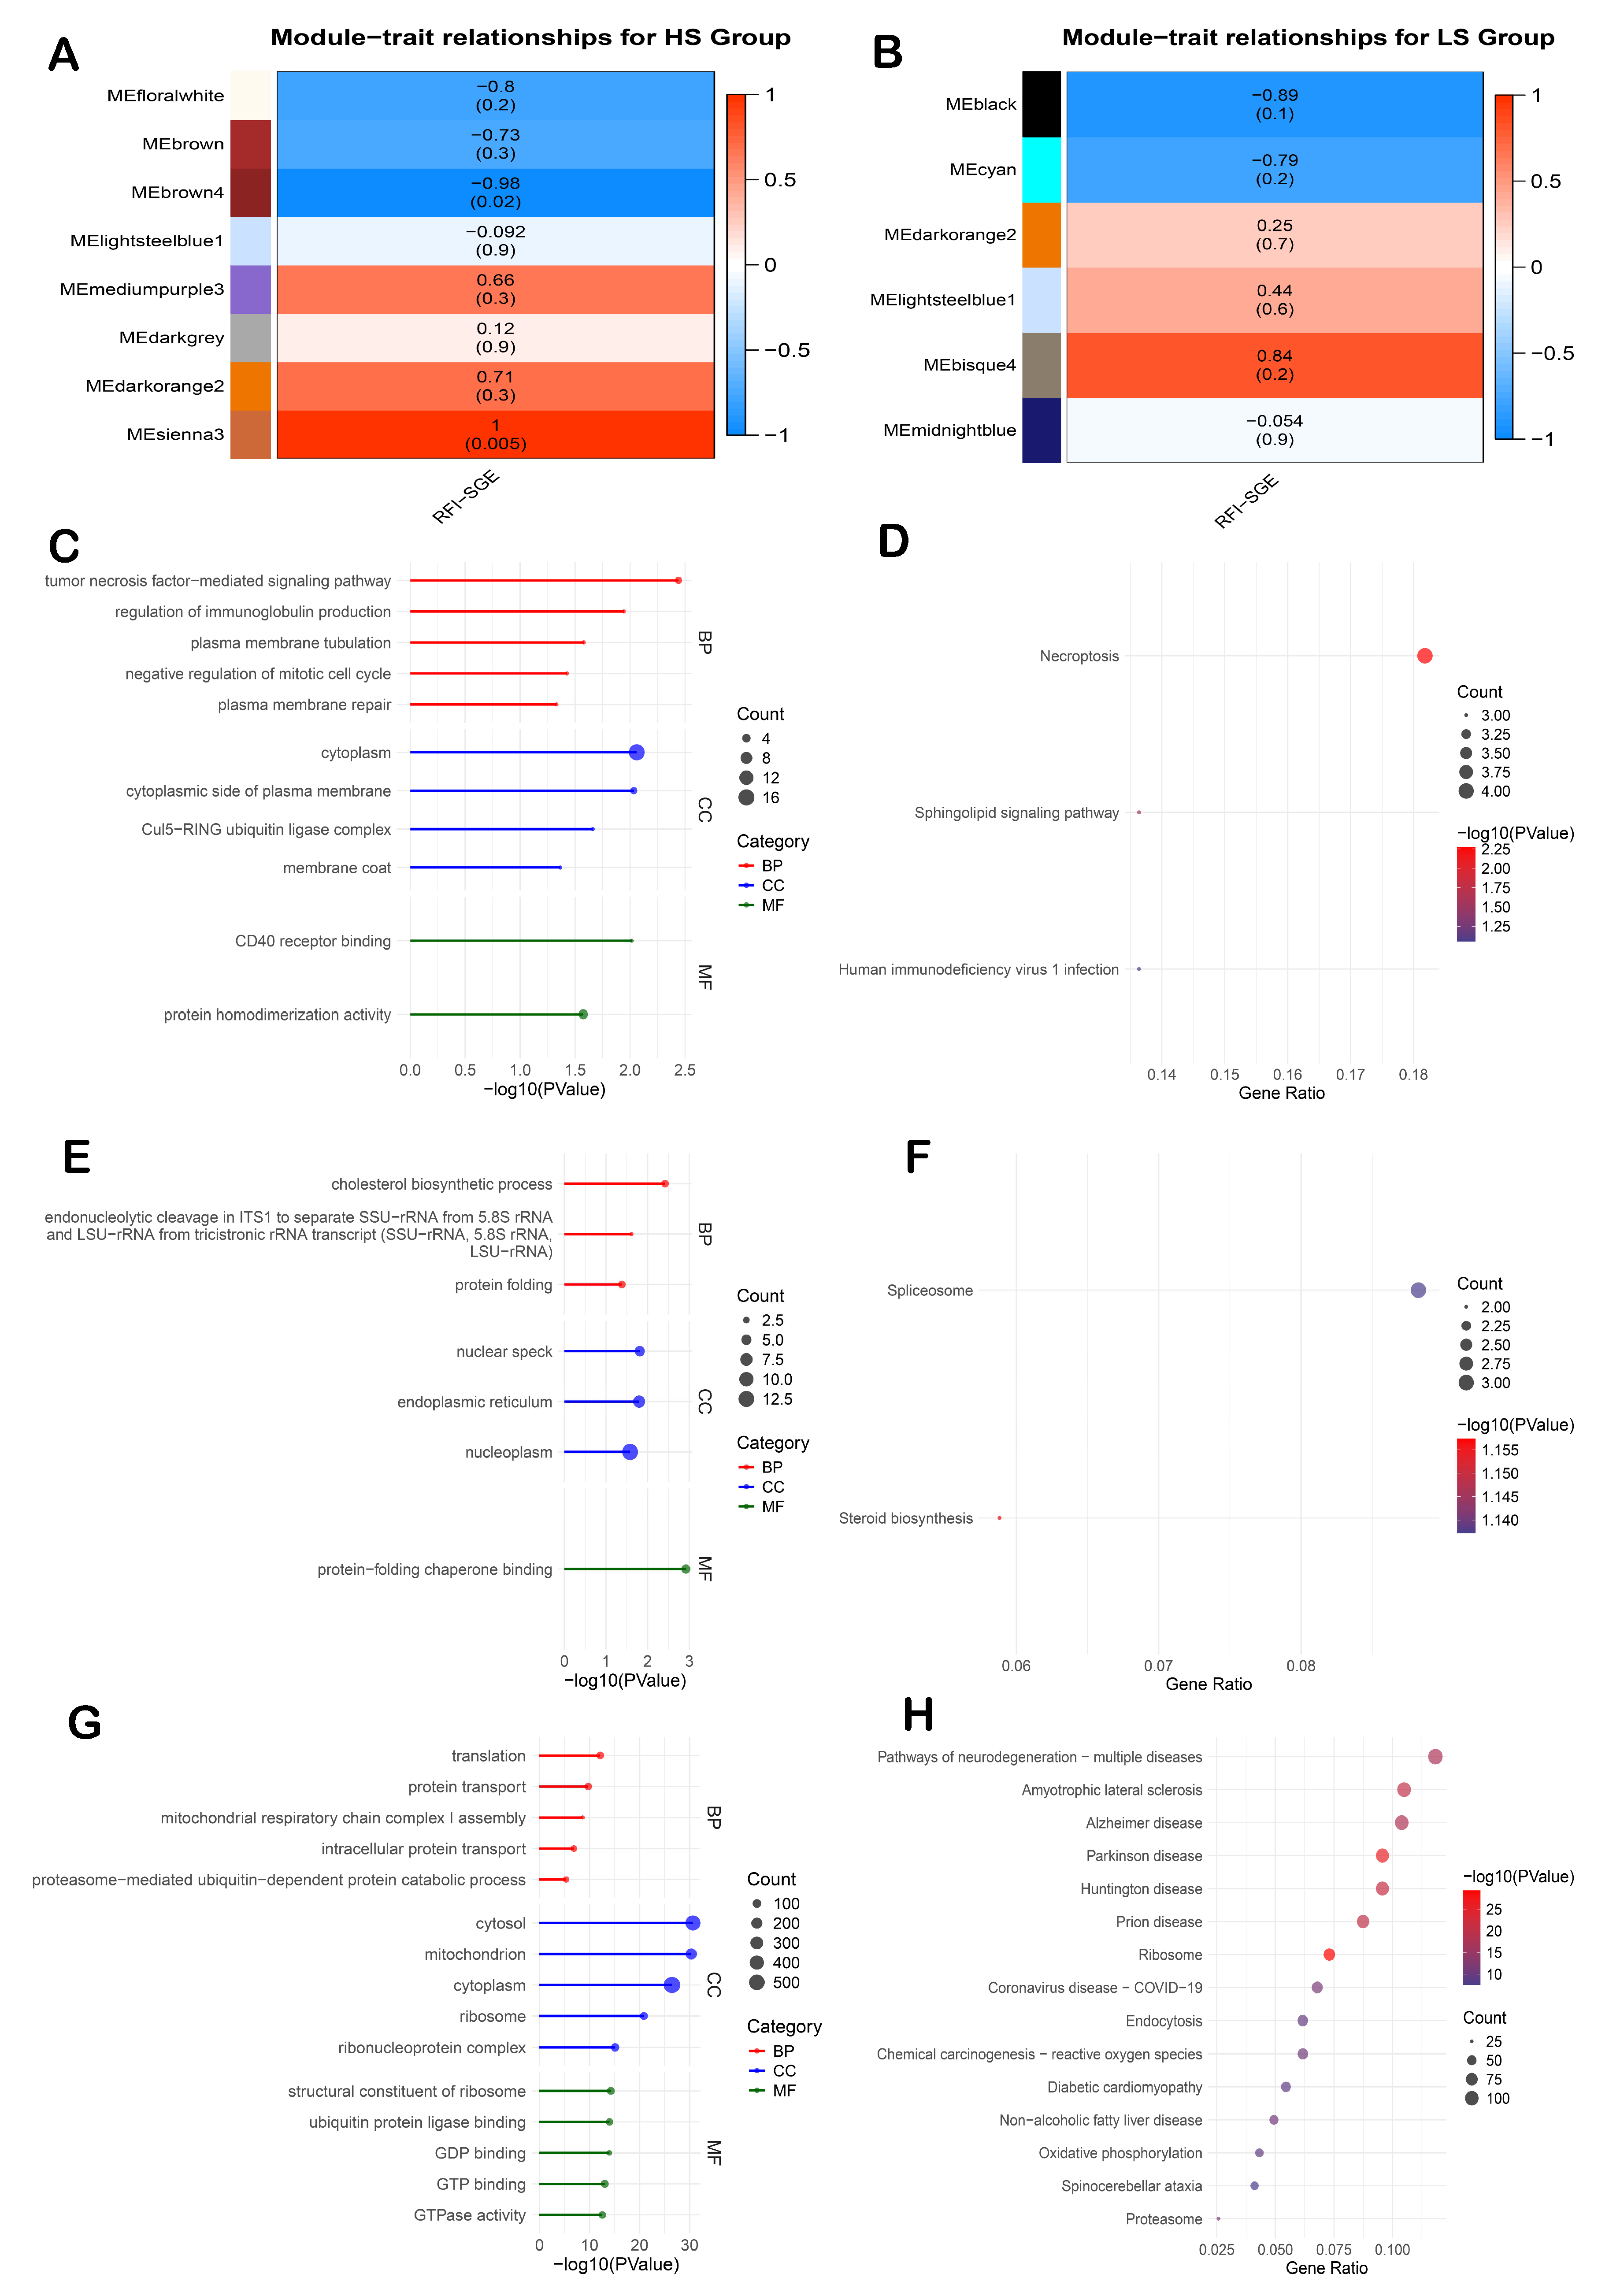
3.6. Co-Expression Modules in the Liver Are Associated with Immune Regulation, Cholesterol Metabolism, and Mitochondrial Function
3.7. Co-Expression Modules in the Ileum Are Associated with Fatty Acid Metabolism and Protein Degradation Pathways
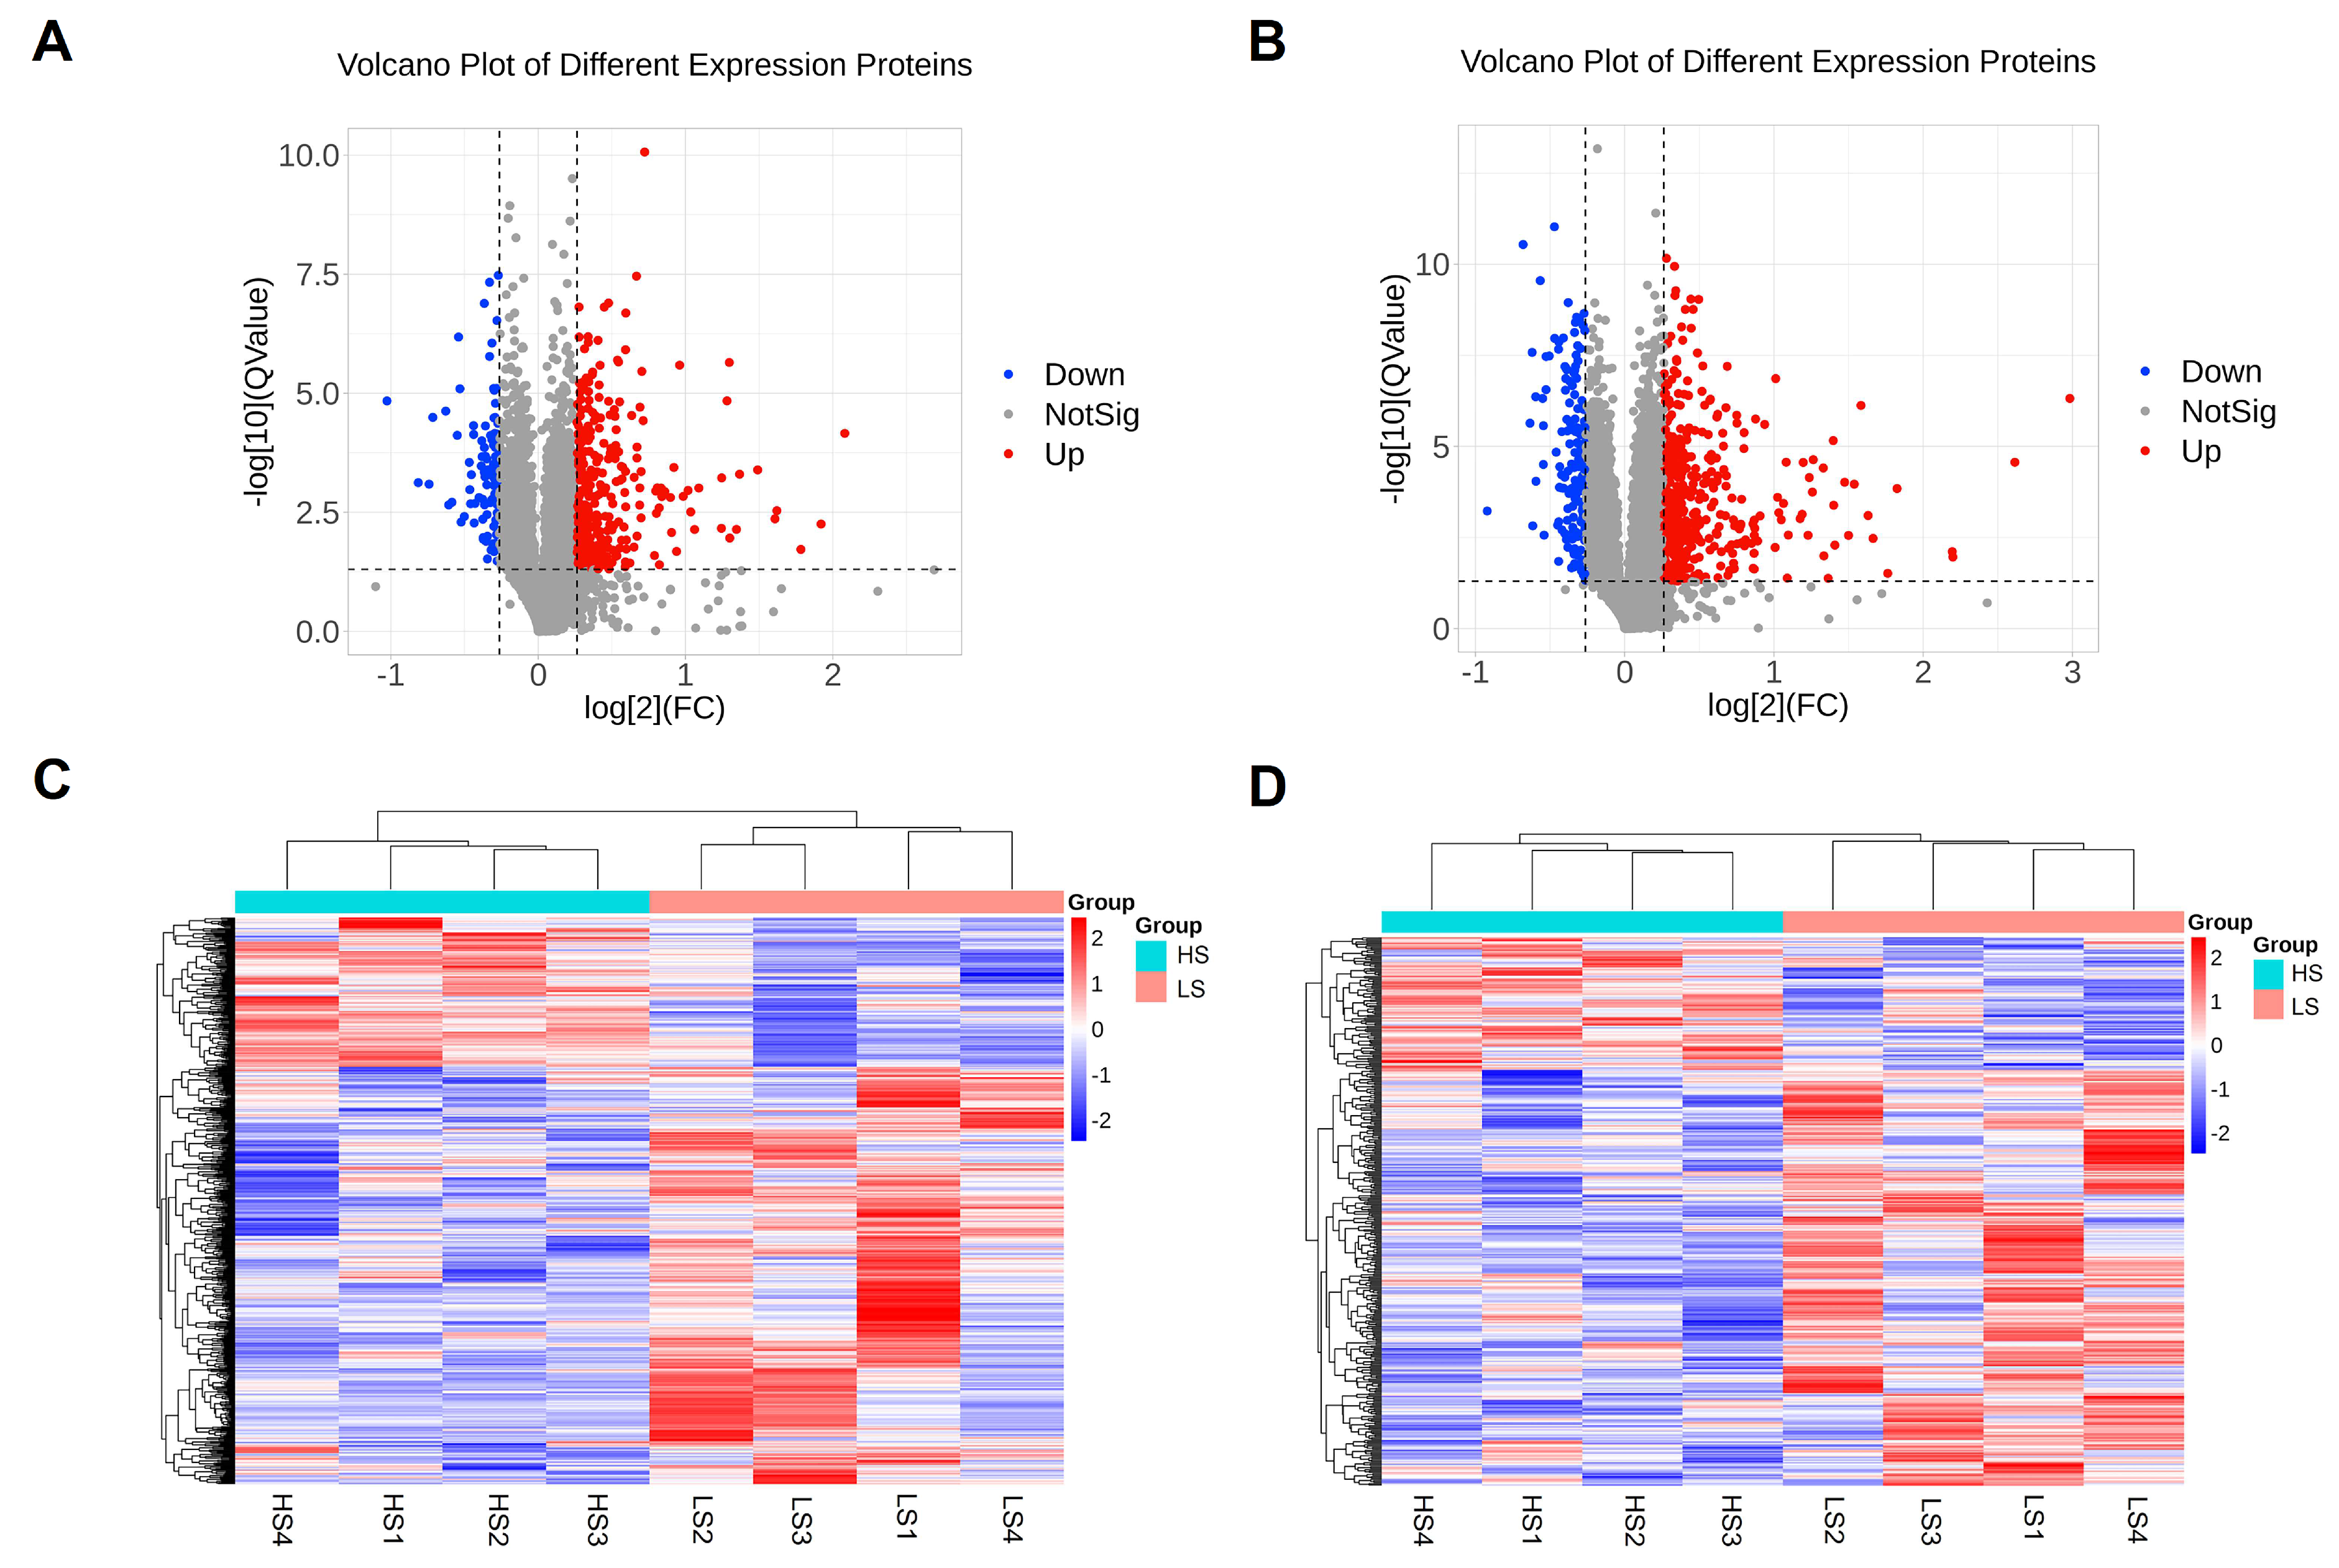
3.8. Proteomic Analysis Revealed Differentially Expressed Proteins
3.9. Protein–Protein Interaction Network Analysis and Hub Protein Selection
3.10. Association Analysis of the Differentially Expressed Genes and Proteins
4. Discussion
5. Conclusions
Supplementary Materials
Author Contributions
Funding
Institutional Review Board Statement
Informed Consent Statement
Data Availability Statement
Conflicts of Interest
References
- Griffing, B. Selection in reference to biological groups. I. Individual and group selection applied to populations of unordered groups. Aust. J. Biol. Sci. 1967, 20, 127–139. [Google Scholar] [CrossRef]
- Wolf, J.B.; Brodie, E.D., III; Cheverud, J.M.; Moore, A.J.; Wade, M.J. Evolutionary consequences of indirect genetic effects. Trends Ecol. Evol. 1998, 13, 64–69. [Google Scholar] [CrossRef] [PubMed]
- Moore, A.J.; Brodie, E.D.; Wolf, J.B. Interacting Phenotypes and The Evolutionary Process: I. Direct and Indirect Genetic Effects of Social Interactions. Evolution 1997, 51, 1352–1362. [Google Scholar] [CrossRef] [PubMed]
- Mutic, J.J.; Wolf, J.B. Indirect genetic effects from ecological interactions in Arabidopsis thaliana. Mol. Ecol. 2007, 16, 2371–2381. [Google Scholar] [CrossRef]
- Andersson, S. Indirect genetic effects from competition in the clonal herb Sedum album (Crassulaceae). PLoS ONE 2014, 9, e106104. [Google Scholar] [CrossRef]
- Bijma, P. Estimating indirect genetic effects: Precision of estimates and optimum designs. Genetics 2010, 186, 1013–1028. [Google Scholar] [CrossRef] [PubMed]
- Bergsma, R.; Kanis, E.; Knol, E.F.; Bijma, P. The contribution of social effects to heritable variation in finishing traits of domestic pigs (Sus scrofa). Genetics 2008, 178, 1559–1570. [Google Scholar] [CrossRef]
- Ellen, E.D.; Rodenburg, T.B.; Albers, G.A.A.; Bolhuis, J.E.; Camerlink, I.; Duijvesteijn, N.; Knol, E.F.; Muir, W.M.; Peeters, K.; Reimert, I.; et al. The prospects of selection for social genetic effects to improve welfare and productivity in livestock. Front. Genet. 2014, 5, 377. [Google Scholar] [CrossRef]
- Baud, A.; Mulligan, M.K.; Casale, F.P.; Ingels, J.F.; Bohl, C.J.; Callebert, J.; Launay, J.-M.; Krohn, J.; Legarra, A.; Williams, R.W.; et al. Genetic Variation in the Social Environment Contributes to Health and Disease. PLoS Genet. 2017, 13, e1006498. [Google Scholar] [CrossRef]
- Nielsen, H.M.; Monsen, B.B.; Ødegård, J.; Bijma, P.; Damsgård, B.; Toften, H.; Olesen, I. Direct and social genetic parameters for growth and fin damage traits in Atlantic cod (Gadus morhua). Genet. Sel. Evol. GSE 2014, 46, 5. [Google Scholar] [CrossRef]
- van Staaveren, N.; Calderón Díaz, J.A.; Garcia Manzanilla, E.; Hanlon, A.; Boyle, L.A. Prevalence of welfare outcomes in the weaner and finisher stages of the production cycle on 31 Irish pig farms. Ir. Vet. J. 2018, 71, 9. [Google Scholar] [CrossRef] [PubMed]
- Peeters, K.; Eppink, T.T.; Ellen, E.D.; Visscher, J.; Bijma, P. Indirect genetic effects for survival in domestic chickens (Gallus gallus) are magnified in crossbred genotypes and show a parent-of-origin effect. Genetics 2012, 192, 705–713. [Google Scholar] [CrossRef]
- Santostefano, F.; Wilson, A.J.; Niemelä, P.T.; Dingemanse, N.J. Indirect genetic effects: A key component of the genetic architecture of behaviour. Sci. Rep. 2017, 7, 10235. [Google Scholar] [CrossRef] [PubMed]
- Warrington, N.M.; Hwang, L.-D.; Nivard, M.G.; Evans, D.M. Estimating direct and indirect genetic effects on offspring phenotypes using genome-wide summary results data. Nat. Commun. 2021, 12, 5420. [Google Scholar] [CrossRef] [PubMed]
- Wilson, A.J.; Gelin, U.; Perron, M.-C.; Réale, D. Indirect genetic effects and the evolution of aggression in a vertebrate system. Proc. Biol. Sci. 2009, 276, 533–541. [Google Scholar] [CrossRef]
- Chen, C.Y.; Johnson, R.K.; Newman, S.; Van Vleck, L.D. A general review of competition genetic effects with an emphasis on swine breeding. Genet. Mol. Res. 2007, 6, 594–606. [Google Scholar]
- Camerlink, I.; Turner, S.P.; Bijma, P.; Bolhuis, J.E. Indirect genetic effects and housing conditions in relation to aggressive behaviour in pigs. PLoS ONE 2013, 8, e65136. [Google Scholar] [CrossRef]
- Bouwman, A.C.; Bergsma, R.; Duijvesteijn, N.; Bijma, P. Maternal and social genetic effects on average daily gain of piglets from birth until weaning. J. Anim. Sci. 2010, 88, 2883–2892. [Google Scholar] [CrossRef] [PubMed]
- Rostellato, R.; Sartori, C.; Bonfatti, V.; Chiarot, G.; Carnier, P. Direct and social genetic effects on body weight at 270 days and carcass and ham quality traits in heavy pigs. J. Anim. Sci. 2015, 93, 1–10. [Google Scholar] [CrossRef]
- Camerlink, I.; Ursinus, W.W.; Bartels, A.C.; Bijma, P.; Bolhuis, J.E. Indirect Genetic Effects for Growth in Pigs Affect Behaviour and Weight Around Weaning. Behav. Genet. 2018, 48, 413–420. [Google Scholar] [CrossRef]
- Herrera-Cáceres, W.; Ragab, M.; Sánchez, J.P. Indirect genetic effects on the relationships between production and feeding behaviour traits in growing Duroc pigs. Animal 2020, 14, 233–242. [Google Scholar] [CrossRef] [PubMed]
- Nielsen, H.M.; Ask, B.; Madsen, P. Social genetic effects for growth in pigs differ between boars and gilts. Genet. Sel. Evol. GSE 2018, 50, 4. [Google Scholar] [CrossRef]
- Kavlak, A.T.; Strandén, I.; Lidauer, M.H.; Uimari, P. Estimation of social genetic effects on feeding behaviour and production traits in pigs. Anim. Int. J. Anim. Biosci. 2021, 15, 100168. [Google Scholar] [CrossRef] [PubMed]
- Ragab, M.; Piles, M.; Quintanilla, R.; Sánchez, J.P. Indirect genetic effect model using feeding behaviour traits to define the degree of interaction between mates: An implementation in pigs growth rate. Anim. Int. J. Anim. Biosci. 2019, 13, 231–239. [Google Scholar] [CrossRef]
- Chen, C.Y.; Kachman, S.D.; Johnson, R.K.; Newman, S.; Van Vleck, L.D. Estimation of genetic parameters for average daily gain using models with competition effects. J. Anim. Sci. 2008, 86, 2525–2530. [Google Scholar] [CrossRef]
- Chen, C.Y.; Johnson, R.K.; Newman, S.; Kachman, S.D.; Van Vleck, L.D. Effects of social interactions on empirical responses to selection for average daily gain of boars. J. Anim. Sci. 2009, 87, 844–849. [Google Scholar] [CrossRef]
- Wu, P.; Wang, K.; Zhou, J.; Chen, D.; Jiang, A.; Jiang, Y.; Zhu, L.; Qiu, X.; Li, X.; Tang, G. A combined GWAS approach reveals key loci for socially-affected traits in Yorkshire pigs. Commun. Biol. 2021, 4, 891. [Google Scholar] [CrossRef]
- Hong, J.-K.; Lee, J.-B.; Ramayo-Caldas, Y.; Kim, S.-D.; Cho, E.-S.; Kim, Y.-S.; Cho, K.-H.; Lee, D.-H.; Park, H.-B. Single-step genome-wide association study for social genetic effects and direct genetic effects on growth in Landrace pigs. Sci. Rep. 2020, 10, 14958. [Google Scholar] [CrossRef] [PubMed]
- Liu, Z.; Sun, H.; Lai, W.; Hu, M.; Zhang, Y.; Bai, C.; Liu, J.; Ren, H.; Li, F.; Yan, S. Genome-wide re-sequencing reveals population structure and genetic diversity of Bohai Black cattle. Anim. Genet. 2022, 53, 133–136. [Google Scholar] [CrossRef]
- Zupan, M.; Janczak, A.M.; Framstad, T.; Zanella, A.J. The effect of biting tails and having tails bitten in pigs. Physiol. Behav. 2012, 106, 638–644. [Google Scholar] [CrossRef]
- Henry, M.; Jansen, H.; Amezcua, M.D.R.; O’Sullivan, T.L.; Niel, L.; Shoveller, A.K.; Friendship, R.M. Tail-Biting in Pigs: A Scoping Review. Animals 2021, 11, 2002. [Google Scholar] [CrossRef]
- Wu, P.; Wang, K.; Yang, Q.; Zhou, J.; Chen, D.; Liu, Y.; Ma, J.; Tang, Q.; Jin, L.; Xiao, W.; et al. Whole-genome re-sequencing association study for direct genetic effects and social genetic effects of six growth traits in Large White pigs. Sci. Rep. 2019, 9, 9667. [Google Scholar] [CrossRef] [PubMed]
- GB/T 5915-2020; Formula Feeds for Piglets and Growing-Finishing Pigs. National Standards of China: Beijing, China, 2020.
- Kranendonk, G.; Van der Mheen, H.; Fillerup, M.; Hopster, H. Social rank of pregnant sows affects their body weight gain and behavior and performance of the offspring. J. Anim. Sci. 2007, 85, 420–429. [Google Scholar] [CrossRef]
- Saintilan, R.; Mérour, I.; Brossard, L.; Tribout, T.; Dourmad, J.Y.; Sellier, P.; Bidanel, J.; van Milgen, J.; Gilbert, H. Genetics of residual feed intake in growing pigs: Relationships with production traits, and nitrogen and phosphorus excretion traits. J. Anim. Sci. 2013, 91, 2542–2554. [Google Scholar] [CrossRef]
- Noblet, J.; Karege, C.; Dubois, S.; van Milgen, J. Metabolic utilization of energy and maintenance requirements in growing pigs: Effects of sex and genotype. J. Anim. Sci. 1999, 77, 1208–1216. [Google Scholar] [CrossRef] [PubMed]
- Madsen, P.; Jensen, J.; Labouriau, R.; Christensen, O.; Sahana, G. DMU—A Package for Analyzing Multivariate Mixed Models in Quantitative Genetics and Genomics. In Proceedings of the 10th World Congress on Genetics Applied to Livestock Production (WCGALP), Vancouver, BC, Canada, 17–22 August 2014. [Google Scholar]
- GB/T 17236-2019; Operating Procedures of Livestock and Poultry Slaughtering—Pig. National Standards of China: Beijing, China, 2019.
- Langfelder, P.; Horvath, S. WGCNA: An R package for weighted correlation network analysis. BMC Bioinform. 2008, 9, 559. [Google Scholar] [CrossRef]
- Kanehisa, M.; Goto, S. KEGG: Kyoto encyclopedia of genes and genomes. Nucleic Acids Res. 2000, 28, 27–30. [Google Scholar] [CrossRef] [PubMed]
- Smyth, G.K. Linear models and empirical bayes methods for assessing differential expression in microarray experiments. Stat. Appl. Genet. Mol. Biol. 2004, 3, 1–25. [Google Scholar] [CrossRef]
- Camerlink, I.; Ursinus, W.W.; Bijma, P.; Kemp, B.; Bolhuis, J.E. Indirect genetic effects for growth rate in domestic pigs alter aggressive and manipulative biting behaviour. Behav. Genet. 2015, 45, 117–126. [Google Scholar] [CrossRef]
- Hoy, S.; Schamun, S.; Weirich, C. Investigations on feed intake and social behaviour of fattening pigs fed at an electronic feeding station. Appl. Anim. Behav. Sci. 2012, 139, 58–64. [Google Scholar] [CrossRef]
- Wilson, M.E.; Fisher, J.; Fischer, A.; Lee, V.; Harris, R.B.; Bartness, T.J. Quantifying food intake in socially housed monkeys: Social status effects on caloric consumption. Physiol. Behav. 2008, 94, 586–594. [Google Scholar] [CrossRef]
- Nielsen, B.L.; Lawrence, A.B.; Whittemore, C.T. Effect of group size on feeding behaviour, social behaviour, and performance of growing pigs using single-space feeders. Livest. Prod. Sci. 1995, 44, 73–85. [Google Scholar] [CrossRef]
- Nielsen, B.L.; Lawrence, A.B.; Whittemore, C.T. Effect of individual housing on the feeding behaviour of previously group housed growing pigs. Appl. Anim. Behav. Sci. 1996, 47, 149–161. [Google Scholar] [CrossRef]
- Seabury, C.M.; Oldeschulte, D.L.; Saatchi, M.; Beever, J.E.; Decker, J.E.; Halley, Y.A.; Bhattarai, E.K.; Molaei, M.; Freetly, H.C.; Hansen, S.L.; et al. Genome-wide association study for feed efficiency and growth traits in U.S. beef cattle. BMC Genom. 2017, 18, 386. [Google Scholar] [CrossRef]
- Cho, J.H.; Lu, N.; Lindemann, M.D. Effects of vitamin supplementation on growth performance and carcass characteristics in pigs. Livest. Sci. 2017, 204, 25–32. [Google Scholar] [CrossRef]
- Zhong, W.; Jiang, Z.; Zheng, C.; Lin, Y.; Yang, L.; Zou, S. Relationship between proteome changes of Longissimus muscle and intramuscular fat content in finishing pigs fed conjugated linoleic acid. Br. J. Nutr. 2011, 105, 1–9. [Google Scholar] [CrossRef]
- Ishino, F.; Itoh, J.; Matsuzawa, A.; Irie, M.; Suzuki, T.; Hiraoka, Y.; Yoshikawa, M.; Kaneko-Ishino, T. RTL4, a Retrovirus-Derived Gene Implicated in Autism Spectrum Disorder, Is a Microglial Gene That Responds to Noradrenaline in the Postnatal Brain. Int. J. Mol. Sci. 2024, 25, 13738. [Google Scholar] [CrossRef] [PubMed]
- Gast, M.T.; Tönjes, A.; Keller, M.; Horstmann, A.; Steinle, N.; Scholz, M.; Müller, I.; Villringer, A.; Stumvoll, M.; Kovacs, P.; et al. The role of rs2237781 within GRM8 in eating behavior. Brain Behav. 2013, 3, 495–502. [Google Scholar] [CrossRef]
- Awasthi, S.; Hindle, A.; Sawant, N.A.; George, M.; Vijayan, M.; Kshirsagar, S.; Morton, H.; Bunquin, L.E.; Palade, P.T.; Lawrence, J.J.; et al. RALBP1 in Oxidative Stress and Mitochondrial Dysfunction in Alzheimer’s Disease. Cells 2021, 10, 3113. [Google Scholar] [CrossRef]
- Allen, J.; Romay-Tallon, R.; Brymer, K.J.; Caruncho, H.J.; Kalynchuk, L.E. Mitochondria and Mood: Mitochondrial Dysfunction as a Key Player in the Manifestation of Depression. Front. Neurosci. 2018, 12, 386. [Google Scholar] [CrossRef]
- Castro, K.; Baronio, D.; Perry, I.S.; Riesgo, R.D.S.; Gottfried, C. The effect of ketogenic diet in an animal model of autism induced by prenatal exposure to valproic acid. Nutr. Neurosci. 2017, 20, 343–350. [Google Scholar] [CrossRef] [PubMed]
- Kamhi, J.F.; Gronenberg, W.; Robson, S.K.A.; Traniello, J.F.A. Social complexity influences brain investment and neural operation costs in ants. Proc. Biol. Sci. 2016, 283, 20161949. [Google Scholar] [CrossRef] [PubMed]
- Shimamoto, C.; Ohnishi, T.; Maekawa, M.; Watanabe, A.; Ohba, H.; Arai, R.; Iwayama, Y.; Hisano, Y.; Toyota, T.; Toyoshima, M.; et al. Functional characterization of FABP3, 5 and 7 gene variants identified in schizophrenia and autism spectrum disorder and mouse behavioral studies. Hum. Mol. Genet. 2014, 23, 6495–6511. [Google Scholar] [CrossRef]
- Idriss, A.A.; Hu, Y.; Sun, Q.; Jia, L.; Jia, Y.; Omer, N.A.; Abobaker, H.; Zhao, R. Prenatal betaine exposure modulates hypothalamic expression of cholesterol metabolic genes in cockerels through modifications of DNA methylation. Poult. Sci. 2017, 96, 1715–1724. [Google Scholar] [CrossRef]
- Asellus, P.; Nordström, P.; Nordström, A.-L.; Jokinen, J. Cholesterol and the “Cycle of Violence” in attempted suicide. Psychiatry Res. 2014, 215, 646–650. [Google Scholar] [CrossRef]
- Knowles, E.E.M.; Curran, J.E.; Meikle, P.J.; Huynh, K.; Mathias, S.R.; Göring, H.H.H.; VandeBerg, J.L.; Mahaney, M.C.; Jalbrzikowski, M.; Mosior, M.K.; et al. Disentangling the genetic overlap between cholesterol and suicide risk. Neuropsychopharmacology 2018, 43, 2556–2563. [Google Scholar] [CrossRef] [PubMed]
- Yu, H.; Qin, X.; Yu, Z.; Chen, Y.; Tang, L.; Shan, W. Effects of high-fat diet on the formation of depressive-like behavior in mice. Food Funct. 2021, 12, 6416–6431. [Google Scholar] [CrossRef] [PubMed]
- Mahley, R.W. Central Nervous System Lipoproteins: ApoE and Regulation of Cholesterol Metabolism. Arterioscler. Thromb. Vasc. Biol. 2016, 36, 1305–1315. [Google Scholar] [CrossRef]
- Peri, A. Neuroprotective effects of estrogens: The role of cholesterol. J. Endocrinol. Investig. 2016, 39, 11–18. [Google Scholar] [CrossRef]


| 2594.808 ± 86.02 | 1007.688 ± 59.78 | 206.75063 ± 17.32 | 0.128 ± 0.11 | 105,451.9714 | 322.848 ± 19.34 | 40,354.019 ± 260.16 | 23,234.581 ± 249.36 |
| Parameter | HS (n = 4) | LS (n = 4) | p-Value |
|---|---|---|---|
| RFI (g) | −248.74 ± 8.70 | 335.57 ± 4.88 | 0.001 |
| FCR | 1.91 ± 0.11 | 2.54 ± 0.07 | 0.001 |
| SGE | 10.14 ± 18.85 a | −15.8 ± 18.85 | |
| DGE | −98.92 ± 99.84 b | 161.82 ± 99.84 | |
| ADG (g) | 971.47 ± 98.31 | 1000.95 ± 31.53 | 0.001 |
| ADFI (g) | 1856.47 ± 186.73 | 2541.41 ± 31.29 | 0.001 |
| AFI (g) | 328.36 ± 29.60 | 296.42 ± 16.86 | 0.032 |
| NVD | 5.66 ± 0.26 | 8.62 ± 0.40 | 0.001 |
| TPD (min) | 65.83 ± 2.82 | 50.51 ± 4.22 | 0.022 |
| DS | 76.20 ± 4.66 | 29.60 ± 5.82 | 0.001 |
| Gene Name | log2FC | p-Value | FDR | In the HS Group |
|---|---|---|---|---|
| TCN1 | 5.48 | 3.14 × 10⁻⁶ | 3.31 × 10⁻⁴ | Up |
| HBM | 3.77 | 4.57 × 10⁻⁴ | 1.20 × 10⁻² | Up |
| HBB | 3.31 | 2.23 × 10⁻⁴ | 7.29 × 10⁻³ | Up |
| C2H11orf86 | 2.73 | 2.84 × 10⁻⁷ | 5.26 × 10⁻⁵ | Up |
| LOC100737768 | 2.62 | 9.25 × 10⁻⁴ | 1.98 × 10⁻² | Up |
| ARF4 | 2.54 | 7.27 × 10⁻¹⁴ | 3.59 × 10⁻¹⁰ | Up |
| PNPLA3 | 2.53 | 3.36 × 10⁻⁵ | 1.84 × 10⁻³ | Up |
| LOC100517779 | 2.41 | 1.75 × 10⁻⁷ | 3.45 × 10⁻⁵ | Up |
| APOA4 | 2.41 | 4.93 × 10⁻⁷ | 8.21 × 10⁻⁵ | Up |
| SPATA22 | 2.39 | 1.78 × 10⁻⁷ | 3.47 × 10⁻⁵ | Up |
| LOC102164346 | −2.43 | 4.47 × 10⁻⁵ | 2.25 × 10⁻³ | Down |
| CYP1A1 | −2.44 | 1.99 × 10⁻⁵ | 1.22 × 10⁻³ | Down |
| COLCA1 | −2.46 | 2.95 × 10⁻⁴ | 8.86 × 10⁻³ | Down |
| LOC110259967 | −2.47 | 5.12 × 10⁻⁵ | 2.47 × 10⁻³ | Down |
| GALP | −2.69 | 8.77 × 10⁻⁴ | 1.90 × 10⁻² | Down |
| LOC100154757 | −3.01 | 1.77 × 10⁻⁴ | 6.13 × 10⁻³ | Down |
| KCNH7 | −3.14 | 1.14 × 10⁻⁴ | 4.49 × 10⁻³ | Down |
| LOC110261964 | −3.24 | 5.52 × 10⁻⁴ | 1.37 × 10⁻² | Down |
| ASIC1 | −3.35 | 1.74 × 10⁻⁴ | 6.08 × 10⁻³ | Down |
| CA3 | −3.88 | 6.27 × 10⁻⁵ | 2.87 × 10⁻³ | Down |
| Gene Name | log2FC | p-Value | FDR | In the HS Group |
|---|---|---|---|---|
| RTL4 | 6.09 | 5.23 × 10⁻⁷ | 5.95 × 10⁻⁴ | Up |
| ADTRP | 5.43 | 3.75 × 10⁻⁹ | 1.85 × 10⁻⁵ | Up |
| SDSL | 5.36 | 5.81 × 10⁻¹⁰ | 8.59 × 10⁻⁶ | Up |
| NTS | 5.29 | 1.66 × 10⁻⁸ | 6.12 × 10⁻⁵ | Up |
| KCTD8 | 5.24 | 6.22 × 10⁻⁶ | 2.56 × 10⁻³ | Up |
| FEV | 5.11 | 6.16 × 10⁻⁴ | 2.91 × 10⁻² | Up |
| AQP7 | 5.04 | 5.14 × 10⁻⁶ | 2.29 × 10⁻³ | Up |
| MRO | 5.03 | 7.80 × 10⁻⁴ | 3.29 × 10⁻² | Up |
| FGFBP1 | 5.01 | 1.20 × 10⁻³ | 4.20 × 10⁻² | Up |
| CXH4orf3 | 4.88 | 2.13 × 10⁻⁹ | 1.58 × 10⁻⁵ | Up |
| C13H3orf62 | −3.82 | 2.13 × 10⁻⁴ | 1.64 × 10⁻² | Down |
| IFNA1 | −3.90 | 1.8 × 10⁻³ | 4.94 × 10⁻² | Down |
| LOC102165987 | −4.08 | 7.27 × 10⁻⁴ | 3.21 × 10⁻² | Down |
| FAT2 | −4.17 | 1.14 × 10⁻³ | 4.10 ×10⁻² | Down |
| AIRE | −4.24 | 1.15 × 10⁻³ | 4.48 × 10⁻² | Down |
| CDH8 | −4.38 | 1.02 × 10⁻³ | 3.84 × 10⁻² | Down |
| PTPRQ | −4.82 | 1.54 × 10⁻⁶ | 1.14 × 10⁻³ | Down |
| ITGB1BP2 | −4.93 | 1.07 × 10⁻³ | 3.96 × 10⁻² | Down |
| LOC100624648 | −5.89 | 9.34 × 10⁻⁸ | 1.59 × 10⁻⁴ | Down |
| GRM8 | −6.10 | 2.66 × 10⁻⁵ | 5.54 × 10⁻³ | Down |
| Name | mRNA-log2FC | mRNA-p-Value | Pro-log2FC | Pro-p-Value | Tissue Type |
|---|---|---|---|---|---|
| APOA1 | 3.188 | 0.014 | 0.278 | 0.048 | ileum |
| APOA4 | 3.829 | 0.018 | 0.397 | 0.002 | ileum |
| APOC3 | 4.853 | 0.055 | 0.337 | 0.001 | ileum |
| ASS1 | 4.382 | 0.000 | 0.473 | 0.001 | ileum |
| CDHR2 | 2.976 | 0.001 | 0.323 | 0.013 | ileum |
| DAO | 4.201 | 0.005 | 0.367 | 0.001 | ileum |
| FABP1 | 3.445 | 0.004 | 0.598 | 0.036 | ileum |
| FABP2 | 4.188 | 0.000 | 0.839 | 0.004 | ileum |
| GSTA1 | 5.027 | 0.016 | 0.396 | 0.000 | ileum |
| LOC100512780 | 3.109 | 0.008 | 0.363 | 0.038 | ileum |
| LOC100738425 | 2.239 | 0.013 | 0.284 | 0.010 | ileum |
| LOC100739663 | 4.240 | 0.024 | 0.321 | 0.026 | ileum |
| LOC106509660 | 3.134 | 0.049 | 0.295 | 0.010 | ileum |
| OAT | 2.964 | 0.057 | 0.898 | 0.049 | ileum |
| RBP2 | 4.029 | 0.041 | 0.513 | 0.002 | ileum |
| REEP6 | 3.219 | 0.005 | 0.266 | 0.000 | ileum |
| SDSL | 5.510 | 0.024 | 0.531 | 0.000 | ileum |
| SLC5A1 | 3.208 | 0.001 | 0.410 | 0.017 | ileum |
| STARD4 | 2.373 | 0.014 | 0.287 | 0.019 | ileum |
| ABHD5 | 1.133 | 0.002 | 0.798 | 0.000 | liver |
| ARF4 | 2.604 | 0.000 | 0.498 | 0.011 | liver |
| ARL1 | 1.267 | 0.000 | 0.734 | 0.023 | liver |
| ATOX1 | 1.024 | 0.006 | 0.266 | 0.000 | liver |
| ATP5F1E | 1.147 | 0.005 | 0.352 | 0.000 | liver |
| ATP5MC1 | 2.048 | 0.000 | 0.768 | 0.002 | liver |
| ATP5PO | 1.138 | 0.000 | 0.523 | 0.000 | liver |
| CFL1 | 1.232 | 0.000 | 1.024 | 0.000 | liver |
| COX5B | 1.414 | 0.000 | 0.867 | 0.023 | liver |
| COX6C | 1.456 | 0.000 | 0.420 | 0.002 | liver |
| COX7A2 | 1.632 | 0.000 | 0.413 | 0.023 | liver |
| COX7C | 1.245 | 0.000 | 0.419 | 0.001 | liver |
| CYCS | 1.577 | 0.000 | 0.304 | 0.023 | liver |
| FKBP1A | 1.146 | 0.000 | 0.641 | 0.001 | liver |
| H2AFZ | 1.127 | 0.000 | 0.337 | 0.048 | liver |
| HBB | 3.335 | 0.010 | 0.284 | 0.000 | liver |
| HMOX1 | 1.150 | 0.001 | 1.082 | 0.000 | liver |
| LDHB | 1.354 | 0.003 | 0.358 | 0.001 | liver |
| MIF | 1.353 | 0.000 | 0.489 | 0.001 | liver |
| NDUFA4 | 1.353 | 0.000 | 0.423 | 0.000 | liver |
| NNMT | 1.423 | 0.005 | 0.332 | 0.016 | liver |
| NQO1 | 1.279 | 0.030 | 0.277 | 0.005 | liver |
| PGK1 | 1.324 | 0.000 | 0.389 | 0.010 | liver |
| PSMB6 | 1.314 | 0.000 | 0.283 | 0.001 | liver |
| RTCB | 1.345 | 0.000 | 0.343 | 0.000 | liver |
| S100A11 | 1.063 | 0.013 | 1.012 | 0.000 | liver |
| SLIRP | 1.333 | 0.047 | 0.420 | 0.007 | liver |
| TPI1 | 1.044 | 0.000 | 0.657 | 0.000 | liver |
| UBE2D3 | 1.857 | 0.012 | 0.460 | 0.002 | liver |
Disclaimer/Publisher’s Note: The statements, opinions and data contained in all publications are solely those of the individual author(s) and contributor(s) and not of MDPI and/or the editor(s). MDPI and/or the editor(s) disclaim responsibility for any injury to people or property resulting from any ideas, methods, instructions or products referred to in the content. |
© 2025 by the authors. Licensee MDPI, Basel, Switzerland. This article is an open access article distributed under the terms and conditions of the Creative Commons Attribution (CC BY) license (https://creativecommons.org/licenses/by/4.0/).
Share and Cite
Tecku, P.K.M.; Zhao, Z.; Wang, K.; Ji, X.; Chen, D.; Shen, Q.; Yu, Y.; Cui, S.; Wang, J.; Chen, Z.; et al. Transcriptomic and Proteomic Analyses of the Liver and Ileum Identify Key Genes and Pathways Associated with Low and High Groups of Social Genetic Effect of Residual Feed Intake. Animals 2025, 15, 1345. https://doi.org/10.3390/ani15091345
Tecku PKM, Zhao Z, Wang K, Ji X, Chen D, Shen Q, Yu Y, Cui S, Wang J, Chen Z, et al. Transcriptomic and Proteomic Analyses of the Liver and Ileum Identify Key Genes and Pathways Associated with Low and High Groups of Social Genetic Effect of Residual Feed Intake. Animals. 2025; 15(9):1345. https://doi.org/10.3390/ani15091345
Chicago/Turabian StyleTecku, Patrick Kofi Makafui, Zhenjian Zhao, Kai Wang, Xiang Ji, Dong Chen, Qi Shen, Yang Yu, Shengdi Cui, Junge Wang, Ziyang Chen, and et al. 2025. "Transcriptomic and Proteomic Analyses of the Liver and Ileum Identify Key Genes and Pathways Associated with Low and High Groups of Social Genetic Effect of Residual Feed Intake" Animals 15, no. 9: 1345. https://doi.org/10.3390/ani15091345
APA StyleTecku, P. K. M., Zhao, Z., Wang, K., Ji, X., Chen, D., Shen, Q., Yu, Y., Cui, S., Wang, J., Chen, Z., Xue, J., & Tang, G. (2025). Transcriptomic and Proteomic Analyses of the Liver and Ileum Identify Key Genes and Pathways Associated with Low and High Groups of Social Genetic Effect of Residual Feed Intake. Animals, 15(9), 1345. https://doi.org/10.3390/ani15091345