Article

Development and Application of a 40 K Liquid Capture Chip for Beef Cattle

1
Laboratory of Genetic Breeding, Reproduction and Precision Livestock Farming & Hubei Provincial Center of Technology Innovation for Domestic Animal Breeding, School of Animal Science and Nutritional Engineering, Wuhan Polytechnic University, Wuhan 430023, China
2
Institute of Animal Science and Veterinary Medicine, Wuhan Academy of Agricultural Sciences, Wuhan 430208, China
3
Hubei Jinchu Husbandry Co., Ltd., Wuhan 430014, China
*
Authors to whom correspondence should be addressed.
These authors contributed equally to this work.
Animals 2025, 15(9), 1346; https://doi.org/10.3390/ani15091346
Submission received: 26 March 2025 / Revised: 29 April 2025 / Accepted: 3 May 2025 / Published: 7 May 2025
(This article belongs to the Special Issue Advances in Cattle Genetics and Breeding)

Simple Summary

The evaluation and utilization of local germplasm resources still pose limitations to the efficient and sustainable development of the beef cattle industry in China. With the increasing amount of sequencing data, the development of single-nucleotide polymorphism (SNP) chips has increased, enabling the evaluation, development, and utilization of local germplasm resources. Here, we developed a 40 K liquid SNP capture chip and evaluated its performance in genotyping, efficacy in population genetic studies, and practicality in identifying runs of homozygosity (ROH). These findings demonstrate that this chip not only contributes to the understanding of the genetic characteristics of local beef cattle breeds but also provides valuable genetic information for future breeding programs, thereby improving their production efficiency and economic value.

Abstract

The availability of genome sequences and single-nucleotide polymorphism (SNP) chips allows us to investigate the various genomic characteristics of species by exploring genetic diversity to aid genetic selection. The SNP chip is a cost-effective genotyping platform essential for molecular breeding of livestock. In this study, we developed a liquid SNP capture chip suitable for five Hubei (China) indigenous beef cattle breeds based on whole-genome sequencing datasets. The panel consisted of 42,686 SNPs (~40 K). These SNPs were evenly distributed on each bovine chromosome, with the majority of SNPs having minor allele frequencies >0.05 and located within intergenic regions. The performance evaluation of this SNP chip panel was proceeded by genotyping 200 individuals, revealing that this panel has a high SNP call rate of 99.48%. The SNP chip panel was further used to examine the population structure of a beef cattle population with 205 individuals and demonstrated the ability to differentiate between foreign and indigenous cattle breeds. The SNP chip was also used to determine the runs of homozygosity (ROH) within a local Hubei beef cattle population of 195 individuals. We identified 2547 ROH and several genes associated with economically important traits in the study population. Our findings demonstrate that this chip not only contributes to the understanding of the genetic characteristics of local beef cattle breeds but also provides valuable genetic information for future breeding programs, thereby improving their production efficiency and economic value.

1. Introduction

Cattle are the most widely distributed species of livestock and provide humans with products such as meat, milk, leather, and labor [1]. In China, the beef cattle industry is growing rapidly owing to growing consumer demand and government-supported policies. China also has abundant beef cattle breed resources, among which there are five well-known indigenous beef cattle breeds in Hubei Province: Enshi (ES), Huangpi (HP), Yunba (YB), Yiling (YL), and Zaobei (ZB). These local beef cattle breeds exhibit strong limbs, well-proportioned body shape, heat resistance, labor tolerance, rough feeding resistance, delicious meat quality, and rich nutritional value because of their successful adaption to subtropical climate and environmental conditions. However, the genetic potential of these beef cattle breeds has not been fully explored. Consequently, it is imperative to explore effective strategies for the conservation and utilization of genetic resources in indigenous beef cattle in Hubei.
Advances in genomic technologies have revolutionized the livestock industry, particularly the use of single-nucleotide polymorphisms (SNPs), which have facilitated the exploration of genetic characteristics and the improvement of important economic traits in livestock species [2,3,4]. SNP chips have been widely used in various genomic studies in animal husbandry [5,6,7]. As large-scale genotyping platforms, SNP chips have been developed and used for genomic studies in various livestock species, including cattle [8], sheep [9], goats [10], pigs [11], and buffalo [12], which has accelerated genetic progress in this species. These chip data are mainly used for the analysis of genetic diversity [13], population genetics [14], selective sweeps [15], quantitative trait site (QTL) mapping [16], genome-wide association studies (GWAS) [17], runs of homozygosity (ROH) [18], and genomic selection (GS) [19]. SNP chip technology plays an increasingly prominent role in animal husbandry, which not only accelerates the process of genetic improvement but also improves the accuracy and efficiency of trait improvement.
SNP chip technology can be categorized into two main types: solid-phase and liquid chips. Traditional solid-phase chips rely primarily on complementary hybridization between probes and DNA sequences and are analyzed through the fluorescent signals of labeled probes. This has some disadvantages, such as high typing costs and challenges in personalized development. Compared to traditional solid-phase chip technology, liquid chip technology, also known as genotyping by target sequencing (GBTS) liquid chips, combines the advantages of traditional solid-phase chips and next-generation sequencing technology with features such as high detection accuracy, cost-effectiveness, flexible design, and the ability to incorporate new sites [20,21]. GBTS has been widely applied to livestock species, including chickens [22], pigs [23], sheep [24], goats [25], and cattle [1]. GBTS has also been utilized in various genomic studies, such as the Cattle110K capture chip adapted for genomic prediction [21], liquid chips suitable for GWAS [24,25], and 10 K cGPS liquid chips used for research and protection of Hainan black goat germplasm resources [26].
To date, no liquid chip has been specifically designed for Hubei indigenous beef cattle. This study presents the development and application of a 40K liquid capture chip. We validated its performance by conducting population genetic studies on 205 individuals and identifying the ROH in 195 individuals from four local cattle breeds. Our findings suggest that this chip is a powerful tool for genetic breeding and genomic research in beef cattle, specifically for local Hubei breeds.

2. Materials and Methods

2.1. Animals and Sampling

A total of 98 beef cattle were obtained from five local breeds (18 ZB, 20 YL, 18 YB, 14 ES, and 28 HP) in Hubei province, China. The animals consisted of bulls and cows, and ear tissue samples were collected. Genomic DNA was isolated from each sample using the standard phenol–chloroform method. The extracted DNA was quantified using a Qubit fluorometer and the quality was assessed using a Nanodrop spectrophotometer. Sequencing libraries were constructed using a GenoBaits® DNA Library Prep Kit for Illumina following the manufacturer’s instructions. The libraries were sequenced on an Illumina HiSeq X Ten platform with 150 bp paired-end sequencing. Furthermore, 240 whole-genome sequencing (WGS) datasets from the public NCBI database were downloaded, representing four foreign breeds of beef cattle: Simmental (N = 67), Charolais (N = 45), Angus (N = 38), and Limousin (N = 90).

2.2. SNP Discovery

All WGS raw reads were checked for sequencing quality using Trimmonmatic v0.39 software [27]. All clean reads were aligned to the bovine reference genome (version: ARS-UCD1.2) using BWA-MEN v2.2.1 [28] with default settings. Furthermore, a Genome Analysis Toolkit (GATK, v4.2.0.0) [29] was used to perform variant detection based on the following filtering parameters: quality by depth (QD) < 2.0, QUAL < 30.0, symmetric odds ratio (SOR) > 3.0, Fisher strand (FS) > 60.0, root mean square of mapping quality (MQ) < 40.0, MQRankSum< −12.5, and ReadPosRankSum < −8.0. PLINK v1.9 [30] software was used to further extract variants with SNPs with missing rates < 0.1 and minor allele frequencies (MAF) < 0.05. A total of 1,210,156 SNPs and 264 individuals were used for subsequent analyses. Detailed information on the WGS dataset for 98 beef cattle is presented in Supplementary Table S1.

2.3. Development of Liquid Capture Chip Panel

The study design and workflow of the 40 K liquid capture chip for Hubei indigenous beef cattle are shown in Supplementary Figure S1. Here, several hierarchical methods were used to select SNP loci for the chip panel. Overall, we collected SNP loci for different biological purposes in three stages. In the first stage, we used TRES [31] software to identify breed-specific sites for five Hubei indigenous breeds and four foreign breeds. Three methods, including Wright’s Fst, detla, and informativeness for assignment (In), implemented in TRES software, were used to analyze the genotypic dataset. After synthesizing the differences between comparison groups, SNP loci with the top 1000, top 2000, top 3000, top 4000, and top 5000 were selected and used for principal component analysis (PCA). Finally, the most representative SNP loci were selected as candidate breed-specific sites based on grouping results. In the second stage, we collected and analyzed published SNP loci from a previous study [32]. These loci were designated trait-related sites in the chip panel and involved bovine genetic defects and economically important traits such as growth, carcass, beef quality, milk production, reproduction, and body shape. In the third stage, we selected common sites from five widely and commercially available bovine breeding chips, including 50 K, 60 K, 80 K, 777 K, and 150 K bovine SNP chips.
All the aforementioned SNP loci were merged with the previous reports described by Liu et al. [33]. In this study, we assigned priority levels to SNP sites based on their identification at different stages. The SNP sites from the first and second stages were designated priority 1, the common sites from the third stage priority 2, and the polymorphic sites (MAF > 0.2) identified through WGS data priority 3. Subsequently, the optimization selection process was executed using a window-based approach for priority-filling analysis. Bovine chromosomes were segmented using a window of 50 K. The frequencies of the candidate SNP loci were quantified within each window across all chromosomes. According to the number of SNPs in each window, we selected the candidate sites for the chip panel using the following screening method. If there were only one SNP in a window, the locus was retained. If there were two or more SNPs in a window, only two loci in this window would be retained, which enabled the SNPs to be evenly distributed in this window based on the following formula:
S D 2 = S X ¯ 2 + N i X ¯ 2 + N j X ¯ 2 + E X ¯ 2 4
where S and E are the start position and end position of the window, respectively, and N i and N j are the target SNP positions in the window. The SNPs N i and N j , which can minimize the SD2, were reserved.
If there were no SNP in the window, supplementation of the filtered loci with no selection signature was required. Then, according to the additional information from these loci, the SNP loci were screened in the order of SNP priority. The loci with the highest priority were chosen as the candidate loci. The preparation/development of the GBTS 40K genotyping test kit was performed by MolBreeding Biotech Ltd. (Shijiazhuang, China).

2.4. Validation of the 40K Chip Panel

A total of 200 additional individuals from five local Hubei cattle breeds (33 ES, 39 HP, 52 YL, 71 ZB, and 5 YB) were genotyped using the 40K SNP chip panel. To gain a better understanding of panel performance, we performed a comparative analysis of SNP call and missingness rates between different sexes and breeds. The t-test was used to determine the statistical significance between the contrasting groups. Statistical significance was set at p < 0.05.

2.5. Population Genetic Analysis

We genotyped 195 individuals (33 ES, 39 HP, 52 YL, and 71 ZB) representing four beef cattle breeds using the 40K liquid capture chip. In addition, we collected SNP loci from 10 individuals representing Simmental (SM; N = 5) and Charolais (CL; N = 5) breeds. In total, 205 individuals and 35 193 SNPs were used for subsequent analysis. To investigate the genetic relationships among the studied populations, PLINK v1.9 software [30] was used to perform PCA. The “ggplot2” R package was used to visualize the first two principal components (PCs). Subsequently, the VCF2Dis v1.53 software [34] was used to calculate the p-distance matrix, which was used to construct the phylogenetic tree. The phylogenetic tree was visualized using iTOL online software. Admixture v1.3.0 software [35] was used to estimate the breed composition of the tested populations. Furthermore, to understand the genome-wide linkage disequilibrium (LD) of local Hubei beef cattle breeds, we performed genome-wide LDD decay (LDD) within breed groups using PopLDdecay v3.43 software [36].

2.6. Identification of Runs of Homozygosity

PLINK v1.90 software [30] with the sliding-window approach was used to determine the ROH within the local Hubei beef cattle population. The parameters were set as follows: (i) the minimum length of the run was 1 Mb; (ii) the maximum gap between consecutive SNP to still be considered a potential run was 1 Mb; (iii) the minimum SNP density was set to 1 SNP every 100 kb; (iv) the size of the sliding window was 50 SNPs; (v) one heterozygous genotype per window was allowed; (vi) the threshold of overlapping windows of the same state (homozygous or heterozygous) to call an SNP in a run was set to 0.01; and (vii) the number of SNPs per ROH was calculated using the following equation:
L = l o g e α n s n i l o g e 1 h e t ,
where n s is the number of genotyped SNPs per animal, n i is the number of genotyped animals, α is 0.05, and h e t is the mean heterozygosity across all SNPs.

2.7. Detection and Analyses of Common Runs of Homozygosity

To identify genomic regions characterized by a high frequency of ROH occurrence, the number of times each SNP occurred in ROH was calculated across individuals. The top 1% of the highest occurrence values was chosen as the threshold, as suggested in a previous study [37], in which the identified genomic regions were classified as “ROH islands” in a given population. The frequency of ROH was plotted against their physical position in the bovine genome (ARS-UCD1.2). Genes within each ROH island were extracted from bovine genome annotation using Bedtools v2.28 software [38]. These genes were also used to identify overlapping QTL described in the Cattle Quantitative Traits Locus Database (Cattle QTLdb) (ver.54; https://www.animalgenome.org/cgi-bin/QTLdb/BT/index (accessed on 12 December 2024)). The STRING database (ver.12.0; https://string-db.org (accessed on 17 December 2024)) was used to predict protein–protein interaction (PPI) relationships among the annotated genes. KOBAS software [39] was used to identify significantly enriched Gene Ontology (GO) terms and Kyoto Encyclopedia of Genes and Genomes (KEGG) pathways (adjusted p-value < 0.05) of the genes located in ROH regions.

3. Results

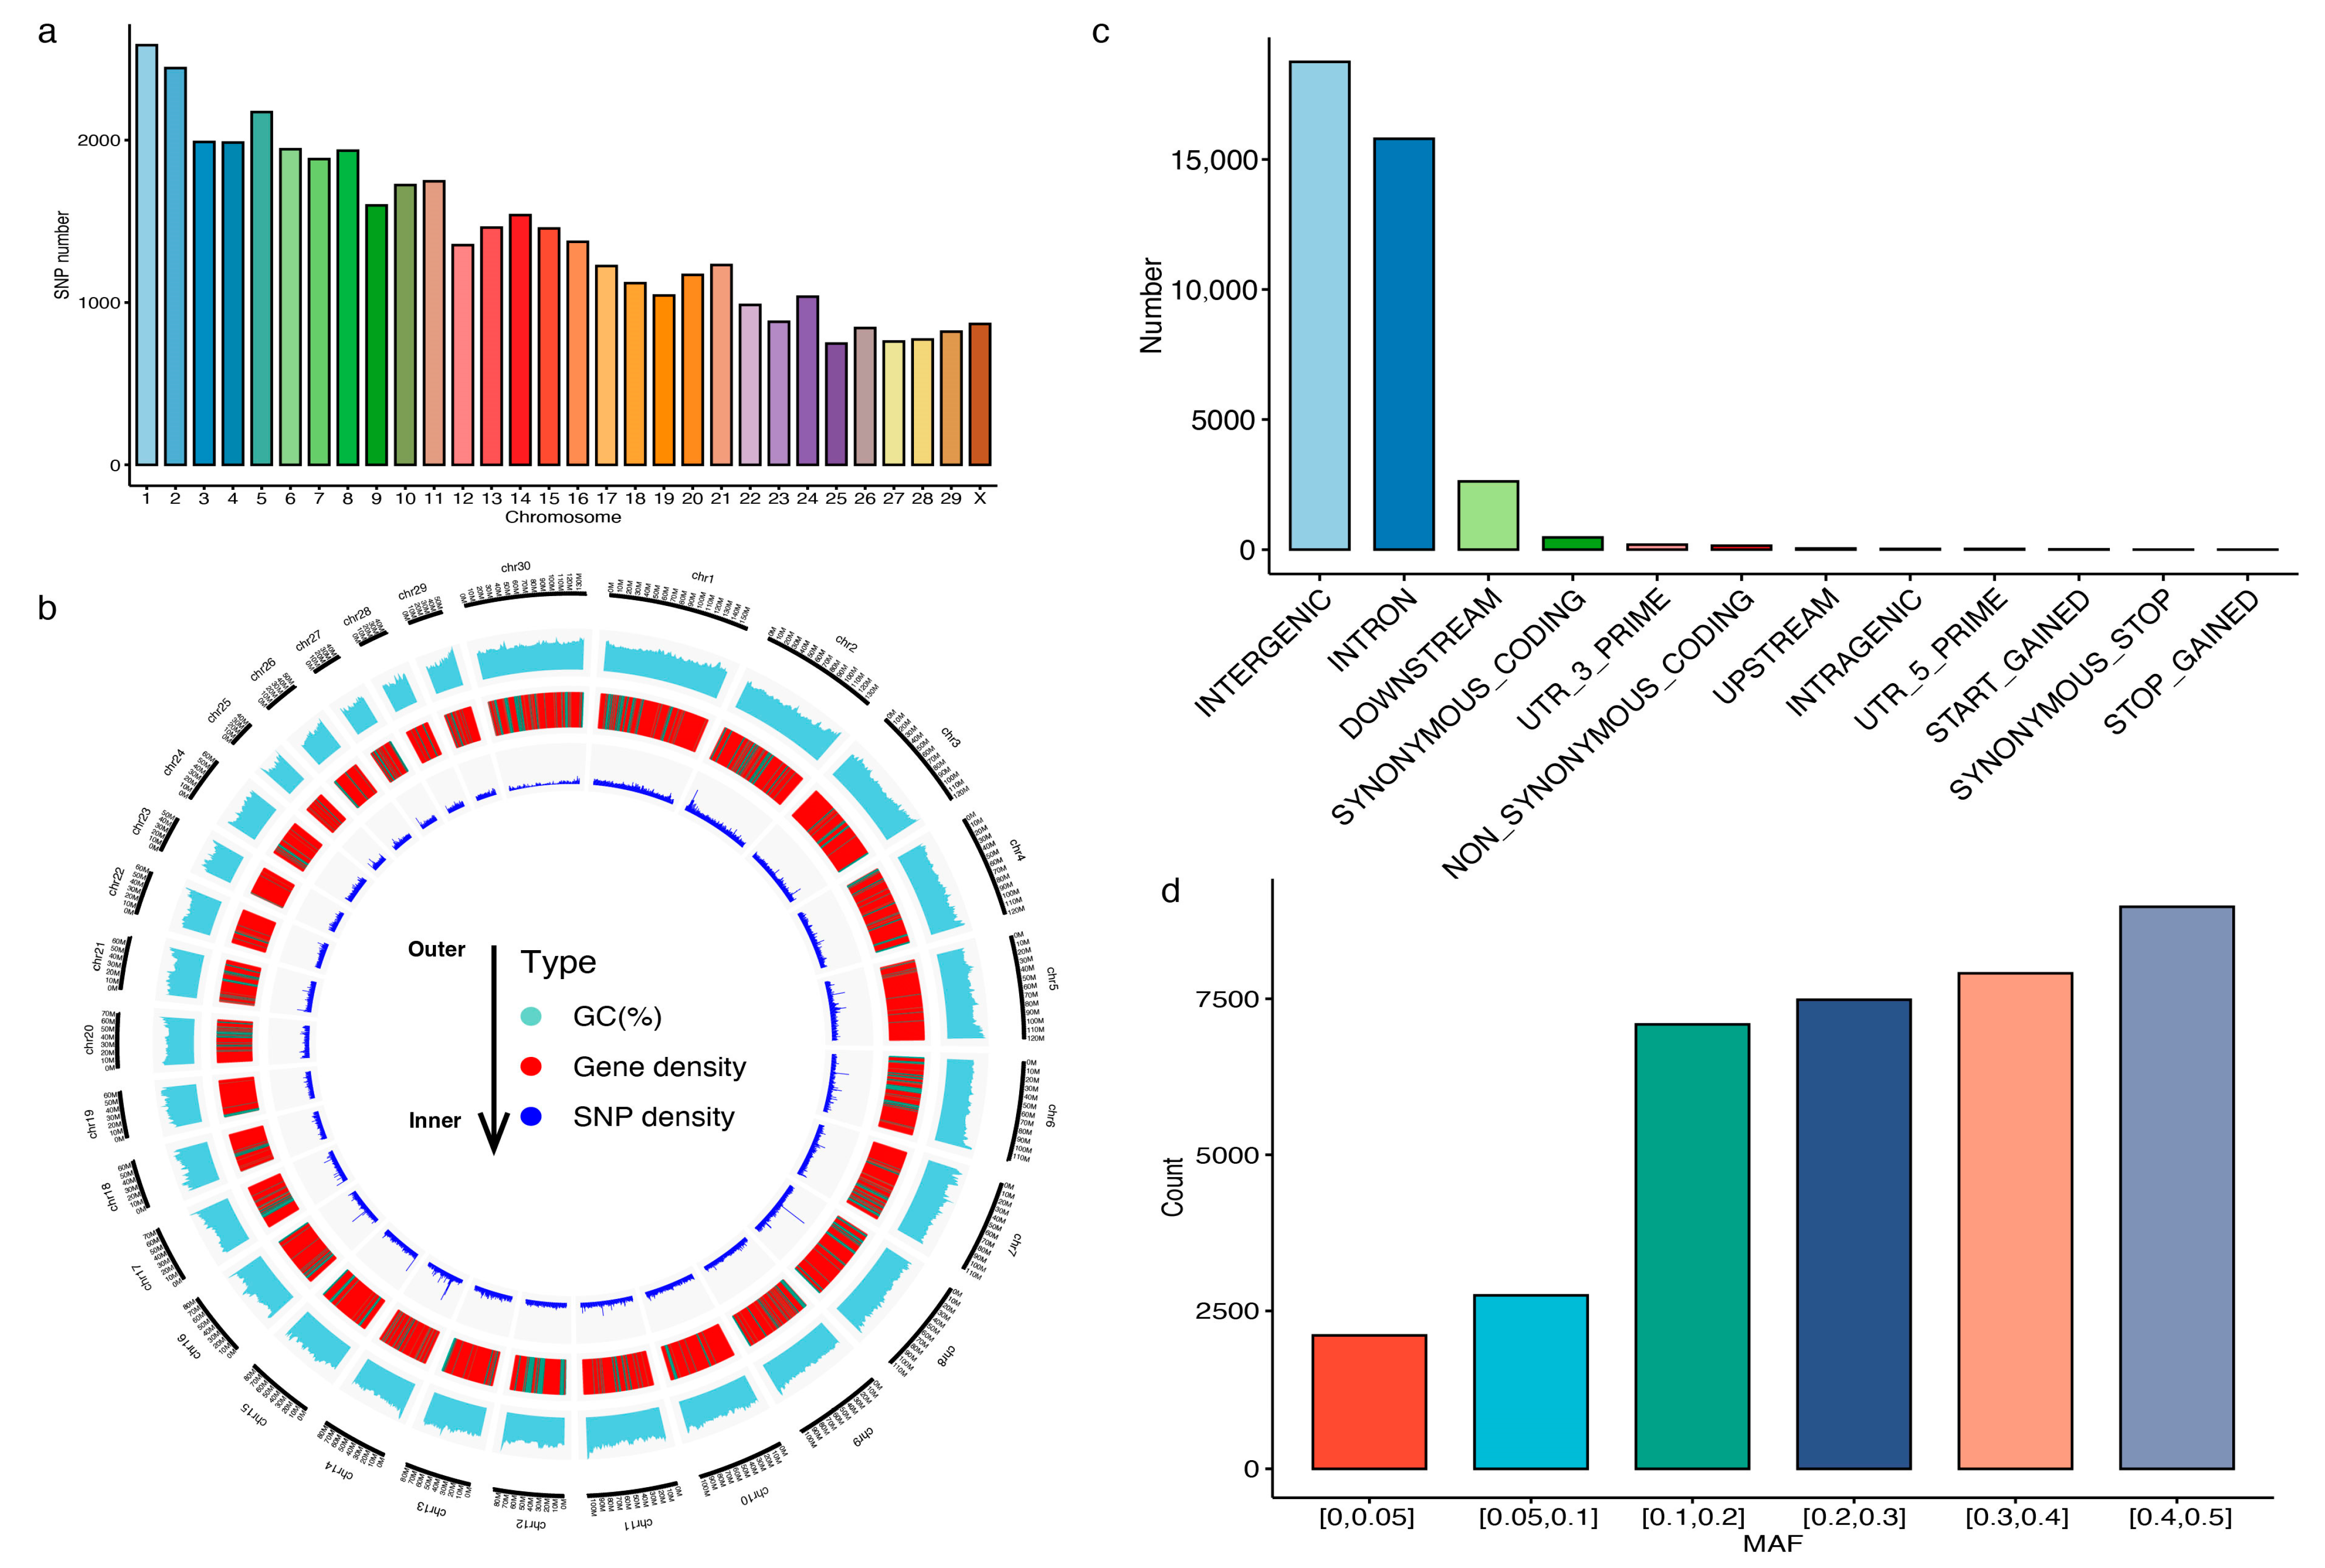
3.1. Characterization of the Customed 40K Chip Panel

To accommodate more potential functional sites on the chip, we selected three types of sites from different sources: breed-specific, trait-related, and common sites. A total of 42,686 SNPs were included in the 40K chip panel, with 4000 sites being breed-specific, 8193 sites being trait-related SNP loci, 19,459 sites being common sites, and 11,034 being polymorphic sites (MAF > 0.2) from WGS data (Supplementary Figure S1). The SNPs on the chip panel were evenly distributed on each bovine chromosome (Figure 1a). The number of SNP loci in the bovine chromosome varied with length, with chromosome 1 having the highest SNP number (N = 2585) and chromosome 25 having the lowest SNP number (N = 747). Notably, GC content was evenly distributed on each chromosome of the bovine genome, and the genes tended to be distributed on both sides of the chromosome (Figure 1b). In particular, the SNP loci in this chip exhibited higher peaks on both sides of the chromosome, suggesting that the SNP loci in this chip may be related to gene location. SNP annotation analysis showed that most SNP loci on the chip were mainly distributed in the intergenic region, followed by the intron and downstream regions (Figure 1c). Moreover, the MAF value of SNP loci on the chip was generally higher than 0.05 (Figure 1d), indicating that the chip design had a reasonable amount of genetic diversity.

3.2. Genotyping Performance of the 40K Chip Panel

To validate the genotyping performance of the 40 K chip panel, 200 individuals from five local Hubei cattle breeds were genotyped. In total, 40,477 SNPs (94.83% of all SNP loci in the panel) were detected in the study population. The average SNP call rate was approximately 99.48% (Figure 2a). We observed a higher SNP call rate in females than in males, but no significant difference (p-value = 0.092) was found between them (Figure 2b). In addition, we found that the SNP call rate varied among the breeds (Figure 2c). All studied breeds exhibited high SNP call rates (>99%), with three breeds (ES, YL, and ZB) demonstrating SNP call rates exceeding 99.5%. Moreover, a lower SNP missingness rate was observed in the studied breeds, with a mean SNP missingness rate of less than 1%. It is noteworthy that the SNP missingness rates among the comparison breeds exhibited statistically significant differences (p-value < 0.05; Figure 2d), whereas no significant difference was observed between males and females (p-value = 0.092; Figure 2e).

3.3. Population Structure Analysis Based on the Chip Data

To evaluate the efficacy of the chip utilized in population genetic studies, we examined breed differentiation among the studied populations based on SNP data, encompassing 205 individuals from six beef cattle breeds. PCA revealed that individuals from each breed could be grouped into two distinct groups (Figure 3a). PC1 accounted for 21.60% of the total variation and separated the foreign breeds (CL and SM) from the local Hubei breeds. PC2 accounted for 2.95% of the explainable variance, which distinctly differentiated the two breeds (HP and YL). Phylogenetic analysis further supported the PCA results, with HP and YL being relatively independent clusters (Figure 3b). In addition, phylogenetic tree analysis revealed that a small subset of individuals exhibited genetic admixture among the four local beef cattle breeds in Hubei. Furthermore, admixture results for K = 2 to K = 4 are shown in Figure 3c, and show that K = 3 represented the most appropriate population number for the present dataset. These results suggest that these animals can be divided into two groups: foreign breeds (CL and SM) and local Hubei breeds. Notably, these local breeds can be inferred to be crossbreeds because they are adulterated with the bloodlines of Charolais and Simental cattle.
Given the significance of LD decay in elucidating the population recombination history, we conducted an LDD analysis for local Hubei breeds using PopLDdecay software. The results showed that the overall estimated LD differed between breeds (Figure 3d). As expected, the LD estimated between pairwise SNPs generally declined with increasing physical distance. The LDD in the ES breed declined faster than in other breeds with increasing distance, whereas the HP breed showed the slowest decline. The average distance when LDD decreased to a value of 0.2 was approximately 50 Kb for the local Hubei breeds.

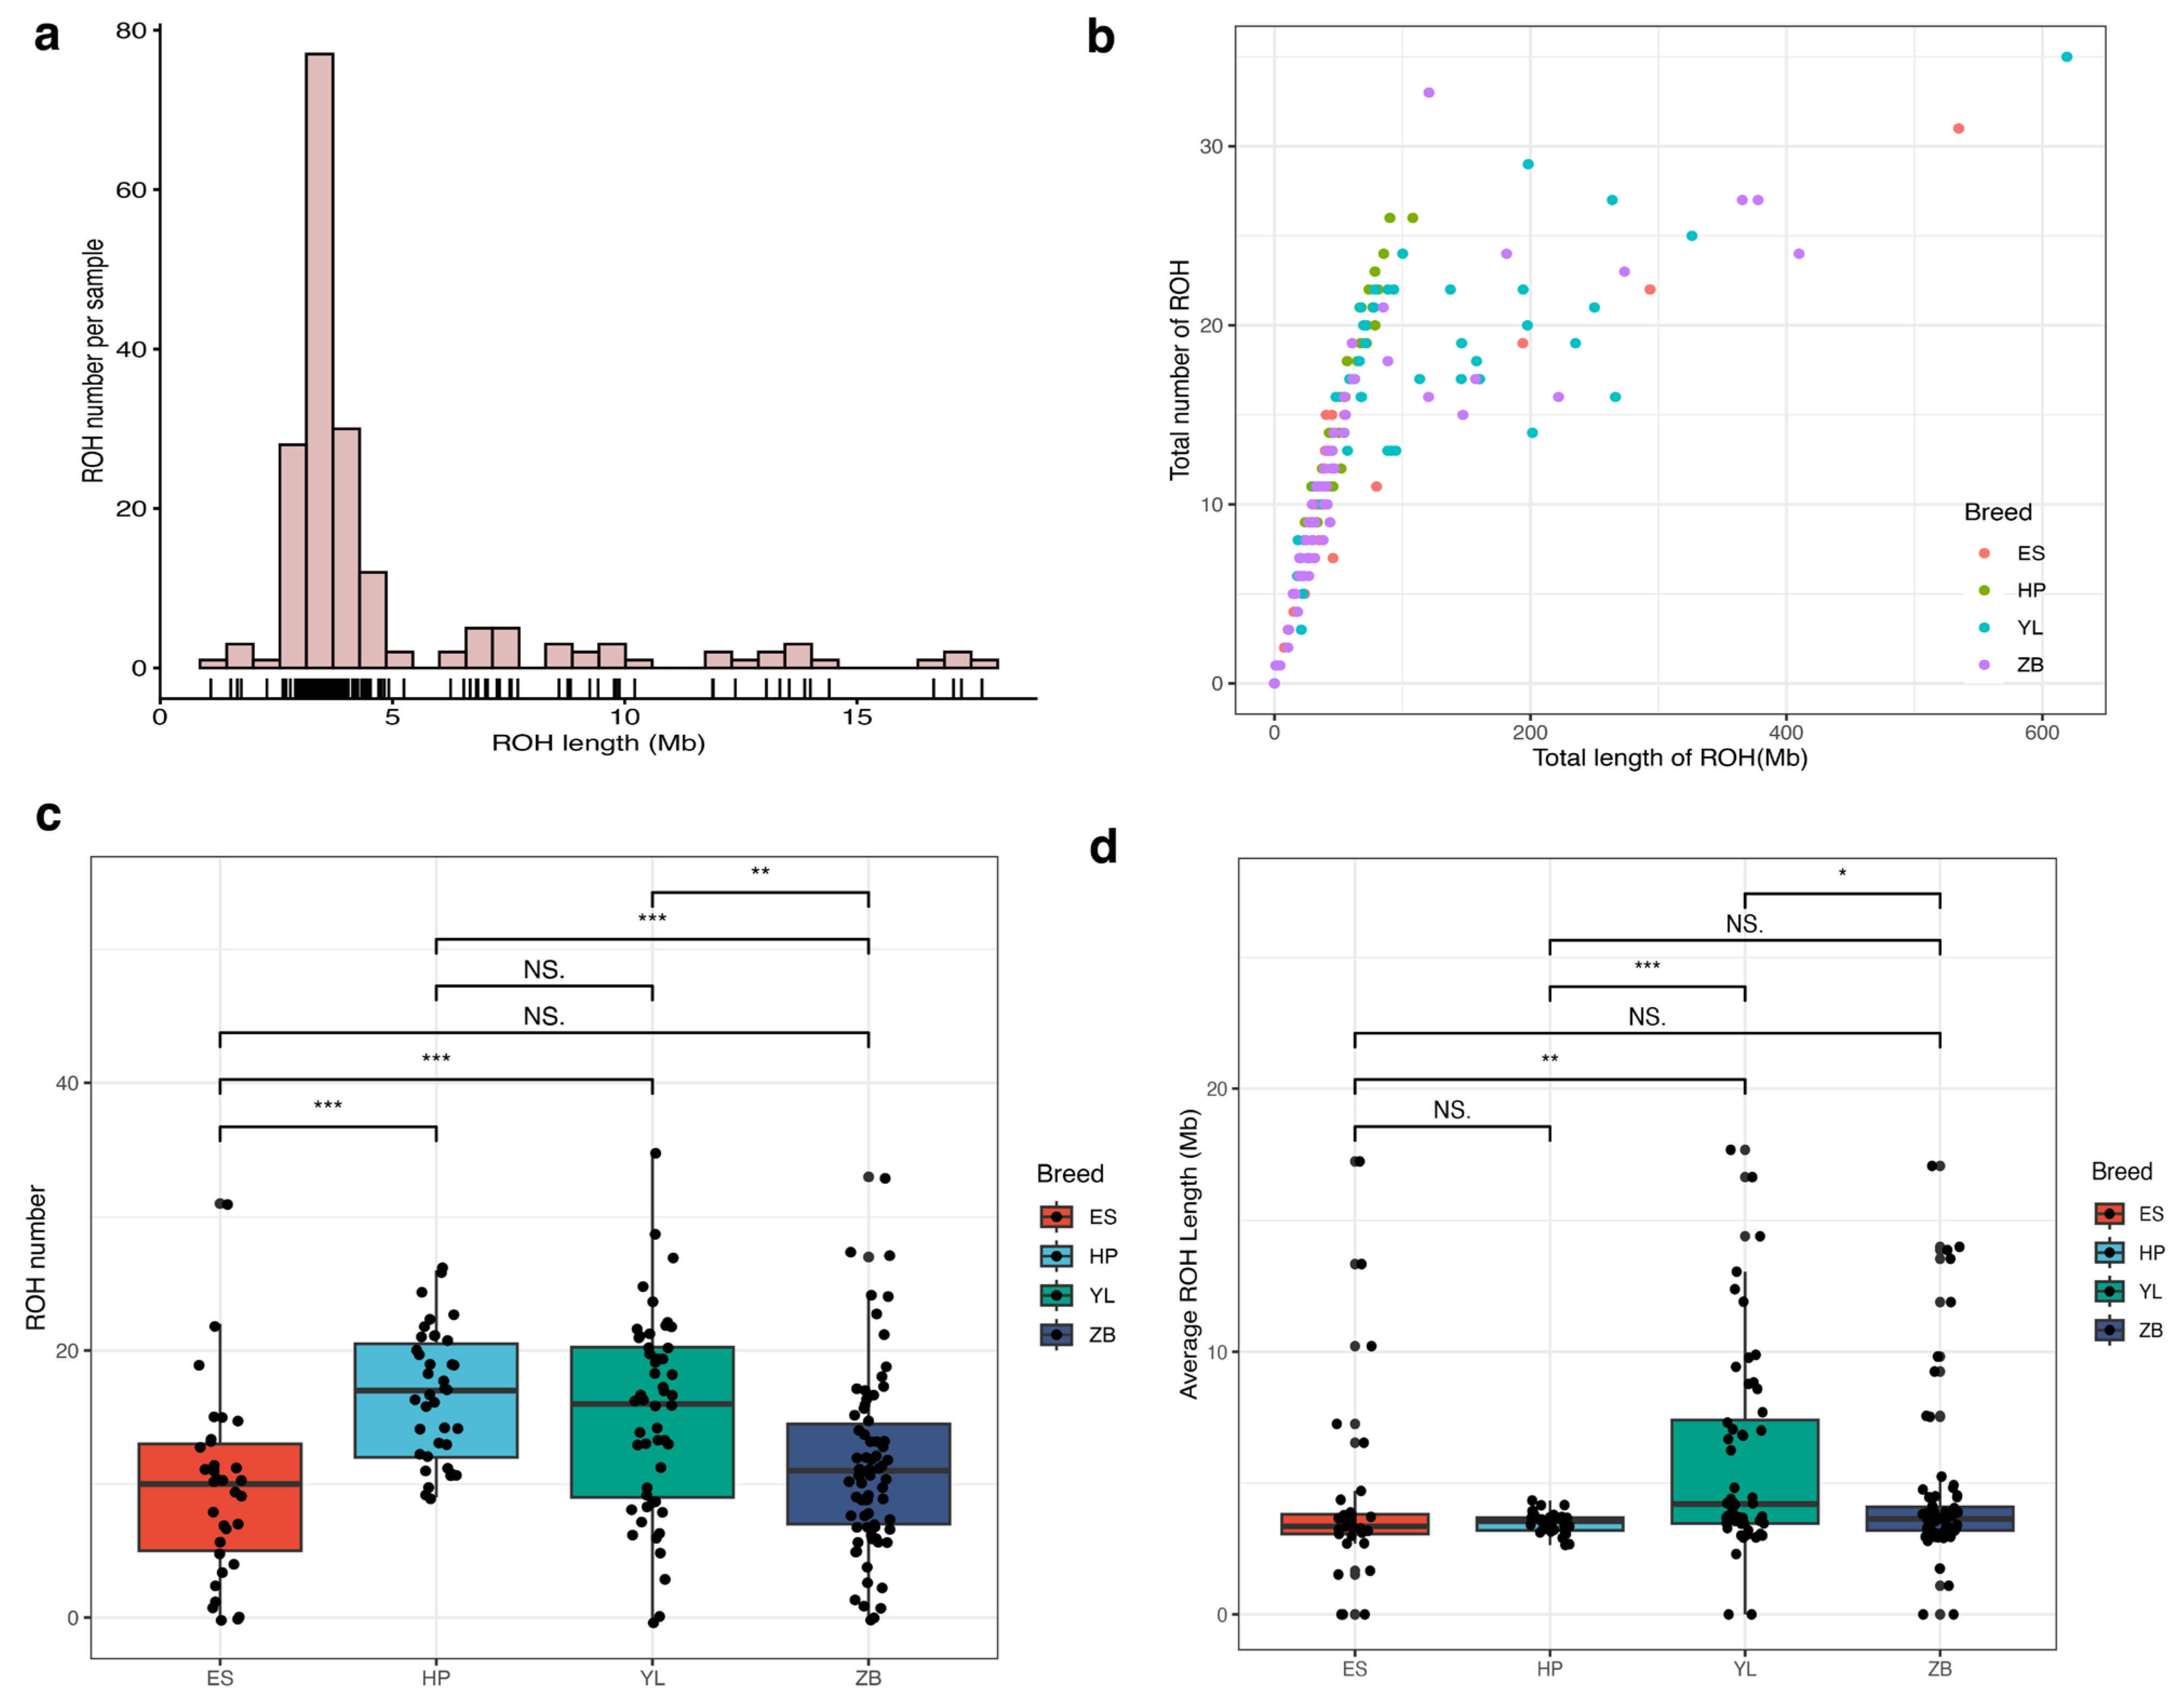
3.4. Runs of Homozygosity Analysis Based on Chip Data

To further evaluate the practicality of the chip in identifying ROH, we performed an ROH analysis based on chip data from four local Hubei breeds. In total, 2547 ROH were identified in 195 individuals. Figure 4a shows the distribution of ROH lengths per individual. The average ROH size varied considerably from 1.09 to 17.69 Mb, with an average size of 4.60 Mb across all autosomes. We also investigated the relationship between the total number of ROH and total length of the genome covered by ROH. The results revealed a significant difference in the aforementioned relationship in the local Hubei cattle population (Figure 4b). Among these populations, both ROH length and coverage were higher in the ES and HP breeds. Conversely, the ROH length and ROH coverage of the YL and ZB cattle populations demonstrated more pronounced differentiation. Furthermore, a higher ROH number was identified in the HP and YL populations than in the other populations (Figure 4c). The number of ROH per animal varied from 1 in ES/ZB to 35 in YL cattle. Notably, the mean ROH length was higher in the YL population than in other populations (Figure 4d).

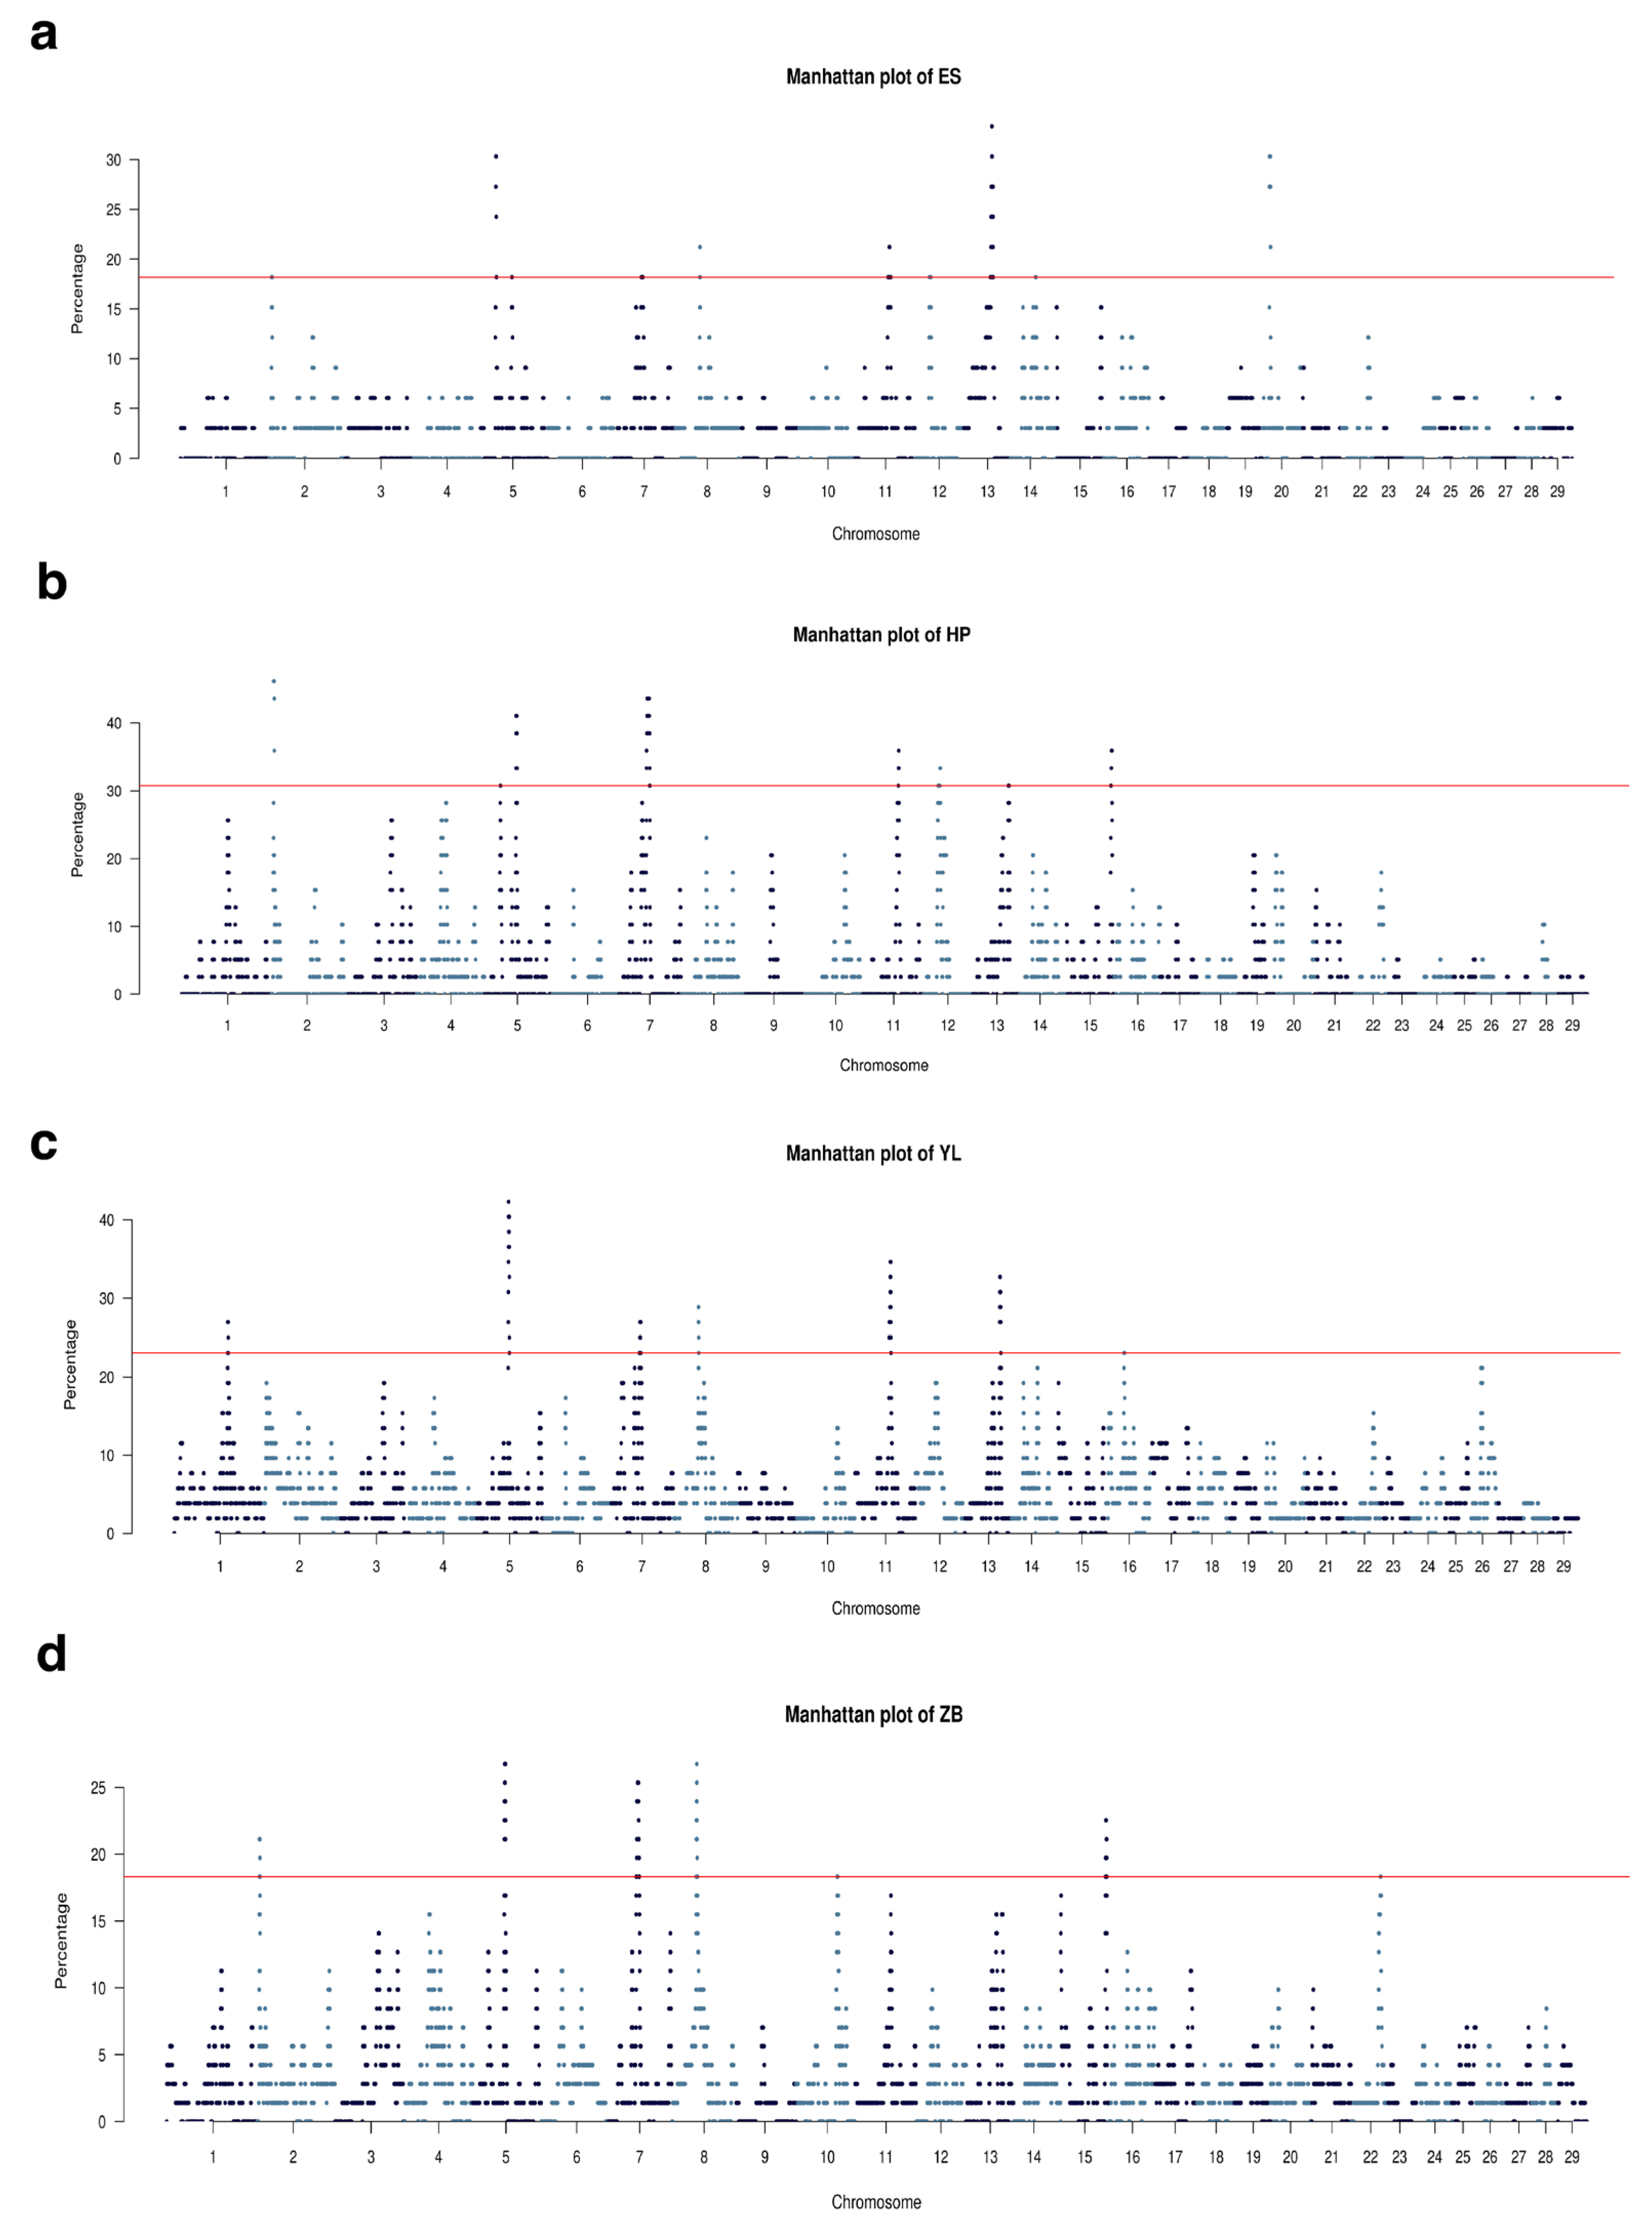
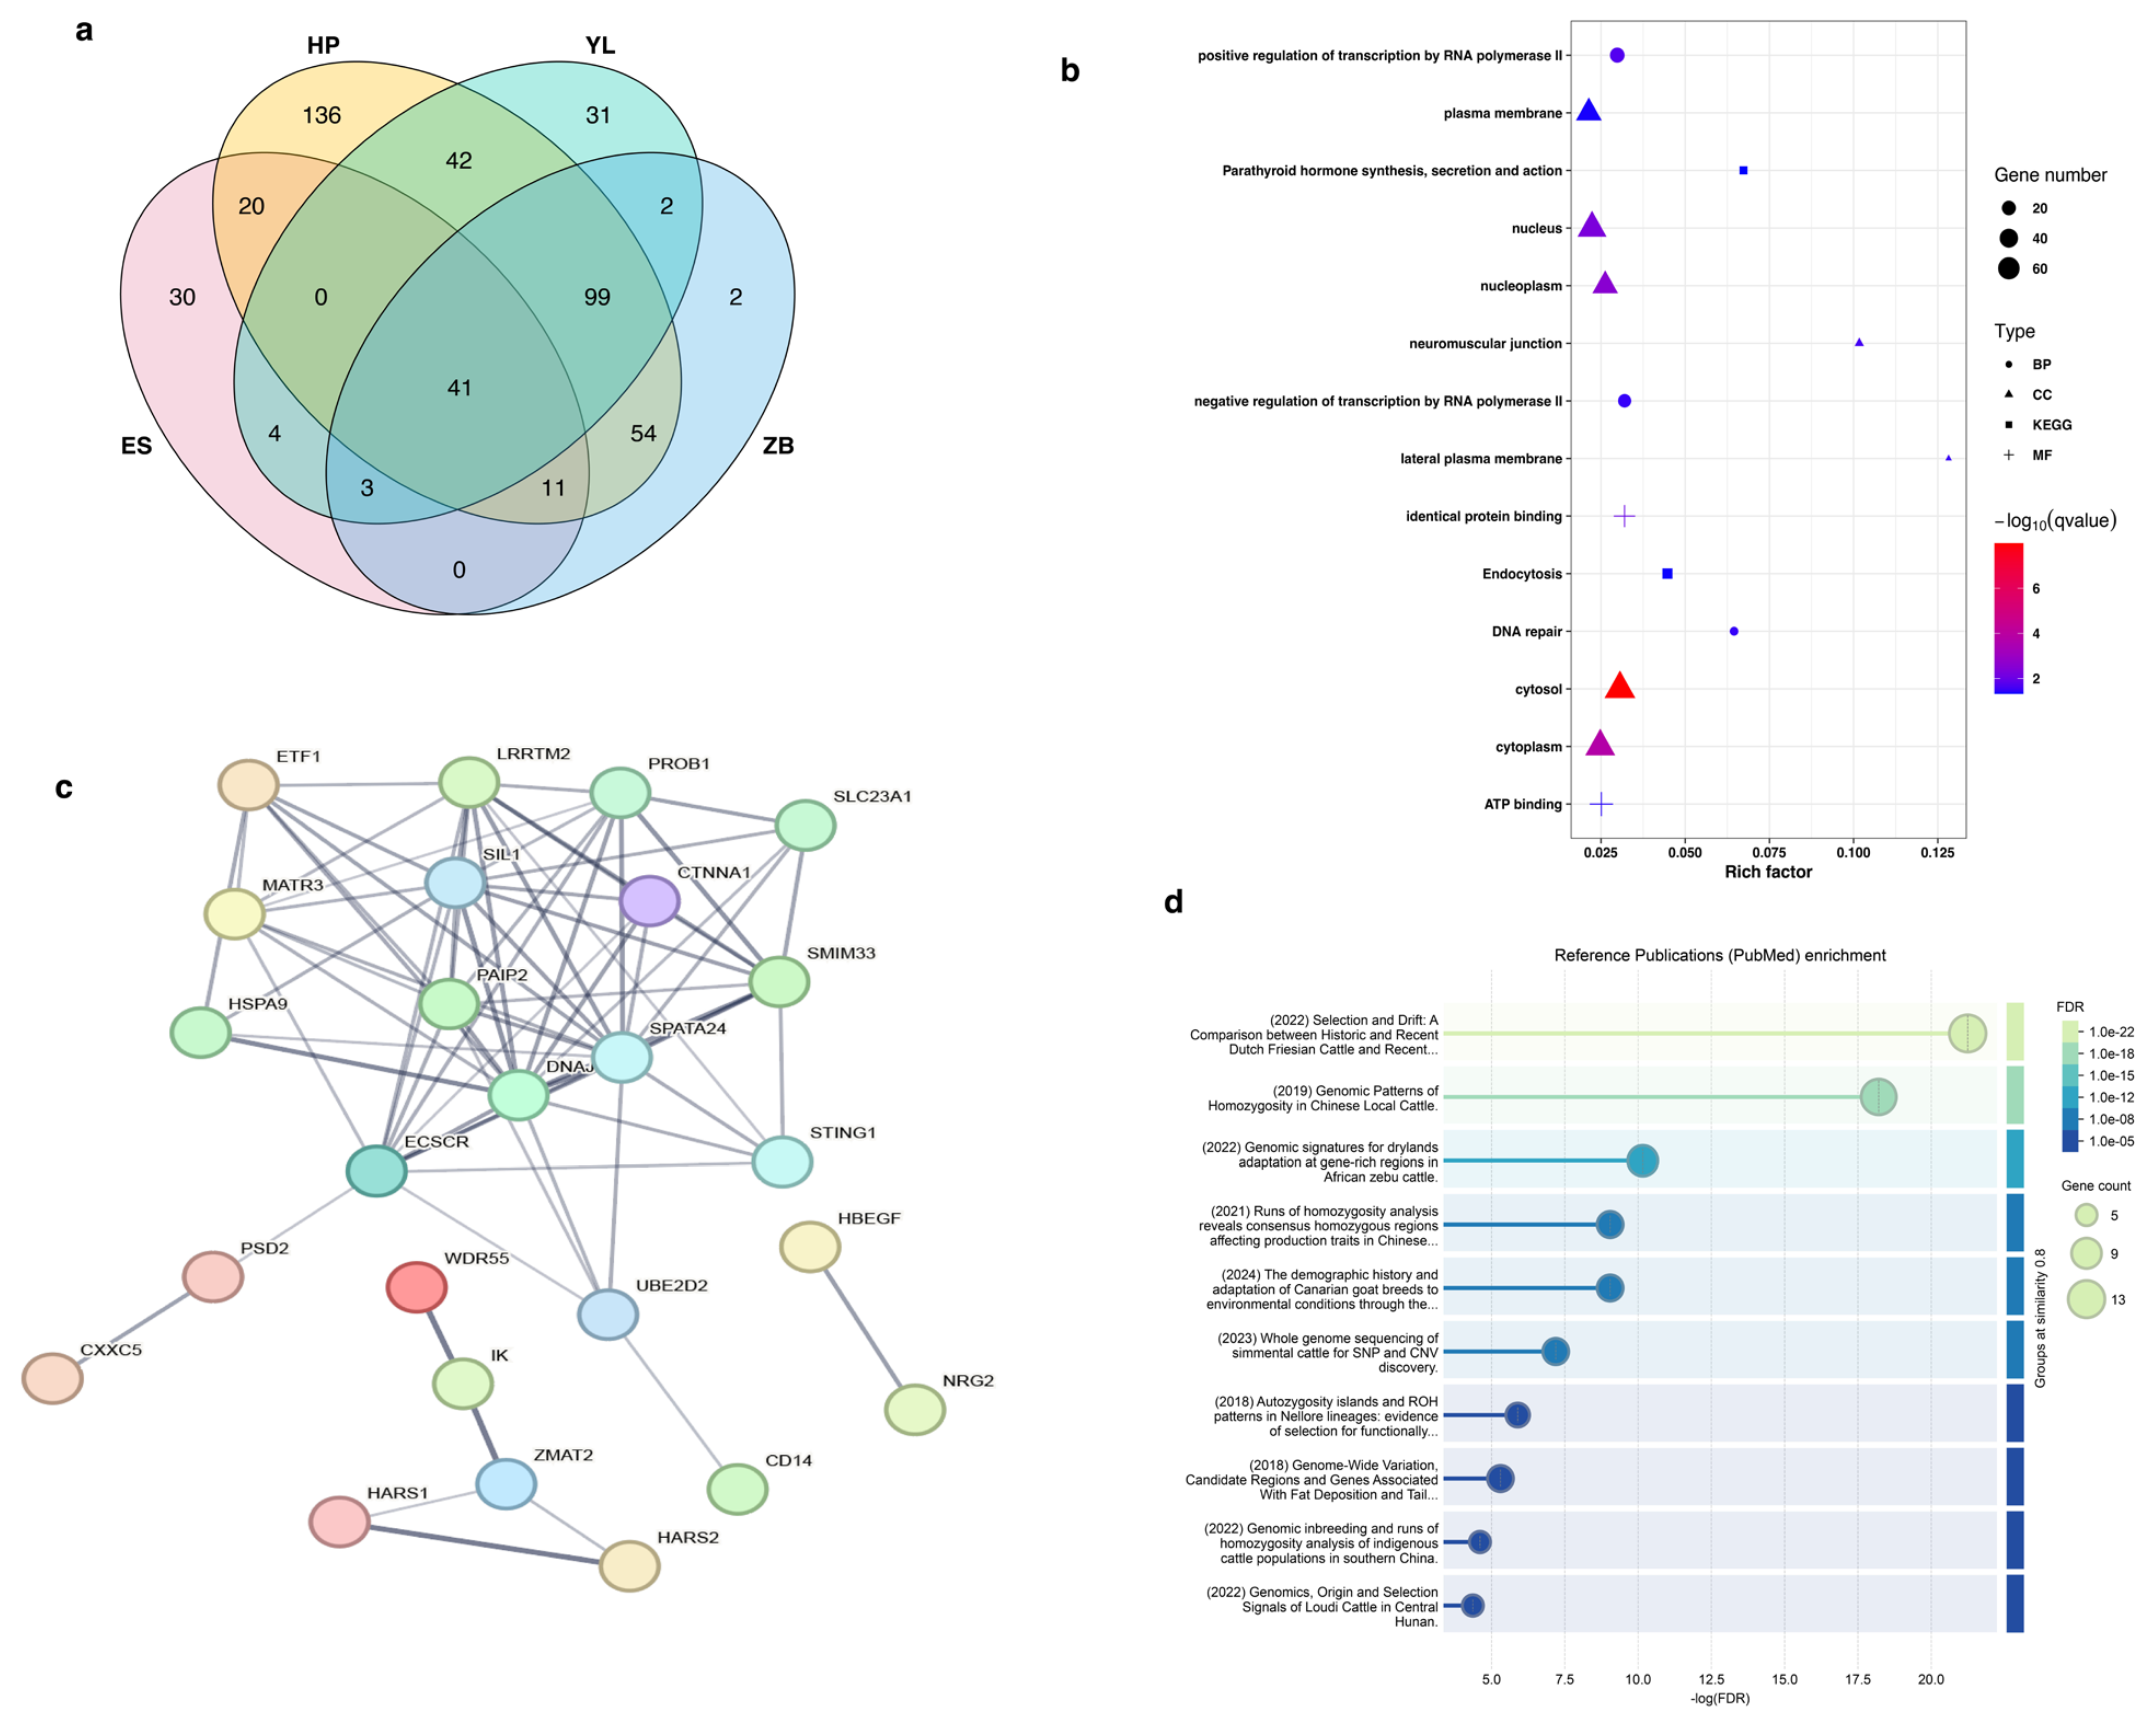
3.5. Runs of Homozygosity Involved in Economically Important Traits

To investigate the effect of selection in local Hubei breeds, we analyzed the occurrence of ROH across the genome. In this study, the frequency of an SNP locus (%) within the identified ROH was evaluated for each breed and plotted against the autosomal chromosomal position of the SNP (Figure 5a–d). The thresholds for ES, HP, YL, and ZB cattle were 0.17, 0.31, 0.23, and 0.18, respectively. The results suggest that the occurrence of ROH exhibited significant variation across the genome among diverse cattle populations. In total, 30 hotspots in the top 1% of the studied population were identified (Table 1). Among these populations, HP cattle exhibited the highest number of identified ROH islands, followed by ES cattle, whereas ZB cattle demonstrated the lowest number of identified ROH islands. The highest numbers of SNPs and genes were observed in HP cattle, whereas ZB cattle had the lowest number of SNPs and genes. Furthermore, the shortest mean length of ROH was 57.1 Mb in ES cattle, whereas YL cattle exhibited the longest ROH length (105.32 Mb) and the greatest cumulative length (619.93 Mb).
Identifying candidate genes in ROH islands facilitates the elucidation of ROH’s role in adaptation to economically important traits in livestock. In this study, we identified 475 unique genes across the four local breeds. To investigate the role of ROH-related genes in phenotypic traits, we predicted their potential functions using the cattle QTL database. The results showed that 42 ROH-related genes were associated with bovine QTLs associated with different traits (Figure 6). Interestingly, we observed that six genes—ARHGAP26, SPOCK1, ADAMTS6, SPRED2, TRIM23, and ZBTB39—clustered into one group that was mainly associated with exterior traits. Seven genes—MY10, ATP1B2, NR4A1, ACADVL, DDIT3, ARHGAP26, and SPOCK1—were found to be associated with milk traits. STAT6 is associated with meat and carcass traits and production traits. Additionally, seven genes (GHSR, ERBB3, RNF41, ZC3H10, PMEL, ITCH, and PIK3R6) were associated with body weight. These results further revealed that genes overlapping with bovine QTL regions could be candidates affecting economically important traits in the local Hubei cattle population.
Furthermore, 41 shared ROH-related genes were observed among the studied breeds (Figure 7a). GO enrichment analysis revealed that these genes were mainly enriched in 12 terms (Figure 7b), including three biological processes (BP), seven cellular compositions (CC), and two molecular functions (MF). Notably, the significantly enriched terms for BP, CC, and MF were the positive regulation of transcription by RNA polymerase II, cytosol, and identical protein binding, respectively. KEGG enrichment analysis revealed that these genes were enriched in two pathways (Figure 7b). The significantly enriched pathway was endocytosis and parathyroid hormone synthesis, secretion, and action. These results suggest that these genes on the ROH islands may play a crucial role in economically important traits of cattle. Furthermore, we explored the protein–protein interaction relationship between shared ROH-related genes using the STRING database. The results showed that these genes clustered into three PPI networks (Figure 7c). The largest PPI network contained 18 genes, with several genes (SIL1, CTNNA1, PAIP2, DNAJC18, SPATA24, and ECSCR) displaying the highest node degrees. Notably, enrichment analysis of reference publications (PubMed) showed that most of these genes were associated with selection and drift in the Dutch Friesian and Holstein Friesian populations, as well as genomic patterns of homozygosity in local Chinese cattle (Figure 7d). These genes included DNAJC18, PAIP2, SLC23A1, LRRTM2, SPATA24, SMIM33, SIL1, UBE2D2, MATR3, PROB1, STING1, CTNNA1, and ECSCR. Interestingly, all the genes were located on bovine chromosome 7 (Table 2), with the region size of the ROH island varying by population.

4. Discussion

In this study, we successfully developed a 40K liquid capture chip specifically for indigenous Hubei beef cattle based on large-scale whole-genome resequencing data. The chip panel contained 42,686 potentially functional SNPs, including breed-specific, trait-related, and common sites found in the commercial chips. In addition, this chip exhibited a high SNP call rate among the local beef cattle breeds in Hubei. Furthermore, we demonstrated the effectiveness and utility of this SNP chip panel in beef cattle genetic research.
Performance analysis of this 40K chip panel revealed that a high SNP call rate was found in the studied population. We noted that both the SNP call rate and missingness rate varied among breeds. Notably, three breeds (ES, YL, and ZB) exhibited high SNP call rates (>99.5%), whereas the HP and YB breeds had a relatively low call rate. The observed discrepancy may be attributed to the heterogeneity in the breed-specific sites incorporated into the chip panel. Nevertheless, the SNP call rates within all studied breeds were over 99.0%, suggesting that this SNP chip panel has good genotyping performance. Furthermore, a comparative analysis between the 40K chip and commercially available bovine breeding chips revealed that 16,959 common loci were genotyped in the studied population, accounting for approximately 89.26% of the total common sites. These genotyped common sites had a higher missingness rate (0.212 ± 3.26) than those in the non-common sites (0.201 ± 2.85), whereas a lower heterozygote rate (30.8% ± 19.7) and MAF (0.214 ± 0.147) values were observed compared to those in the non-common sites (34.5% + 21.3 for heterozygote rate; 0.257 ± 0.157 for MAF). The results indicate that the SNP loci identified in this study, much like the common sites found in commercially available bovine breeding chips, demonstrate excellent capabilities in population genotyping. They can be effectively utilized in different studies on beef cattle population genetics, identifying selection signatures, and dissecting economically important traits.
We used the chip panel to determine population genetic characteristics between foreign and local beef cattle breeds, with 205 individuals representing six breeds. Both PCA and population structure analyses showed that the chip could effectively distinguish between foreign and local Hubei breeds. This may be due to the increase in gene heterogeneity, the expansion in genetic background, and the increase in genetic distance through long-term artificial breeding and natural selection. In contrast, this chip is slightly inferior in its ability to distinguish local beef cattle breeds in Hubei. The reason for this is probably that the genetic differences between local Hubei breeds are relatively small, as the physical distance between these local breed resources is smaller, they may be affected by the same environmental factors, and there may also be gene exchange in local Hubei populations.
We used this chip to identify ROH and associated genes in the local Hubei cattle population. Our data showed that 2547 ROH and 30 hotspots in the top 1% were identified in the study population. Here, we found clear differences in the total number and length of ROH in diverse local Hubei cattle populations. This is consistent with the results of previous studies by Xu et al. [37] and Purfield et al. [40]. Furthermore, we annotated 475 unique genes within the ROH islands and predicted their potential functions in phenotypic traits based on the cattle QTL database. Our data showed that 42 ROH-related genes were associated with bovine QTLs involved in different traits. We found that several genes (ARHGAP26, SPOCK1, ADAMTS6, SPRED2, TRIM23, and ZBTB39) clustered into a single group. Notably, these genes have been reported to be associated with bovine exterior traits [41]. Furthermore, we found seven known genes that were associated with milk traits: MY10 [42], ATP1B2 [42], NR4A1 [43], ACADVL [44], DDIT3 [43], ARHGAP26 [41], and SPOCK1 [41]. In addition, the STAT6 gene is known to be associated with meat and carcass traits, as well as production traits [45,46]. Notably, seven genes—GHSR [47], ERBB3 [48], RNF41 [48], ZC3H10 [48], PMEL [48], ITCH [49], and PIK3R6 [50]—were associated with body weight. These results further revealed that genes overlapping with bovine QTL regions could be candidates affecting economically important traits in cattle, indicating the potential power of the 40K chip panel.
We noticed that 41 shared ROH-related genes were identified in all four local beef cattle breeds. Among them, 13 genes—DNAJC18, PAIP2, SLC23A1, LRRTM2, SPATA24, SMIM33, SIL1, UBE2D2, MATR3, PROB1, STING1, CTNNA1, and ECSCR—were found to be located on bovine chromosome 7 between 48.54 and 54.77 Mb. This region encompassed 119 SNP loci, of which 31 were common sites and 88 were newly identified sites. Interestingly, Hulsegge et al. also found that the largest ROH island in the Dutch Friesian breed was located on chromosome 7 between 50.03 and 50.86 Mb [51]. This region exhibits concordance with the ROH islands documented for taurine and indicine cattle breeds by Sölkner et al. (2014) [52] for eight local Chinese cattle breeds reported by Xu et al. [37] and Alpine cattle breeds [53]. Among these genes, the CTNNA1 gene has been reported to be associated with muscle development, skeletal muscle growth, and meat tenderness [54,55]. DNAJC18 and SIL1 were found to be associated with heat stress and immunity, respectively, in the indigenous cattle population in southern China [56]. PAIP2 [57] and LRRTM2 [58] have been demonstrated to be associated with the maturation of male germ cells and male fertility. The MATR3 gene has also been identified within the overlapping region and is associated with adipose tissue deposition in bovine species [59]. The ECSCR gene plays a role in the regulation of insulin sensitivity and susceptibility to obesity [60]. These findings suggest that the genomic region on chromosome 7 between 48.54 and 54.77 Mb represents a significant ROH island contributing to economically important traits in cattle populations.

5. Conclusions

A liquid-phase SNP chip panel consisting of 42,686 SNP loci that encompass the primary genetic diversity of indigenous beef cattle in Hubei was developed using WGS data. This chip panel is proven to be a valuable tool for conducting genetic analyses and implementing selective breeding programs for beef cattle populations in Hubei. Population genetics and ROH analysis based on the chip data elucidated the genetic distinctions between local and foreign breeds and identified genes strongly associated with economically important traits. Although some evidence from Cattle QTLdb has been documented, further validation is necessary to understand the impact and regulatory mechanisms of these identified genes in beef cattle traits.
The current findings not only augment the genetic resources of indigenous bovine populations but also provide a substantive foundation for future molecular breeding strategies and genetic enhancement initiatives.

Supplementary Materials

The following supporting information can be downloaded at https://www.mdpi.com/article/10.3390/ani15091346/s1. Table S1: Detailed information on the WGS dataset for 98 beef cattle individuals; Figure S1: Study design and workflow of 40K liquid capture chip for Hubei indigenous beef cattle.

Author Contributions

Writing—original draft, writing—review and editing, investigation, visualization, formal analysis, data curation, funding acquisition, conceptualization, Q.L.; writing—review and editing, writing—original draft, software, methodology, formal analysis, data curation, L.S.; formal analysis, data curation, P.Z.; writing—review and editing, resources, B.Y.; resources, investigation, C.L., M.X., S.L. and L.L.; writing—review and editing, supervision, resources, funding acquisition, L.C.; writing—review and editing, supervision, resources, methodology, funding acquisition, project administration, conceptualization, H.C. All authors have read and agreed to the published version of the manuscript.

Funding

This research was funded by the Key R&D Project of the Department of Science and Technology of Hubei Province (2022BBA007 and 2023BBB022) and development of intelligent breeding information supervision cloud platform of cattle farm and modern genetic improvement technology of Zaobei cattle (104-08025082) of Hubei Cereals, Oils and Foodstuffs lmport and Export Group Co., Ltd.

Institutional Review Board Statement

All animal procedures adhered to the guidelines of Hubei Provincial Regulation on Administration of Laboratory Animals (1 October 2005). The animal study protocol was approved by the Ethics Committee of Wuhan Polytechnic University (protocol code WPU202109002, date of approval 15 September 2021). Throughout sampling and data collection, no animals experienced discomfort or undernourishment.

Informed Consent Statement

Not applicable.

Data Availability Statement

The data that support the study findings are available from the authors upon request.

Acknowledgments

We extend our heartfelt gratitude to the following institutions, enterprises, and participants, whose invaluable contributions facilitated the sample-collection process: Wuhan Academy of Agricultural Sciences (Xiuzhong Hu), Enshi Tujia and Miao Autonomous Prefecture Academy of Agricultural Sciences (Jiqian Xiang, Yunfen Zhu, Xiaofei Chen), Yiling District Animal Disease Prevention and Control Center (Bo Yu, Yincheng Zhu), Hubei Science and Technology Commissioner Workstation (Fenxiang town, Yiling district, Yichang city), Hubei Jinchu Husbandry Co., Ltd., Hubei Agricultural Development Jinniu Technology Co., Ltd., Hong’an county Binghe breeding professional cooperatives, Yichang Balihuang Husbandry Co., Ltd., Enshi Haifu Agricultural Development Co., Ltd., and Zhushan Hengkun Husbandry Co., Ltd.

Conflicts of Interest

Shuilian Li and Lei Liu are employed by Hubei Jinchu Husbandry Co., Ltd. The other authors declare no conflicts of interest.

References

  1. Wang, H.; Wu, H.; Zhang, W.; Jiang, J.; Qian, H.; Man, C.; Gao, H.; Chen, Q.; Du, L.; Chen, S.; et al. Development and Validation of a 5K Low-Density SNP Chip for Hainan Cattle. BMC Genom. 2024, 25, 873. [Google Scholar] [CrossRef] [PubMed]
  2. Burrow, H.; Goddard, M. Application of Genetics and Genomics in Livestock Production. Agriculture 2023, 13, 386. [Google Scholar] [CrossRef]
  3. Nayak, S.S.; Rajawat, D.; Jain, K.; Sharma, A.; Gondro, C.; Tarafdar, A.; Dutt, T.; Panigrahi, M. A Comprehensive Review of Livestock Development: Insights into Domestication, Phylogenetics, Diversity, and Genomic Advances. Mamm. Genome 2024, 35, 577–599. [Google Scholar] [CrossRef] [PubMed]
  4. Jones, H.E.; Wilson, P.B. Progress and Opportunities through Use of Genomics in Animal Production. Trends Genet. 2022, 38, 1228–1252. [Google Scholar] [CrossRef]
  5. Deng, T.X.; Ma, X.Y.; Lu, X.R.; Duan, A.Q.; Shokrollahi, B.; Shang, J.H. Signatures of Selection Reveal Candidate Genes Involved in Production Traits in Chinese Crossbred Buffaloes. J. Dairy. Sci. 2022, 105, 1327–1337. [Google Scholar] [CrossRef]
  6. Tolone, M.; Sardina, M.T.; Criscione, A.; Lasagna, E.; Senczuk, G.; Rizzuto, I.; Riggio, S.; Moscarelli, A.; Macaluso, V.; Di Gerlando, R.; et al. High-Density Single Nucleotide Polymorphism Markers Reveal the Population Structure of 2 Local Chicken Genetic Resources. Poult. Sci. 2023, 102, 102692. [Google Scholar] [CrossRef]
  7. More, M.; Veli, E.; Cruz, A.; Gutiérrez, J.P.; Gutiérrez, G.; Ponce de León, F.A. Genome-Wide Association Study of Fiber Diameter in Alpacas. Animal 2023, 13, 3316. [Google Scholar] [CrossRef]
  8. Neumann, G.B.; Korkuć, P.; Arends, D.; Wolf, M.J.; May, K.; Reißmann, M.; Elzaki, S.; König, S.; Brockmann, G.A. Design and Performance of a Bovine 200 k SNP Chip Developed for Endangered German Black Pied Cattle (DSN). BMC Genom. 2021, 22, 905. [Google Scholar] [CrossRef]
  9. Anderson, R.M. Development of a High Density (600K) Illumina Ovine SNP Chip and Its Use to Fine Map the Yellow Fat Locus. In Proceedings of the Plant and Animal Genome XXII Conference, San Diego, CA, USA, 12–17 January 2014. [Google Scholar]
  10. Qiao, X.; Su, R.; Wang, Y.; Wang, R.; Yang, T.; Li, X.; Chen, W.; He, S.; Jiang, Y.; Xu, Q.; et al. Genome-Wide Target Enrichment-Aided Chip Design: A 66 K SNP Chip for Cashmere Goat. Sci. Rep. 2017, 7, 8621. [Google Scholar] [CrossRef]
  11. Ramos, A.M.; Crooijmans, R.P.M.A.; Affara, N.A.; Amaral, A.J.; Archibald, A.L.; Beever, J.E.; Bendixen, C.; Churcher, C.; Clark, R.; Dehais, P.; et al. Design of a High Density SNP Genotyping Assay in the Pig Using SNPs Identified and Characterized by next Generation Sequencing Technology. PLoS ONE 2009, 4, e6524. [Google Scholar] [CrossRef]
  12. Iamartino, D.; Nicolazzi, E.L.; Van Tassell, C.P.; Reecy, J.M.; Fritz-Waters, E.R.; Koltes, J.E.; Biffani, S.; Sonstegard, T.S.; Schroeder, S.G.; Ajmone-Marsan, P.; et al. Design and Validation of a 90K SNP Genotyping Assay for the Water Buffalo (Bubalus Bubalis). PLoS ONE 2017, 12, e0185220. [Google Scholar] [CrossRef]
  13. Cañas-Álvarez, J.J.; González-Rodríguez, A.; Munilla, S.; Varona, L.; Díaz, C.; Baro, J.A.; Altarriba, J.; Molina, A.; Piedrafita, J. Genetic Diversity and Divergence among Spanish Beef Cattle Breeds Assessed by a Bovine High-Density SNP Chip. J. Anim. Sci. 2015, 93, 5164–5174. [Google Scholar] [CrossRef]
  14. Liu, B.; Tao, W.; Feng, D.; Wang, Y.; Heizatuola, N.; Ahemetbai, T.; Wu, W. Revealing Genetic Diversity and Population Structure of Endangered Altay White-Headed Cattle Population Using 100 k SNP Markers. Animals 2022, 12, 3214. [Google Scholar] [CrossRef]
  15. Ramey, H.R.; Decker, J.E.; McKay, S.D.; Rolf, M.M.; Schnabel, R.D.; Taylor, J.F. Detection of Selective Sweeps in Cattle Using Genome-Wide SNP Data. BMC Genom. 2013, 14, 382. [Google Scholar] [CrossRef]
  16. Schwarz, L.; Križanac, A.-M.; Schneider, H.; Falker-Gieske, C.; Heise, J.; Liu, Z.; Bennewitz, J.; Thaller, G.; Tetens, J. Genetic and Genomic Analysis of Reproduction Traits in Holstein Cattle Using SNP Chip Data and Imputed Sequence Level Genotypes. BMC Genom. 2024, 25, 880. [Google Scholar] [CrossRef]
  17. Teng, J.; Wang, D.; Zhao, C.; Zhang, X.; Chen, Z.; Liu, J.; Sun, D.; Tang, H.; Wang, W.; Li, J.; et al. Longitudinal Genome-Wide Association Studies of Milk Production Traits in Holstein Cattle Using Whole-Genome Sequence Data Imputed from Medium-Density Chip Data. J. Dairy. Sci. 2023, 106, 2535–2550. [Google Scholar] [CrossRef]
  18. Ghoreishifar, S.M.; Moradi-Shahrbabak, H.; Fallahi, M.H.; Jalil Sarghale, A.; Moradi-Shahrbabak, M.; Abdollahi-Arpanahi, R.; Khansefid, M. Genomic Measures of Inbreeding Coefficients and Genome-Wide Scan for Runs of Homozygosity Islands in Iranian River Buffalo, Bubalus Bubalis. BMC Genet. 2020, 21, 16. [Google Scholar] [CrossRef]
  19. Oliveira, C.S.; Camargo, L.S.A.; da Silva, M.V.G.B.; Saraiva, N.Z.; Quintão, C.C.; Machado, M.A. Embryo Biopsies for Genomic Selection in Tropical Dairy Cattle. Anim. Reprod. 2023, 20, e20230064. [Google Scholar] [CrossRef]
  20. Balog, K.; Mizeranschi, A.E.; Wanjala, G.; Sipos, B.; Kusza, S.; Bagi, Z. Application Potential of Chicken DNA Chip in Domestic Pigeon Species - Preliminary Results. Saudi J. Biol. Sci. 2023, 30, 103594. [Google Scholar] [CrossRef]
  21. Chen, Y.; Guo, Y.; Ge, F.; Gao, H.; Zhou, J.; Wu, X.; Qian, C.; Wang, Z.; Wang, Z.; Zhu, B.; et al. Developing a Liquid Capture Chip to Accelerate the Genetic Progress of Cattle. Anim. Res. One Health 2024, 2, 204–216. [Google Scholar] [CrossRef]
  22. Wang, F.; Guo, Y.; Liu, Z.; Wang, Q.; Jiang, Y.; Zhao, G. New Insights into the Novel Sequences of the Chicken Pan-Genome by Liquid Chip. J. Anim. Sci. 2022, 100, skac336. [Google Scholar] [CrossRef]
  23. Zhang, Z.; Xing, S.; Qiu, A.; Zhang, N.; Wang, W.; Qian, C.; Zhang, J.; Wang, C.; Zhang, Q.; Ding, X. The Development of a Porcine 50K SNP Panel Using Genotyping by Target Sequencing and Its Application1. J. Integr. Agric. 2023, 24, 1930–1943. [Google Scholar] [CrossRef]
  24. Guo, Y.; Bai, F.; Wang, J.; Fu, S.; Zhang, Y.; Liu, X.; Zhang, Z.; Shao, J.; Li, R.; Wang, F.; et al. Design and Characterization of a High-Resolution Multiple-SNP Capture Array by Target Sequencing for Sheep. J. Anim. Sci. 2023, 101, skac383. [Google Scholar] [CrossRef]
  25. Guan, S.; Li, W.; Jin, H.; Zhang, L.; Liu, G. Development and Validation of a 54K Genome-Wide Liquid SNP Chip Panel by Target Sequencing for Dairy Goat. Genes 2023, 14, 1122. [Google Scholar] [CrossRef]
  26. Meng, Y.; Zhang, W.; Cheng, Y.; Wu, Y.; Wu, H.; He, M.; Chen, S.; Man, C.; Gao, H.; Du, L.; et al. Development and Verification of a 10K Liquid Chip for Hainan Black Goat Based on Genotyping by Pinpoint Sequencing of Liquid Captured Targets. BMC Genom. Data 2024, 25, 44. [Google Scholar] [CrossRef]
  27. Bolger, A.M.; Lohse, M.; Usadel, B. Trimmomatic: A Flexible Trimmer for Illumina Sequence Data. Bioinformatics 2014, 30, 2114–2120. [Google Scholar] [CrossRef]
  28. Vasimuddin, M.; Misra, S.; Li, H.; Aluru, S. Efficient Architecture-Aware Acceleration of BWA-MEM for Multicore Systems. In Proceedings of the 2019 IEEE international parallel and distributed processing symposium (IPDPS), Rio de Janeiro, Brazil, 20–24 May 2019; pp. 314–324. [Google Scholar]
  29. McKenna, A.; Hanna, M.; Banks, E.; Sivachenko, A.; Cibulskis, K.; Kernytsky, A.; Garimella, K.; Altshuler, D.; Gabriel, S.; Daly, M.; et al. The Genome Analysis Toolkit: A MapReduce Framework for Analyzing next-Generation DNA Sequencing Data. Genome Res. 2010, 20, 1297–1303. [Google Scholar] [CrossRef]
  30. Purcell, S.; Neale, B.; Todd-Brown, K.; Thomas, L.; Ferreira, M.A.R.; Bender, D.; Maller, J.; Sklar, P.; de Bakker, P.I.W.; Daly, M.J.; et al. PLINK: A Tool Set for Whole-Genome Association and Population-Based Linkage Analyses. Am. J. Hum. Genet. 2007, 81, 559–575. [Google Scholar] [CrossRef]
  31. Kavakiotis, I.; Triantafyllidis, A.; Ntelidou, D.; Alexandri, P.; Megens, H.-J.; Crooijmans, R.P.M.A.; Groenen, M.A.M.; Tsoumakas, G.; Vlahavas, I. TRES: Identification of Discriminatory and Informative SNPs from Population Genomic Data. J. Hered. 2015, 106, 672–676. [Google Scholar] [CrossRef]
  32. Cai, W.; Zhang, Y.; Chang, T.; Wang, Z.; Zhu, B.; Chen, Y.; Gao, X.; Xu, L.; Zhang, L.; Gao, H.; et al. The eQTL Colocalization and Transcriptome-Wide Association Study Identify Potentially Causal Genes Responsible for Economic Traits in Simmental Beef Cattle. J. Anim. Sci. Biotechnol. 2023, 14, 78. [Google Scholar] [CrossRef]
  33. Liu, R.; Xing, S.; Wang, J.; Zheng, M.; Cui, H.; Crooijmans, R.P.M.A.; Li, Q.; Zhao, G.; Wen, J. A New Chicken 55K SNP Genotyping Array. BMC Genom. 2019, 20, 410. [Google Scholar] [CrossRef]
  34. Weimin, H. VCF2Dis. Available online: https://github.com/BGI-shenzhen/VCFDis (accessed on 12 December 2024).
  35. Alexander, D.H.; Novembre, J.; Lange, K. Fast Model-Based Estimation of Ancestry in Unrelated Individuals. Genome Res. 2009, 19, 1655–1664. [Google Scholar] [CrossRef]
  36. Zhang, C.; Dong, S.-S.; Xu, J.-Y.; He, W.-M.; Yang, T.-L. PopLDdecay: A Fast and Effective Tool for Linkage Disequilibrium Decay Analysis Based on Variant Call Format Files. Bioinformatics 2018, 35, 1786–1788. [Google Scholar] [CrossRef]
  37. Xu, L.; Zhao, G.; Yang, L.; Zhu, B.; Chen, Y.; Zhang, L.; Gao, X.; Gao, H.; Liu, G.E.; Li, J. Genomic Patterns of Homozygosity in Chinese Local Cattle. Sci. Rep. 2019, 9, 16977. [Google Scholar] [CrossRef]
  38. Quinlan, A.R.; Hall, I.M. BEDTools: A Flexible Suite of Utilities for Comparing Genomic Features. Bioinformatics 2010, 26, 841–842. [Google Scholar] [CrossRef]
  39. Bu, D.; Luo, H.; Huo, P.; Wang, Z.; Zhang, S.; He, Z.; Wu, Y.; Zhao, L.; Liu, J.; Guo, J.; et al. KOBAS-i: Intelligent Prioritization and Exploratory Visualization of Biological Functions for Gene Enrichment Analysis. Nucleic Acids Res. 2021, 49, W317–W325. [Google Scholar] [CrossRef]
  40. Purfield, D.C.; Berry, D.P.; McParland, S.; Bradley, D.G. Runs of Homozygosity and Population History in Cattle. BMC Genet. 2012, 13, 70. [Google Scholar] [CrossRef]
  41. Cole, J.B.; Wiggans, G.R.; Ma, L.; Sonstegard, T.S.; Lawlor, T.J.; Crooker, B.A.; Van Tassell, C.P.; Yang, J.; Wang, S.; Matukumalli, L.K.; et al. Genome-Wide Association Analysis of Thirty One Production, Health, Reproduction and Body Conformation Traits in Contemporary U.S. Holstein Cows. BMC Genom. 2011, 12, 408. [Google Scholar] [CrossRef]
  42. Li, B.; VanRaden, P.M.; Null, D.J.; O’Connell, J.R.; Cole, J.B. Major Quantitative Trait Loci Influencing Milk Production and Conformation Traits in Guernsey Dairy Cattle Detected on Bos Taurus Autosome 19. J. Dairy. Sci. 2021, 104, 550–560. [Google Scholar] [CrossRef] [PubMed]
  43. Li, Y.; Han, B.; Liu, L.; Zhao, F.; Liang, W.; Jiang, J.; Yang, Y.; Ma, Z.; Sun, D. Genetic Association of DDIT3, RPL23A, SESN2 and NR4A1 Genes with Milk Yield and Composition in Dairy Cattle. Anim. Genet. 2019, 50, 123–135. [Google Scholar] [CrossRef] [PubMed]
  44. Peng, P.; Liu, Y.; Zheng, W.; Han, B.; Wang, K.; Sun, D. Identification of Genetic Effects of ACADVL and IRF6 Genes with Milk Production Traits of Holstein Cattle in China. Genes 2022, 13, 2393. [Google Scholar] [CrossRef] [PubMed]
  45. Baeza, M.C.; Corva, P.M.; Soria, L.A.; Rincon, G.; Medrano, J.F.; Pavan, E.; Villarreal, E.L.; Schor, A.; Melucci, L.; Mezzadra, C.; et al. Genetic Markers of Body Composition and Carcass Quality in Grazing Brangus Steers. Genet. Mol. Res. 2011, 10, 3146–3156. [Google Scholar] [CrossRef]
  46. Rincon, G.; Farber, E.A.; Farber, C.R.; Nkrumah, J.D.; Medrano, J.F. Polymorphisms in the STAT6 Gene and Their Association with Carcass Traits in Feedlot Cattle. Anim. Genet. 2009, 40, 878–882. [Google Scholar] [CrossRef] [PubMed]
  47. Komatsu, M.; Itoh, T.; Fujimori, Y.; Satoh, M.; Miyazaki, Y.; Takahashi, H.; Shimizu, K.; Malau-Aduli, A.E.O.; Morita, M. Genetic Association between GHSR1a 5’UTR-Microsatellite and Nt-7(C>A) Loci and Growth and Carcass Traits in Japanese Black Cattle. Anim. Sci. J. 2011, 82, 396–405. [Google Scholar] [CrossRef] [PubMed]
  48. Wang, J.; Fan, T.; Du, Z.; Xu, L.; Chen, Y.; Zhang, L.; Gao, H.; Li, J.; Ma, Y.; Gao, X. Genome-Wide Association Analysis Identifies the PMEL Gene Affecting Coat Color and Birth Weight in Simmental × Holstein. Animal 2023, 13, 3821. [Google Scholar] [CrossRef]
  49. Porto-Neto, L.R.; Edwards, S.; Fortes, M.R.S.; Lehnert, S.A.; Reverter, A.; McGowan, M. Genome-Wide Association for the Outcome of Fixed-Time Artificial Insemination of Brahman Heifers in Northern Australia. J. Anim. Sci. 2015, 93, 5119–5127. [Google Scholar] [CrossRef]
  50. Vanvanhossou, S.F.U.; Scheper, C.; Dossa, L.H.; Yin, T.; Brügemann, K.; König, S. A Multi-Breed GWAS for Morphometric Traits in Four Beninese Indigenous Cattle Breeds Reveals Loci Associated with Conformation, Carcass and Adaptive Traits. BMC Genom. 2020, 21, 783. [Google Scholar] [CrossRef]
  51. Hulsegge, I.; Oldenbroek, K.; Bouwman, A.; Veerkamp, R.; Windig, J. Selection and Drift: A Comparison between Historic and Recent Dutch Friesian Cattle and Recent Holstein Friesian Using WGS Data. Animal 2022, 12, 329. [Google Scholar] [CrossRef]
  52. Sölkner, J.; Ferencakovic, M.; Karimi, Z.; OBrien, A.M.P.; Mészáros, G.; Eaglen, S.A.E.; Boison, S.A.; Curik, I. Extremely Non-Uniform: Patterns of Runs of Homozygosity in Bovine Populations. In Proceedings of the Proceedings of the 10th World Congress on Genetics Applied to Livestock Production, Vancouver, BC, Canada, 17–22 August 2014; pp. 17–22. [Google Scholar]
  53. Signer-Hasler, H.; Casanova, L.; Barenco, A.; Maitre, B.; Bagnato, A.; Vevey, M.; Berger, B.; Simčič, M.; Boichon, D.; Capitan, A.; et al. Genomic Regions Underlying Positive Selection in Local, Alpine Cattle Breeds. Anim. Genet. 2023, 54, 239–253. [Google Scholar] [CrossRef]
  54. Jang, J.; Terefe, E.; Kim, K.; Lee, Y.H.; Belay, G.; Tijjani, A.; Han, J.-L.; Hanotte, O.; Kim, H. Correction to: Population Differentiated Copy Number Variation of Bos Taurus, Bos Indicus and Their African Hybrids. BMC Genom. 2022, 23, 207. [Google Scholar] [CrossRef]
  55. Bongiorni, S.; Gruber, C.E.M.; Bueno, S.; Chillemi, G.; Ferrè, F.; Failla, S.; Moioli, B.; Valentini, A. Transcriptomic Investigation of Meat Tenderness in Two Italian Cattle Breeds. Anim. Genet. 2016, 47, 273–287. [Google Scholar] [CrossRef] [PubMed]
  56. Liu, Y.; Zhao, G.; Lin, X.; Zhang, J.; Hou, G.; Zhang, L.; Liu, D.; Li, Y.; Li, J.; Xu, L. Genomic Inbreeding and Runs of Homozygosity Analysis of Indigenous Cattle Populations in Southern China. PLoS ONE 2022, 17, e0271718. [Google Scholar] [CrossRef]
  57. Delbes, G.; Yanagiya, A.; Sonenberg, N.; Robaire, B. PABP Interacting Protein 2 (Paip2) Is a Major Translational Regulator Involved in the Maturation of Male Germ Cells and Male Fertility. Biol. Reprod. 2009, 81, 167. [Google Scholar] [CrossRef]
  58. Guan, D.; Luo, N.; Tan, X.; Zhao, Z.; Huang, Y.; Na, R.; Zhang, J.; Zhao, Y. Scanning of Selection Signature Provides a Glimpse into Important Economic Traits in Goats (Capra Hircus). Sci. Rep. 2016, 6, 36372. [Google Scholar] [CrossRef] [PubMed]
  59. Lehnert, S.A.; Reverter, A.; Byrne, K.A.; Wang, Y.; Nattrass, G.S.; Hudson, N.J.; Greenwood, P.L. Gene Expression Studies of Developing Bovine Longissimus Muscle from Two Different Beef Cattle Breeds. BMC Dev. Biol. 2007, 7, 95. [Google Scholar] [CrossRef]
  60. Akakabe, Y.; Koide, M.; Kitamura, Y.; Matsuo, K.; Ueyama, T.; Matoba, S.; Yamada, H.; Miyata, K.; Oike, Y.; Ikeda, K. Ecscr Regulates Insulin Sensitivity and Predisposition to Obesity by Modulating Endothelial Cell Functions. Nat. Commun. 2013, 4, 2389. [Google Scholar] [CrossRef]
Figure 1. Characterization of the 40K liquid capture chip. (a) Density distribution of single-nucleotide polymorphisms (SNPs) in bovine chromosomes. (b) Circos plot showing the density of SNPs and genes on each chromosome. Red indicates a gene count of 50 or more in a 1 Mb window, dark blue indicates a gene count of 50 or more over 35 in a 1 Mb window, and brown indicates a gene count of 1 in a 1 Mb window. (c) Distribution patterns of SNPs over different regions of the bovine genome. (d) Number distribution of SNPs based on the MAF categories.
Animals 15 01346 g001
Figure 2. Genotyping performance of the liquid SNP chip panel. (a) Distribution of SNP call rates in the study population. (b) Comparative analysis of SNP call rates between males and females. (c) Comparative analysis of SNP call rates among the different breeds. (d) Comparative analysis of SNP missingness rates among the different breeds. (e) Comparative analysis of SNP missingness rates between males and females. *, ** and *** indicate p < 0.05, p < 0.01, and p < 0.001, respectively.
Animals 15 01346 g002
Figure 3. Population genetic structure and phylogenetic tree analyses. (a) Principal component analysis of 205 individuals. (b) Phylogenetic trees of 195 local cattle in Hubei. (c) Population ancestry composition analysis of 205 individuals. (d) LD decay map of 4 local cattle herds in Hubei.
Animals 15 01346 g003
Figure 4. Genomic runs of homozygosity (ROH) patterns in local Hubei cattle breeds. (a) Length distribution of ROH per sample. X-axis represents the length of ROH (Mb) using a base-10 log scale. (b) Relationship between total ROH length and ROH coverage in the studied population. (c) Box plot displaying ROH number distribution among breeds. (d) Box plot displaying the distribution of average ROH length among breeds. *, ** and *** indicate p < 0.05, p < 0.01, and p < 0.001, respectively. NS. indicates no significant, p > 0.05.
Animals 15 01346 g004
Figure 5. Manhattan plot of the percentage of SNPs in the ROH of ES (a), HP (b), YL (c), and ZB (d) cattle.
Animals 15 01346 g005
Figure 6. Cluster analyses of genes related to runs of homozygosity overlapping with QTLs in cattle. HP = Huangpi; YL = Yilin; ZB = Zaobei; ES = Enshi.
Animals 15 01346 g006
Figure 7. Venn diagram (a), functional enrichment (b), protein–protein interaction network (c), and reference publication enrichment (d) analyses of all shared genes under runs of homozygosity (ROH) islands. HP = Huangpi; YL = Yilin; ZB = Zaobei; ES = Enshi.
Animals 15 01346 g007
Table 1. Statistics for runs of homozygosity in Hubei cattle population.
BreedSample
Number
ROH NumberSNP
Number
Gene
Number
Longest ROH (Mb)Mean ROH (Mb)
ES338338175533.61257.100
HP399487617106.03157.807
YL527424352619.931105.322
ZB716308327410.00261.872
ROH = runs of homozygosity; SNP = single-nucleotide polymorphism.
Table 2. Characterization of genomic regions with shared runs of homozygosity (ROH) islands.
BreedCHRStart (bp)End (bp)Region (Kb)Number of SNPsGenes
HP748,542,26554,706,5806164.316103DNAJC18, PAIP2, SLC23A1, LRRTM2, SPATA24, SMIM33, SIL1, UBE2D2, MATR3, PROB1, STING1, CTNNA1, ECSCR
ES748,542,26553,412,2094869.94578DNAJC18, PAIP2, SLC23A1, LRRTM2, SPATA24, SMIM33, SIL1, UBE2D2, MATR3, PROB1, STING1, CTNNA1, ECSCR
YL748,542,26553,053,6734511.40974DNAJC18, PAIP2, SLC23A1, LRRTM2, SPATA24, SMIM33, SIL1, UBE2D2, MATR3, PROB1, STING1, CTNNA1, ECSCR
ZB748,542,26554,768,3546226.09108DNAJC18, PAIP2, SLC23A1, LRRTM2, SPATA24, SMIM33, SIL1, UBE2D2, MATR3, PROB1, STING1, CTNNA1, ECSCR
CHR = chromosome; ROH = runs of homozygosity; HP = Huangpi; ES = Enshi; YL = Yilin; ZB = Zaobei.
Disclaimer/Publisher’s Note: The statements, opinions and data contained in all publications are solely those of the individual author(s) and contributor(s) and not of MDPI and/or the editor(s). MDPI and/or the editor(s) disclaim responsibility for any injury to people or property resulting from any ideas, methods, instructions or products referred to in the content.

