
Genetic Diversity and Population Structure of Acanthopagrus latus in the South China Sea


Simple Summary
Abstract
1. Introduction
2. Materials and Methods
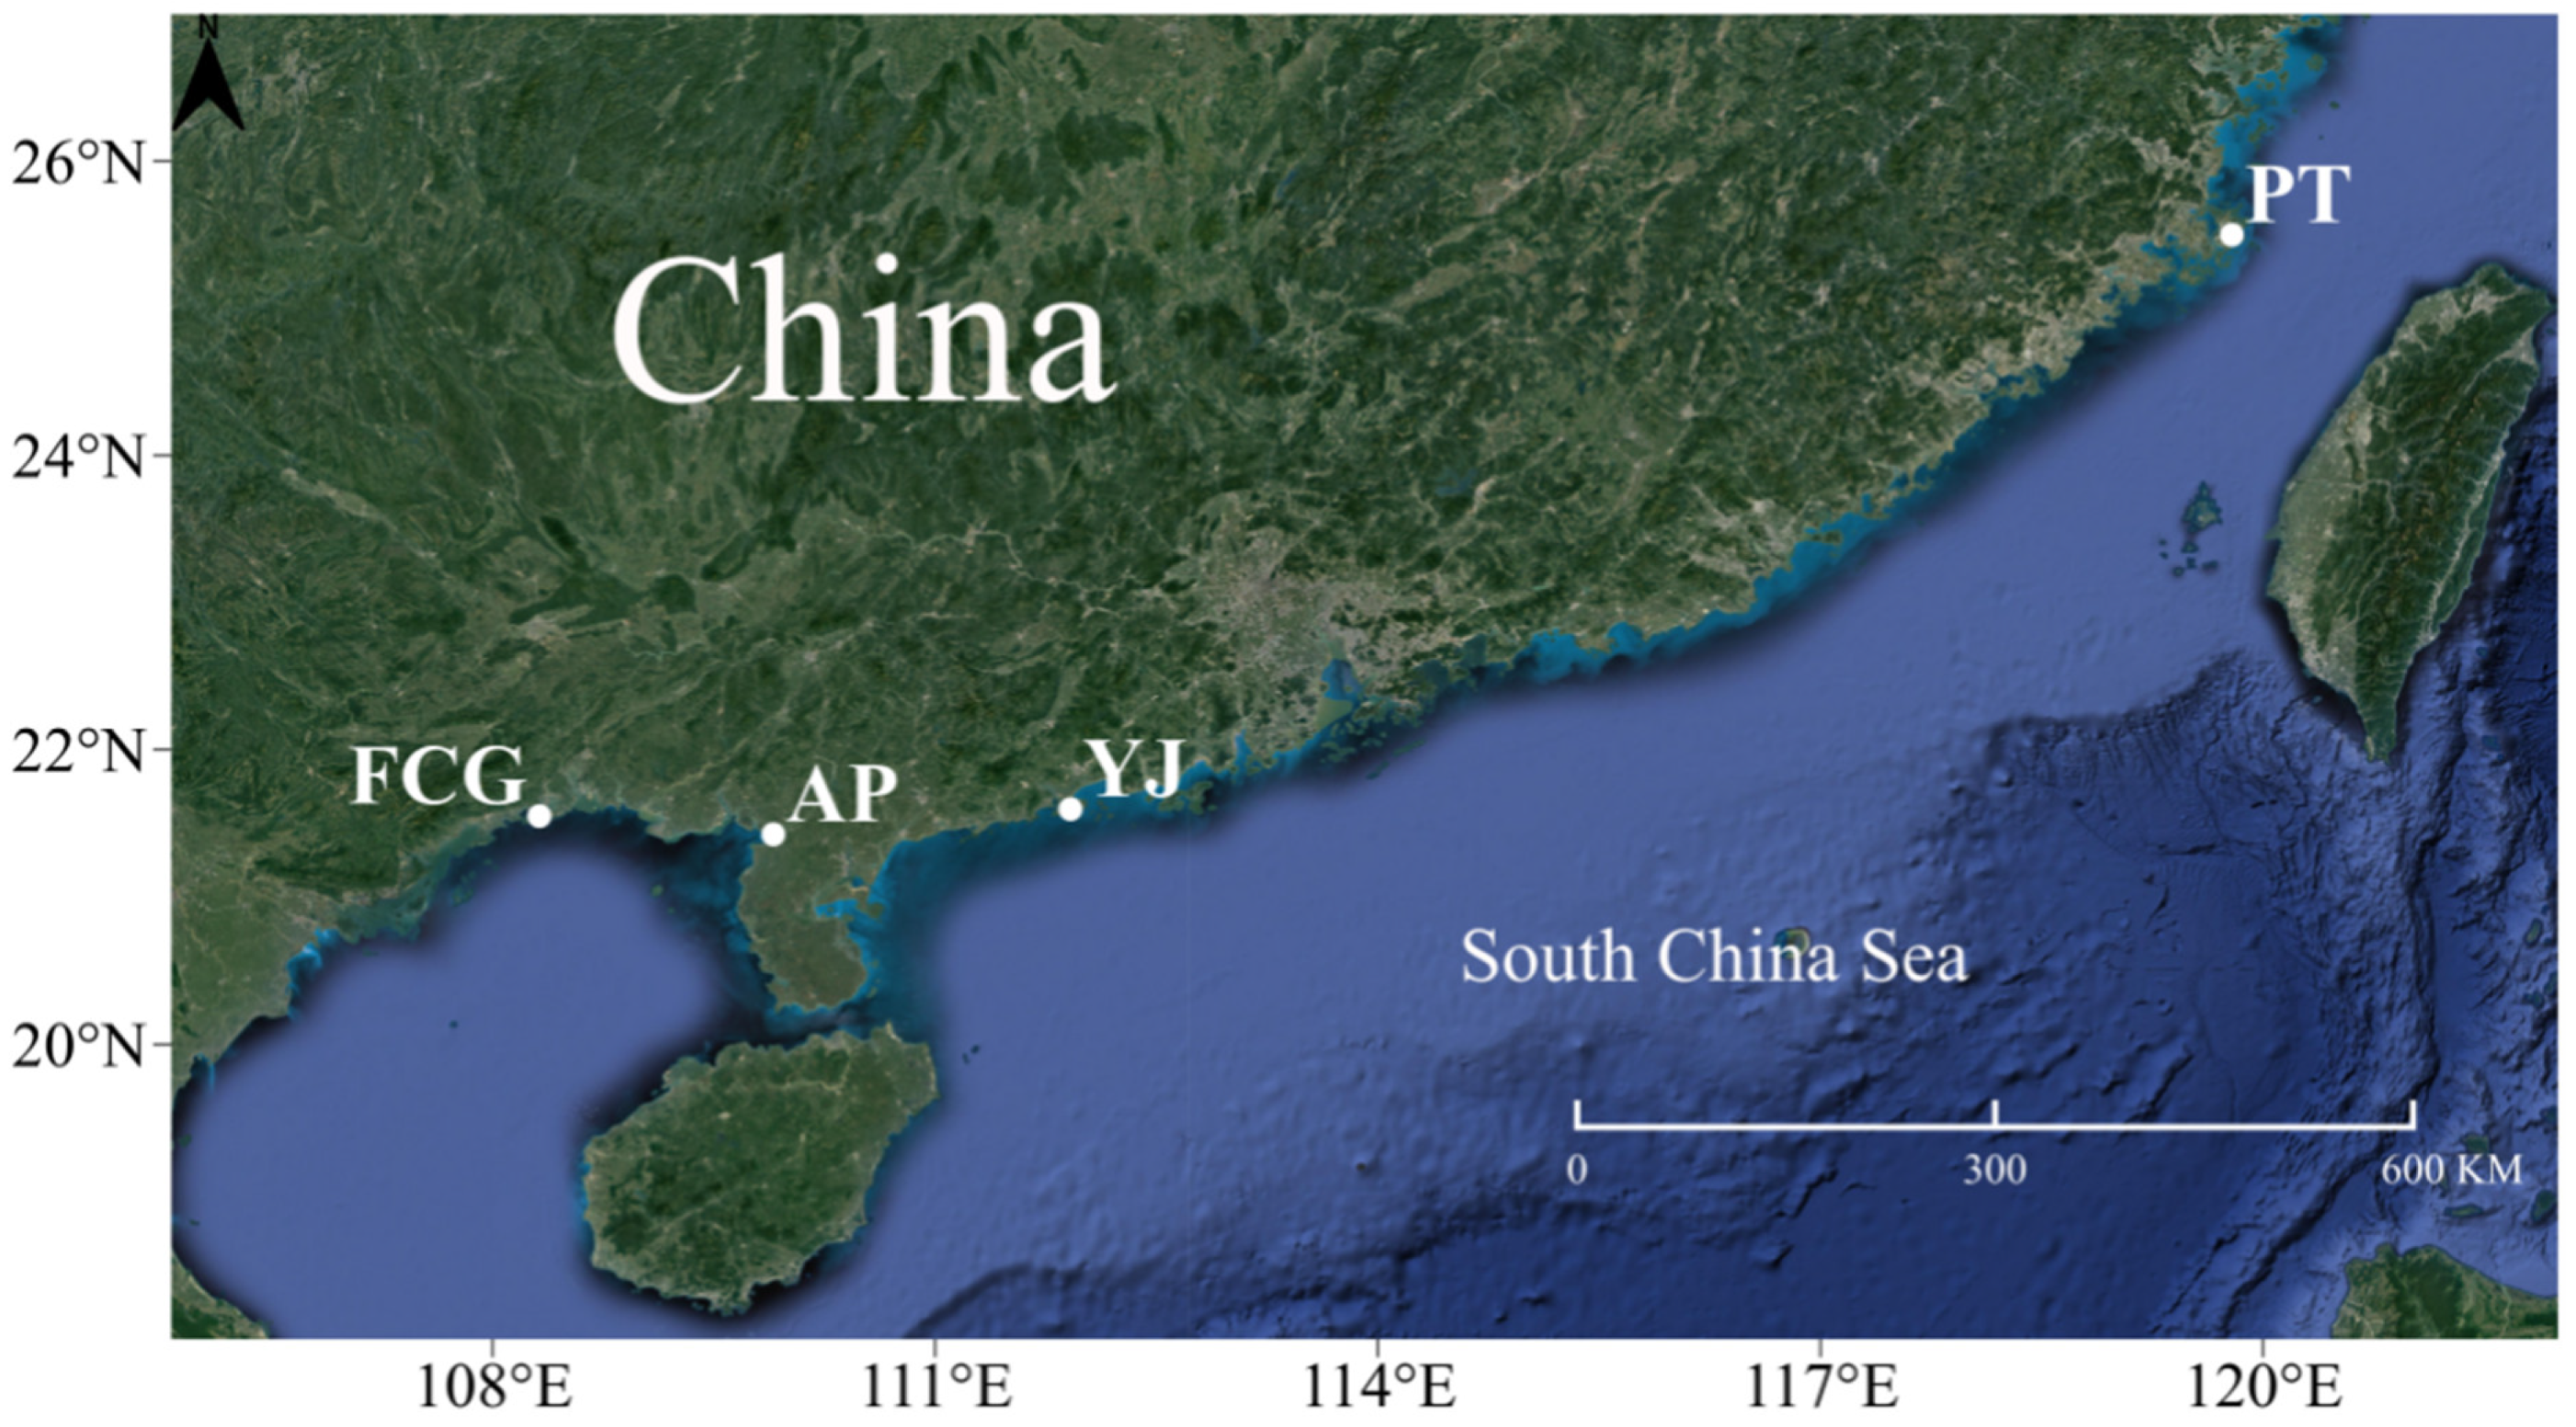
2.1. Sample Collection and DNA Extraction
2.2. Whole-Genome Resequencing
2.3. Data Analysis
3. Results
3.1. Sequencing Data Statistics
3.2. SNP Detection
3.3. Phylogenetic Analysis and PCA
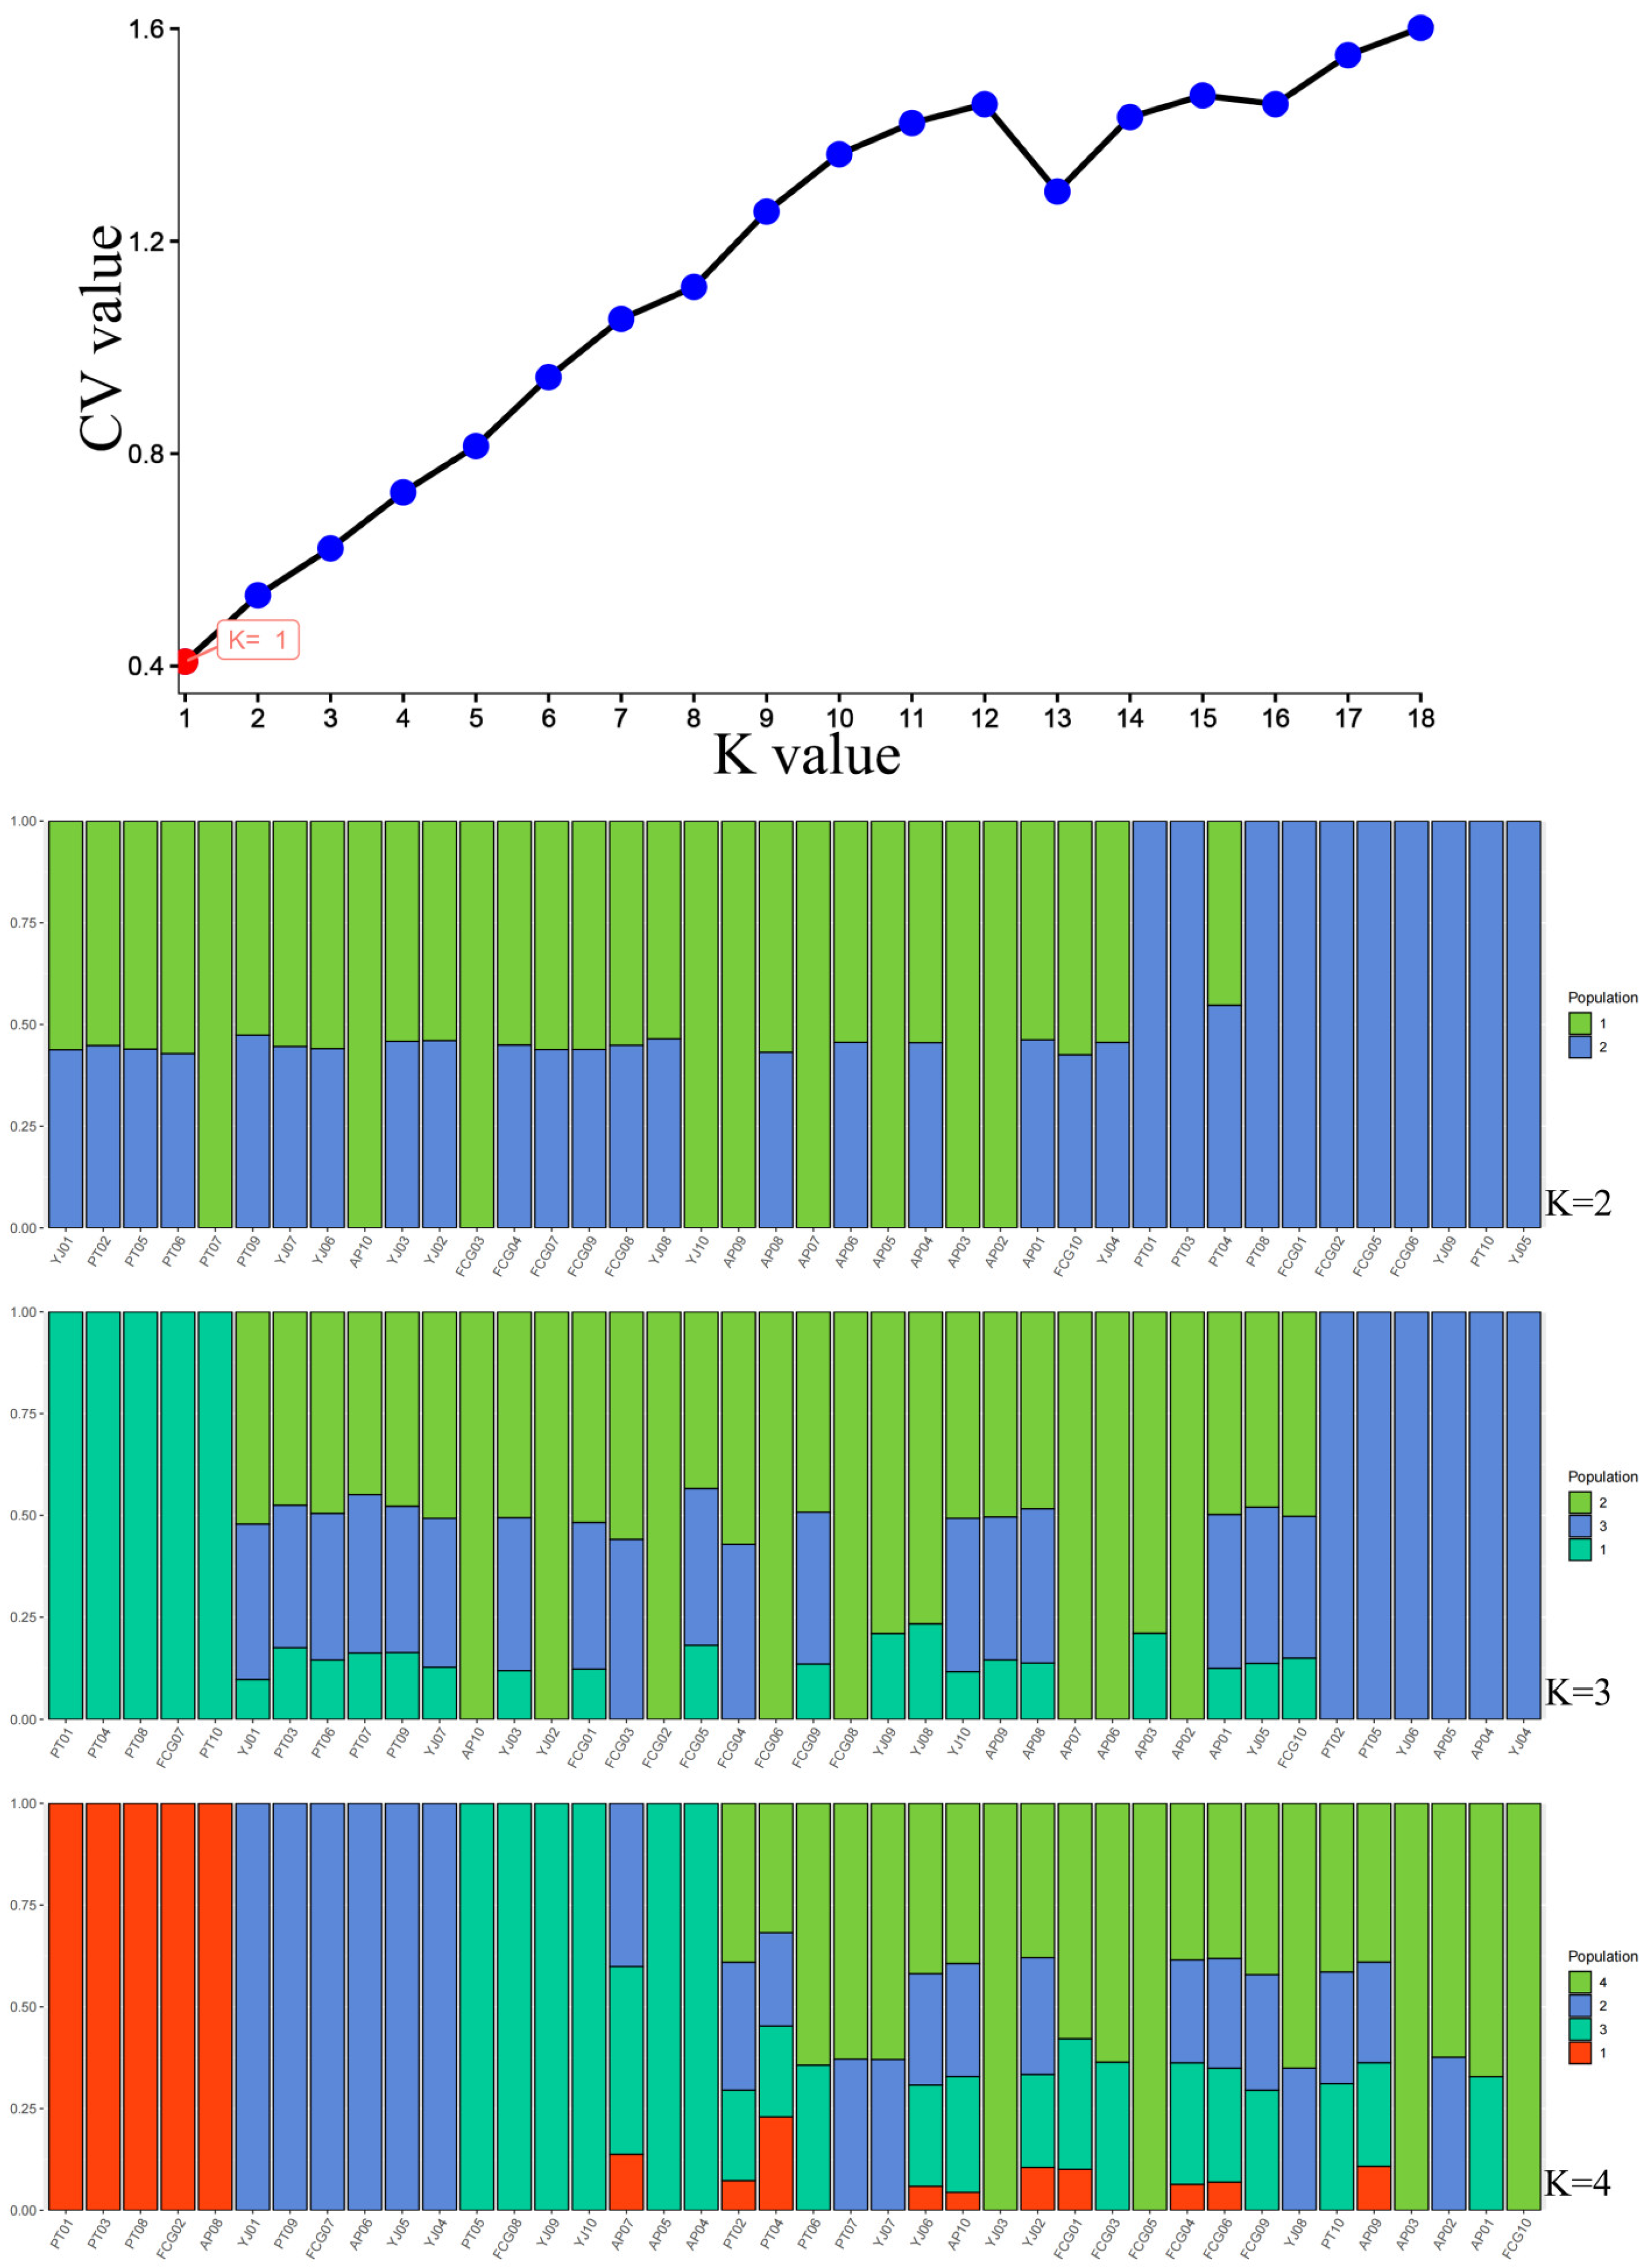
3.4. Population Structure and Linkage Disequilibrium Analysis
4. Discussion
5. Conclusions
Author Contributions
Funding
Institutional Review Board Statement
Informed Consent Statement
Data Availability Statement
Acknowledgments
Conflicts of Interest
References
- Abou-Seedo, F.S.; Dadzie, S.; Al-Kanaan, K.A. Sexuality, sex change and maturation patterns in the yellowfin seabream, Acanthopagrus latus (Teleostei: Sparidae) (Houttuyn, 1782). J. Appl. Ichthyol. 2003, 19, 65–73. [Google Scholar] [CrossRef]
- Vahabnezhad, A.; Kaymaram, F.; Taghavi Motlagh, S.A.; Valinasab, T.; Fatemi, S.M.R. The reproductive biology and feeding habits of yellow fin sea aream, Acanthopagrus latus (Houttuyn, 1782), in the Northern Persian Gulf. Iran J. Fish. Sci. 2016, 15, 16–30. [Google Scholar]
- Song, P.; Liu, C.; Cai, Z.; Liu, S.; Xiang, J.; Shan, B.; Ji, D.; Li, Y.; Lin, L. Genetic characteristics of yellow seabream Acanthopagrus latus (Houttuyn, 1782) (Teleostei: Sparidae) after stock enhancement in southeastern China coastal waters. Reg. Stud. Mar. Sci. 2021, 48, 102065. [Google Scholar] [CrossRef]
- Wang, W.; Huang, J.; Hu, Y.; Feng, J.; Gao, D.; Fang, W.; Xu, M.; Ma, C.; Fu, Z.; Chen, Q.; et al. Seascapes shaped the local adaptation and population structure of South China coast yellowfin seabream (Acanthopagrus latus). Mar. Biotechnol. 2024, 26, 60–73. [Google Scholar] [CrossRef]
- Zhao, H.; Huang, L.; Zhang, J.; You, S.; Zeng, Q.; Liu, X. Development of SNP parentage assignment techniques in the yellowfin seabream Acanthopagrus latus. Acta Oceanol. Sin. 2024, 43, 151–155. [Google Scholar] [CrossRef]
- Tamadoni, R.; Nafisi Bahabadi, M.; Morshedi, V.; Bagheri, D.; Torfi Mozanzadeh, M. Effect of short-term fasting and re-feeding on growth, digestive enzyme activities and antioxidant defence in yellowfin seabream, Acanthopagrus latus (Houttuyn, 1782). Aquacult. Res. 2020, 51, 1437–1445. [Google Scholar] [CrossRef]
- Wang, S.B.; Lau, K.Y.; Liu, K.M.; Joung, S.J.; Liu, C.H. Reproductive characteristics of the hermaphroditic yellowfin seabream Acanthopagrus latus in the waters off western Taiwan. Aquacult. Res. 2020, 51, 5015–5028. [Google Scholar] [CrossRef]
- Neff, B.D.; Garner, S.R.; Pitcher, T.E. Conservation and enhancement of wild fish populations: Preserving genetic quality versus genetic diversity. Can. J. Fish. Aquat. Sci. 2011, 68, 1139–1154. [Google Scholar] [CrossRef]
- Li, K.; Wang, C.; Liang, H. Research on the contribution of resources to the proliferation and release of Penaeus chinensis in southern Shandong Peninsula. J. Yantai. Univ. Univ. (Nat. Sci. Eng. Ed.) 2019, 32, 165–170. (In Chinese) [Google Scholar]
- Liu, H.; Jiang, S.J.; Su, T.; Gong, S. Polymorphisms of mitochondrial DNA D-loop gene sequences from Sparus latus. Shuichan Xuebao 2004, 28, 371–374. (In Chinese) [Google Scholar]
- Xia, J.H.; Huang, J.H.; Gong, J.B.; Jiang, S.G. Significant population genetic structure of yellowfin seabream Acanthopagrus latus in China. J. Fish Biol. 2008, 73, 1979–1992. [Google Scholar] [CrossRef]
- Verma, M.; Kulshrestha, S.; Puri, A. Genome sequencing. Methods Mol. Biol. 2017, 1525, 3–33. [Google Scholar]
- Ciezarek, A.; Ford, A.G.; Etherington, G.J.; Kasozi, N.; Malinsky, M.; Mehta, T.K.; Penso-Dolfin, L.; Ngatunga, B.P.; Shechonge, A.; Tamatamah, R.; et al. Whole genome resequencing data enables a targeted SNP panel for conservation and aquaculture of Oreochromis cichlid fishes. Aquaculture 2022, 548, 737637. [Google Scholar] [CrossRef] [PubMed]
- Sun, C.F.; Zhang, X.H.; Dong, J.J.; You, X.X.; Tian, Y.Y.; Gao, F.Y.; Zhang, H.T.; Shi, Q.; Ye, X. Whole-genome resequencing reveals recent signatures of selection in five populations of largemouth bass (Micropterus salmoides). Zool. Res. 2023, 44, 78. [Google Scholar] [CrossRef]
- Yang, S.; Shi, Z.; Ou, X.; Liu, G. Whole-genome resequencing reveals genetic indels of feathered-leg traits in domestic chickens. J. Genet. 2019, 98, 47. [Google Scholar] [CrossRef]
- Martin, J.; Schackwitz, W.; Lipzen, A. Genomic sequence variation analysis by resequencing. Methods Mol. Biol. 2018, 1775, 229–239. [Google Scholar]
- Choi, J.W.; Chung, W.H.; Lee, K.T.; Cho, E.S.; Lee, S.W.; Choi, B.H.; Lee, S.H.; Lim, W.; Lim, D.; Lee, Y.G.; et al. Whole-genome resequencing analyses of five pig breeds, including Korean wild and native breeds and three European origin breeds. DNA Res. 2015, 22, 259–267. [Google Scholar] [CrossRef]
- Kon, T.; Pei, L.; Ichikawa, R.; Chen, C.; Wang, P.; Takemura, I.; Ye, Y.; Yan, X.; Guo, B.; Li, W.; et al. Whole-genome resequencing of large yellow croaker (Larimichthys crocea) reveals the population structure and signatures of environmental adaptation. Sci. Rep. 2021, 11, 11235. [Google Scholar] [CrossRef] [PubMed]
- Acquadro, A.; Barchi, L.; Portis, E.; Nourdine, M.; Carli, C.; Monge, S.; Valentino, D.; Lanteri, S. Whole genome resequencing of four Italian sweet pepper landraces provided insights into sequence variation in genes of agronomic value. Sci. Rep. 2020, 10, 9189. [Google Scholar] [CrossRef]
- Wasko, A.P.; Martins, C.; Oliveira, C.; Foresti, F. Non-destructive genetic sampling in fish. An improved method for DNA extraction from fish fins and scales. Hereditas 2003, 138, 161–165. [Google Scholar] [CrossRef]
- Zhi, Y.; Wang, D.; Zhang, K.; Wang, Y.; Geng, W.; Chen, B.; Li, H.; Li, Z.; Tian, Y.; Kang, X.; et al. Genome-wide genetic structure of henan indigenous chicken breeds. Animals 2023, 13, 753. [Google Scholar] [CrossRef]
- Li, H.; Durbin, R. Fast and accurate short read alignment with Burrows–Wheeler transform. Bioinformatics 2009, 25, 1754–1760. [Google Scholar] [CrossRef] [PubMed]
- Cingolani, P.; Platts, A.; Wang, L.L.; Coon, M.; Nguyen, T.; Wang, L.; Lu, X.; Ruden, D.M. A program for annotating and predicting the effects of single nucleotide polymorphisms (SNPs) in the genome of Drosophila melanogaster strain w1118; iso-2; iso-3. Fly 2012, 6, 80–92. [Google Scholar] [CrossRef] [PubMed]
- Yang, H.; Wang, K. Genomic variant annotation and prioritization with ANNOVAR and wANNOVAR. Nat. Protoc. 2015, 10, 1556–1566. [Google Scholar] [CrossRef]
- Kumar, S.; Stecher, G.; Li, M.; Knyaz, C.; Tamura, K.; Mega, X. Molecular evolutionary genetic analysis across computing platforms. Mol. Biol. Evol. 2018, 35, 1547–1549. [Google Scholar] [CrossRef]
- Price, A.L.; Patterson, N.J.; Plenge, R.M.; Weinblatt, M.E.; Shadick, N.A.; Reich, D. Principal components analysis corrects for stratification in genome-wide association studies. Nat. Genet. 2006, 38, 904–909. [Google Scholar] [CrossRef] [PubMed]
- Alexander, D.H.; Novembre, J.; Lange, K. Fast model-based estimation of ancestry in unrelated individuals. Genome Res. 2009, 19, 1655–1664. [Google Scholar] [CrossRef]
- Yang, J.; Lee, S.H.; Goddard, M.E.; Visscher, P.M. GCTA: A tool for genome-wide complex trait analysis. Am. J. Hum. Genet. 2011, 88, 76–82. [Google Scholar] [CrossRef]
- Purcell, S.; Neale, B.; Todd-Brown, K.; Thomas, L.; Ferreira, M.A.R.; Bender, D.; Maller, J.; Sklar, P.; de Bakker, P.I.W.; Daly, M.J.; et al. PLINK: A tool set for whole-genome association and population-based linkage analyses. Am. J. Hum. Genet. 2007, 81, 559–575. [Google Scholar] [CrossRef]
- Danecek, P.; Auton, A.; Abecasis, G.; Albers, C.A.; Banks, E.; DePristo, M.A.; Handsaker, R.E.; Lunter, G.; Marth, G.T.; Sherry, S.T.; et al. Variant call formats and VCF tools. Bioinformatics 2011, 27, 2156–2158. [Google Scholar] [CrossRef]
- Zhang, Q.; Sun, C.H.; Huang, J.L.; Lao, Y.L.; Chang, X.Y.; Cao, J.N. Genetic diversity of Hapalogenys analis in the northwest Pacific assessed using dd-RAD sequencing. Front. Ecol. Evol. 2024, 12, 1345739. [Google Scholar] [CrossRef]
- Withler, R.E.; O’Brien, D.S.; Watson, N.M.; Supernault, K.J. Maintenance of genetic diversity in natural spawning of captively-reared endangered sockeye salmon, Oncorhynchus nerka. Diversity 2014, 6, 354–379. [Google Scholar] [CrossRef]
- Grigoryeva, O.; Krivonogov, D.; Balakirev, A.; Stakheev, V.; Andreychev, A.; Orlov, V. Phylogeography of the forest dormouse Dryomys nitedula (Gliridae, Rodentia) in Russian Plain and the Caucasus. Folia Zool. 2015, 64, 361–364. [Google Scholar] [CrossRef]
- Gray, A. Genetic diversity and the conservation of natural plant populations. Biodivers. Lett. 1996, 3, 71–80. [Google Scholar] [CrossRef]
- He, Z.; Xiao, S.; Wang, S.; Chen, H. Genetic structure of the A. latus d-loop sequence. J. Fish. China 2021, 45, 345–356. [Google Scholar]
- Bert, T.M.; Crawford, C.R.; Tringali, M.D.; Seyoum, S.; Galvin, J.L.; Higham, M.; Lund, C. Genetic management of hatchery-based stock enhancement. In Ecological and Genetic Implications of Aquaculture Activities; Bert, T.M., Ed.; Springer: Dordrecht, The Netherlands, 2007; pp. 123–174. [Google Scholar]
- Bert, T.M.; Tringali, M.D. Effects of various aquaculture breeding strategies on genetic diversity of successive broods. J. Biol. Sci. 2001, 12, 13–26. [Google Scholar]
- Asahida, T.; Shinotsuka, Y.; Saitoh, K.; Tsuzaki, T.; Aritaki, M.; Yamashita, Y. Parental contributions to Japanese flounder hatcheries inferred from mitochondrial DNA haplotypes. J. World Aquacult. Soc. 2004, 35, 199–208. [Google Scholar] [CrossRef]
- Blankenship, H.L.; Leber, K.M. Responsible approach to marine stock enhancement. Am. Fish. Soc. Symp. 1995, 15, 167–175. [Google Scholar]


| Sampling Site | Sample No. | Coordinates | Sample Size | Sample Date |
|---|---|---|---|---|
| Pingtan, Fujian | FT01-10 | 119.80° E, 25.52° N | 10 | 4/2021 |
| Yangjiang, Guangdong | YJ01-10 | 111.84° E, 21.58° N | 10 | 12/2021 |
| Anpu, Guangdong | AP01-10 | 109.92° E, 21.43° N | 10 | 12/2021 |
| Fangchenggang, Guangxi | FCG01-10 | 108.36° E, 21.76° N | 10 | 4/2021 |
| Samples | Total Reads | Clean Reads | Percentage of Clean Reads | Clean Bases | GC Content | %>Q20 | %>Q30 |
|---|---|---|---|---|---|---|---|
| PT01 | 101,809,808 | 100,964,806 | 99.17% | 15,071,611,232 | 41.84% | 97.72% | 93.39% |
| PT02 | 76,468,810 | 75,751,664 | 99.06% | 11,308,412,169 | 41.78% | 97.71% | 93.47% |
| PT03 | 87,559,762 | 86,760,620 | 99.09% | 12,960,643,583 | 41.77% | 97.53% | 93.01% |
| PT04 | 68,839,290 | 68,220,428 | 99.10% | 10,177,228,391 | 41.64% | 97.52% | 92.92% |
| PT05 | 75,535,398 | 74,971,184 | 99.25% | 11,191,679,420 | 41.83% | 97.82% | 93.61% |
| PT06 | 67,075,948 | 66,449,744 | 99.07% | 9,913,777,075 | 41.87% | 97.45% | 92.81% |
| PT07 | 108,258,312 | 107,473,016 | 99.27% | 16,047,612,530 | 41.77% | 98.04% | 94.15% |
| PT08 | 89,303,552 | 88,674,560 | 99.30% | 13,244,598,365 | 41.60% | 98.01% | 94.07% |
| PT09 | 86,840,376 | 86,052,666 | 99.09% | 12,836,784,979 | 41.91% | 97.63% | 93.24% |
| PT10 | 89,958,686 | 89,252,390 | 99.21% | 13,320,160,715 | 41.64% | 97.79% | 93.55% |
| YJ01 | 90,160,316 | 89,401,880 | 99.16% | 13,330,989,547 | 41.95% | 98.00% | 94.09% |
| YJ02 | 57,567,502 | 57,051,926 | 99.10% | 8,517,653,507 | 41.91% | 97.50% | 92.94% |
| YJ03 | 47,270,776 | 46,781,760 | 98.97% | 6,981,618,750 | 42.07% | 97.53% | 93.07% |
| YJ04 | 88,343,852 | 87,589,348 | 99.15% | 13,066,629,055 | 41.87% | 97.68% | 93.39% |
| YJ05 | 82,130,622 | 81,490,468 | 99.22% | 12,152,811,875 | 42.07% | 98.04% | 94.21% |
| YJ06 | 89,258,334 | 88,489,374 | 99.14% | 13,207,771,049 | 41.96% | 97.54% | 92.96% |
| YJ07 | 137,332,282 | 135,238,024 | 98.48% | 18,602,555,953 | 42.16% | 97.41% | 93.33% |
| YJ08 | 184,719,214 | 183,261,698 | 99.21% | 27,348,916,620 | 41.88% | 98.07% | 94.25% |
| YJ09 | 69,634,448 | 68,875,348 | 98.91% | 10,281,000,273 | 42.27% | 97.47% | 92.88% |
| YJ10 | 191,434,786 | 189,944,896 | 99.22% | 28,352,038,411 | 41.36% | 98.05% | 94.20% |
| AP01 | 61,502,906 | 60,875,958 | 98.98% | 9,090,671,085 | 41.90% | 97.62% | 93.26% |
| AP02 | 70,704,218 | 70,013,212 | 99.02% | 10,460,754,702 | 41.88% | 97.37% | 92.66% |
| AP03 | 52,874,558 | 52,325,704 | 98.96% | 7,819,456,120 | 42.07% | 97.48% | 92.92% |
| AP04 | 81,233,154 | 80,524,948 | 99.13% | 12,031,774,277 | 41.82% | 97.75% | 93.51% |
| AP05 | 76,994,054 | 76,440,744 | 99.28% | 11,290,946,422 | 39.96% | 97.91% | 93.87% |
| AP06 | 69,974,798 | 69,337,560 | 99.09% | 10,362,493,909 | 42.12% | 97.62% | 93.15% |
| AP07 | 41,426,420 | 40,999,866 | 98.97% | 6,122,846,167 | 42.14% | 97.36% | 92.63% |
| AP08 | 86,534,524 | 85,750,702 | 99.09% | 12,808,516,569 | 42.26% | 97.97% | 94.00% |
| AP09 | 79,513,196 | 78,778,208 | 99.08% | 11,769,256,492 | 42.23% | 97.86% | 93.75% |
| AP10 | 81,170,812 | 80,450,254 | 99.11% | 12,024,905,820 | 42.29% | 97.93% | 93.91% |
| FCG01 | 84,932,016 | 84,282,552 | 99.24% | 12,537,445,295 | 41.93% | 97.99% | 94.03% |
| FCG02 | 81,907,400 | 81,263,586 | 99.21% | 12,092,232,810 | 41.76% | 97.86% | 93.62% |
| FCG03 | 61,745,044 | 61,744,694 | 100.00% | 9,125,633,721 | 38.21% | 97.62% | 93.05% |
| FCG04 | 83,019,154 | 82,443,344 | 99.31% | 12,167,842,428 | 41.07% | 98.05% | 94.21% |
| FCG05 | 114,709,826 | 112,695,646 | 98.24% | 16,821,503,661 | 41.98% | 98.10% | 94.55% |
| FCG06 | 82,966,560 | 82,035,818 | 98.88% | 12,212,423,001 | 41.70% | 97.73% | 93.56% |
| FCG07 | 103,097,888 | 102,132,854 | 99.06% | 15,113,755,765 | 41.89% | 98.18% | 94.82% |
| FCG08 | 120,985,092 | 119,862,310 | 99.07% | 17,422,493,980 | 41.79% | 98.13% | 94.77% |
| FCG09 | 86,941,476 | 86,193,752 | 99.14% | 12,771,778,691 | 41.05% | 98.16% | 94.66% |
| FCG10 | 90,569,546 | 89,881,584 | 99.24% | 13,344,103,638 | 41.26% | 97.92% | 94.10% |
| Sample | Total Reads | Mapped | Mapping Rate (%) | Depth (X) | Coverage (%) |
|---|---|---|---|---|---|
| PT01 | 100,964,806 | 99,759,774 | 98.81 | 17.42 | 99.59% |
| PT02 | 75,751,664 | 74,968,419 | 98.97 | 13.82 | 99.48% |
| PT03 | 86,760,620 | 85,869,957 | 98.97 | 15.35 | 99.55% |
| PT04 | 68,220,428 | 67,098,513 | 98.36 | 11.35 | 99.54% |
| PT05 | 74,971,184 | 73,679,321 | 98.28 | 12.57 | 99.48% |
| PT06 | 66,449,744 | 65,678,985 | 98.84 | 12.16 | 99.47% |
| PT07 | 107,473,016 | 105,097,491 | 97.79 | 17.1 | 99.61% |
| PT08 | 88,674,560 | 87,780,571 | 98.99 | 14.87 | 99.53% |
| PT09 | 86,052,666 | 85,194,994 | 99.00 | 14.88 | 99.54% |
| PT10 | 89,252,390 | 88,455,359 | 99.11 | 15.52 | 99.54% |
| YJ01 | 89,401,880 | 88,135,270 | 98.58 | 14.98 | 99.49% |
| YJ02 | 57,051,926 | 56,647,410 | 99.29 | 10.77 | 99.37% |
| YJ03 | 46,781,760 | 46,405,601 | 99.20 | 8.69 | 99.29% |
| YJ04 | 87,589,348 | 86,906,921 | 99.22 | 15.33 | 99.50% |
| YJ05 | 81,490,468 | 80,833,049 | 99.19 | 14.01 | 99.45% |
| YJ06 | 88,489,374 | 87,826,158 | 99.25 | 15.24 | 99.52% |
| YJ07 | 135,238,024 | 134,656,295 | 99.57 | 19.5 | 99.54% |
| YJ08 | 183,261,698 | 180,627,066 | 98.56 | 30.77 | 99.60% |
| YJ09 | 68,875,348 | 68,316,440 | 99.19 | 12.16 | 99.47% |
| YJ10 | 189,944,896 | 185,373,476 | 97.59 | 31.47 | 99.63% |
| AP01 | 60,875,958 | 60,412,288 | 99.24 | 11.11 | 99.42% |
| AP02 | 70,013,212 | 69,428,852 | 99.17 | 12.83 | 99.44% |
| AP03 | 52,325,704 | 51,934,968 | 99.25 | 9.81 | 99.31% |
| AP04 | 80,524,948 | 79,950,872 | 99.29 | 14.22 | 99.47% |
| AP05 | 76,440,744 | 74,675,889 | 97.69 | 12.81 | 99.32% |
| AP06 | 69,337,560 | 68,755,802 | 99.16 | 11.75 | 99.41% |
| AP07 | 40,999,866 | 40,615,786 | 99.06 | 7.59 | 99.13% |
| AP08 | 85,750,702 | 84,991,686 | 99.11 | 14.76 | 99.52% |
| AP09 | 78,778,208 | 77,967,505 | 98.97 | 13.56 | 99.49% |
| AP10 | 80,450,254 | 79,801,244 | 99.19 | 13.61 | 99.48% |
| FCG01 | 84,282,552 | 83,620,646 | 99.21 | 14.34 | 99.52% |
| FCG02 | 81,263,586 | 76,406,913 | 94.02 | 12.43 | 98.37% |
| FCG03 | 61,744,694 | 59,723,425 | 96.73 | 8.56 | 99.11% |
| FCG04 | 82,443,344 | 73,825,046 | 89.55 | 12.25 | 99.44% |
| FCG05 | 112,695,646 | 103,290,253 | 91.65 | 6.76 | 99.13% |
| FCG06 | 82,035,818 | 58,450,652 | 71.25 | 8.77 | 99.18% |
| FCG07 | 102,132,854 | 98,320,756 | 96.27 | 15.67 | 99.49% |
| FCG08 | 119,862,310 | 115,463,531 | 96.33 | 18.92 | 99.55% |
| FCG09 | 86,193,752 | 75,039,441 | 87.06 | 11.95 | 99.42% |
| FCG10 | 89,881,584 | 89,313,299 | 99.37 | 15.54 | 99.48% |
| Sample | SNP Number | Transition | Transversion | Ti/Tv | Heterozygosity | Homozygosity | Het. Ratio |
|---|---|---|---|---|---|---|---|
| PT01 | 3,230,608 | 2,049,891 | 1,180,717 | 1.74 | 2,390,214 | 840,394 | 73.99 |
| PT02 | 3,177,195 | 2,016,506 | 1,160,689 | 1.74 | 2,326,580 | 850,615 | 73.23 |
| PT03 | 3,207,060 | 2,033,107 | 1,173,953 | 1.73 | 2,373,126 | 833,934 | 74 |
| PT04 | 3,113,547 | 1,974,129 | 1,139,418 | 1.73 | 2,378,681 | 734,866 | 76.4 |
| PT05 | 3,151,947 | 1,999,431 | 1,152,516 | 1.73 | 2,331,673 | 820,274 | 73.98 |
| PT06 | 3,133,597 | 1,989,456 | 1,144,141 | 1.74 | 2,275,313 | 858,284 | 72.61 |
| PT07 | 3,231,087 | 2,048,365 | 1,182,722 | 1.73 | 2,417,106 | 813,981 | 74.81 |
| PT08 | 3,202,291 | 2,030,806 | 1,171,485 | 1.73 | 2,348,822 | 853,469 | 73.35 |
| PT09 | 3,196,353 | 2,028,181 | 1,168,172 | 1.74 | 2,362,823 | 833,530 | 73.92 |
| PT10 | 3,209,236 | 2,035,816 | 1,173,420 | 1.74 | 2,367,876 | 841,360 | 73.78 |
| YJ01 | 3,204,803 | 2,035,452 | 1,169,351 | 1.74 | 2,346,537 | 858,266 | 73.22 |
| YJ02 | 3,076,371 | 1,953,685 | 1,122,686 | 1.74 | 2,206,752 | 869,619 | 71.73 |
| YJ03 | 2,949,881 | 1,872,735 | 1,077,146 | 1.74 | 2,071,177 | 878,704 | 70.21 |
| YJ04 | 3,210,281 | 2,036,777 | 1,173,504 | 1.74 | 2,350,626 | 859,655 | 73.22 |
| YJ05 | 3,190,676 | 2,025,521 | 1,165,155 | 1.74 | 2,332,962 | 857,714 | 73.12 |
| YJ06 | 3,210,827 | 2,037,811 | 1,173,016 | 1.74 | 2,352,293 | 858,534 | 73.26 |
| YJ07 | 3,183,752 | 2,018,315 | 1,165,437 | 1.73 | 2,326,536 | 857,216 | 73.08 |
| YJ08 | 3,289,639 | 2,083,723 | 1,205,916 | 1.73 | 2,430,629 | 859,010 | 73.89 |
| YJ09 | 3,145,002 | 1,997,742 | 1,147,260 | 1.74 | 2,281,389 | 863,613 | 72.54 |
| YJ10 | 3,292,833 | 2,086,024 | 1,206,809 | 1.73 | 2,431,034 | 861,799 | 73.83 |
| AP01 | 3,104,373 | 1,970,483 | 1,133,890 | 1.74 | 2,242,025 | 862,348 | 72.22 |
| AP02 | 3,157,093 | 2,003,547 | 1,153,546 | 1.74 | 2,308,917 | 848,176 | 73.13 |
| AP03 | 3,031,091 | 1,925,332 | 1,105,759 | 1.74 | 2,162,685 | 868,406 | 71.35 |
| AP04 | 3,188,583 | 2,022,946 | 1,165,637 | 1.74 | 2,336,169 | 852,414 | 73.27 |
| AP05 | 3,051,078 | 1,931,149 | 1,119,929 | 1.72 | 2,188,455 | 862,623 | 71.73 |
| AP06 | 3,119,827 | 1,981,112 | 1,138,715 | 1.74 | 2,273,222 | 846,605 | 72.86 |
| AP07 | 2,818,190 | 1,790,312 | 1,027,878 | 1.74 | 1,925,968 | 892,222 | 68.34 |
| AP08 | 3,209,983 | 2,036,386 | 1,173,597 | 1.74 | 2,367,467 | 842,516 | 73.75 |
| AP09 | 3,184,590 | 2,020,756 | 1,163,834 | 1.74 | 2,325,943 | 858,647 | 73.04 |
| AP10 | 3,182,885 | 2,019,852 | 1,163,033 | 1.74 | 2,338,087 | 844,798 | 73.46 |
| FCG01 | 3,200,608 | 2,030,877 | 1,169,731 | 1.74 | 2,343,023 | 857,585 | 73.21 |
| FCG02 | 10,363,458 | 6,368,531 | 3,994,927 | 1.59 | 6,760,257 | 3,603,201 | 65.23 |
| FCG03 | 2,835,017 | 1,799,018 | 1,035,999 | 1.74 | 1,946,792 | 888,225 | 68.67 |
| FCG04 | 3,103,322 | 1,970,222 | 1,133,100 | 1.74 | 2,236,762 | 866,560 | 72.08 |
| FCG05 | 2,695,031 | 1,712,297 | 982,734 | 1.74 | 1,953,310 | 741,721 | 72.48 |
| FCG06 | 2,901,476 | 1,836,705 | 1,064,771 | 1.72 | 2,020,702 | 880,774 | 69.64 |
| FCG07 | 3,207,612 | 2,036,591 | 1,171,021 | 1.74 | 2,351,474 | 856,138 | 73.31 |
| FCG08 | 3,240,686 | 2,055,097 | 1,185,589 | 1.73 | 2,383,249 | 857,437 | 73.54 |
| FCG09 | 3,108,411 | 1,972,768 | 1,135,643 | 1.74 | 2,243,918 | 864,493 | 72.19 |
| FCG10 | 3,194,781 | 2,026,672 | 1,168,109 | 1.74 | 2,334,079 | 860,702 | 73.06 |
Disclaimer/Publisher’s Note: The statements, opinions and data contained in all publications are solely those of the individual author(s) and contributor(s) and not of MDPI and/or the editor(s). MDPI and/or the editor(s) disclaim responsibility for any injury to people or property resulting from any ideas, methods, instructions or products referred to in the content. |
© 2025 by the authors. Licensee MDPI, Basel, Switzerland. This article is an open access article distributed under the terms and conditions of the Creative Commons Attribution (CC BY) license (https://creativecommons.org/licenses/by/4.0/).
Share and Cite
Sun, C.-H.; Zhang, Q.; Lu, C.-H. Genetic Diversity and Population Structure of Acanthopagrus latus in the South China Sea. Animals 2025, 15, 1295. https://doi.org/10.3390/ani15091295
Sun C-H, Zhang Q, Lu C-H. Genetic Diversity and Population Structure of Acanthopagrus latus in the South China Sea. Animals. 2025; 15(9):1295. https://doi.org/10.3390/ani15091295
Chicago/Turabian StyleSun, Cheng-He, Qun Zhang, and Chang-Hu Lu. 2025. "Genetic Diversity and Population Structure of Acanthopagrus latus in the South China Sea" Animals 15, no. 9: 1295. https://doi.org/10.3390/ani15091295
APA StyleSun, C.-H., Zhang, Q., & Lu, C.-H. (2025). Genetic Diversity and Population Structure of Acanthopagrus latus in the South China Sea. Animals, 15(9), 1295. https://doi.org/10.3390/ani15091295