Article

Dietary Differentiation Mitigates Interspecific Interference Competition Between Sympatric Pallas’s Cats (Otocolobus manul) and Red Foxes (Vulpes vulpes)

1
Key Laboratory of Adaptation and Evolution of Plateau Biota, Northwest Institute of Plateau Biology, Chinese Academy of Sciences, Xining 810008, China
2
School of Geographical Science, Qinghai Normal University, Xining 810016, China
3
University of Chinese Academy of Sciences, Beijing 100049, China
4
Qinghai Provincial Key Laboratory of Animal Ecological Genomics, Xining 810008, China
*
Author to whom correspondence should be addressed.
Animals 2025, 15(9), 1267; https://doi.org/10.3390/ani15091267
Submission received: 27 March 2025 / Revised: 25 April 2025 / Accepted: 28 April 2025 / Published: 29 April 2025
(This article belongs to the Section Ecology and Conservation)

Simple Summary

The differential utilization of food resources plays a critical role in alleviating the intensity of competition among sympatric carnivorous species. In the Sanjiangyuan National Park (SNP), there are 13 species of small carnivores (body mass < 15 kg); however, the partitioning of trophic niches among these local carnivore species remains poorly understood. The sympatrically distributed small carnivores, the Pallas’s cat (Otocolobus manul Palls, 1776) and the red fox (Vulpes vulpes Linnaeus, 1758), exhibit significant spatial overlap within the SNP, yet their dietary niche differentiation remains inadequately understood. To bridge this knowledge gap, we employed DNA barcoding technology to analyze the dietary composition and differences between these two predator species. Our findings demonstrate that the differential use of food resources is essential for mitigating interspecific competition among local small carnivores and promoting regional coexistence.

Abstract

The comparative analysis of the feeding ecology among sympatric small carnivores reveals both differentiation and overlap in resource utilization patterns, which serves as a critical pathway for understanding interspecific interactions and maintaining ecosystem stability. In this study, we collected fecal samples from sympatric Pallas’s cats (Otocolobus manul, n = 26) and red foxes (Vulpes vulpes, n = 13) within the Sanjiangyuan National Park (SNP) in China. Subsequently, DNA barcoding technology was employed to analyze the dietary composition and interspecific differences of these two small carnivores. The results demonstrated that both species primarily prey on plateau pikas (Ochotona curzoniae) and small rodents. Despite a high trophic niche overlap between Pallas’s cats and red foxes (Ojk = 0.81), interspecific competition is mitigated through differentiate feeding proportions of shared prey species. Furthermore, the trophic niche breadth of red foxes (B = 267.89) exceeds that of Pallas’s cats (B = 162.94), reflecting a greater diversity of prey resources utilized by red foxes. Consequently, the two small carnivores achieve sympatric coexistence via differentiated resource utilization. These findings enhance our understanding of the coexistence mechanisms within carnivore communities and provide a scientific basis for the conservation of wildlife in the SNP.

1. Introduction

Small carnivores (body mass < 15 kg) act as key primary consumers within ecosystems, playing a crucial role in processes such as energy flow and substances cycling [1]. Through predation, competition, and trophic cascading effects, they significantly influence the structure and function of ecosystems [2,3]. In ecosystems where large carnivores are absent, small carnivores functionally assume the role of apex consumers, exerting critical regulatory control over ecosystem stability and functional persistence [3,4]. As opportunistic predators, they typically consume a diverse array of prey resources, leading to complex dietary compositions and broader trophic niches [5].
Niche partitioning is anticipated to emerge when co-occurring species engage in direct competition for identical resources; however, intraguild interactions among predator species may still occur even in the absence of resource limitation [6]. For carnivores coexisting within the same geographic region, species with comparable body sizes and significant dietary overlap typically experience the most intense competition [7], which may lead to interference competition and resource utilization competition [8,9]. To alleviate interspecific competition, sympatric carnivores often achieve coexistence by differentially utilizing prey resources, altering feeding proportions, adjusting activity ranges, and modifying the onset and cessation times of their activities or behavioral rhythms [10]. Among sympatric carnivores, trophic niche differentiation represents the predominant mechanism that mediates the reduction of interspecific competition across spatial, temporal, and trophic dimensions [11]. Despite dietary spectrum overlaps in sympatric carnivore assemblages, divergent prey selection strategies and resource utilization patterns promote resource partitioning, thereby mitigating competitive exclusion through trophic niche complementarity [8].
Dietary strategy emerges as an adaptive mechanism in response to habitat limitations imposed by species-specific nutritional demands, while the trophic niche operationally delineates the multidimensional exploitation of food resources [12]. Niche breadth quantifies an organism’s trophic position and its involvement in interspecific interaction networks within ecosystems, with its dimensionality being structured by predation pressures and competitive exclusion dynamics mediated through species interactions [13,14]. Small carnivores predominantly function as opportunistic predators, with demonstrating complex dietary profiles characterized by diverse prey utilization patterns and broadening the trophic niche to enhance ecological fitness representing a pivotal mechanism for alleviating interspecific competition when competition escalates or during seasons of prey resource scarcity [15,16].
Traditional approaches to analyzing animal dietary habits have relied on morphological identification of undigested remains (e.g., hairs, skeletal fragments) in fecal samples [17]. These remains are compared against reference specimens or taxonomic keys of known species to infer prey composition [18,19]. However, due to the limitations imposed by food type and the degree of digestion, compounded by the presence of morphologically similar and closely related species in fecal matter, traditional methods demand analysts with extensive expertise in biological taxonomy. Consequently, this leads to reduced efficiency and accuracy in species identification [20]. In recent years, the advent of DNA barcoding technology has addressed many limitations of conventional methods for determining animal diets, enabling rapid and precise identification and taxonomic classification of species [21]. DNA barcoding is a technique that employs high-throughput sequencing to acquire large-scale amplicon sequences of various barcode genes from mixed samples. Subsequently, bioinformatics tools are utilized to analyze these sequences, facilitating the identification of taxonomic units [22,23]. Currently, DNA barcoding has been extensively applied in carnivore diet studies, allowing for both qualitative and quantitative descriptions of carnivores’ trophic niches, as well as the assessment of interspecific dietary overlap [24,25]. This technology offers critical technical support for investigating the mechanisms underlying sympatric species coexistence.
The Pallas’s cat (Otocolobus manul Palls, 1776) and the red fox (Vulpes vulpes Linnaeus, 1758) are two small carnivore species with comparable body sizes, belonging to the Felidae and Canidae families, respectively. They exhibit extensive and sympatric distribution within the Sanjiangyuan National Park (SNP), Qinghai Province, China. Previous studies have shown that these two species in the SNP demonstrate relatively high spatial overlap indices while maintaining distinct diurnal activity patterns [26]. However, there is a notable paucity of research examining trophic niche differentiation between these two small carnivores. The classical resource allocation hypothesis posits that sympatric carnivore species with morphological similarity experience heightened interspecific competition, which drives niche differentiation through divergent prey selection, foraging strategies, or the differential utilization of shared prey resources to mitigate competitive pressures [27]. To investigate the trophic niche differentiation between Pallas’s cats and red foxes within the SNP, this study utilized DNA barcoding technology to analyze their dietary compositions and overlap indices.

2. Materials and Methods
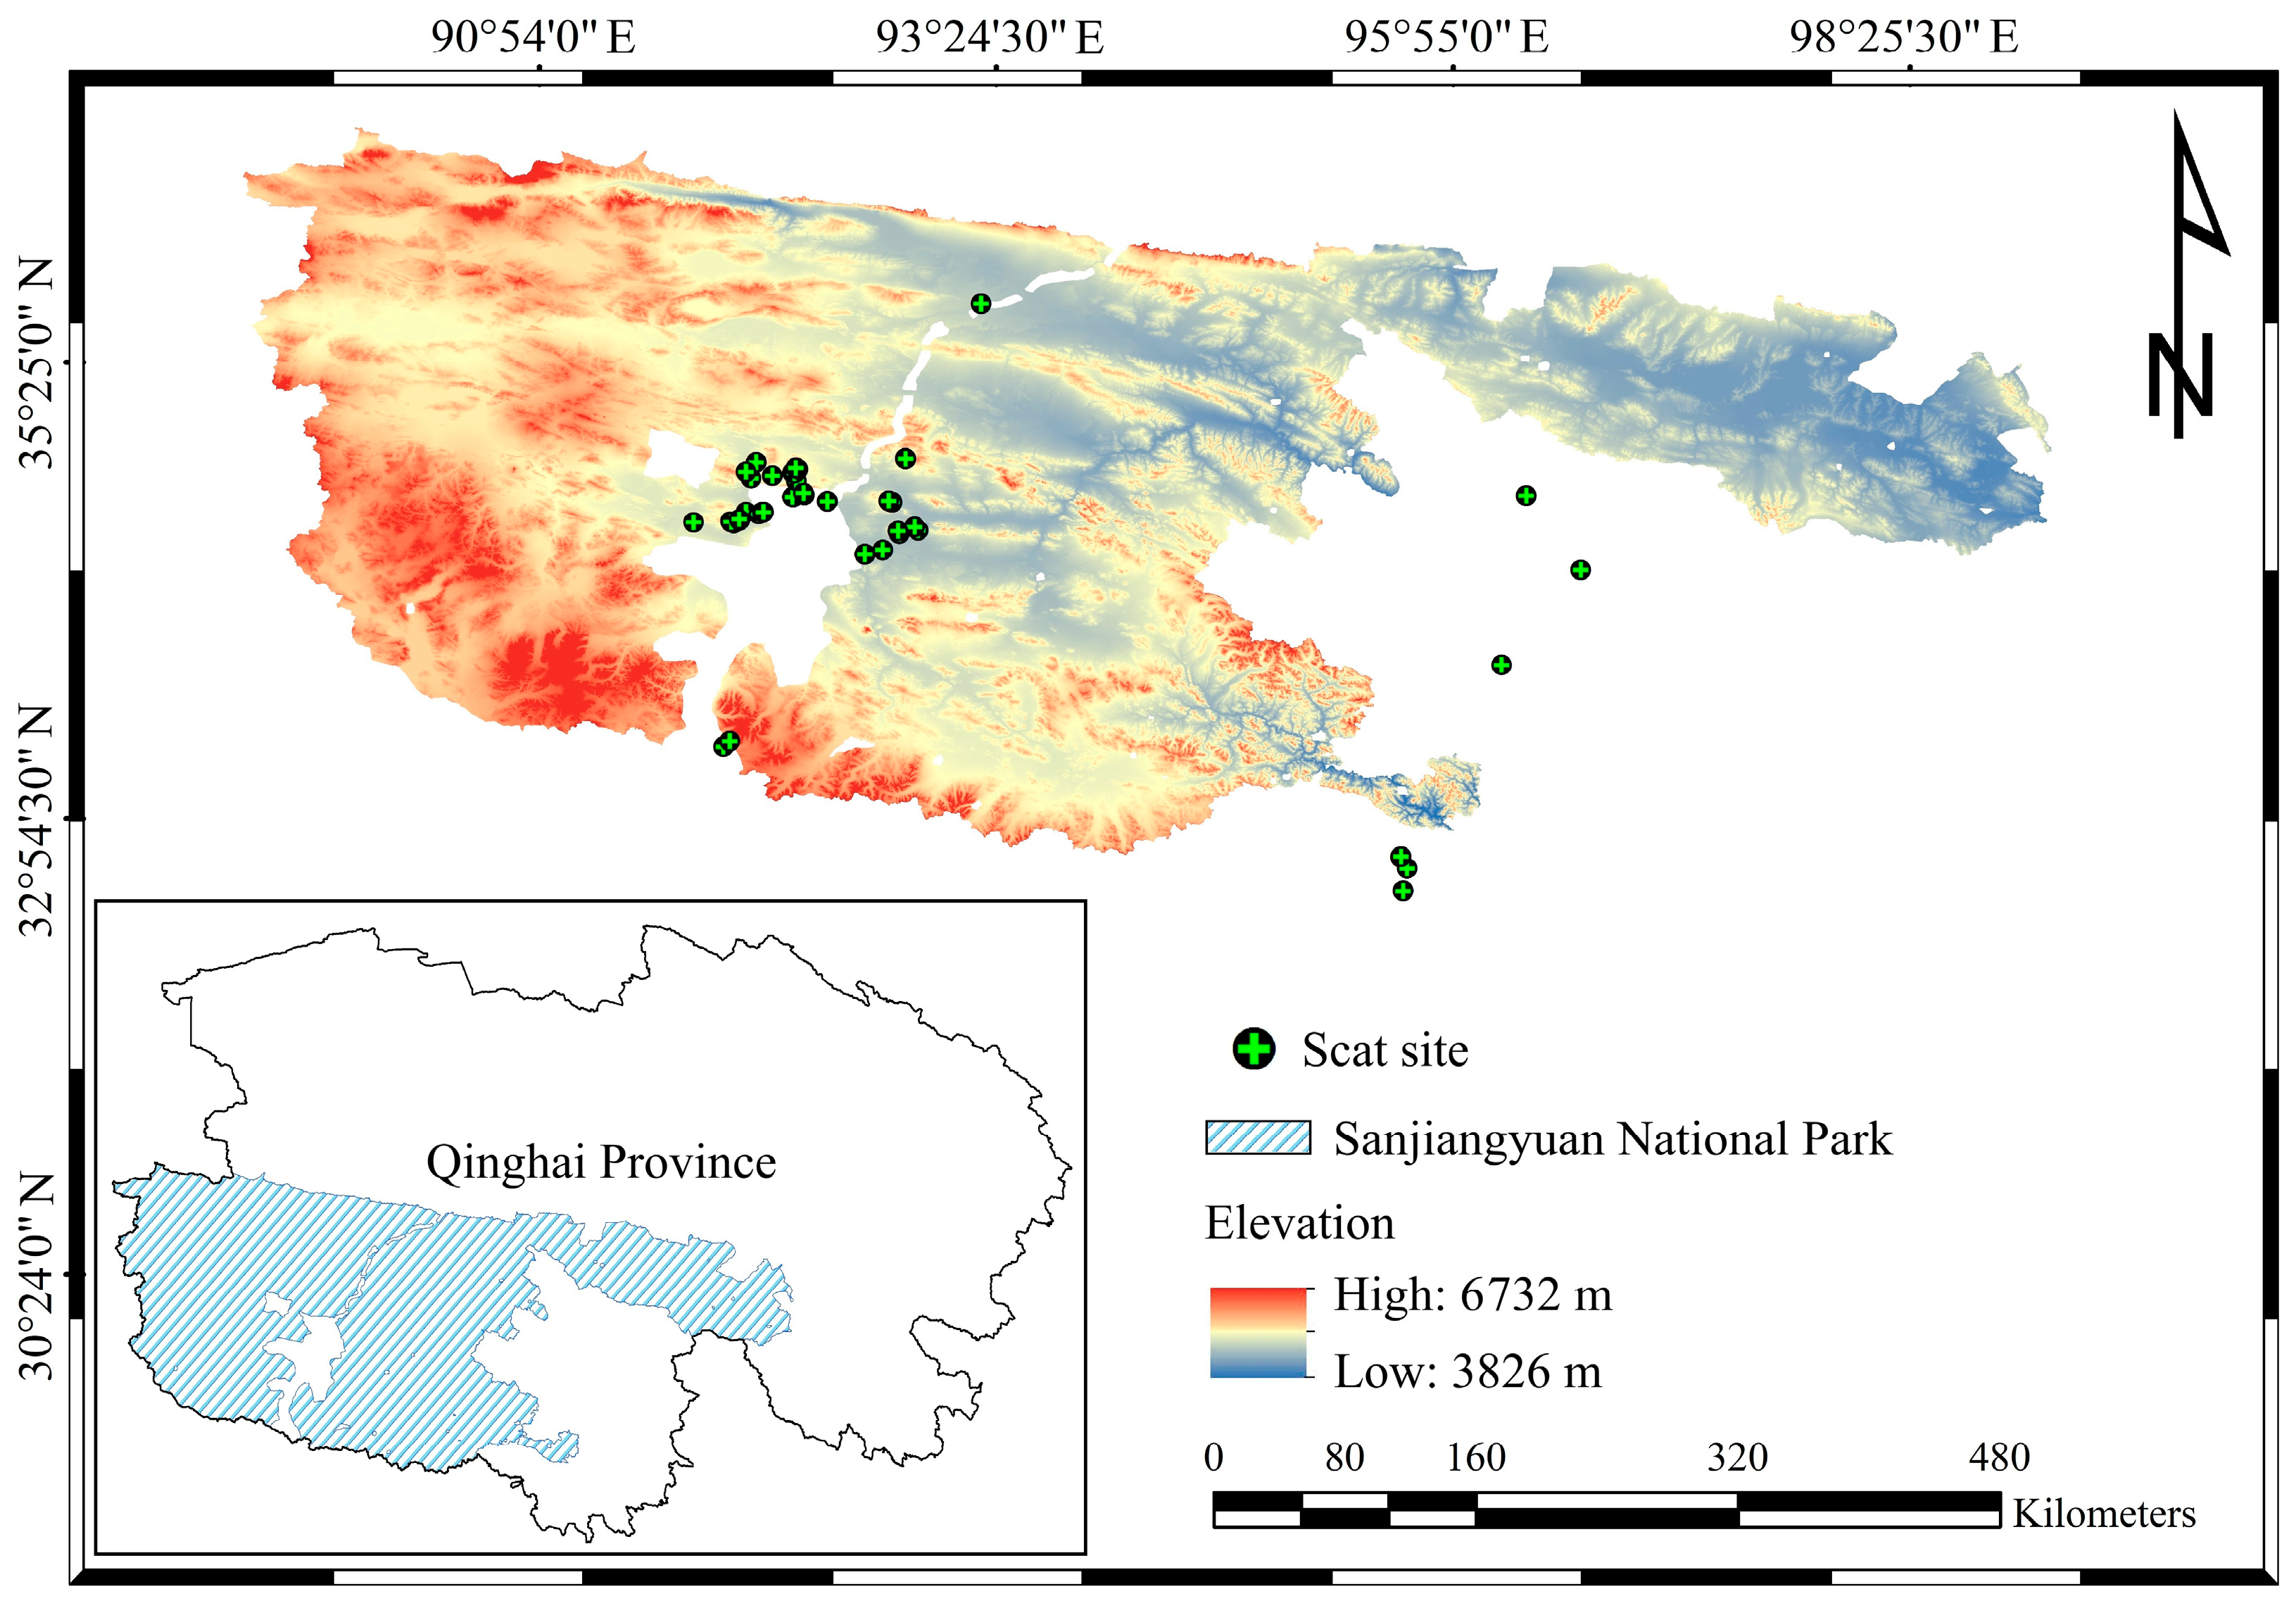
2.1. Study Area

The study was conducted in the Sanjiangyuan National Park (SNP; 32°26′04″~36°16′49″ N, 89°24′06″~99°06′46″ E), situated in the northeastern Qinghai-Xizang Plateau in China (Figure 1). The SNP serves as the source of three major rivers—the Yangtze River, the Yellow River, and the Lancang River—and encompasses three distinct geographical regions according to the three rivers [28]. The topography of the region is characterized by its complexity, with the average elevation exceeding 4500 m. The mean annual temperature ranges from –5.6 °C to 7.8 °C, and the cold season lasts for approximately seven months [29]. The SNP hosts a variety of ecological systems, including glacial formations, snow-capped peaks, high-altitude lakes and wetlands, alpine grasslands, and meadows. These diverse ecosystems support a rich and unique assemblage of plateau wildlife, earning the region the title of “Alpine Biological Germplasm Resource Bank” [30]. The biodiversity within the SNP is remarkable, comprising 760 species of vascular plants and 125 species of wildlife [28,31].

2.2. Fecal Sample Collection

This study collected a total of 160 suspected carnivore fecal samples via route search method in the SNP and its surrounding regions during December 2023 (cold season) and July 2024 (warm season). To minimize the possibility of multiple fecal samples originating from the same individual, during fecal sample collection, we ensured that the sampling distance between samples with similar external morphologies was greater than 1 km, with a range up to 1039.28 km, and that the mean sampling distance was 155.41 ± 1.51 km (mean ± SEM), thereby reducing potential sampling bias. Upon encountering relatively fresh fecal samples, GPS coordinates and sampling time were meticulously documented. Researchers subsequently collected appropriate quantities of fecal material using disposable polyethylene (PE) gloves, transferring the samples into 50 mL sterile tubes labeled with collection dates and unique identification codes. Disposable gloves were replaced between each sampling event to prevent cross-contamination. The collected samples were immediately submerged in absolute ethanol on the day of collection. After 24 h of fixation, the ethanol was carefully decanted and replaced with silica gel desiccants for moisture absorption. All specimens were subsequently transported to the laboratory and cryopreserved at −20 °C until further analysis. Strict adherence to standardized protocols throughout the sampling process ensured sample integrity and minimized environmental DNA degradation.

2.3. Fecal DNA Extraction, Amplification and High-Throughput Sequencing

This study employed the QIAamp Fast DNA Stool Mini Kit (QIAGEM, Hilden, Germany) for extracting DNA from fecal samples, and the Qubit assay was used to quantify the DNA concentration.
The host species and dietary composition of fecal samples were identified using 12S V5-F/R primers [32], with the PCR reaction system referenced from prior studies [25]. In this study, PCR products were purified using the E.Z.N.A. Gel Extraction Kit (Omega, NJ, USA). Subsequently, paired-end sequencing (250 bp read length) was carried out on the Illumina Nova-Seq 6000 sequencing platform. Library preparation and sequencing were performed by Guangdong Magigene Biotechnology Co., Ltd. (Guangzhou, China). Primer details are provided in Table 1.

2.4. Data Processing and Analysis

The reads obtained from second-generation sequencing were subjected to initial quality control using the Fastp software (version 0.12.4). This process included adapter trimming and the filtering of low-quality reads. The filtered paired-end reads were subsequently assembled using the USEARCH software (version 11.0.667), with a default selection of 350,000 reads or all reads if the total number was below this threshold. The VSEARCH software (version 2.8.1) was employed to remove primer sequences by aligning them at both ends and discarding sequences with more than 1% sequencing errors. Additionally, the length of the assembled sequences was restricted to the specified range of the amplified product to exclude non-target-length sequences. All assembled sequences from the samples were then pooled, and duplicate sequences were removed using the VSEARCH software. Only sequences with an abundance greater than four were retained as representative sequences. The chimera-filtered representative sequences were further processed using the uchime3_denovo algorithm in USEARCH software (version 5.2.32) for de novo chimera removal. Subsequently, Operational Taxonomic Unit (OTU) clustering was performed using selected OTU delineation algorithms (UCLUST/UPARSE/UNOISE) to generate OTU representative sequences. Finally, the usearch_global algorithm in USEARCH was employed to align the merged assembled sequences against the OTU sequence set, retaining sequences with >97% coverage and >99% similarity to construct the final OTU table.
The obtained OTU sequences were aligned against the reference sequences of the target gene metabarcoding database using BLAST software (V 2.2.31). Sequences with an alignment length of less than 90% and similarity below 80% were excluded. Taxonomic classification was hierarchically assigned at five levels (species, genus, family, order, and class) based on default similarity thresholds of 98%, 95%, 90%, and 85%, respectively. The annotation results were appended to the final column of the OTU table. Subsequently, the final taxonomic assignments were determined by evaluating candidate species for each OTU. Host-derived OTU sequences were removed, and target taxonomic groups were selected. Additionally, prey species identification was validated against the SNP species distribution inventory to confirm the regional presence of detected species.
(1)
This study utilized relative read abundance (RRA%) to quantitatively describe the proportion of sequence abundance for each prey taxonomic group in fecal samples following weighted averaging. The calculation formula is as follows:
R R A i = 1 S k = 1 s n i , k i = 1 T n i , k × 100 %
In this formula, the parameter S denotes the total number of fecal samples collected for the target species, T represents the total number of prey species identified, and ni,k signifies the number of sequences attributed to prey species i within fecal sample k. The cumulative relative read abundance (RRA) for each prey species across all fecal samples of a given target species equals 100%.
(2)
To further investigate the dietary differences between the two small carnivores, this study employed the Levins index (B) and the Pianka overlap index (Ojk). These indices were applied to evaluate the dietary niche breadth of the Pallas’s cat and the red fox [33], as well as the extent of dietary overlap between them [34,35], based on the relative abundance of food composition at the species level.
B = 1 i = 1 n P j 2
O j k = P i j · P i k P i j 2 · P i k 2
In the above formula, parameter B denotes niche breadth, while Pj signifies the proportion of food item j. The value of B ranges from 0 to infinity. Ojk represents the Pianka overlap index, where Pij and Pik indicate the relative abundance of food item i in the diets of species j and k, respectively. The range of Ojk values extends from 0 to 1. According to the evaluation criteria, an Ojk value of 0 implies no dietary overlap, whereas an Ojk value of 1 suggests complete dietary overlap. An Ojk value exceeding 0.3 is deemed to signify significant overlap, and an Ojk value surpassing 0.6 is considered to reflect pronounced overlap.

3. Results

Through DNA extraction, sequencing, and sequence alignment of the collected fecal samples, 26 samples were confirmed to belong to Pallas’s cats, while 13 were identified as originating from red foxes. The average altitude of collection sites for the 26 Pallas’s cat fecal samples was 4799 m (ranging from 4690 m to 4984 m), whereas the average altitude for the 13 red fox fecal samples was 4768 m (ranging from 4456 m to 5051 m).

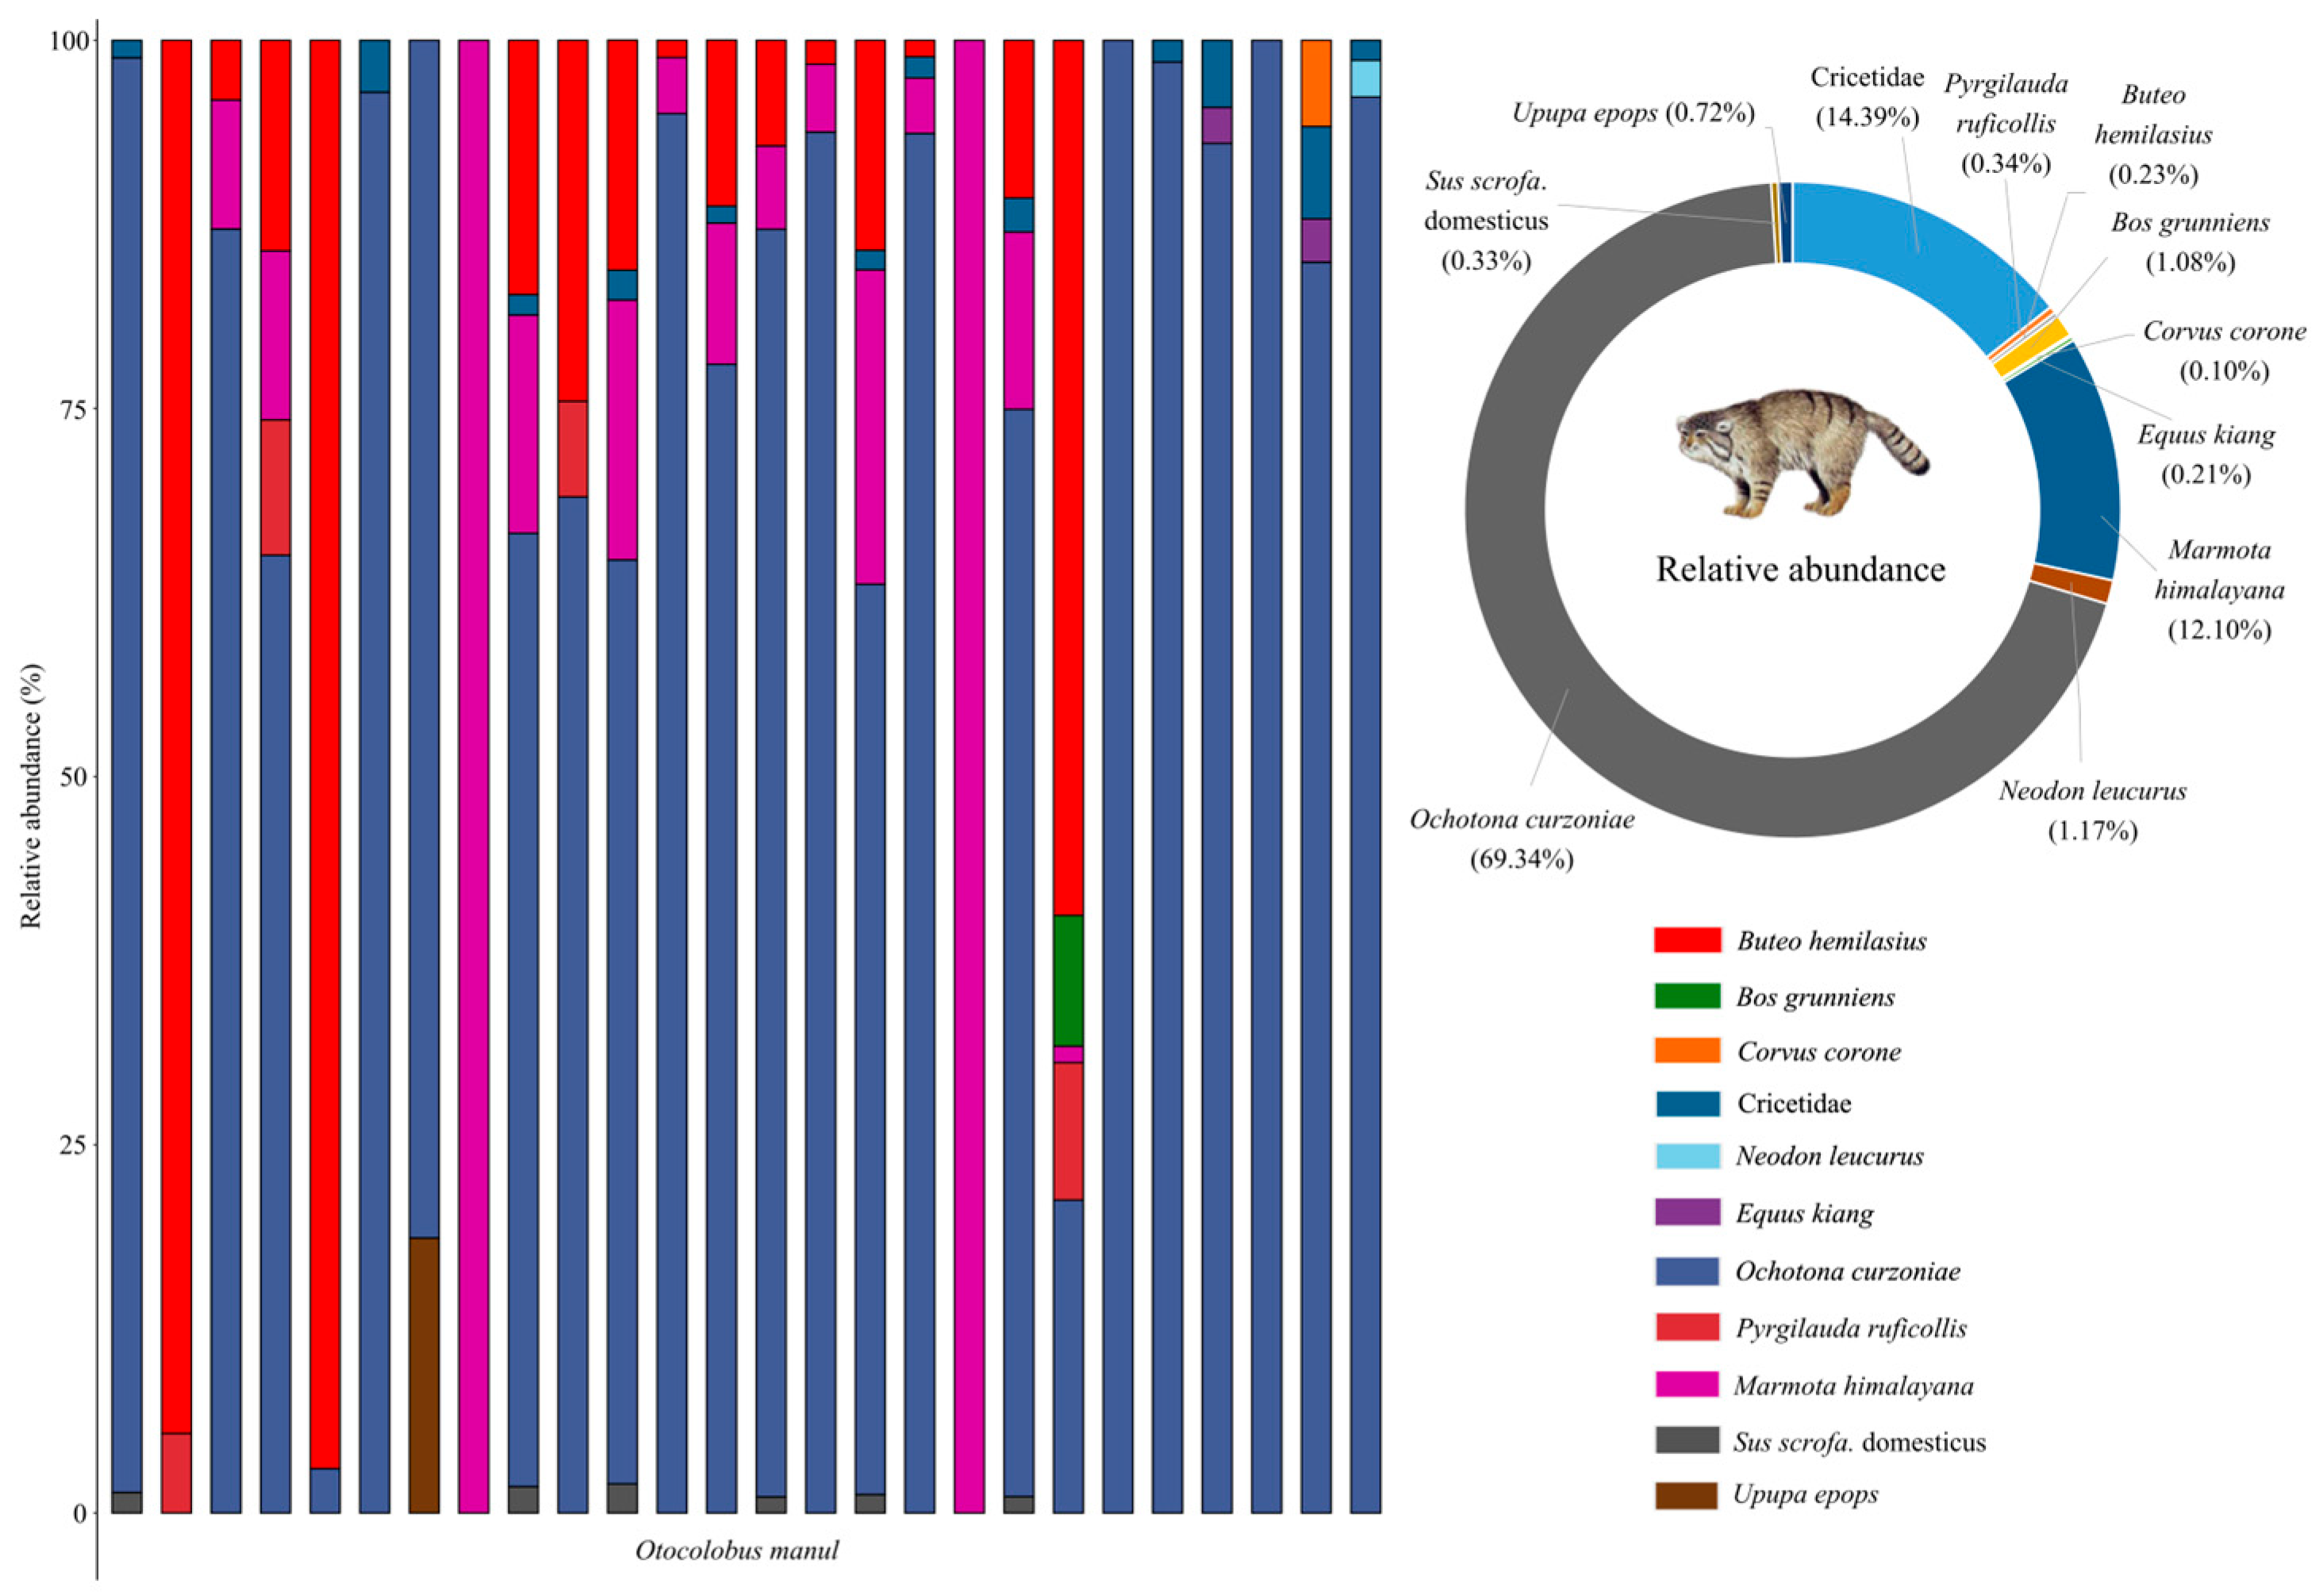
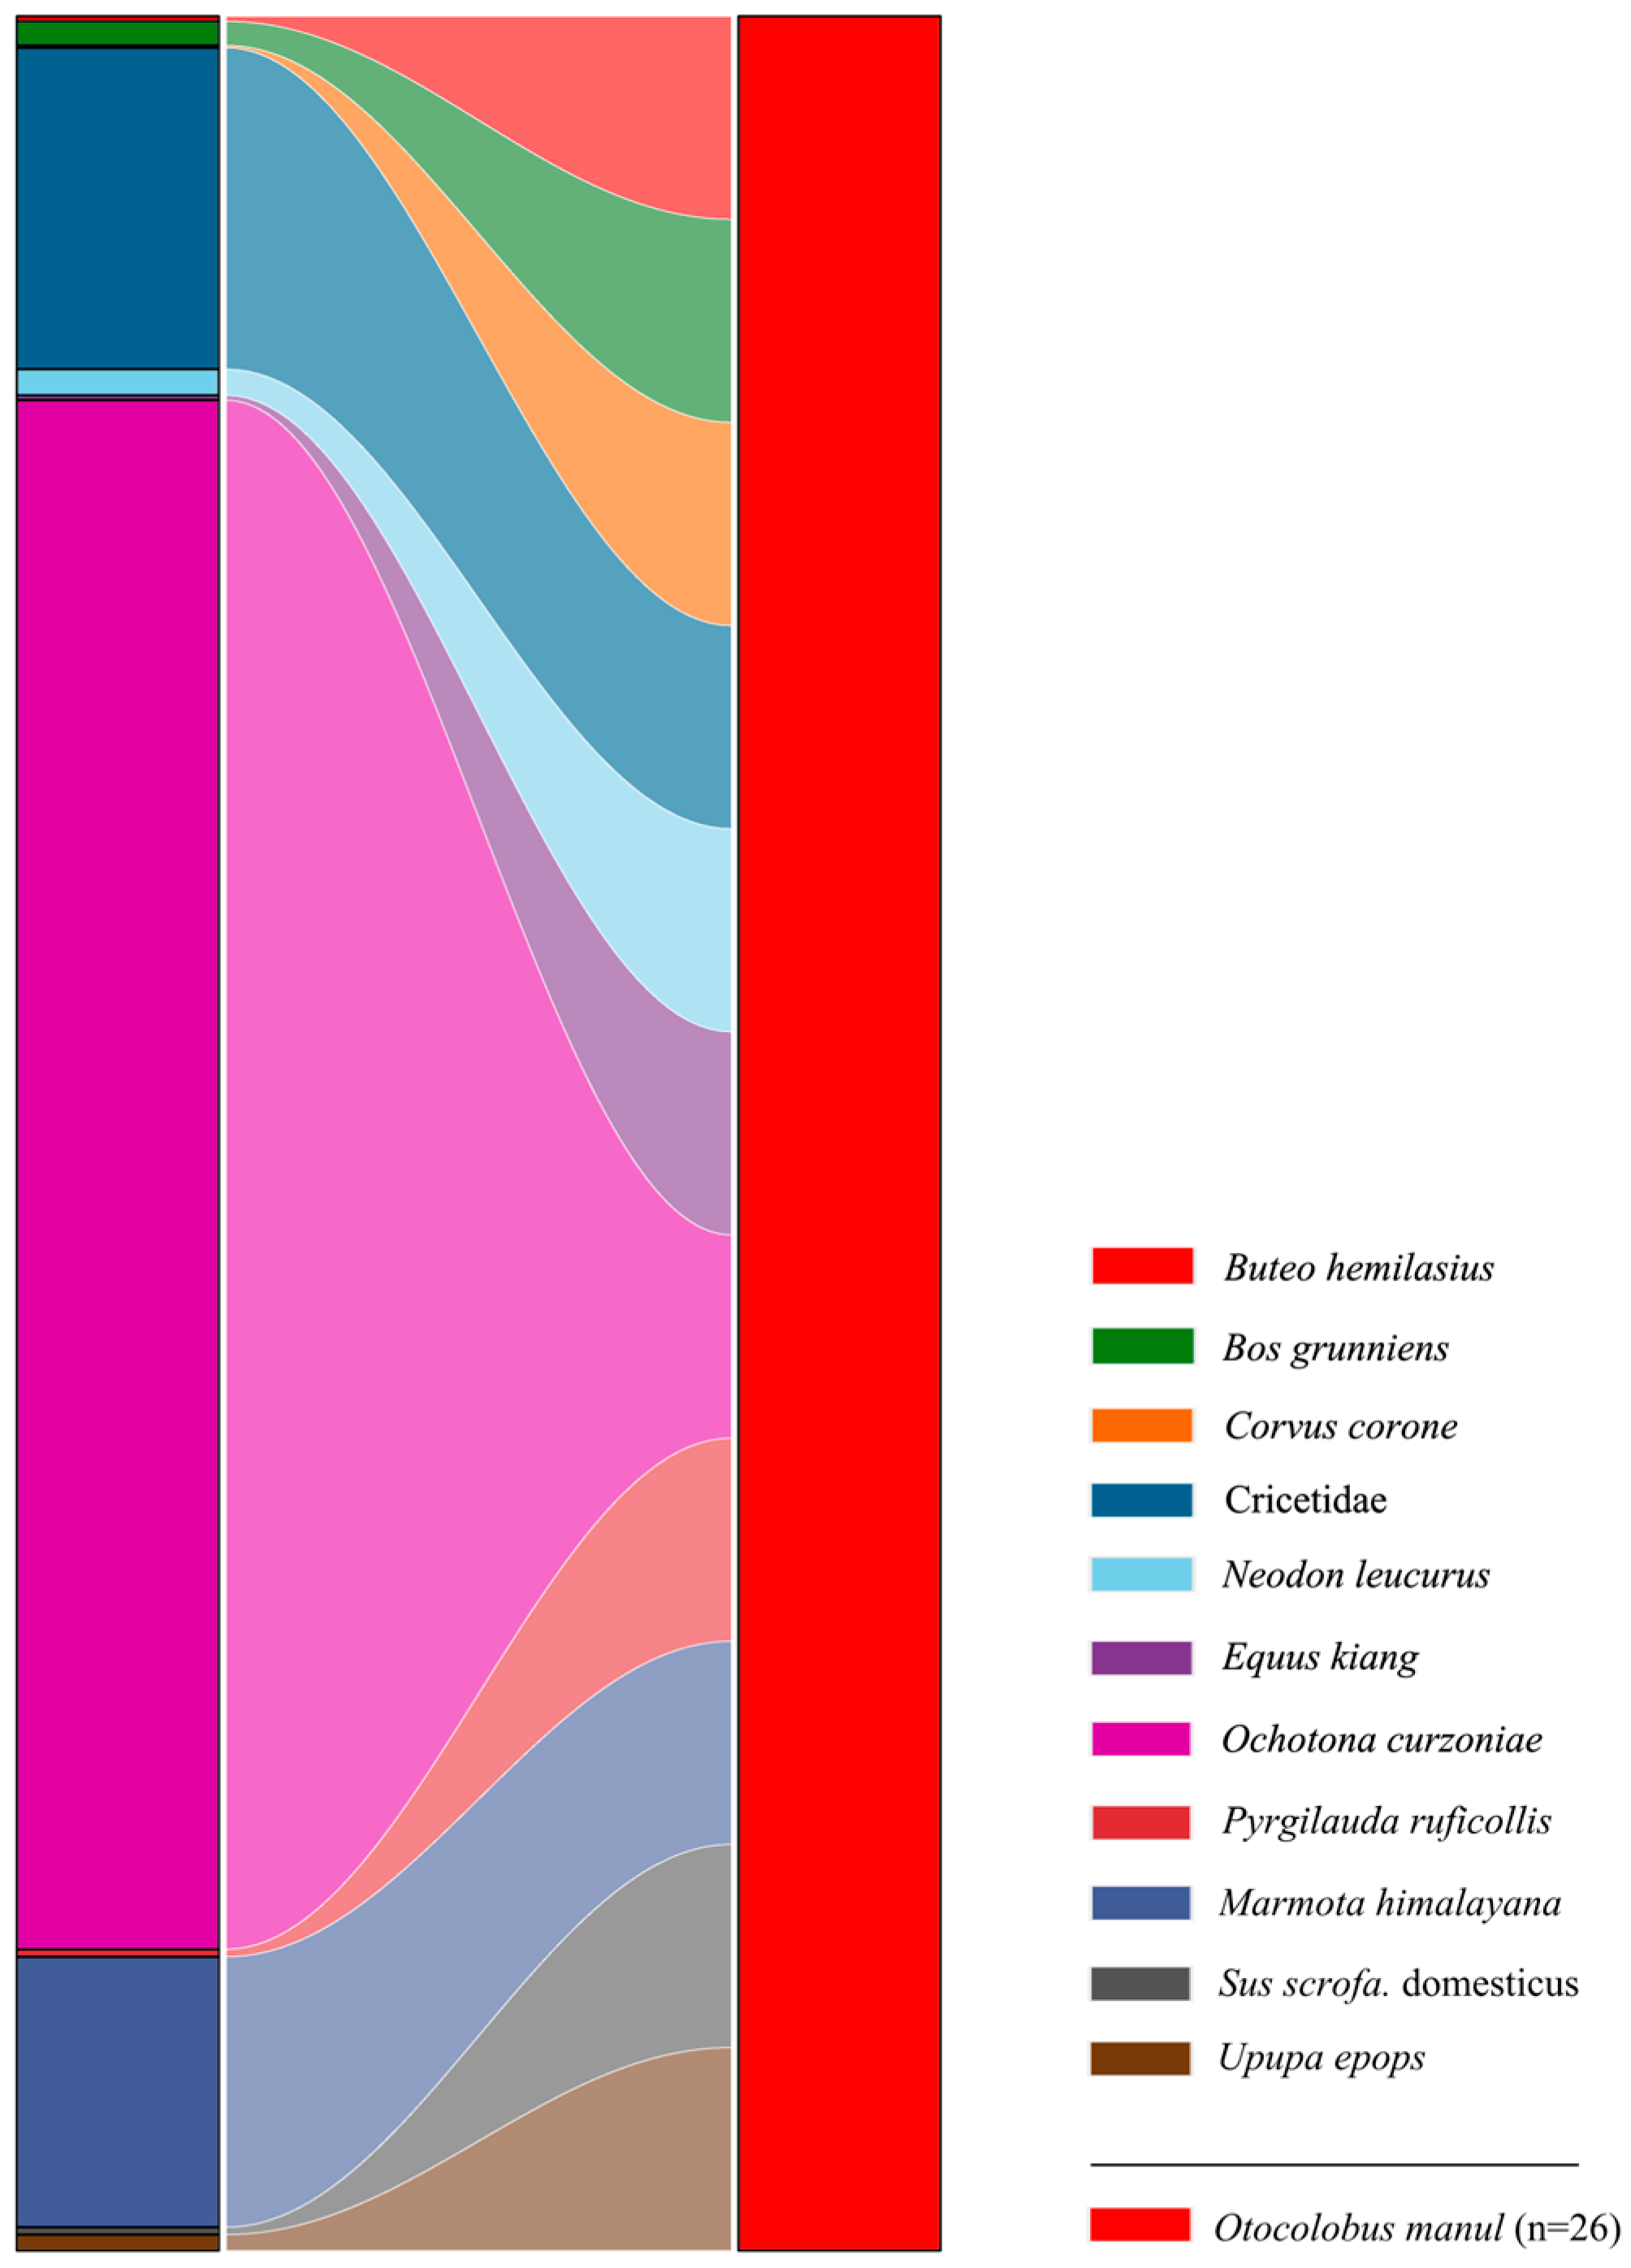
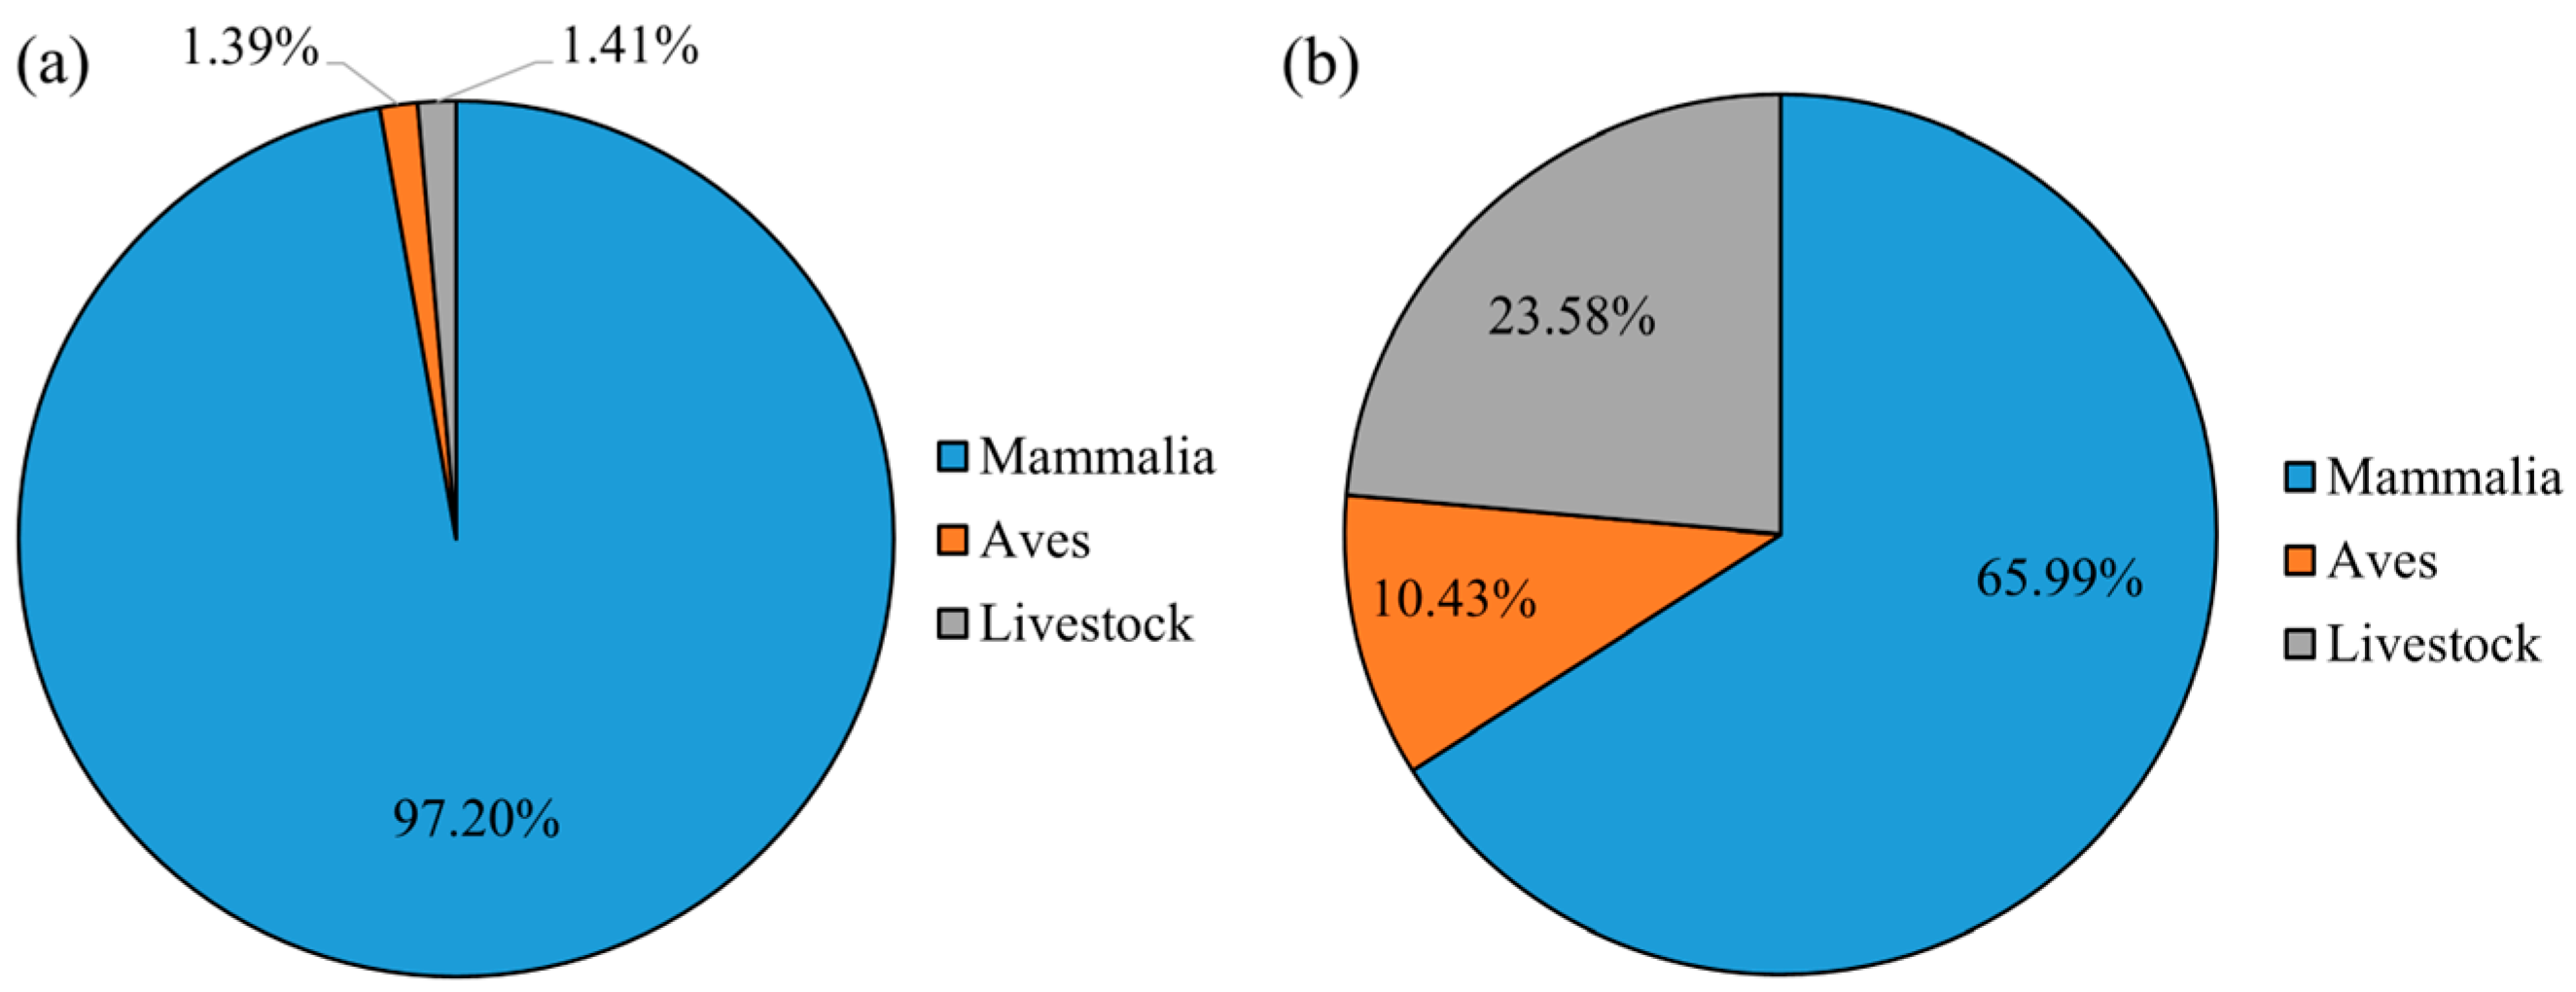
3.1. Dietary Composition of Pallas’s Cats

A total of 10 prey species were identified in the fecal samples of Pallas’s cats, comprising four mammal species (RRA = 82.83%), four bird species (RRA = 1.39%), and two livestock species (RRA = 1.41%) (Figure 2 and Figure 3). Additionally, a significant proportion of the diet consisted of unidentified species within the family Cricetidae (RRA = 14.39%). Within the identified prey composition of Pallas’s cats, the top three mammalian species ranked by relative abundance, in descending order, were the plateau pika (Ochotona curzoniae Hodgson, 1858; RRA = 69.34%), Himalayan marmot (Marmota himalayana Hodgson, 1841; RRA = 12.10%), and Blyth’s mountain vole (Neodon leucurus Blyth, 1863; RRA = 1.17%). Collectively, these species accounted for 82.61% of the total relative abundance (Figure 2). Avian species constituted a minimal proportion within the dietary composition of Pallas’s cats, with all individual avian prey species exhibiting relative abundances below 1.00%. Statistical analysis revealed that avian prey collectively accounted for only 1.39% of the total relative abundance in the cats’ dietary profile (Figure 2).

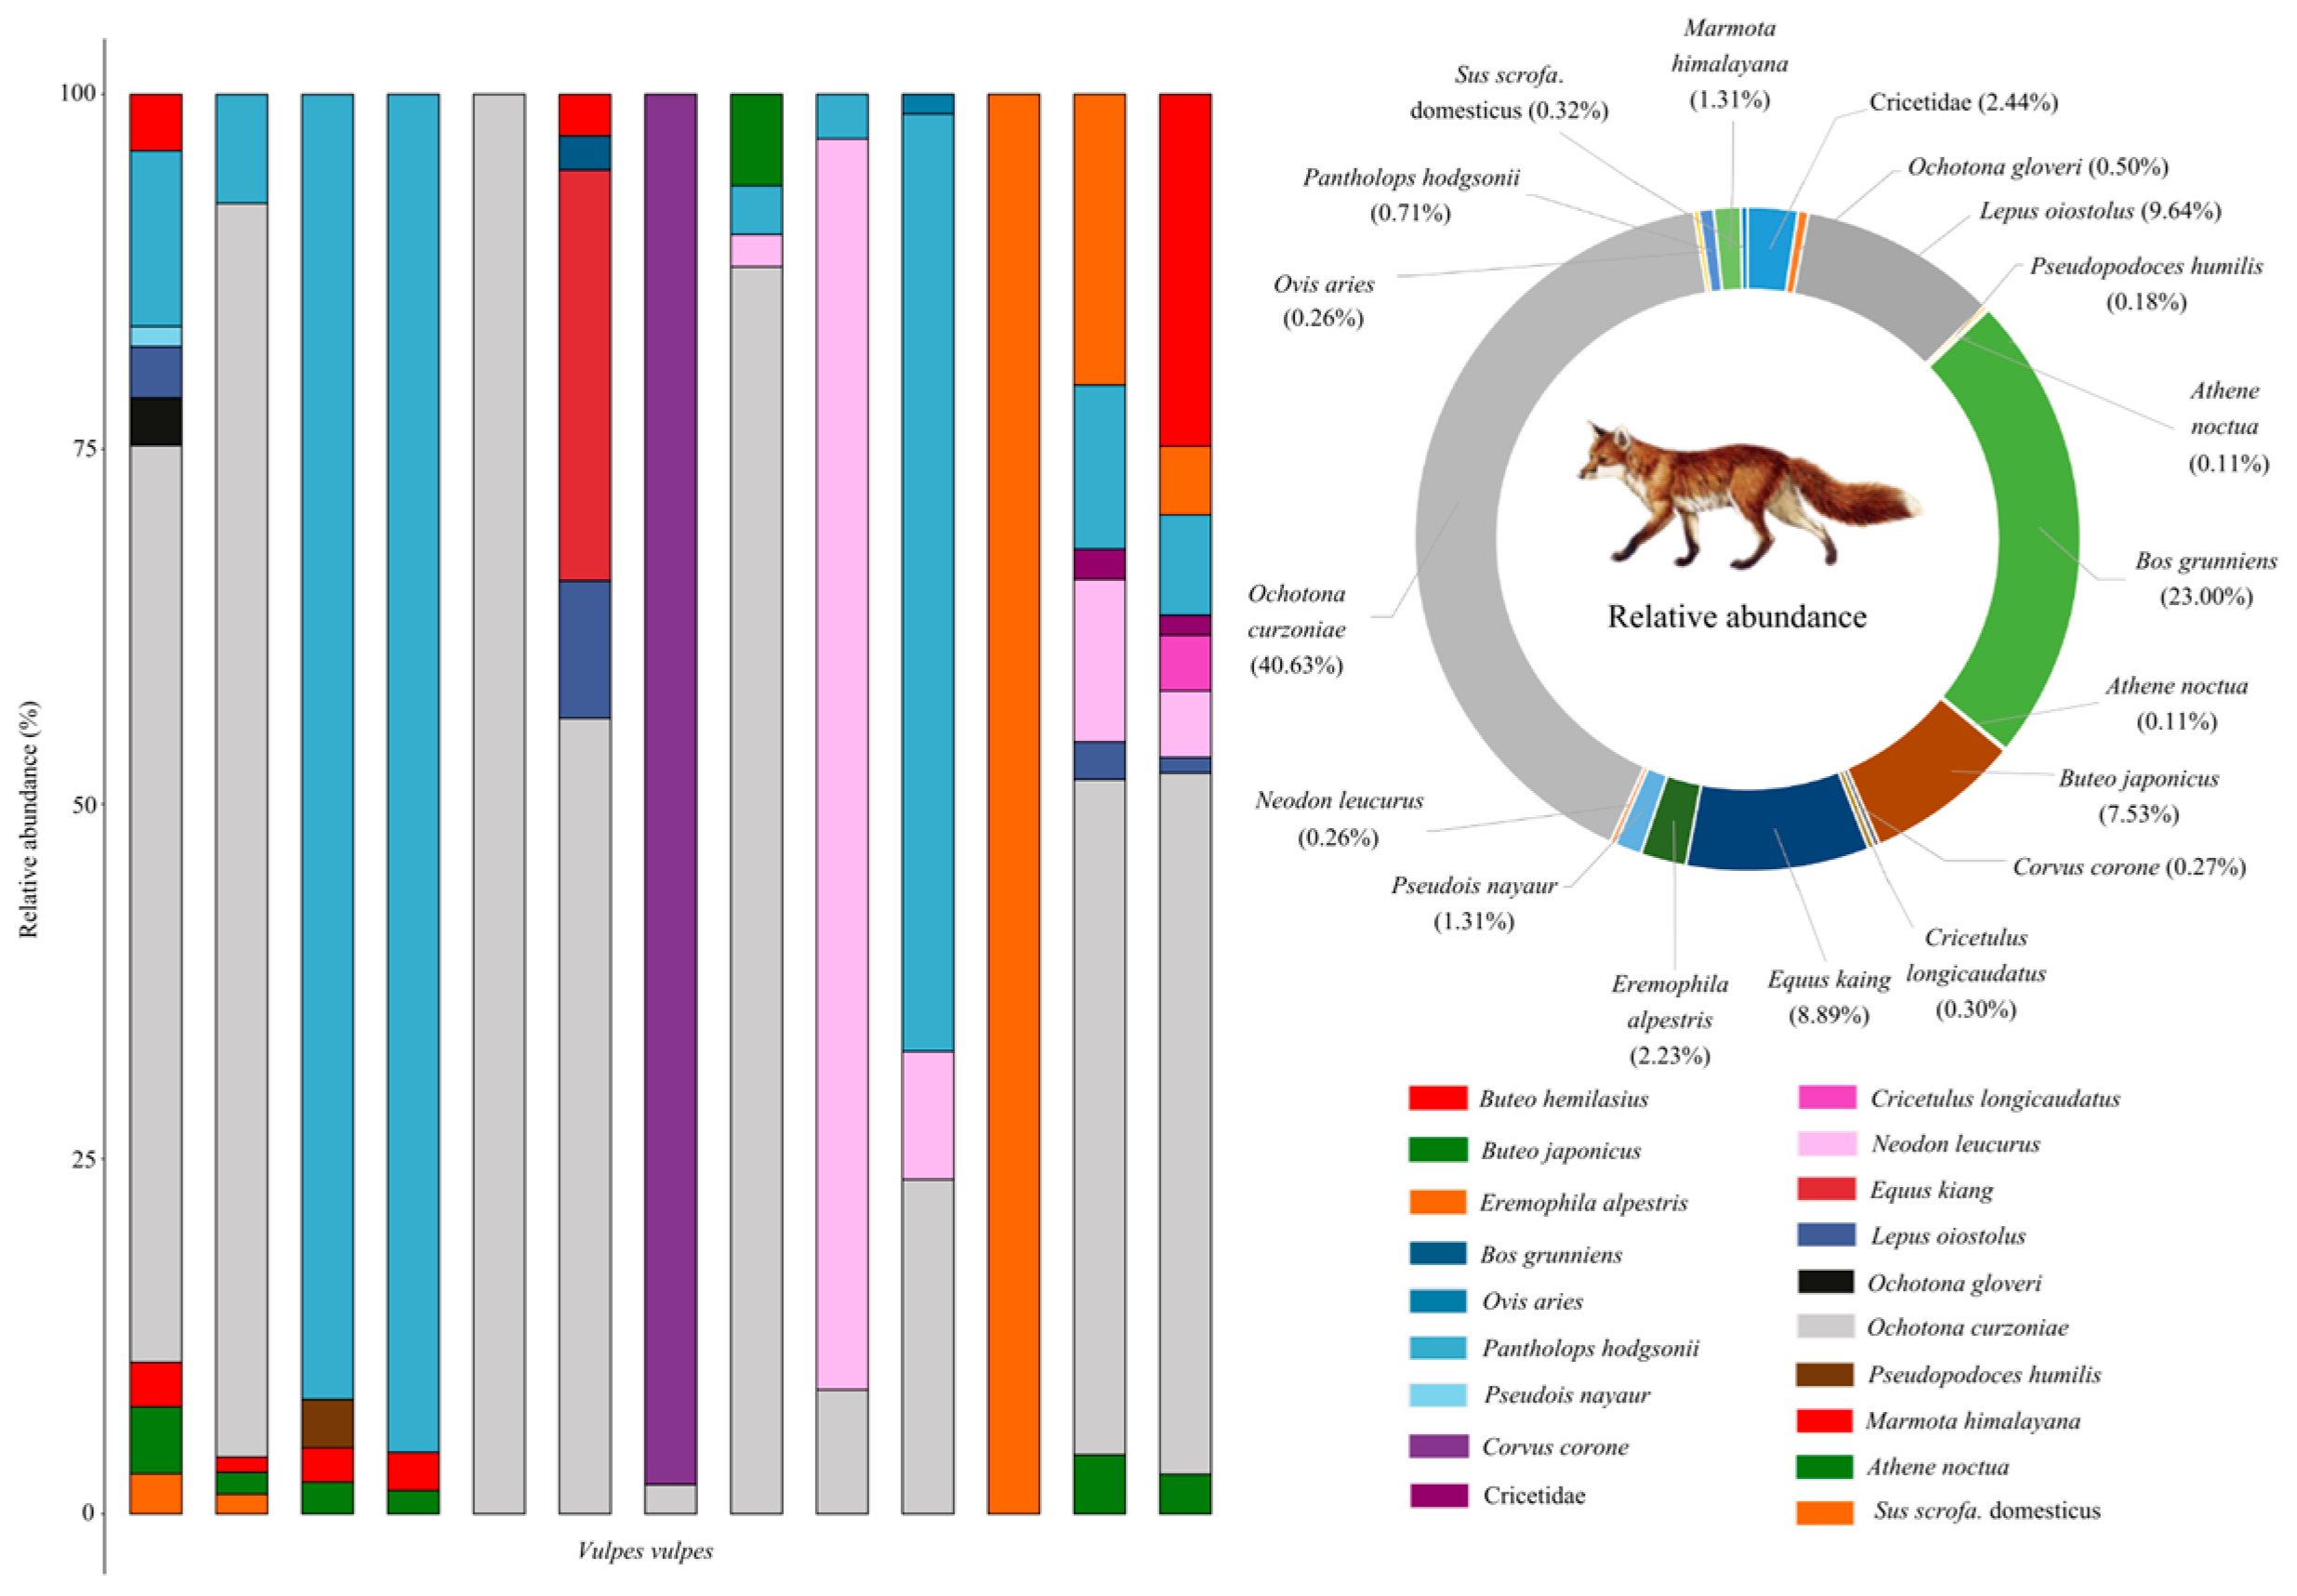
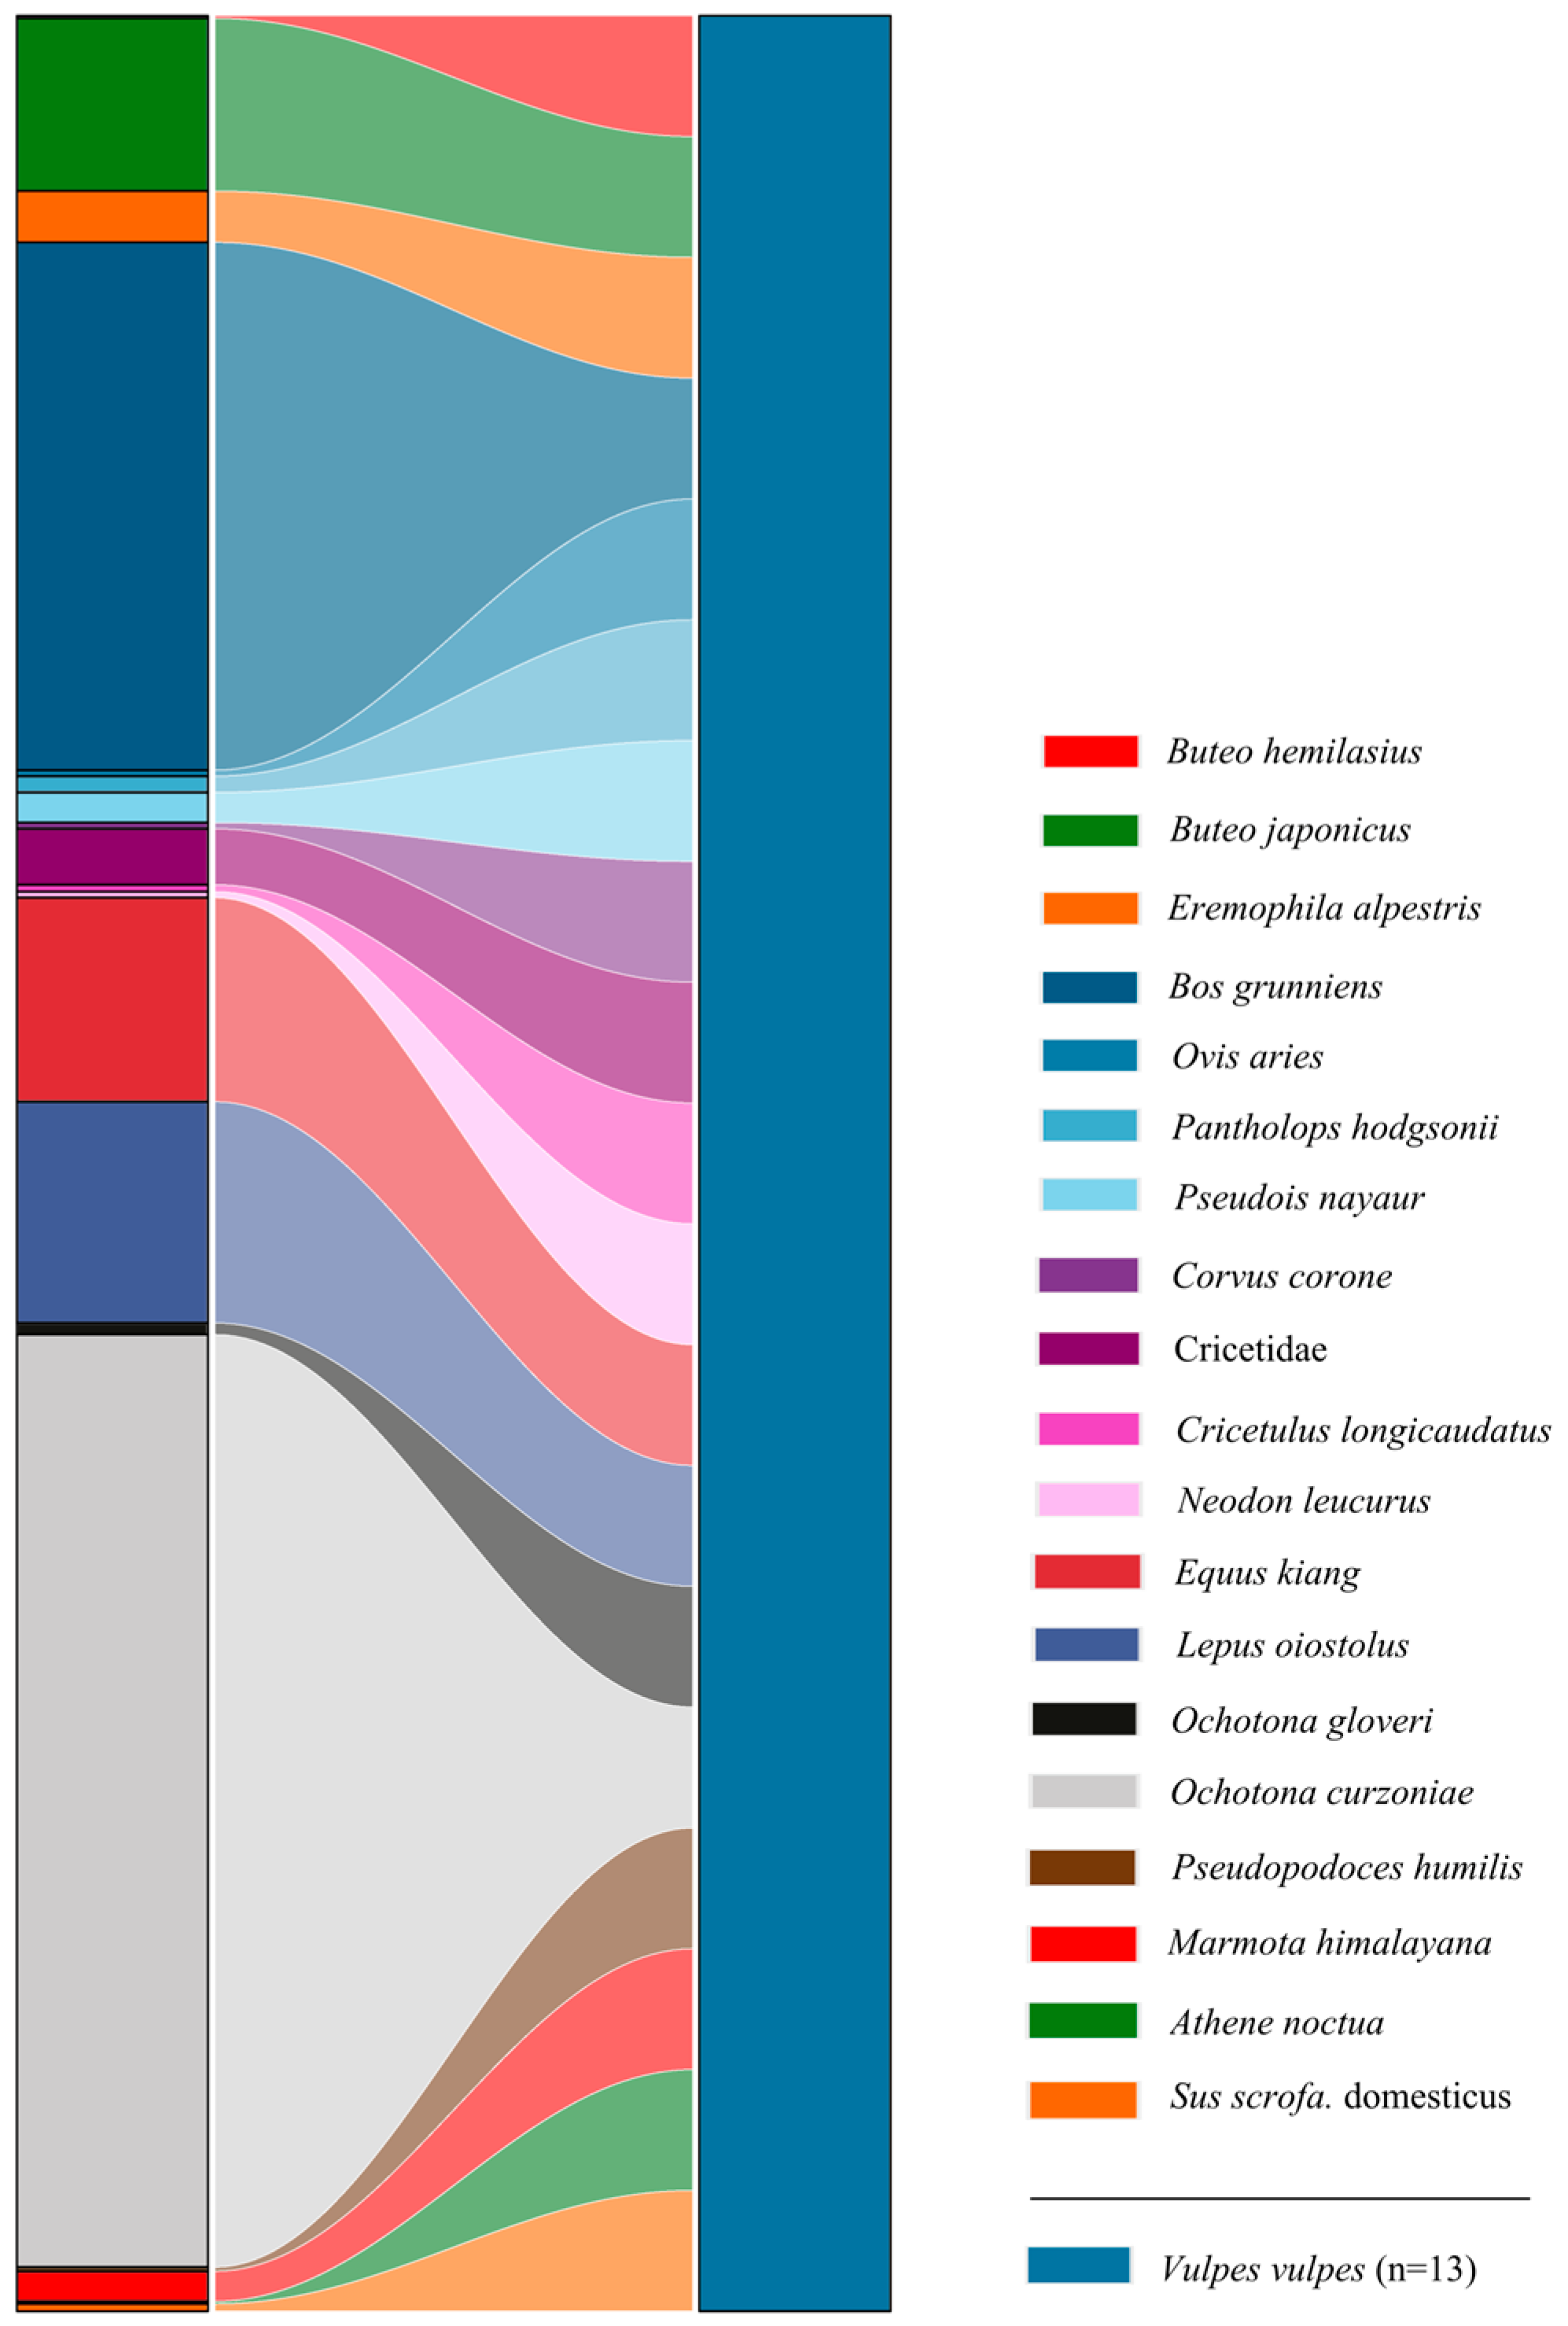
3.2. Dietary Composition of Red Foxes

A total of 18 prey species were identified in the fecal samples of red foxes, comprising nine mammal species (RRA = 63.55%), six bird species (RRA = 10.43%), and three livestock species (RRA = 23.58%) (Figure 4 and Figure 5). Additionally, the relative abundance of unidentified species within the Cricetidae family was determined to be 2.44%. Within the dietary composition of the red fox, the top three mammalian prey species by relative abundance, in descending order, were the plateau pika (RRA = 40.63%), domestic yak (Bos grunniens Linnaeus, 1978; RRA = 23.00%), and woolly hare (Lepus oiostolus Hodgson, 1848; RRA = 9.64%). These three prey species collectively accounted for 73.27% of the total dietary relative abundance, while the remaining mammalian species contributed only 4.03% (Figure 4). Avian species collectively constituted 10.43% of the dietary composition in red foxes, with the three species exhibiting the highest relative abundances being the common buzzard (Buteo japonicus Linnaeus, 1758; RRA = 7.53%), horned lark (Eremophila alpestris Linnaeus, 1758; RRA = 2.23%), and carrion crow (Corvus corone Linnaeus, 1758; RRA = 0.27%), listed in descending order of prevalence (Figure 4).

3.3. Dietary Breadth and Overlap Between Pallas’s Cats and Red Foxes

Statistical analysis revealed that mammals constituted the predominant prey item for Pallas’s cats, accounting for 97.20% of their diet (Figure 6). In contrast, the diet of red foxes comprised a significant proportion of livestock and birds in addition to mammals (Figure 6). The calculations of dietary niche breadth and overlap indicated that the red fox (B = 267.89) exhibited a broader dietary niche compared to the Pallas’s cat (B = 162.94). Additionally, despite a high dietary niche overlap coefficient between Pallas’s cats and red foxes (Ojk = 0.81), significant differences were observed in their feeding proportions of different species (p = 0.0123). This indicates that Pallas’s cats and red foxes primarily mitigate interspecific competition by preying on different species and proportions.

4. Discussion

The dietary composition of animals serves as a critical reflection of their ecological relationships with habitats and, to a certain extent, acts as an indicator of local species diversity [36]. Investigating feeding ecology is essential for understanding organism–environment interactions and predator–prey dynamics, while also forming a fundamental basis for addressing contemporary scientific priorities. These include the development of habitat utilization models, the investigation of disease transmission mechanisms, the assessment of species survival pressures, and biodiversity evaluation [37,38]. DNA barcoding technology has been extensively utilized in the dietary analysis of carnivores, encompassing species such as brown bears (Ursus arctos Linnaeus, 1758), lynxes (Lynx lynx Linnaeus, 1758), and leopard cats (Prionailurus bengalensis Kerr, 1792), facilitating precise elucidation of regional food web construction and interspecific relationships [39,40].
Constrained by limited environmental resources, competitors coexisting in the same habitat have gradually evolved distinct foraging strategies over prolonged evolutionary timescales to fulfill their survival requirements [41]. Trophic resource partitioning, as a critical dimension of interspecific competition, plays a key role in elucidating the coexistence mechanisms of sympatric species within shared ecological niches [15]. This study employed DNA barcoding technology to quantify the dietary composition and interspecific overlap between two sympatric species, the Pallas’s cat and the red fox. It elucidated the mechanisms by which these two species achieve sympatric coexistence through the lens of nutritional niche differentiation. Moreover, the study highlighted the efficiency and convenience of utilizing fecal DNA for rapid species surveys. Investigating the mechanisms underlying regional coexistence from spatial and temporal niche dimensions revealed that Pallas’s cats and red foxes exhibit relatively high spatial overlap in habitat utilization, but mitigate interspecific competition by reducing temporal overlap in activity patterns [28]. Our study also addressed the limitations of previous research that focused solely on the spatial and temporal niche perspectives of local coexistence mechanisms for the Pallas’s cat and the red fox, without considering dietary niche differentiation. In the context of the SNP, despite a high degree of dietary overlap between the Pallas’s cat and the red fox (Oij = 0.81), these two species achieve sympatric coexistence primarily through differential feeding proportions on shared prey species, thereby alleviating interspecific competition. Additionally, the red fox (B = 267.89) exhibited a broader trophic niche breadth compared to Pallas’s cat (B = 162.94), with significantly greater prey diversity in its diet. Collectively, the dietary differences between the two small carnivore species also provide validation for the resource allocation hypothesis. These ecological differences enhance trophic niche divergence between the two carnivores, mitigating interspecific interference and competition, and thus promoting regional coexistence via resource partitioning mechanisms.
Research indicated that small carnivores predominantly function as opportunistic predators, with their primary prey consisting of small mammals, birds, amphibians, reptiles, and invertebrates. These species exhibit omnivorous tendencies to varying degrees, thereby occupying relatively broad trophic niches [42,43]. Moreover, due to their greater tolerance for human disturbances compared to large carnivores, small carnivores may also consume food resources associated with human activities [44]. Previous studies have demonstrated that more than 50% of the Pallas’s cat’s dietary composition consists of small mammals [24]. Additionally, Pallas’s cats inhabit rocky crevices or abandoned marmot burrows year-round [26]. Our study revealed that Pallas’s cats predominantly prey on plateau pikas (RRA = 69.34%), with Himalayan marmots constituting a secondary yet significant component of their diet (RRA = 12.10%). These findings corroborate previous studies that have identified plateau pikas and small rodents as the primary prey for Pallas’s cats, while also emphasizing the critical role of predation pressure from small carnivores like Pallas’s cats in maintaining population stability within pika colonies across their distribution areas [24,45,46]. This trophic regulation mechanism underscores the ecological significance of meso-predators in maintaining grassland ecosystem stability through top-down control of herbivore populations. Dietary analysis revealed that red foxes predominantly consumed plateau pikas (RRA = 40.63%) and domestic yaks (RRA = 23%), which together accounted for the largest proportion of their diet. Additionally, traces of large ungulate prey, such as kiang, Tibetan antelope, and bharal, were detected in their dietary composition. This phenomenon is consistent with findings from other studies [24,46]. It implies that by consuming a certain proportion of large ungulate prey, the red fox can effectively alleviate competition with other sympatric small carnivores. However, considering that red foxes typically hunt individually, it is unlikely that they actively pursue these large prey species. It is hypothesized that red foxes frequently follow the activities of sympatric large carnivores to scavenge on carcasses left over from their predation [47,48]. Kleptoparasitism also serves as a critical survival strategy. For instance, smaller coyotes (Canis latrans Say, 1823) tracked the movements of gray wolves (Canis lupus Linnaeus, 1758) to exploit foraging opportunities by feeding on carcasses killed by the latter. This low-energy foraging strategy mitigated the predation risks posed by gray wolves to coyotes [49]. Additionally, studies have highlighted that species such as red foxes and Tibetan foxes follow the activities of brown bears to capture individuals that escape when brown bears excavate burrows to prey on plateau pikas [50]. Consequently, kleptoparasitism effectively elucidates the presence of large ungulate prey in the diet of small carnivores like red foxes and explains the coexistence of small and large carnivores within the same ecological area. In addition to acquiring carcasses of large prey through kleptoparasitism, we hypothesize that red foxes may also encounter naturally deceased large ungulates during their foraging activities in natural habitats. Together, these two ecological mechanisms help explain the presence of multiple large prey species in the dietary composition of red foxes.
In addition to domestic yak and sheep, the fecal samples of two small carnivore species also revealed traces of domestic pig, a non-native husbandry species. This finding could potentially be explained by the consumption of anthropogenic food waste containing remnants of domestic pigs, which were discarded by pastoralists during grazing activities and subsequently scavenged by these carnivores. Moreover, both Pallas’s cat (RRA = 14.39%) and red fox (RRA = 2.44%) exhibited unidentified Cricetidae species in their dietary composition. A literature review indicated that the local Cricetidae fauna comprised Tibetan dwarf hamster (Urocricetus kamensis Satunin, 1903), Stoliczka’s mountain vole (Alticola stoliczkanus Blanford, 1875), smoeky vole (Neodon fuscus Liu et al., 2012), Irene’s mountain vole (Neodon irene Thomas, 1911), and root vole (Alexandromys oeconomus Pallas, 1776) [51]. The unidentified Cricetidae sequences likely originate from these documented species within the study area. However, due to the limited number of fecal samples collected from Pallas’s cats and red foxes during the cold season, which lack sufficient statistical power, this study was unable to differentiate the seasonal impact on the dietary composition of these two small carnivores or examine variations in their feeding habits between the cold and warm seasons. Consequently, further collection of fecal samples across multiple seasons is necessary to evaluate the trophic niche differentiation between Pallas’s cats and red foxes with greater resolution.

5. Conclusions

The trophic niche, as a critical dimension of ecological niches, plays a pivotal role in shaping species-specific functional roles within ecosystem networks and their associated food web architectures [52]. A comparative analysis of dietary divergence among sympatric species elucidates patterns of trophic niche differentiation, which serves as a critical metric for quantifying potential interspecific competition intensity via niche overlap indices [53]. Our study demonstrated that Pallas’s cats and red foxes predominantly prey on plateau pikas and other small rodents within the SNP. Despite a high degree of trophic niche overlap between these two small carnivores, interspecific competition is mitigated through differential feeding proportions on shared prey. Additionally, red foxes exhibit greater prey diversity compared to Pallas’s cats, with a broader trophic niche breadth. These factors collectively reduce interspecific competition and interference, thereby promoting sympatric coexistence between Pallas’s cats and red foxes. The SNP exhibits high population density of plateau pikas (averaging 300–412 individuals/ha), which serve as primary prey for Pallas’s cats and red foxes [54,55], alongside abundant Himalayan marmots. This substantial prey availability partially mitigates interspecific competition between these two small carnivores. This research enhances our understanding of the potential intensity of interspecific competition and the mechanisms underpinning regional coexistence among sympatric small carnivore species within the SNP, thereby offering a scientific foundation for informed conservation and management strategies regarding these species.

Author Contributions

Conceptualization, D.W. and X.L.; Methodology, D.W., Q.L. and X.L.; Software, D.W. and X.L.; Validation, D.W., Q.L., J.G., L.H., Y.Z. and X.L.; Investigation, D.W., Q.L., J.G., L.H., Y.Z. and X.L.; Writing—original draft preparation, D.W.; Writing—review and editing, X.L.; Supervision, X.L.; Funding acquisition, X.L. All authors have read and agreed to the published version of the manuscript.

Funding

This research was funded by Joint Funds of the National Natural Science Foundation of China (U24A20361) and the National Key Research and Development Program of China (2023YFF1305000).

Institutional Review Board Statement

This study waived ethical review and approval. The study did not involve direct handling or physical contact with any animal species, nor did it cause any disturbance to wildlife or their habitats during the field sampling process.

Informed Consent Statement

Informed consent was obtained from all subjects involved in the study.

Data Availability Statement

Data will be made available on request.

Conflicts of Interest

The authors have no conflicts of interest to declare.

References

  1. Ripple, W.J.; Estes, J.A.; Beschta, R.L.; Wilmers, C.C.; Ritchie, E.G.; Hebblewhite, M.; Berger, J.; Elmhagen, B.; Letnic, M.; Nelson, M.P.; et al. Status and ecological effects of the world’s largest carnivores. Science 2014, 343, 1241484. [Google Scholar] [CrossRef] [PubMed]
  2. Descalzo, E.; Torres, J.A.; Ferreras, P.; Díaz-Ruiz, F. Methodological improvements for detecting and identifying scats of an expanding mesocarnivore in south-western Europe. Mamm. Biol. 2020, 101, 71–81. [Google Scholar] [CrossRef]
  3. Ritchie, E.G.; Elmhagen, B.; Glen, A.S.; Letnic, M.; Ludwig, G.; Mcdonald, R.A. Ecosystem restoration with teeth: What role for predators? Trends Ecol. Evol. 2012, 27, 265–271. [Google Scholar] [CrossRef]
  4. Ritchie, E.G.; Johnson, C.N. Predator interactions, mesopredator release and biodiversity conservation. Ecol. Lett. 2009, 12, 982–998. [Google Scholar] [CrossRef]
  5. Lanszki, J.; Heltai, M.; Kövér, G.; Zalewski, A. Non-linear relationship between body size of terrestrial carnivores and their trophic niche breadth and overlap. Basic. Appl. Ecol. 2019, 38, 36–46. [Google Scholar] [CrossRef]
  6. Linnell, J.D.C.; Strand, O. Interference interactions, co-existence and conservation of mammalian carnivores. Divers. Distrib. 2000, 6, 169–176. [Google Scholar] [CrossRef]
  7. Donadio, E.; Buskirk, S.W. Diet, morphology, and Interspecific killing in carnivora. Am. Nat. 2006, 167, 524–536. [Google Scholar] [CrossRef]
  8. Pokheral, C.P.; Wegge, P. Coexisting large carnivores: Spatial relationships of tigers and leopards and their prey in a prey-rich area in lowland Nepal. J. Med. Chem. 2019, 26, 1–9. [Google Scholar] [CrossRef]
  9. Li, Z.L.; Wang, T.M.; Smith, J.L.D.; Feng, R.N.; Feng, L.M.; Mou, P.; Ge, J.P. Coexistence of two sympatric flagship carnivores in the human-dominated forest landscapes of Northeast Asia. Landsc. Ecol. 2018, 34, 291–305. [Google Scholar] [CrossRef]
  10. Costa-Pereira, R.; Araújo, M.S.; Souza, F.L.; Travis, I. Competition and resource breadth shape niche variation and overlap in multiple trophic dimensions. Proc. R. Soc. B 2019, 286, 20190369. [Google Scholar] [CrossRef]
  11. Manlick, P.J.; Pauli, J.N. Human disturbance increases trophic niche overlap in terrestrial carnivore communities. Proc. Natl. Acad. Sci. USA 2020, 117, 26842–26848. [Google Scholar] [CrossRef] [PubMed]
  12. Leibold, M.A. The niche concept revisited: Mechanistic models and community context. Ecology 1995, 76, 1371–1382. [Google Scholar] [CrossRef]
  13. Marshal, J.P.; Bleich, V.C.; Andrew, N.G. Evidence for interspecific competition between feral ass Equus asinus and mountain sheep Ovis canadensis in a desert environment. Wild Biol. 2008, 14, 228–236. [Google Scholar] [CrossRef]
  14. Pastore, A.I.; Barabás, G.; Bimler, M.D.; Mayfield, M.M.; Miller, T.E. The evolution of niche overlap and competitive differences. Nat. Ecol. Evol. 2021, 5, 330–337. [Google Scholar] [CrossRef] [PubMed]
  15. Steinmetz, R.; Seuaturien, N.; Intanajitjuy, P.; Inrueang, P.; Prempree, K. The effects of prey depletion on dietary niches of sympatric apex predators in Southeast Asia. Integr. Zool. 2021, 16, 19–32. [Google Scholar] [CrossRef]
  16. Barros, A.L.; Raposo, D.; Almeida, J.D.; Jesus, H.; Oliveira, M.A.; Fernandes, C.R.; Mackenzie, D.I.; Santos-Reis, M. An integrated assessment of niche partitioning reveals mechanisms of coexistence between mesocarnivores. Glob. Ecol. Conserv. 2024, 54, e03116. [Google Scholar] [CrossRef]
  17. Akrim, F.; Mahmood, T.; Max, T.; Nadeem, M.S.; Qasim, S.; Andleeb, S. Assessment of bias in morphological identification of carnivore scats confirmed with molecular scatology in north-eastern Himalayan region of Pakistan. PeerJ 2018, 6, e5262. [Google Scholar] [CrossRef]
  18. Kamler, J.F.; Stenkewitz, Z.; Klare, U.; Jacobsen, N.F.; Macdonald, D.W. Resource partitioning among cape foxes, bat-eared foxes, and black-backed jackals in South Africa. J. Wildl. Manag. 2002, 76, 1241–1253. [Google Scholar] [CrossRef]
  19. Torretta, E.; Riboldi, L.; Costa, E.; Delfoco, C.; Frignani, E.; Meriggi, A. Niche partitioning between sympatric wild canids: The case of the golden jackal (Canis aureus) and the red fox (Vulpes vulpes) in north-eastern Italy. BMC Ecol. Evol. 2021, 21, 129. [Google Scholar] [CrossRef]
  20. Pompanon, F.; Deagle, B.E.; Symondson, W.O.C.; Brown, D.S.; Jarman, S.N.; Taberlet, P. Who is eating what: Diet assessment using next generation sequencing. Mol. Ecol. 2012, 21, 1931–1950. [Google Scholar] [CrossRef]
  21. Kress, W.J.; García-Robledo, C.; Uriarte, M.; Erickson, D.L. DNA barcodes for ecology, evolution, and conservation. Trends Ecol. Evol. 2015, 30, 25–35. [Google Scholar] [CrossRef]
  22. Porazinska, D.L.; Giblin-Davis, R.M.; Esquivel, A.; Powers, T.O.; Sung, W.; Thomas, W.K. Ecometagenetics confirm high tropical rainforest nematode diversity. Mol. Ecol. 2010, 19, 5521–5530. [Google Scholar] [CrossRef] [PubMed]
  23. Hajibabaei, M.; Shokralla, S.; Zhou, X.; Singer, G.A.C.; Baird, D.J.; Voolstra, C.R. Environmental barcoding: A next-generation sequencing approach for biomonitoring applications using river benthos. PLoS ONE 2011, 6, e17497. [Google Scholar] [CrossRef] [PubMed]
  24. Lu, Q.; Cheng, C.; Xiao, L.Y.; Li, J.; Li, X.Y.; Zhao, X.; Lu, Z.; Zhao, J.D.; Yao, M. Food webs reveal coexistence mechanisms and community organization in carnivores. Curr. Biol. 2023, 33, 647–659. [Google Scholar] [CrossRef] [PubMed]
  25. Hacker, C.E.; Jevit, M.; Hussain, S.; Muhammad, G.; Munkhtsog, B.; Munkhtsog, B.; Zhang, Y.G.; Li, D.Q.; Liu, Y.L.; Farrington, J.D.; et al. Regional comparison of snow leopard (Panthera uncia) diet using DNA Metabarcoding. Biodivers. Conserv. 2021, 30, 797–817. [Google Scholar] [CrossRef]
  26. Wang, D.; Sai, Q.G.W.; Wang, Z.H.; Zhao, H.X.; Lian, X.M. Spatiotemporal overlap among sympatric Pallas’s cat (Otocolobus manul), Tibetan fox (Vulpes ferrilata) and red fox (V. vulpes) in the source region of the Yangtze River. Biodiv Sci. 2022, 30, 21365. [Google Scholar] [CrossRef]
  27. Schoener, T.W. Resource partitioning in ecological communities. Science 1974, 185, 27–39. [Google Scholar] [CrossRef]
  28. Peng, X.B.; Tang, R.M.; Li, J.J.; Tang, H.C.; Guo, Z.X. Spatiotemporal dynamics of landscape pattern and vegetation ecological quality in Sanjiangyuan National Park. Sustainability 2025, 17, 373. [Google Scholar] [CrossRef]
  29. Fu, M.D.; Tian, J.L.; Ren, Y.H.; Li, J.S.; Zhu, Y.P. Functional zoning and space management of Three-River-Source National Park. J. Geogr. Sci. 2019, 29, 2069–2084. [Google Scholar] [CrossRef]
  30. Jiang, F.; Zhang, J.J.; Song, P.F.; Qin, W.; Wang, H.J.; Cai, Z.Y.; Gao, H.M.; Liu, D.X.; Li, B.; Zhang, T.Z. Identifying priority reserves favors the sustainable development of wild ungulates and the construction of Sanjiangyuan National Park. Ecol. Evol. 2022, 12, e9464. [Google Scholar] [CrossRef]
  31. Cao, W.; Huang, L.; Liu, L.L. Spatial and temporal variations and significance identification of ecosystem services in the Sanjiangyuan National Park, China. Sci. Rep. 2020, 10, 6151. [Google Scholar] [CrossRef] [PubMed]
  32. Riaz, T.; Shehzad, W.; Viari, A.; Pompanon, F.; Taberlet, P.; Coissac, É. ecoPrimers: Inference of new DNA barcode markers from whole genome sequence analysis. Nucleic Acids Res. 2011, 39, e145. [Google Scholar] [CrossRef] [PubMed]
  33. Hurlbert, S.H. The measurement of niche overlap and some relatives. Ecology 1978, 59, 67–77. [Google Scholar] [CrossRef]
  34. Pianka, E.R. The structure of lizard communities. Annu. Rev. Ecol. S 1973, 4, 53–74. [Google Scholar] [CrossRef]
  35. Peng, B.Q.; Tao, L.; Li, J.; Fan, R.H.; Chen, S.D.; Fu, C.K.; Wang, Q.; Tang, K.Y. DNA metabarcoding dietary analysis of six sympatric small mammals at the Lanjunshan National Nature Reserve, Sichuan Province. Biodiv Sci. 2023, 31, 22474. [Google Scholar] [CrossRef]
  36. Duffy, J.E.; Cardinale, B.J.; France, K.E.; Mcintyre, P.B.; Thébault, E.; Loreau, M. The functional role of biodiversity in ecosystems: Incorporating trophic complexity. Ecol. Lett. 2007, 10, 522–538. [Google Scholar] [CrossRef]
  37. Sheppard, S.K.; Harwood, J.D. Advances in molecular ecology: Tracking trophic links through predator–prey food-webs. Funct. Ecol. 2005, 19, 751–762. [Google Scholar] [CrossRef]
  38. Severud, W.J.; Windels, S.K.; Belant, J.L.; Bruggink, J.G. The role of forage availability on diet choice and body condition in American beavers (Castor canadensis). Mamm. Biol. 2013, 78, 87–93. [Google Scholar] [CrossRef]
  39. Xiong, M.Y.; Shao, X.N.; Long, Y.; Bu, H.L.; Zhang, D.; Wang, D.J.; Li, S.; Wang, R.J.; Yao, M. Molecular analysis of vertebrates and plants in scats of leopard cats (Prionailurus bengalensis) in southwest China. J. Mammal. 2016, 97, 1054–1064. [Google Scholar] [CrossRef]
  40. Shao, X.N.; Lu, Q.; Xiong, M.Y.; Bu, H.L.; Shi, X.Y.; Wang, D.J.; Zhao, J.D.; Li, S.; Yao, M. Prey partitioning and livestock consumption in the world’s richest large carnivore assemblage. Curr. Biol. 2021, 31, 4887–4897. [Google Scholar] [CrossRef]
  41. Dou, H.L.; Yang, H.T.; Smith, J.L.D.; Feng, L.M.; Wang, T.M.; Ge, J.P. Prey selection of Amur tigers in relation to the spatiotemporal overlap with prey across the Sino-Russian border. Wildl. Biol. 2019, 2019, 1–11. [Google Scholar] [CrossRef]
  42. Choi, M.B.; Woo, D.; Choi, T.Y. Composition of the insect diet in feces of yellow-throated marten, Martes flavigula, in Jirisan National Park, South Korea. J. Ecol. Environ. 2015, 38, 389–395. [Google Scholar] [CrossRef]
  43. Elmeros, M.; Mikkelsen, D.M.G.; Nrgaard, L.S.; Pertoldi, C.; Chriél, M. The diet of feral raccoon dog (Nyctereutes procyonoides) and native badger (Meles meles) and red fox (Vulpes vulpes) in Denmark. Mammal. Res. 2018, 63, 1–9. [Google Scholar] [CrossRef]
  44. Ma, Y.; Sun, Z.H.; Liu, Z.S.; Teng, L.W. Food habits by red fox (Vulpes vulpes), a review. J. Econ. Animal. 2014, 18, 53–58. [Google Scholar]
  45. Cong, W.; Li, J.; Hacker, C.E.; Li, Y.; Zhang, Y.; Jin, L.X.; Zhang, Y.; Li, D.Q.; Xue, Y.D.; Zhang, Y.G. Different coexistence patterns between apex carnivores and mesocarnivores based on temporal, spatial, and dietary niche partitioning analysis in Qilian Mountain National Park, China. eLife 2024, 13, RP90559. [Google Scholar] [CrossRef]
  46. Zhong, H.; Li, F.J.; Díaz-Sacco, J.J.; Shi, K. Dietary and temporal partitioning facilitates coexistence of sympatric carnivores in the Everest region. Ecol. Evol. 2022, 12, e9531. [Google Scholar] [CrossRef]
  47. Vipin, V.; Golla, T.R.; Sharma, V.; Kumar, B.K.; Gaur, A. Kleptoparasitic interaction between Snow Leopard Panthera uncia and Red Fox Vulpes vulpes suggested by circumstantial evidence in Pin Valley National Park, India. J. Threat. Taxa. 2022, 14, 21928–21935. [Google Scholar] [CrossRef]
  48. Palomarest, F.; Caro, T.M. Interspecific killing among mammalian carnivores. Am. Nat. 1999, 153, 492–508. [Google Scholar] [CrossRef]
  49. Paquet, P.C. Prey use strategies of sympatric wolves and coyotes in Riding Mountain National Park, Manitoba. J. Mammal. 1992, 73, 337–343. [Google Scholar] [CrossRef]
  50. Clark, H.O. Hypothetical relationships between the San Joaquin kit fox, California grizzly bear, and gray wolf on the pre-European California landscape. Endang Species Update 2007, 24, 14–20. [Google Scholar]
  51. Cai, Z.Y.; Qin, W.; Gao, H.M.; Wu, T.; Chi, X.W.; Yang, J.D.; Miao, Z.Y.; Zhang, J.J.; Song, P.F.; Lian, X.M.; et al. Species diversity and fauna of mammals in Sanjiangyuan National Park. Acta Theriol. Sinica. 2019, 39, 410–420. [Google Scholar]
  52. Li, Z.L.; Duo, L.A.; Li, S.; Wang, T.M. Competition and coexistence among terrestrial mammalian carnivores. Biodiv Sci. 2021, 29, 81–97. [Google Scholar]
  53. du Preez, B.; Purdon, J.; Trethowan, P.; Macdonald, D.W.; Loveridge, A.J. Dietary niche differentiation facilitates coexistence of two large carnivores. J. Zool. 2017, 302, 149–156. [Google Scholar] [CrossRef]
  54. Wang, X.; Schaller, G.B.; Zhen, S. Status and conservation of the plateau pika (Ochotona curzoniae) on the Qinghai-Tibetan Plateau. Mammal. Res. 2019, 64, 283–293. [Google Scholar]
  55. Liu, W.; Wang, X. Population density and spatial distribution of plateau pikas (Ochotona curzoniae) in the Qinghai-Tibetan Plateau. Acta Theriol. Sin. 2003, 21, 15–20. [Google Scholar]
Figure 1. Locations of carnivore feces collected in Sanjiangyuan National Park.
Animals 15 01267 g001
Figure 2. The dietary composition and corresponding relative abundance of prey for Pallas’s cats in the Sanjiangyuan National Park.
Animals 15 01267 g002
Figure 3. A Sankey diagram at the species level depicting the dietary composition of Pallas’s cats in the Sanjiangyuan National Park. On the left, color blocks represent the relative abundance of prey items classified at the species level, while on the right, color blocks denote the number of fecal samples collected from Pallas’s cats, with block sizes proportional to sample quantities. Numeric values in parentheses specify the quantities of fecal samples from Pallas’s cats.
Animals 15 01267 g003
Figure 4. The dietary composition and corresponding relative abundance of prey for red foxes in the Sanjiangyuan National Park.
Animals 15 01267 g004
Figure 5. A Sankey diagram at the species level depicting the dietary composition of red foxes in the Sanjiangyuan National Park.
Animals 15 01267 g005
Figure 6. The proportions of mammals, birds, and livestock in the dietary composition of Pallas’s cat (a) and red fox (b) in Sanjiangyuan National Park.
Animals 15 01267 g006
Table 1. Amplification primer information sheet.
Primer PairSequencesTarget Region
F_12SV55′-TAGAACAGGCTCCTCTAG-3′12S
R_12SV55′-TTAGATACCCCACTATGC-3′
Disclaimer/Publisher’s Note: The statements, opinions and data contained in all publications are solely those of the individual author(s) and contributor(s) and not of MDPI and/or the editor(s). MDPI and/or the editor(s) disclaim responsibility for any injury to people or property resulting from any ideas, methods, instructions or products referred to in the content.

