
Genetic Parameter Estimation of Body Weight and VpAHPND Resistance in Two Strains of Penaeus vannamei

 , ,
, ,
Simple Summary
Abstract
1. Introduction
2. Materials and Methods
2.1. Data Collection
2.1.1. Experimental Shrimp
2.1.2. Body Weight and VpAHPND Resistance Test
2.2. Genotyping
2.3. Data Analysis
2.3.1. Construction of the Relationship Matrix
2.3.2. Estimation of Genetic Parameters
2.3.3. Genetic Correlation
2.3.4. Z-Test
2.3.5. Cross-Validation
3. Results
3.1. Cumulative Mortality
3.2. Descriptive Statistics
3.3. Molecular Genetic Correlation Analysis
3.4. Heritability Estimation
3.5. Genetic Correlations
3.6. Predictive Accuracy and Bias Analysis
4. Discussion
4.1. Genetic Heritability of Body Weight and Predictive Accuracy
4.2. Genetic Heritability of VpAHPND Resistance and Predictive Accuracy
4.3. Correlation Analysis Between Body Weight and VpAHPND Resistance
5. Conclusions
Author Contributions
Funding
Institutional Review Board Statement
Informed Consent Statement
Data Availability Statement
Conflicts of Interest
References
- FAO FishStat Database. 2024. Available online: https://www.fao.org/fishery/statistics-query/en/global_production/global_production_quantity (accessed on 26 March 2024).
- Zhang, W.Q. Biological introduction of the world’s important aquaculture species—White leg Shrimp in South America. Mar. Sci. 1990, 3, 69–73. [Google Scholar]
- MOA (Ministry of Agriculture and Rural of the People’s Republic of China). China Fishery Statistical Yearbook; Department of Fishery of the Ministry of Agriculture and Rural, China Agricultural Press: Beijing, China, 2024. [Google Scholar]
- Kumar, V.; Roy, S.; Behera, B.K. Acute Hepatopancreatic Necrosis Disease (AHPND): Virulence, Pathogenesis and Mitigation Strategies in Shrimp Aquaculture. Toxins 2021, 13, 524. [Google Scholar] [CrossRef] [PubMed]
- Lee, C.T.; Chen, I.T.; Yang, Y.T. The opportunistic marine pathogen Vibrio parahaemolyticus becomes virulent by acquiring a plasmid that expresses a deadly toxin. Proc. Natl. Acad. Sci. USA 2015, 112, 10798–10803. [Google Scholar] [CrossRef] [PubMed]
- Tran, L.; Nunan, L.; Redman, R.M. Determination of the infectious nature of the agent of acute hepatopancreatic necrosis syndrome affecting penaeid shrimp. Dis. Aquat. Org. 2013, 105, 45–55. [Google Scholar] [CrossRef] [PubMed]
- Kongrueng, J.; Yingkajorn, M.; Bunpa, S. Characterization of Vibrio parahaemolyticus causing acute hepatopancreatic necrosis disease in southern Thailand. J. Fish Dis. 2015, 38, 957–966. [Google Scholar] [CrossRef]
- Navaneeth, K.A.; Bhuvaneswari, T.; Rajan, J.J.S. Characterization of Vibrio parahaemolyticus isolates from shrimp farms of Southeast coast of India with special reference to acute hepatopancreatic necrosis disease (AHPND) status. Aquaculture 2020, 518, 734813. [Google Scholar] [CrossRef]
- Tang, K.F.; Bondad Reantaso, M.G.; Arthur, J.R. Shrimp Acute Hepatopancreatic Necrosis Disease Strategy Manual. FAO Fisheries and Aquaculture Circular; No. 1190; Rome, Italy, 2020. [Google Scholar]
- Cock, J.; Gitterle, T.; Salazar, M. Breeding for disease resistance of Penaeid shrimps. Aquaculture 2009, 286, 1–11. [Google Scholar] [CrossRef]
- Moss, S.M.; Moss, D.R.; Arce, S.M. The role of selective breeding and biosecurity in the prevention of disease in penaeid shrimp aquaculture. J. Invertebr. Pathol. 2012, 110, 247–250. [Google Scholar] [CrossRef] [PubMed]
- Nielsen, H.M.; Sonesson, A.K.; Yazdi, H. Comparison of accuracy of genome-wide and BLUP breeding value estimates in sib based aquaculture breeding schemes. Aquaculture 2009, 289, 259–264. [Google Scholar] [CrossRef]
- Nirea, K.G.; Sonesson, A.K.; Woolliams, J.A. Strategies for implementing genomic selection in family-based aquaculture breeding schemes: Double haploid sib test populations. Genet. Sel. Evol. 2012, 44, 30. [Google Scholar] [CrossRef]
- Hayes, B.J.; Bowman, P.J.; Chamberlain, A.J.; Goddard, M.E. Invited review: Genomic selection in dairy cattle: Progress and challenges. J. Dairy Sci. 2009, 92, 433–443. [Google Scholar] [CrossRef] [PubMed]
- Legarra, A.; Christensen, O.F.; Aguilar, I. Single step, a general approach for genomic selection. Livest. Sci. 2014, 166, 54–65. [Google Scholar] [CrossRef]
- Aguilar, I.; Misztal, I.; Johnson, D.L. Hot topic: A unified approach to utilize phenotypic, full pedigree, and genomic information for genetic evaluation of Holstein final score. J. Dairy Sci. 2010, 93, 743–752. [Google Scholar] [CrossRef] [PubMed]
- Misztal, I.; Legarra, A.; Aguilar, I. Computing procedures for genetic evaluation including phenotypic, full pedigree, and genomic information. J. Dairy Sci. 2009, 92, 4648–4655. [Google Scholar] [CrossRef] [PubMed]
- Yoshida, G.M.; Carvalheiro, R.; Rodríguez, F.H. Single-step genomic evaluation improves accuracy of breeding value predictions for resistance to infectious pancreatic necrosis virus in rainbow trout. Genomics 2019, 111, 127–132. [Google Scholar] [CrossRef]
- Liu, J.; Yang, G.; Kong, J. Using single-step genomic best linear unbiased prediction to improve the efficiency of genetic evaluation on body weight in Macrobrachium rosenbergii. Aquaculture 2020, 528, 735577. [Google Scholar] [CrossRef]
- Sae-Lim, P.; Kause, A.; Lillehammer, M. Estimation of breeding values for uniformity of growth in Atlantic salmon (Salmo salar) using pedigree relationships or single-step genomic evaluation. Genet. Sel. Evol. 2017, 49, 33. [Google Scholar] [CrossRef]
- Fu, Q.; Sun, K.; Sui, J. Comparisons and genetic assessments of WSSV resistance and growth in strain cross of Litopenaeus vannamei. Aquac. Rep. 2023, 30, 101572. [Google Scholar] [CrossRef]
- Tan, J.; Luan, S.; Cao, B.X. Evaluation of genetic parameters for reproductive traits and growth rate in the Pacific white shrimp Litopenaeus vannamei reared in brackish water. Aquaculture 2019, 511, 734244. [Google Scholar] [CrossRef]
- Available online: https://kns.cnki.net/kcms2/article/abstract?v=EKYfHJ8l29gheTwCWoNdLMhOnnqHilPRrNk-uV_jy0YAXNizeoV2hIz09_OsN2-aQkAQKYi3UOyK6MvsDV6JITxfOy50R8oTT9BvLLhCJzp7YVMquoKGQ5dQkJjXeOYCIp9he5mdWHPf0cvzyeyieSyuVnvxAjjESjvG5kb_mY8TJw4KGoZ6UADzqYKcaPeK&uniplatform=NZKPT (accessed on 26 April 2025).
- FAO FishStat Database. 2024. Available online: https://kns.cnki.net/kcms2/article/abstract?v=EKYfHJ8l29j3OUMvsXJGNExUIvi9J5XXywor_quRN1KuSVJWl4RSeWNW-jGLkb6iXlo7tyYa5fHYVKe8YRI9ddFPwwT8R7TETQpB_zHCar64lEQ7ZXBVSwqklfRC1w42Uy9s4ARlIVW-ponQslHPgSQ9rumR8QSym81R0JiygN6HlHwIQYL7mg==&uniplatform=NZKPT&language=CHS (accessed on 26 April 2025).
- Butler, D.; Cullis, B.; Gilmour, A.; Gogel, B.; Thompson, R. ASReml-R Reference Manual Version 4.1. 0.130. VSN International Ltd. 2020. Available online: https://asreml.kb.vsni.co.uk (accessed on 1 September 2020).
- Misztal, I.S.; Tsuruta, D.A.L. Lourenco Manual for BLUPF90 Family of Programs; University of Georgia: Athens, GA, USA, 2014. [Google Scholar]
- Lu, X.; Luan, S.; Cao, B.X. Estimation of genetic parameters and genotype-by-environment interactions related to acute ammonia stress in Pacific white shrimp (Litopenaeus vannamei) juveniles at two different salinity levels. PLoS ONE 2017, 12, e0173835. [Google Scholar] [CrossRef]
- Liu, M.Y.; Li, X.P.; Kong, J. Application of the liquid chip “Yellow Sea Chip No. 1” in genetic evaluation of the base population with resistance to acute hepatopancreatic necrosis disease in Litopenaeus vannamei. J. Fish. China 2023, 47, 217–226. [Google Scholar]
- Hernández-Ruíz, H.; Montaldo, H.H.; Bustos-Martínez, J. Heritability and genetic correlations for infectious hypodermal and hematopoietic necrosis virus load, body weight at harvest, and survival rate in Pacific white shrimp (Litopenaeus vannamei). J. World Aquac. Soc. 2020, 51, 312–323. [Google Scholar] [CrossRef]
- Sun, K.; Li, X.P.; Sui, J. Evaluation of genetic parameters of body length, body weight and WSSV resistance of Litopenaeus vannamei based on microsatellite markers. J. Fish. China 2022, 46, 583–593. [Google Scholar]
- Chen, M.J.; Kong, J.; Tan, J. Unknown parental group effects on harvest body weight in the base population of Litopenaeus vannamei. J. Fish. Sci. China 2021, 28, 863–870. [Google Scholar]
- Luan, S.; Luo, K.; Chai, Z. An analysis of indirect genetic effects on adult body weight of the Pacific white shrimp Litopenaeus vannamei at low rearing density. Genet. Sel. Evol. 2015, 47, 95. [Google Scholar] [CrossRef]
- Trang, T.T.; Hung, N.H.; Ninh, N.H. Selection for improved white spot syndrome virus resistance increased larval survival and growth rate of Pacific Whiteleg shrimp, Liptopenaeus vannamei. J. Invertebr. Pathol. 2019, 166, 107219. [Google Scholar] [CrossRef]
- Sui, J.; Sun, K.; Kong, J. Estimation of genetic parameters for growth and wssv resistance traits in Litopenaeus vannamei. Animals 2024, 14, 1817. [Google Scholar] [CrossRef]
- Benzie, J.; Kenway, M.; Trott, L. Estimates for the heritability of size in juvenile Penaeus monodon prawns from half-sib matings. Aquaculture 1997, 152, 49–53. [Google Scholar] [CrossRef]
- Dai, P.; Zheng, J.; Luan, S. Estimates of heritability and genetic correlation for growth traits at harvest in redclaw crayfish, Cherax quadricarinatus. Aquaculture 2022, 561, 738631. [Google Scholar] [CrossRef]
- Nguyen, N.H.; Khaw, H.L.; Ponzoni, R.W. Can sexual dimorphism and body shape be altered in Nile tilapia (Oreochromis niloticus) by genetic means. Aquaculture 2007, 272, S38–S46. [Google Scholar] [CrossRef]
- Rye, M.-A.; Mao, I. Nonadditive genetic effects and inbreeding depression for body weight in Atlantic salmon (Salmo salar L.). Livest. Prod. Sci. 1998, 57, 15–22. [Google Scholar] [CrossRef]
- Pante, M.J.R.; Gjerde, B.; Mcmillan, I. Estimation of additive and dominance genetic variances for body weight at harvest in rainbow trout, Oncorhynchus mykiss. Aquaculture 2002, 204, 383–392. [Google Scholar] [CrossRef]
- Thodesen, J.; Rye, M.; Wang, Y.X. Genetic improvement of tilapias in China: Genetic parameters and selection responses in growth of Nile tilapia (Oreochromis niloticus) after six generations of multi-trait selection for growth and fillet yield. Aquaculture 2011, 322, 51–64. [Google Scholar] [CrossRef]
- Rutten, M.J.; Komen, H.; Bovenhuis, H. Longitudinal genetic analysis of Nile tilapia (Oreochromis niloticus L.) body weight using a random regression model. Aquaculture 2005, 246, 101–113. [Google Scholar] [CrossRef]
- Wang, J.; Bai, Y.; Zou, X.; Li, C.; Yang, J.; Ke, Q. First Genomic Prediction of Single-Step Models in Large Yellow Croaker. Mar. Biotechnol. 2023, 25, 603–611. [Google Scholar] [CrossRef]
- Dai, P.; Luan, S.; Lu, X.; Luo, K.; Cao, B.; Meng, X. Genetic evaluation of feed efficiency in the breeding population of Fenneropenaeus chinensis “Huanghai No. 2” using phenotypic, pedigree and genomic information. Aquac. Int. 2017, 25, 2189–2200. [Google Scholar] [CrossRef]
- Liu, M.; Li, X.; Kong, J.; Meng, X.; Luo, K.; Sui, J. Genomic selection of resistance to acute hepatopancreatic necrosis disease in Litopenaeus vannamei. Aquaculture 2025, 596, 741828. [Google Scholar] [CrossRef]
- Garcia, A.L.; Bosworth, B.; Waldbieser, G.; Misztal, I.; Tsuruta, S.; Lourenco, D.-A. Development of genomic predictions for harvest and carcass weight in channel catfish. Genet. Sel. Evol. 2018, 50, 66. [Google Scholar] [CrossRef]
- Van Grevenhof, E.M.; Van Arendonk, J.A.; Bijma, P. Response to genomic selection: The Bulmer effect and the potential of genomic selection when the number of phenotypic records is limiting. Genet. Sel. Evol. 2012, 44, 26. [Google Scholar] [CrossRef]
- Boligon, A.A.; Long, N.; Albuquerque, L.G.D.; Weigel, K.A.; Gianola, D.; Rosa, G.J.M. Comparison of selective genotyping strategies for prediction of breeding values in a population undergoing selection. J. Anim. Sci. 2012, 90, 4716–4722. [Google Scholar] [CrossRef]
- Dai, P.; Kong, J.; Liu, J. Evaluation of the utility of genomic information to improve genetic evaluation of feed efficiency traits of the Pacific white shrimp Litopenaeus vannamei. Aquaculture 2020, 527, 735421. [Google Scholar] [CrossRef]
- Vallejo, R.-L.; Leeds, T.D.; Gao, G. Genomic selection models double the accuracy of predicted breeding values for bacterial cold water disease resistance compared to a traditional pedigree-based model in rainbow trout aquaculture. Genet. Sel. Evol. 2017, 49, 17. [Google Scholar] [CrossRef] [PubMed]
- Yang, J.; Benyamin, B.; Mcevoy, B.P. Common SNPs explain a large proportion of the heritability for human height. Nat. Genet. 2010, 42, 565–569. [Google Scholar] [CrossRef] [PubMed]
- Muir, W.M. Comparison of genomic and traditional BLUP-estimated breeding value accuracy and selection response under alternative trait and genomic parameters. J. Anim. Breed. Genet. 2007, 124, 342–355. [Google Scholar] [CrossRef]
- Kudinov, A.A.; Nousiainen, A.; Koskinen, H. Single-step genomic prediction for body weight and maturity age in Finnish rainbow trout (Oncorhynchus mykiss). Aquaculture 2024, 585, 740677. [Google Scholar] [CrossRef]
- Legarra, A.; Reverter, A. Semi-parametric estimates of population accuracy and bias of predictions of breeding values and future phenotypes using the LR method. Genet. Sel. Evol. 2018, 50, 53. [Google Scholar] [CrossRef]
- Vallejo, R.L.; Pietrak, M.R.; Milligan, M.M. Genetic architecture and accuracy of predicted genomic breeding values for sea lice resistance in the St John River aquaculture strain of North American Atlantic salmon. Aquaculture 2024, 586, 740819. [Google Scholar] [CrossRef]
- Onogi, A.; Ogino, A.; Komatsu, T.; Simizu, K.; Kurogi, K.; Yasumori, T.; Togashi, K.; Iwata, H. Genomic prediction in Japanese Black cattle: Application of a single-step approach to beef cattle. J. Anim. Sci. 2014, 92, 1931–1938. [Google Scholar] [CrossRef]
- Wang, Q.; Yu, Y.; Zhang, Q. Evaluation on the genomic selection in Litopenaeus vannamei for the resistance against Vibrio parahaemolyticus. Aquaculture 2019, 505, 212–216. [Google Scholar] [CrossRef]
- Lyu, D.; Yu, Y.; Zhang, Q. Estimating genetic parameters for resistance to Vibrio parahaemolyticus with molecular markers in Pacific white shrimp. Aquaculture 2020, 527, 735439. [Google Scholar] [CrossRef]
- Liu, Y.; Luan, S.; Liu, M.Y. Genomic prediction accuracy analysis of AHPND resistance genome prediction in Litopenaeus vannamei using SNP panels with different densities. J. Fish. China 2023, 47, 165–174. [Google Scholar]
- Huang, G.X.; Li, X.P.; Tian, J.T. Estimation of genetic parameters for growth and acute hepatopancreatic necrosis resistance in different strains of Litopenaeus vannamei. Prog. Fish. Sci. 2024, 45, 133–143. [Google Scholar]
- Campos-Montes, G.R.; Caballero-Zamora, A.; Montaldo, H.H. Genetic (co)variation in resistance of Pacific white shrimp Litopenaeus vannamei to acute hepatopancreatic necrosis disease (AHPND) and white spot syndrome virus (WSSV) in challenge tests. Aquaculture 2020, 520, 734994. [Google Scholar] [CrossRef]
- Coman, G.J.; Arnold, S.J.; Wood, A.T. Age: Age genetic correlations for weight of Penaeus monodon reared in broodstock tank systems. Aquaculture 2010, 307, 1–5. [Google Scholar] [CrossRef]
- Luan, S.; Luo, K.; Ruan, X.H. Genetic parameters and genotype by environment interaction for body weight and survival of pacific white shrimp Litopenaeus vannamei. Oceanol. Et Limnol. Sin. 2013, 44, 445–452. [Google Scholar]
- Argue, B.J.; Arce, S.M.; Lotz, J.M. Selective breeding of Pacific white shrimp (Litopenaeus vannamei) for growth and resistance to Taura Syndrome Virus. Aquaculture 2002, 204, 447–460. [Google Scholar] [CrossRef]
- Feng, Y.P. Estimation of Genetic Parameters for White Spot Syndrome Virus (WSSV) Resistance Traits in Litopenaeus vannmei and Comparison of Resistance to WSSV between Litopenaeus vannamei and Fenneropenaeus chinensis; Shanghai Ocean University: Shanghai, China, 2017. [Google Scholar]
- Li, Z.X.; Wang, W.J.; Hu, Y.L. Estimation of Genetic Parameters for Four-Month Old Turbot (Scophthalmus maximus) Resistance to Ammonium. Periodical Ocean. Univ. China 2018, 48, 48–54. [Google Scholar]

 SS50: the survival rate of each family when the mortality within the strain reached 50%; and
  60 SR: the survival rate of each family at 60 h.
SS50: the survival rate of each family when the mortality within the strain reached 50%; and 60 SR: the survival rate of each family at 60 h.
60 SR: the survival rate of each family at 60 h.
SS50: the survival rate of each family when the mortality within the strain reached 50%; and 60 SR: the survival rate of each family at 60 h.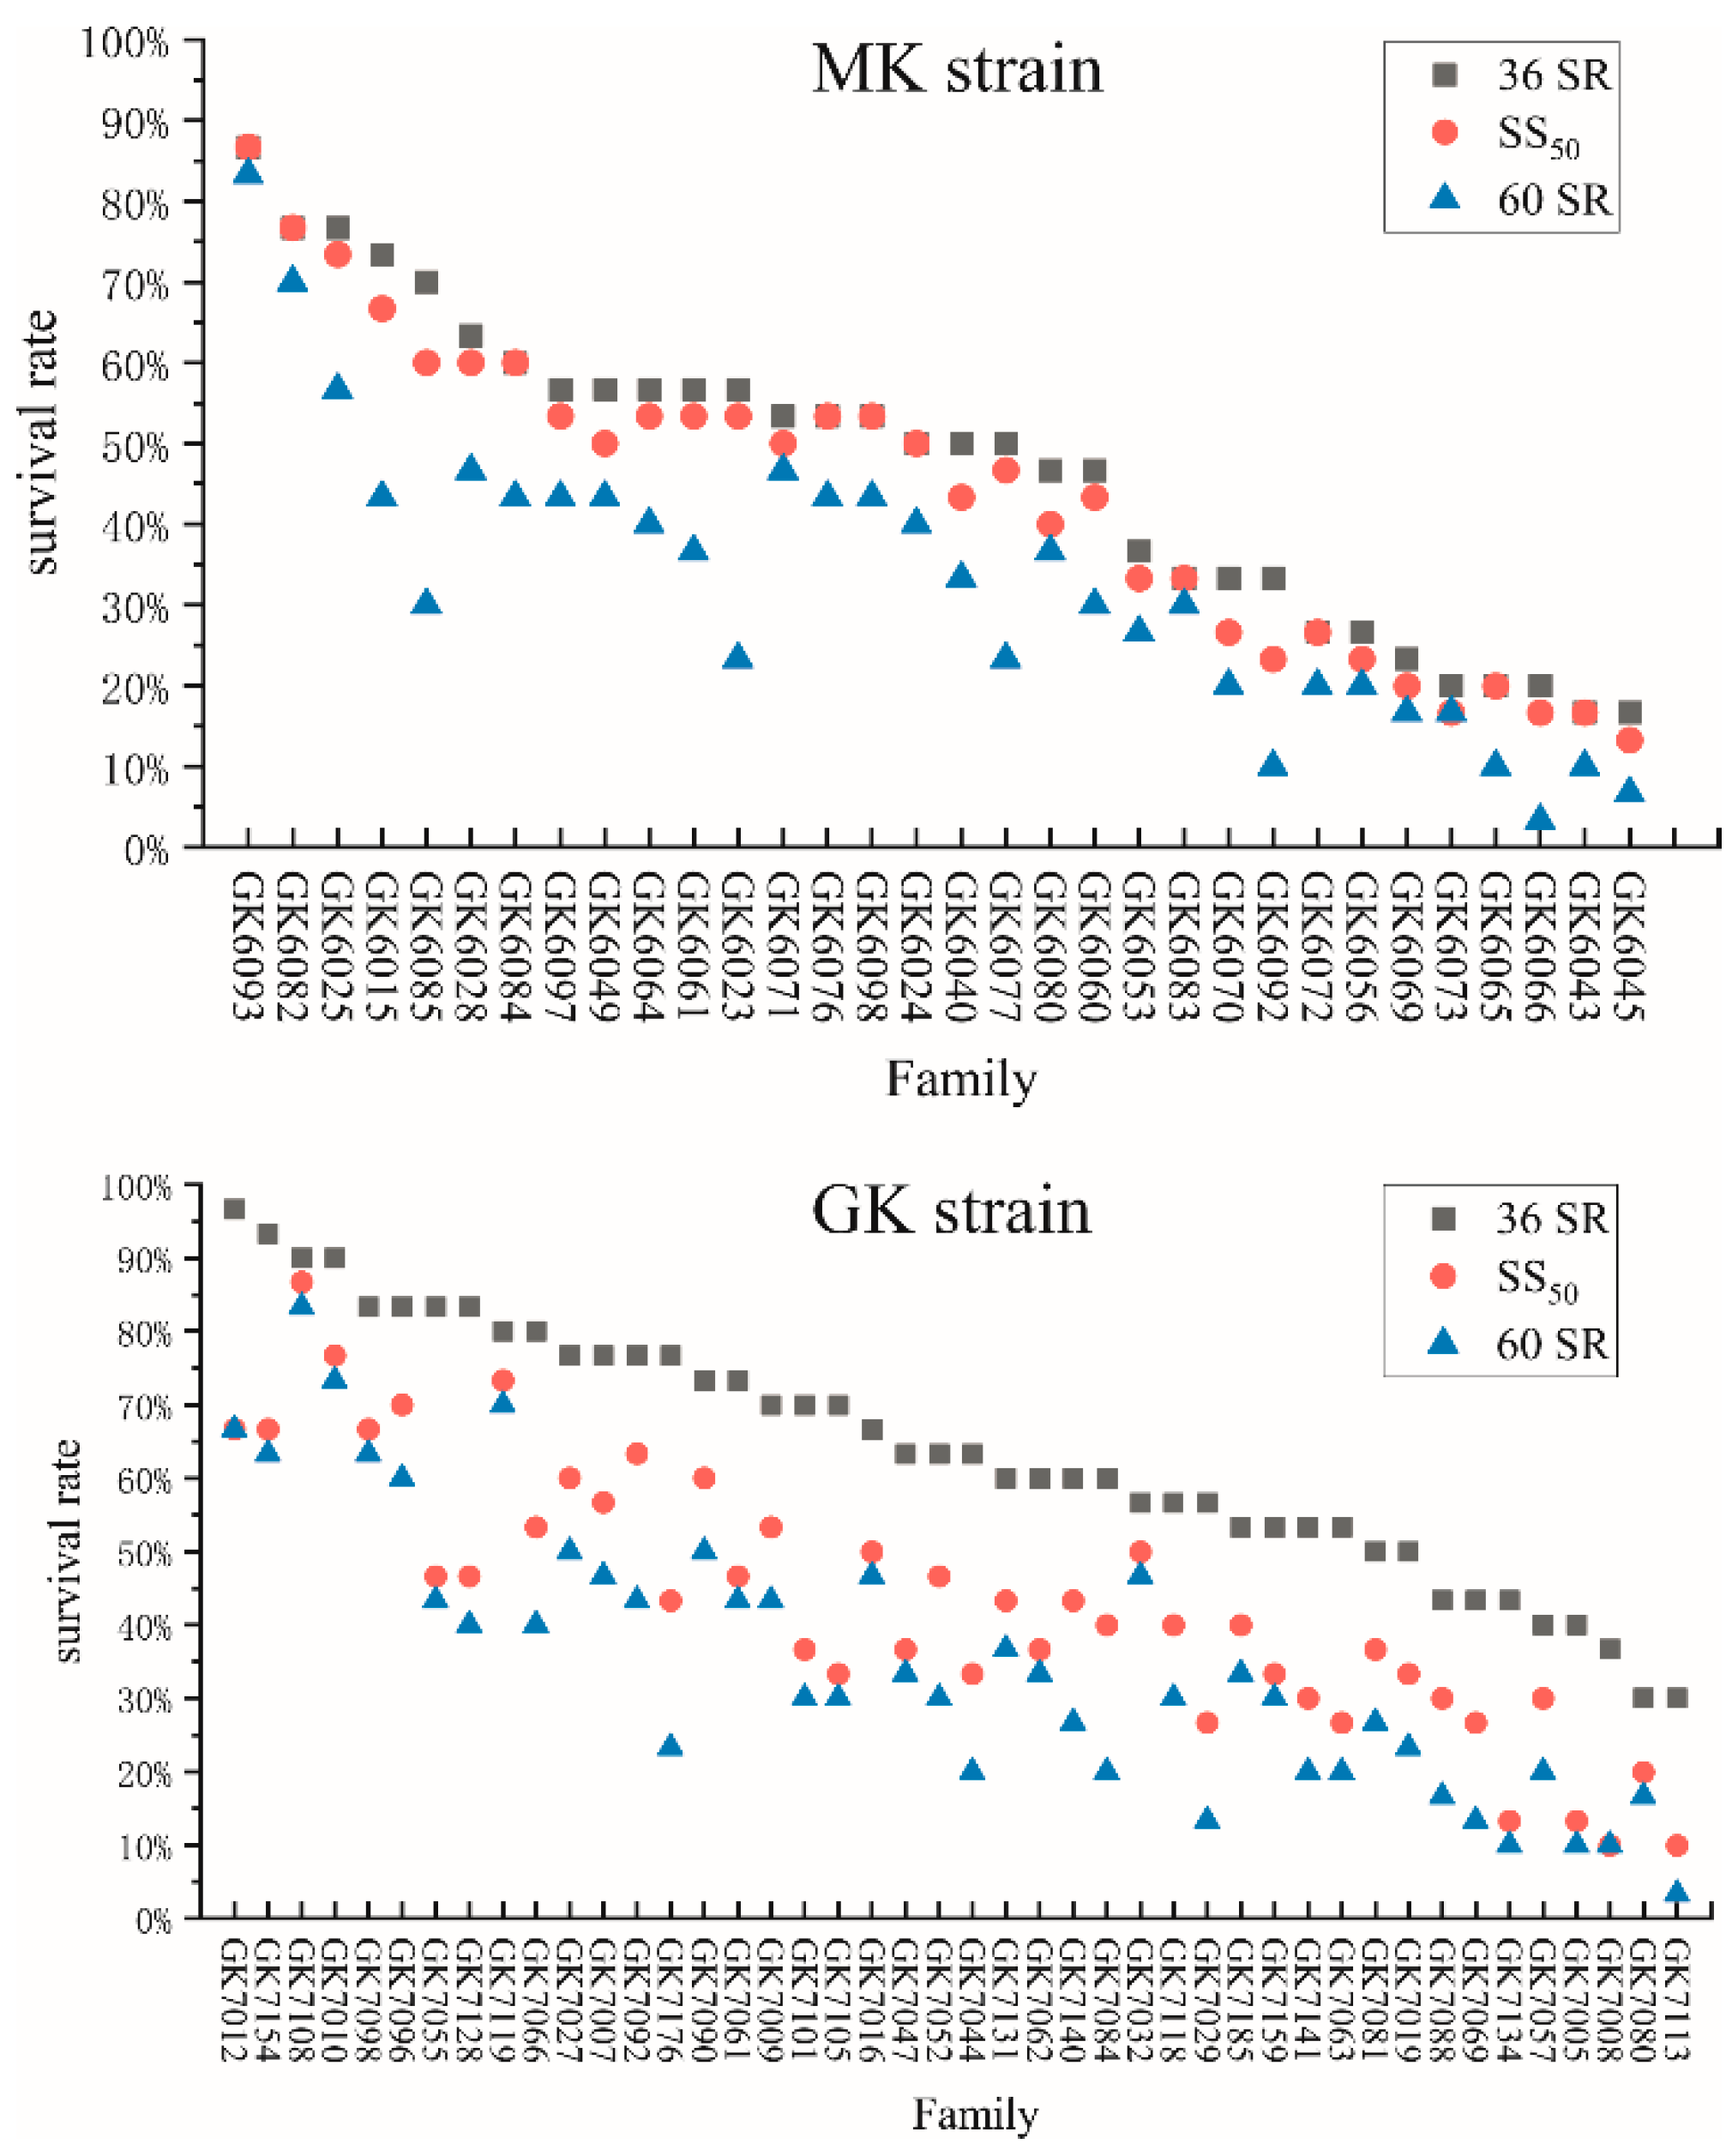


| Strain | Trait | Mean | Max | Min | SD | CV |
|---|---|---|---|---|---|---|
| MK | Bw | 2.10 g | 2.76 g | 1.17 g | 0.33 g | 15.58% |
| ST | 23.62 h | 35.36 h | 12.89 h | 6.14 h | 25.98% | |
| 36 SR | 43.65% | 86.67% | 13.33% | 19.12% | 43.80% | |
| SS50 | 46.88% | 86.67% | 16.67% | 19.11% | 40.77% | |
| 60 SR | 32.71% | 83.33% | 3.33% | 17.73% | 54.19% | |
| GK | Bw | 2.14 g | 2.95 g | 1.39 g | 0.45 g | 20.92% |
| ST | 31.64 h | 42.6 h | 19.44 h | 5.56 h | 17.58% | |
| 36 SR | 63.94% | 96.67% | 30.00% | 12.75% | 19.94% | |
| SS50 | 43.33% | 86.67% | 10.00% | 13.09% | 30.20% | |
| 60 SR | 35.30% | 83.33% | 3.33% | 12.05% | 34.13% |
| Strain | MK | GK | ||||
|---|---|---|---|---|---|---|
| Mortality Rate | 36 SR | SS50 | 60 SR | 36 SR | SS50 | 60 SR |
| 36 SR | 1 | - | - | 1 | - | - |
| SS50 | 0.977 a | 1 | - | 0.892 a | 1 | - |
| 60 SR | 0.884 a | 0.869 a | 1 | 0.853 a | 0.951 a | 1 |
| Method | Trait | MK | GK | ||||
|---|---|---|---|---|---|---|---|
| pBLUP | Bw | 0.443 | 0.035 | 0.439 ± 0.108 | 0.661 | 0.064 | 0.726 ± 0.119 |
| ST | 278.997 | 16.721 | 0.308 ± 0.079 | 342.742 | 20.352 | 0.372 ± 0.084 | |
| 36 SR | 1.284 | 0.089 | 0.443 ± 0.108 ab | 1.338 | 0.099 | 0.505 ± 0.111 ab | |
| SS50 | 1.277 | 0.087 | 0.433 ± 0.106 ab | 1.329 | 0.097 | 0.496 ± 0.109 ab | |
| 60 SR | 1.273 | 0.088 | 0.429 ± 0.108 a | 1.401 | 0.114 | 0.572 ± 0.116 b | |
| ssGBLUP | Bw | 0.448 | 0.037 | 0.458 ± 0.111 | 0.660 | 0.064 | 0.724 ± 0.119 |
| ST | 282.922 | 17.601 | 0.331 ± 0.083 | 342.392 | 20.269 | 0.370 ± 0.084 | |
| 36 SR | 1.249 | 0.102 | 0.487 ± 0.116 ab | 1.306 | 0.105 | 0.531 ± 0.115 ab | |
| SS50 | 1.251 | 0.101 | 0.489 ± 0.117 ab | 1.301 | 0.102 | 0.512 ± 0.113 ab | |
| 60 SR | 1.214 | 0.099 | 0.471 ± 0.116 a | 1.371 | 0.118 | 0.593 ± 0.119 b | |
| Method | Trait | MK | ||||
|---|---|---|---|---|---|---|
| Bw | ST | 36 SR | SS50 | 60 SR | ||
| pBLUP | Bw | - | 0.126 ± 0.055 b | 0.175 ± 0.074 b | 0.068 ± 0.077 a | 0.461 ± 0.101 |
| ST | 0.601 ± 0.155 | - | 0.966 ± 0.001 c | 0.976 ± 0.001 c | 0.982 ± 0.002 c | |
| 36 SR | 0.287 ± 0.125 b | 0.998 ± 0.000 c | - | 0.899 ± 0.007 | 0.870 ± 0.011 | |
| SS50 | 0.120 ± 0.139 a | 0.995 ± 0.001 c | 0.975 ± 0.012 c | - | 0.949 ± 0.013 c | |
| 60 SR | 0.503 ± 0.297 | 0.988 ± 0.002 c | 0.991 ± 0.006 c | 0.959 ± 0.011 c | - | |
| ssGBLUP | Bw | - | 0.179 ± 0.056 | 0.101 ± 0.122 a | 0.088 ± 0.120 a | 0.454 ± 0.267 a |
| ST | 0.622 ± 0.145 | - | 0.954 ± 0.007 c | 0.971 ± 0.003 c | 0.987 ± 0.000 c | |
| 36 SR | 0.169 ± 0.189 a | 0.955 ± 0.009 c | - | 0.886 ± 0.005 | 0.931 ± 0.008 c | |
| SS50 | 0.150 ± 0.187 a | 0.994 ± 0.002 c | 0.994 ± 0.004 c | - | 0.859 ± 0.005 | |
| 60 SR | 0.547 ± 1.011 a | 0.999 ± 0.000 c | 0.992 ± 0.003 c | 0.993 ± 0.004 c | - | |
| Method | Trait | GK | ||||
|---|---|---|---|---|---|---|
| Bw | ST | 36 SR | SS50 | 60 SR | ||
| pBLUP | Bw | - | 0.348 ± 0.050 | 0.359 ± 0.017 | 0.775 ± 0.063 | 0.789 ± 0.019 |
| ST | 0.742 ± 0.091 | - | 0.919 ± 0.003 c | 0.994 ± 0.001 c | 0.921 ± 0.006 c | |
| 36 SR | 0.426 ± 0.032 | 0.999 ± 0.000 c | - | 0.789 ± 0.008 | 0.745 ± 0.005 | |
| SS50 | 0.785 ± 0.064 | 0.997 ± 0.001 c | 0.979 ± 0.007 c | - | 0.781 ± 0.016 | |
| 60 SR | 0.886 ± 0.033 | 0.999 ± 0.001 c | 0.984 ± 0.007 c | 0.976 ± 0.052 c | - | |
| ssGBLUP | Bw | - | 0.347 ± 0.050 | 0.359 ± 0.017 | 0.792 ± 0.055 | 0.789 ± 0.017 |
| ST | 0.744 ± 0.091 | - | 0.784 ± 0.009 | 0.983 ± 0.002 c | 0.930 ± 0.007 c | |
| 36 SR | 0.427 ± 0.032 | 0.997 ± 0.003 c | - | 0.995 ± 0.009 c | 0.935 ± 0.016 c | |
| SS50 | 0.906 ± 0.032 c | 0.999 ± 0.001 c | 0.998 ± 0.002 c | - | 0.979 ± 0.001 c | |
| 60 SR | 0.891 ± 0.023 | 0.999 ± 0.002 c | 0.962 ± 0.014 c | 0.979 ± 0.001 c | - | |
| Method | Strain | MK | GK | ||||||||
|---|---|---|---|---|---|---|---|---|---|---|---|
| Trait | Bw | ST | 36 SR | SS50 | 60 SR | Bw | ST | 36 SR | SS50 | 60 SR | |
| pBLUP | Acc | 0.420 | 0.328 | 0.319 | 0.314 | 0.302 | 0.491 | 0.314 | 0.272 | 0.261 | 0.308 |
| Bias | 1.012 | 1.015 | 1.026 | 1.016 | 1.006 | 1.004 | 1.006 | 1.027 | 1.021 | 1.024 | |
| ssGBLUP | Acc | 0.420 | 0.328 | 0.319 | 0.314 | 0.302 | 0.492 | 0.315 | 0.272 | 0.262 | 0.308 |
| Bias | 1.012 | 1.015 | 1.026 | 1.017 | 1.006 | 1.004 | 1.011 | 1.027 | 1.021 | 1.024 | |
Disclaimer/Publisher’s Note: The statements, opinions and data contained in all publications are solely those of the individual author(s) and contributor(s) and not of MDPI and/or the editor(s). MDPI and/or the editor(s) disclaim responsibility for any injury to people or property resulting from any ideas, methods, instructions or products referred to in the content. |
© 2025 by the authors. Licensee MDPI, Basel, Switzerland. This article is an open access article distributed under the terms and conditions of the Creative Commons Attribution (CC BY) license (https://creativecommons.org/licenses/by/4.0/).
Share and Cite
Huang, G.; Kong, J.; Tian, J.; Luan, S.; Liu, M.; Luo, K.; Tan, J.; Cao, J.; Dai, P.; Qiang, G.; et al. Genetic Parameter Estimation of Body Weight and VpAHPND Resistance in Two Strains of Penaeus vannamei. Animals 2025, 15, 1266. https://doi.org/10.3390/ani15091266
Huang G, Kong J, Tian J, Luan S, Liu M, Luo K, Tan J, Cao J, Dai P, Qiang G, et al. Genetic Parameter Estimation of Body Weight and VpAHPND Resistance in Two Strains of Penaeus vannamei. Animals. 2025; 15(9):1266. https://doi.org/10.3390/ani15091266
Chicago/Turabian StyleHuang, Guixian, Jie Kong, Jiteng Tian, Sheng Luan, Mianyu Liu, Kun Luo, Jian Tan, Jiawang Cao, Ping Dai, Guangfeng Qiang, and et al. 2025. "Genetic Parameter Estimation of Body Weight and VpAHPND Resistance in Two Strains of Penaeus vannamei" Animals 15, no. 9: 1266. https://doi.org/10.3390/ani15091266
APA StyleHuang, G., Kong, J., Tian, J., Luan, S., Liu, M., Luo, K., Tan, J., Cao, J., Dai, P., Qiang, G., Xing, Q., Sui, J., & Meng, X. (2025). Genetic Parameter Estimation of Body Weight and VpAHPND Resistance in Two Strains of Penaeus vannamei. Animals, 15(9), 1266. https://doi.org/10.3390/ani15091266