
Understanding the Impact of Social Stress on Serum Metabolome and Saliva Biomarkers in Growing–Finishing Pigs
 , , ,
, , ,  , , ,
, , ,  and
and
Simple Summary
Abstract
1. Introduction
2. Materials and Methods
2.1. Animals and Husbandry
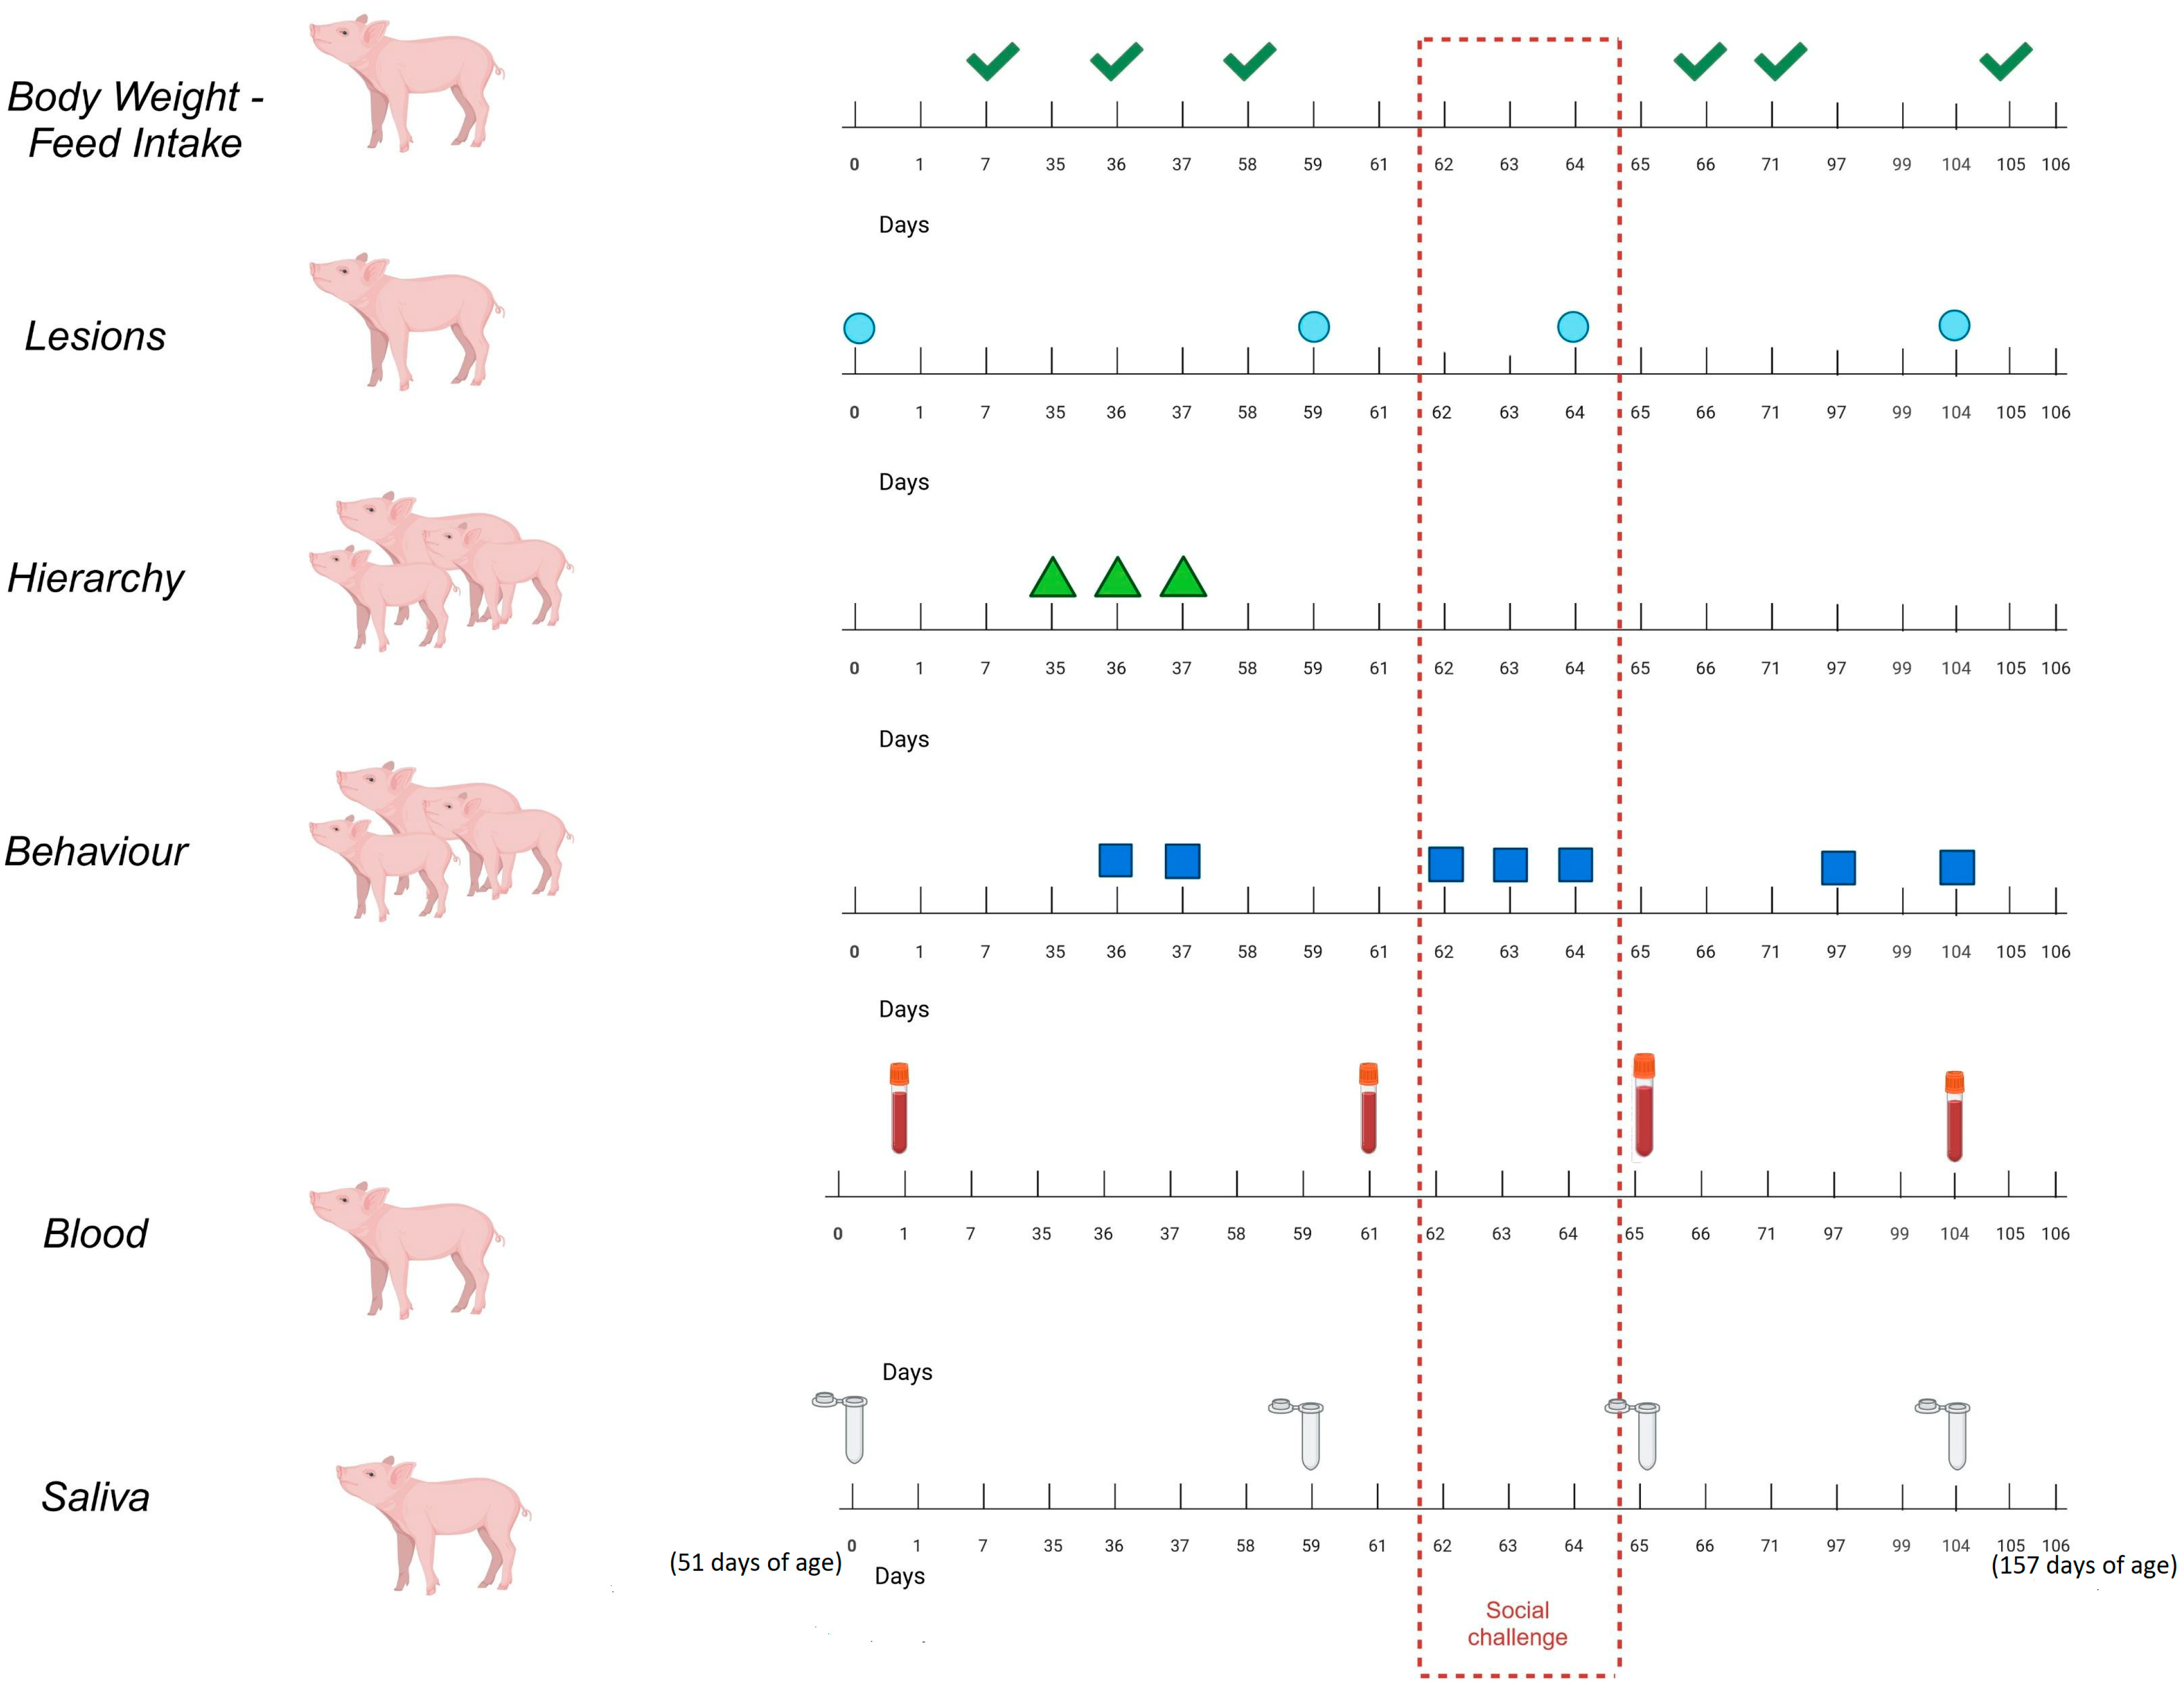
2.2. Design of the Experiment
2.3. The Parameters Measured
2.3.1. Performance
2.3.2. Lesions
2.3.3. Behaviour
2.3.4. Saliva Biomarkers
2.3.5. Blood Metabolomics
2.4. Data Processing and Statistical Analysis
3. Results
3.1. Performance
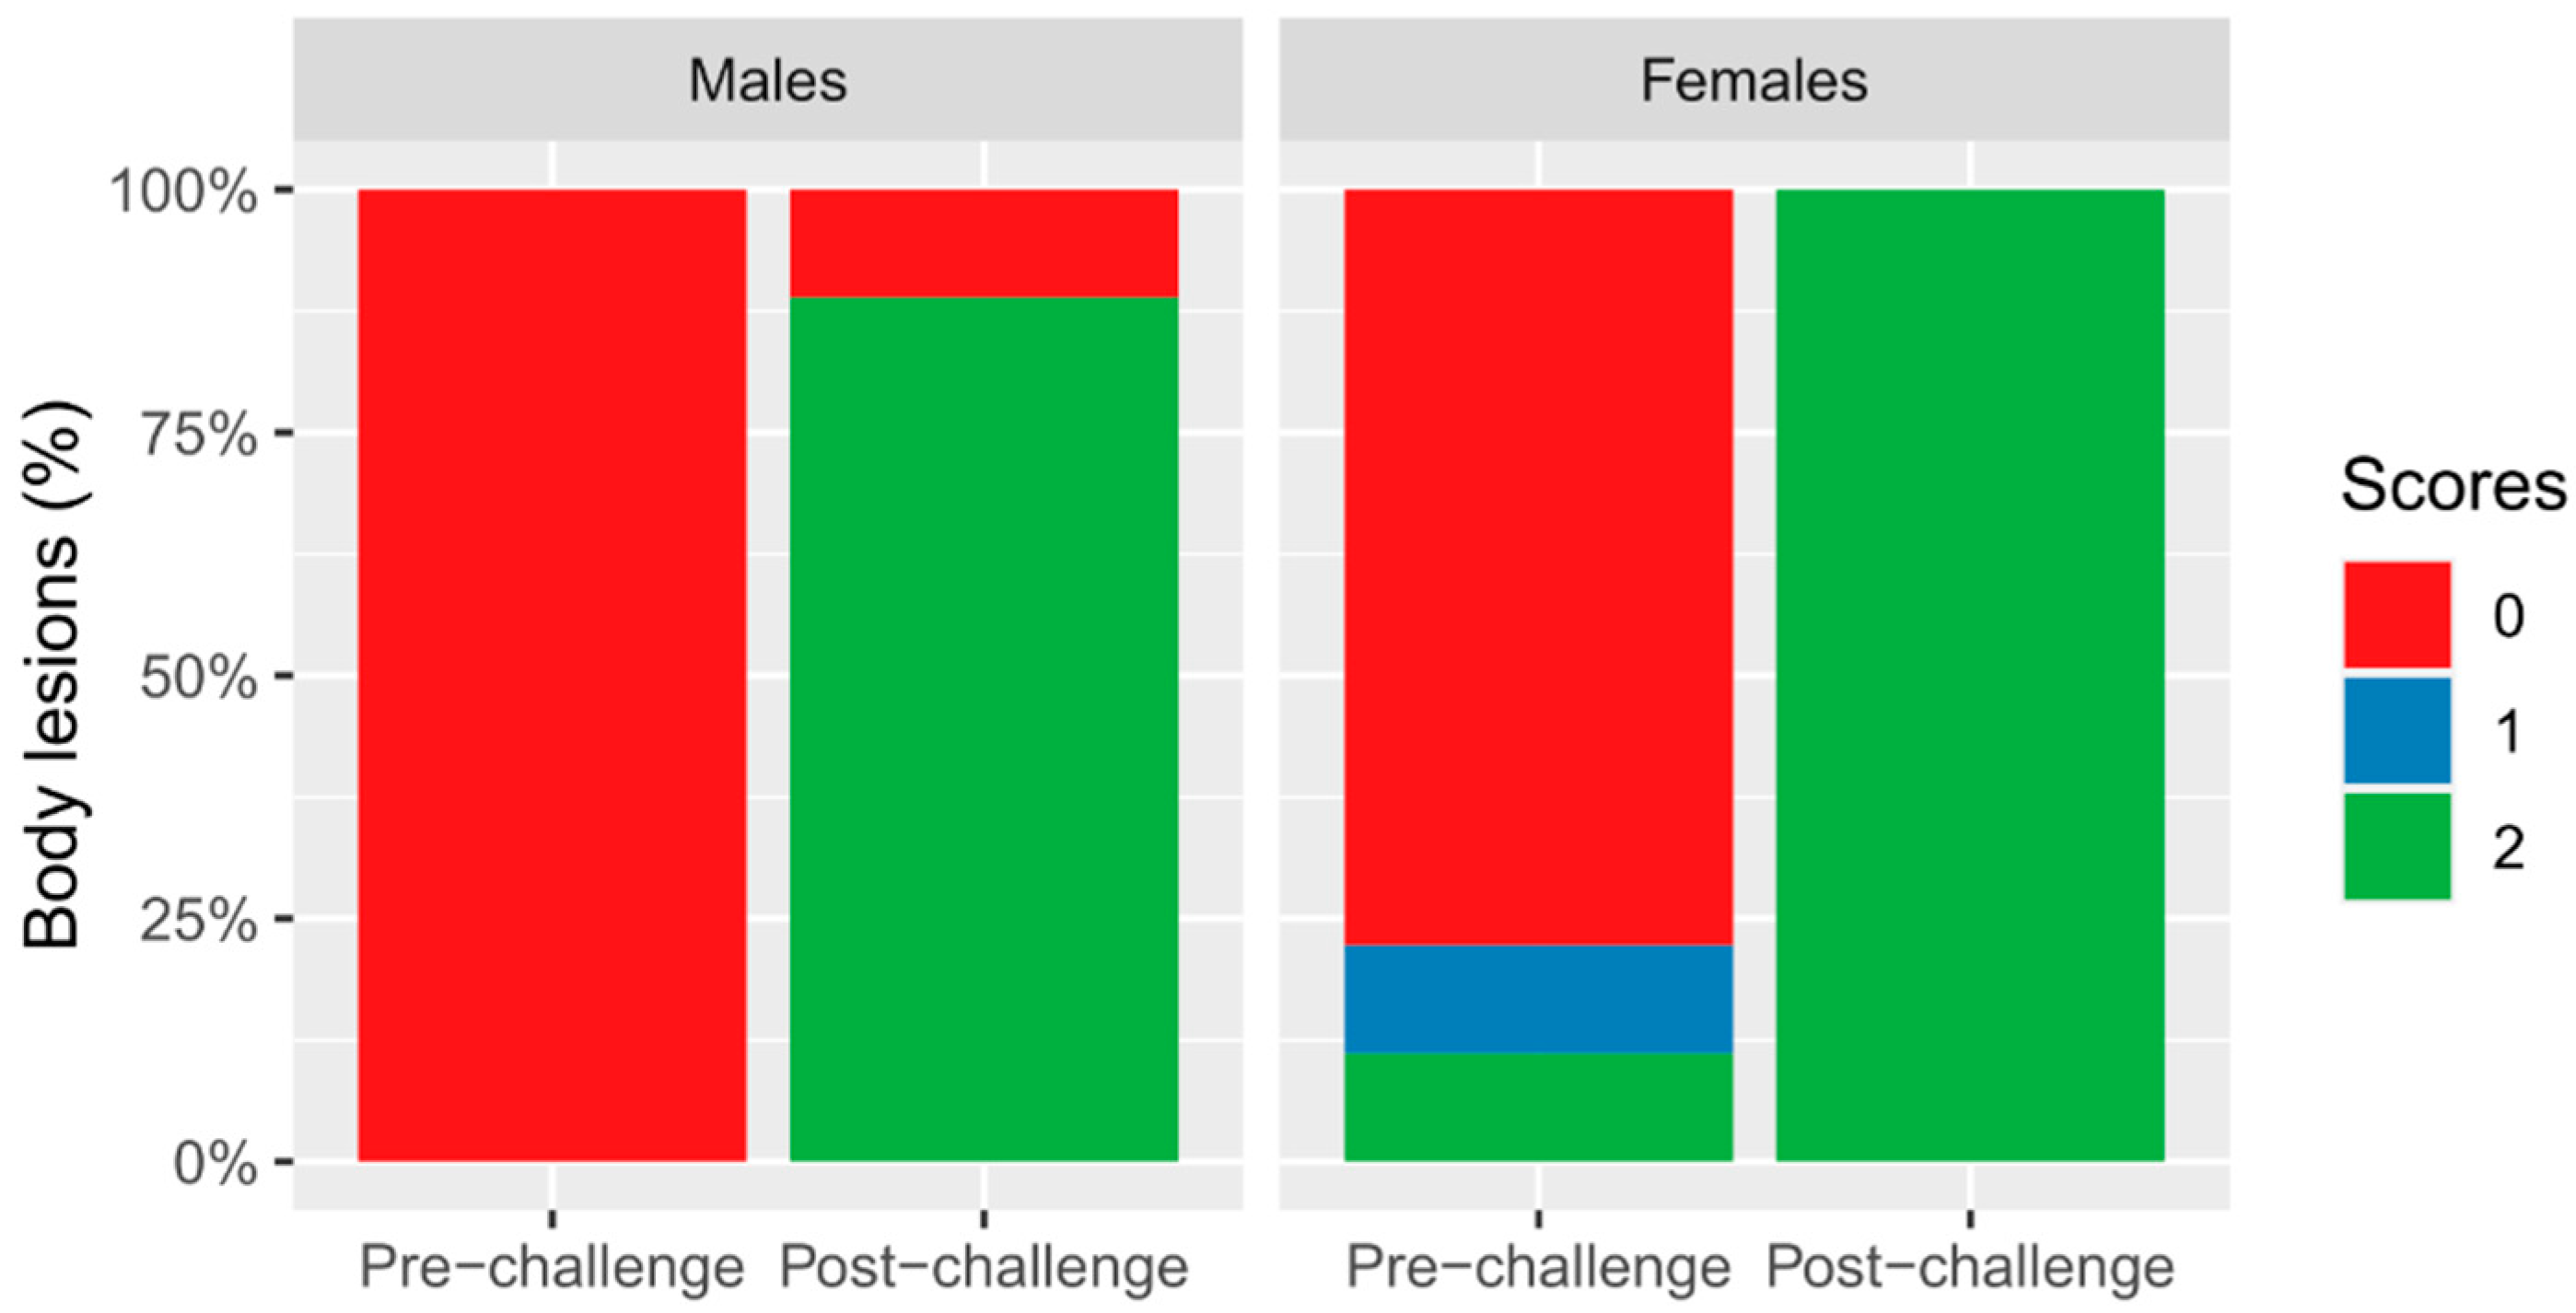
3.2. Lesions
3.3. Behaviour
3.4. Saliva Biomarkers
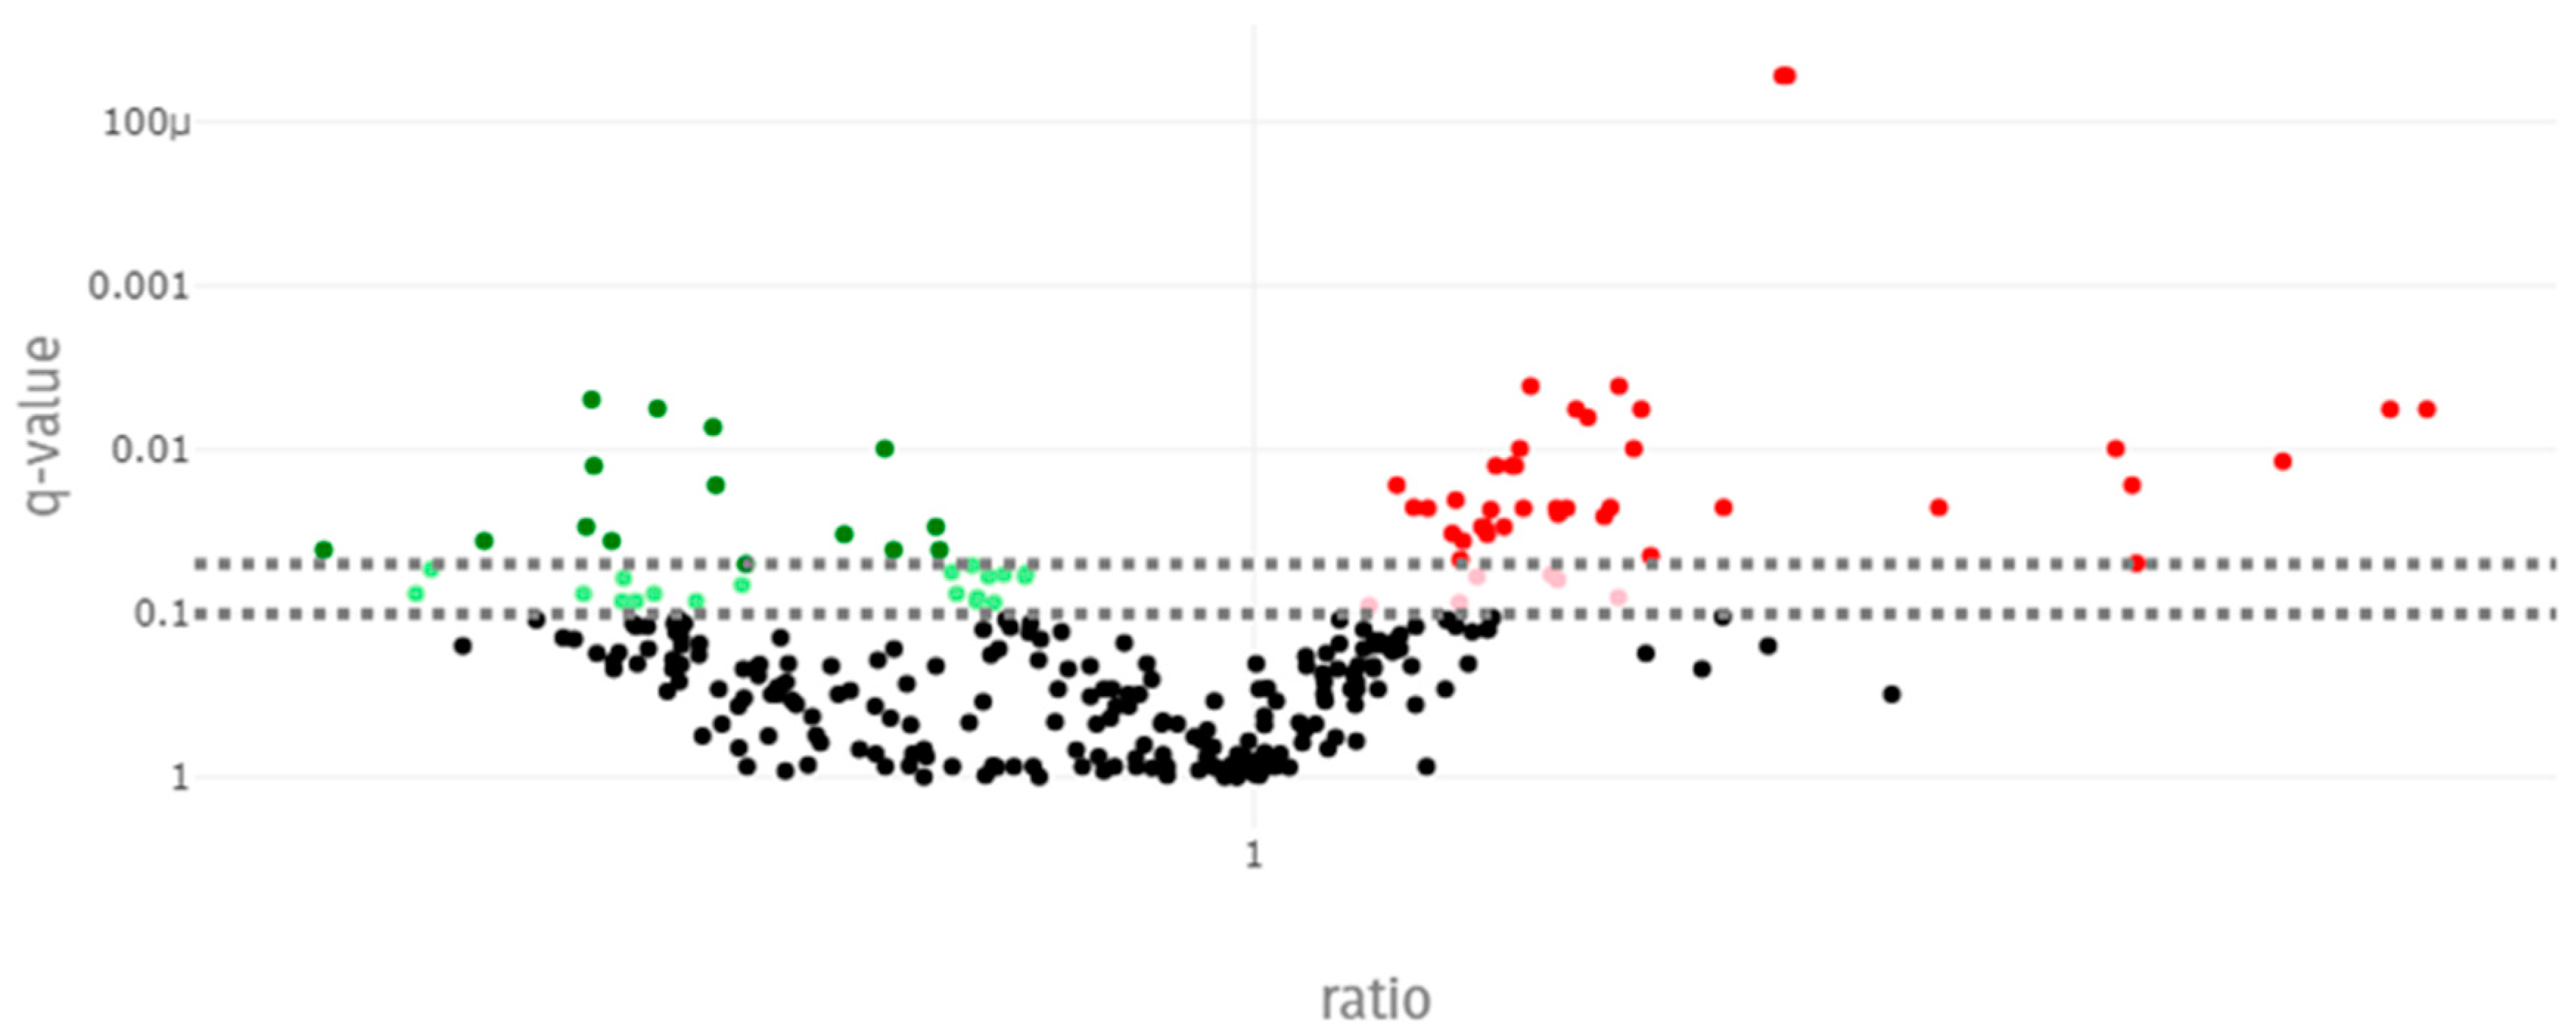
3.5. Blood Metabolome
4. Discussion
4.1. Impacts of the Social Challenge on Behaviour, Performance, Salivary Biomarkers, and Serum Cortisol
4.2. Impact of Social Challenge on Metabolomic Biomarkers
5. Conclusions
Supplementary Materials
Author Contributions
Funding
Institutional Review Board Statement
Informed Consent Statement
Data Availability Statement
Acknowledgments
Conflicts of Interest
References
- Martínez-Miró, S.; Tecles, F.; Ramón, M.; Escribano, D.; Hernández, F.; Madrid, J.; Orengo, J.; Martínez-Subiela, S.; Manteca, X.; Cerón, J.J. Causes, Consequences and Biomarkers of Stress in Swine: An Update. BMC Vet. Res. 2016, 12, 171. [Google Scholar] [CrossRef] [PubMed]
- Moberg, G.P. Biological response to stress: Implications for animal welfare. In The Biology of Animal Stress: Basic Principles and Implications for Animal Welfare; Moberg, G.P., Mench, J.A., Eds.; CABI Publishing: Menlo Park, CA, USA, 2000; pp. 1–22. [Google Scholar] [CrossRef]
- Büttner, K.; Czycholl, I.; Mees, K.; Krieter, J. Agonistic Interactions in Pigs–Comparison of Dominance Indices with Parameters Derived from Social Network Analysis in Three Age Groups. Animals 2019, 9, 929. [Google Scholar] [CrossRef]
- Gimsa, U.; Tuchscherer, M.; Kanitz, E. Psychosocial Stress and Immunity—What Can We Learn From Pig Studies? Front. Behav. Neurosci. 2018, 12, 64. [Google Scholar] [CrossRef] [PubMed]
- Turner, S.P.; Nevison, I.M.; Sesire, S.; Camerlink, I.; Roehe, R.; Ison, S.H.; Farish, M.; Jack, M.; D’Eatch, R. Aggressive behaviour at regrouping is a poor predictor of chronic aggression in stable social groups. Appl. Anim. Behav. Sci. 2017, 191, 98–106. [Google Scholar] [CrossRef]
- Coutellier, L.; Arnould, C.; Boissy, A.; Orgeur, P.; Prunier, A.; Veissier, I.; Meunier-Salaün, M.C. Pig’s responses to repeated social regrouping and relocation during the growing-finishing period. Appl. Anim. Behav. Sci. 2007, 105, 102–114. [Google Scholar] [CrossRef]
- Selye, H. History and Present Status of the Stress Concept. In Stress and Coping: An Anthology; Monat, A., Lazarus, R.S., Eds.; Columbia University Press: Chichester, NY, USA, 1991; pp. 21–35. [Google Scholar] [CrossRef]
- Guevara, R.D.; López-Vergé, S.; Pastor, J.J.; Manteca, X.; Tedo, G.; Llonch, P. When the Neighbors Are Noisy: Effect of Social Challenge in Collateral Pens of Stressed Animals. Front. Vet. Sci. 2024, 11, 1433628. [Google Scholar] [CrossRef] [PubMed]
- Li, Y.; Song, Z.; Kerr, K.A.; Moeser, A.J. Chronic Social Stress in Pigs Impairs Intestinal Barrier and Nutrient Transporter Function, and Alters Neuro-Immune Mediator and Receptor Expression. PLoS ONE 2017, 12, e0171617. [Google Scholar] [CrossRef]
- Tuchscherer, M.; Puppe, B.; Tuchscherer, A.; Kanitz, E. Psychosocial Stress Sensitizes Neuroendocrine and Inflammatory Responses to Escherichia Coli Challenge in Domestic Piglets. Brain Behav. Immun. 2018, 68, 274–287. [Google Scholar] [CrossRef]
- Escribano, D.; Ko, H.-L.; Chong, Q.; Llonch, L.; Manteca, X.; Llonch, P. Salivary Biomarkers to Monitor Stress Due to Aggression after Weaning in Piglets. Res. Vet. Sci. 2019, 123, 178–183. [Google Scholar] [CrossRef]
- Oster, M.; Muráni, E.; Ponsuksili, S.; D’Eath, R.B.; Turner, S.P.; Evans, G.; Thölking, L.; Kurt, E.; Klont, R.; Foury, A.; et al. Hepatic Expression Patterns in Psychosocially High-Stressed Pigs Suggest Mechanisms Following Allostatic Principles. Physiol. Behav. 2014, 128, 159–165. [Google Scholar] [CrossRef]
- Couret, D.; Otten, W.; Puppe, B.; Prunier, A.; Merlot, E. Behavioural, Endocrine and Immune Responses to Repeated Social Stress in Pregnant Gilts. Animal 2009, 3, 118–127. [Google Scholar] [CrossRef]
- He, H.; Carballo-Jane, E.; Tong, X.; Cohen, L.H. Measurement of Catecholamines in Rat and Mini-Pig Plasma and Urine by Liquid Chromatography-Tandem Mass Spectrometry Coupled with Solid Phase Extraction. J. Chromatogr. B Anal. Technol. Biomed. Life Sci. 2015, 997, 154–161. [Google Scholar] [CrossRef] [PubMed]
- Kasper, C.; Ribeiro, D.; de Almeida, A.M.; Larzul, C.; Liaubet, L.; Murani, E. Omics Application in Animal Science-A Special Emphasis on Stress Response and Damaging Behaviour in Pigs. Genes 2020, 11, 920. [Google Scholar] [CrossRef] [PubMed]
- Huau, G.; Liaubet, L.; Gourdine, J.-L.; Riquet, J.; Renaudeau, D. Multi-Tissue Metabolic and Transcriptomic Responses to a Short-Term Heat Stress in Swine. BMC Genom. 2024, 25, 99. [Google Scholar] [CrossRef]
- Srikanth, K.; Park, J.-E.; Ji, S.Y.; Kim, K.H.; Lee, Y.K.; Kumar, H.; Kim, M.; Baek, Y.C.; Kim, H.; Jang, G.-W.; et al. Genome-Wide Transcriptome and Metabolome Analyses Provide Novel Insights and Suggest a Sex-Specific Response to Heat Stress in Pigs. Genes 2020, 11, 540. [Google Scholar] [CrossRef] [PubMed]
- Wang, L.; Urriola, P.E.; Luo, Z.-H.; Rambo, Z.J.; Wilson, M.E.; Torrison, J.L.; Shurson, G.C.; Chen, C. Metabolomics Revealed Diurnal Heat Stress and Zinc Supplementation-Induced Changes in Amino Acid, Lipid, and Microbial Metabolism. Physiol. Rep. 2016, 4, e12676. [Google Scholar] [CrossRef]
- Kim, B.; Kim, H.R.; Kim, K.H.; Ji, S.Y.; Kim, M.; Lee, Y.; Lee, S.D.; Jeong, J.Y. Effects of Acute Heat Stress on Salivary Metabolites in Growing Pigs: An Analysis Using Nuclear Magnetic Resonance-Based Metabolomics Profiling. J. Anim. Sci. Technol. 2021, 63, 319–331. [Google Scholar] [CrossRef]
- Saladrigas-García, M.; D’Angelo, M.; Ko, H.L.; Traserra, S.; Nolis, P.; Ramayo-Caldas, Y.; Folch, J.M.; Vergara, P.; Llonch, P.; Pérez, J.F.; et al. Early Socialization and Environmental Enrichment of Lactating Piglets Affects the Caecal Microbiota and Metabolomic Response after Weaning. Sci. Rep. 2021, 11, 6113. [Google Scholar] [CrossRef]
- Cerón, J.J.; Contreras-Aguilar, M.D.; Escribano, D.; Martínez-Miró, S.; López-Martínez, M.J.; Ortín-Bustillo, A.; Franco-Martínez, L.; Rubio, C.P.; Muñoz-Prieto, A.; Tvarijonaviciute, A.; et al. Basics for the Potential Use of Saliva to Evaluate Stress, Inflammation, Immune System, and Redox Homeostasis in Pigs. BMC Vet. Res. 2022, 18, 81. [Google Scholar] [CrossRef]
- FEDNA. Necesidades nutricionales para ganado porcino. In Normas FEDNA; de Blas, C., Gasa, J., Mateos, G., Eds.; Fundación Española Para el Desarrollo de la Nutrición Animal: Madrid, Spain, 2013. [Google Scholar]
- da Fonseca de Oliveira, A.C.; Webber, S.H.; Ramayo-Caldas, Y.; Dalmau, A.; Costa, L.B. Hierarchy Establishment in Growing Finishing Pigs: Impacts on Behavior, Growth Performance, and Physiological Parameters. Animals 2023, 13, 292. [Google Scholar] [CrossRef]
- Martin, P.; Bateson, P.P.G. Measuring Behaviour: An Introductory Guide; Cambridge University Press: Cambridge, UK; New York, NY, USA, 1993. [Google Scholar]
- Langbein, J.; Puppe, B. Analysing Dominance Relationships by Sociometric Methods—A Plea for a More Standardised and Precise Approach in Farm Animals. Appl. Anim. Behav. Sci. 2004, 87, 293–315. [Google Scholar] [CrossRef]
- Bowen, D.W.; Brooks, R.J. Social Organization of Confined Male Collared Lemmings (Dicrostonyx groenlandicus Traill). Anim. Behav. 1978, 26, 1126–1135. [Google Scholar] [CrossRef]
- Welfare Quality. Welfare Quality Assessment Protocolfor Pigs (Sows and Piglets, Growing and Finishing Pigs); Welfare Quality Consortium: Lelystad, The Netherlands, 2009. [Google Scholar]
- Diana, A.; Manzanilla, E.G.; Díaz, J.A.C.; Leonard, F.C.; Boyle, L.A. Do Weaner Pigs Need In-Feed Antibiotics to Ensure Good Health and Welfare? PLoS ONE 2017, 12, e0185622. [Google Scholar] [CrossRef] [PubMed]
- Lahrmann, H.; Hansen, C.; D’Eath, R.; Busch, M.; Forkman, B. Tail Posture Predicts Tail Biting Outbreaks at Pen Level in Weaner Pigs. Appl. Anim. Behav. Sci. 2017, 200, 29–35. [Google Scholar] [CrossRef]
- López-Arjona, M.; Escribano, D.; Mateo, S.V.; Contreras-Aguilar, M.D.; Rubio, C.P.; Tecles, F.; Cerón, J.J.; Martínez-Subiela, S. Changes in Oxytocin Concentrations in Saliva of Pigs after a Transport and during Lairage at Slaughterhouse. Res. Vet. Sci. 2020, 133, 26–30. [Google Scholar] [CrossRef] [PubMed]
- Contreras-Aguilar, M.D.; López-Arjona, M.; Martínez-Miró, S.; Escribano, D.; Hernández-Ruipérez, F.; Cerón, J.J.; Tecles, F. Changes in Saliva Analytes during Pregnancy, Farrowing and Lactation in Sows: A Sialochemistry Approach. Vet. J. 2021, 273, 105679. [Google Scholar] [CrossRef]
- R Core Team. R: A Language and Environment for Statistical Computing; R Foundation for Statistical Computing: Vienna, Austria, 2023; Available online: https://www.R-project.org/ (accessed on 18 February 2025).
- Turner, S.P.; Farnworth, M.J.; White, I.M.S.; Brotherstone, S.; Mendl, M.; Knap, P.; Penny, P.; Lawrence, A.B. The Accumulation of Skin Lesions and Their Use as a Predictor of Individual Aggressiveness in Pigs. Appl. Anim. Behav. Sci. 2006, 96, 245–259. [Google Scholar] [CrossRef]
- Tönepöhl, B.; Appel, A.K.; Voß, B.; König von Borstel, U.; Gauly, M. Interaction between sows’ aggressiveness post mixing and skin lesions recorded several weeks later. Appl. Anim. Behav. Sci. 2013, 144, 108–115. [Google Scholar] [CrossRef]
- Teixeira, D.L.; Boyle, L.A. A comparison of the impact of behaviours performed by entire male and female pigs prior to slaughter on skin lesion scores of the carcass. Livest. Sci. 2014, 170, 142–149. [Google Scholar] [CrossRef]
- Camerlink, I.; Chou, J.Y.; Turner, S.P. Intra-Group Lethal Gang Aggression in Domestic Pigs (Sus scrofa domesticus). Animal 2020, 10, 1287. [Google Scholar] [CrossRef]
- Di Martino, G.; Scollo, A.; Garbo, A.; Lega, F.; Stefani, A.L.; Vascellari, M.; Natale, A.; Zuliani, F.; Zanardello, C.; Tonon, F.; et al. Impact of sexual maturity on the welfare of immunocastrated v. entire heavy female pigs. Animal 2018, 12, 1631–1637. [Google Scholar] [CrossRef] [PubMed]
- Ruis, M.A.W.; Te Brake, J.H.A.; Engel, B.; Ekkel, E.D.; Buist, W.G.; Blokhuis, H.J.; Koolhaas, J.M. The Circadian Rhythm of Salivary Cortisol in Growing Pigs: Effects of Age, Gender, and Stress. Physiol. Behav. 1997, 62, 623–630. [Google Scholar] [CrossRef] [PubMed]
- Shen, C.; Tong, X.; Chen, R.; Gao, S.; Liu, X.; Schinckel, A.P.; Li, Y.; Xu, F.; Zhou, B. Identifying Blood-Based Biomarkers Associated with Aggression in Weaned Pigs after Mixing. Appl. Anim. Behav. Sci. 2020, 224, 104927. [Google Scholar] [CrossRef]
- Fàbrega, E.; Gispert, M.; Tibau, J.; Hortós, M.; Oliver, M.A.; Furnols, M.F.I. Effect of Housing System, Slaughter Weight and Slaughter Strategy on Carcass and Meat Quality, Sex Organ Development and Androstenone and Skatole Levels in Duroc Finished Entire Male Pigs. Meat Sci. 2011, 89, 434–439. [Google Scholar] [CrossRef]
- Murata, H.; Shimada, N.; Yoshioka, M. Current research on acute phase proteins in veterinary diagnosis: An overview. Vet. J. 2004, 168, 28–40. [Google Scholar] [CrossRef] [PubMed]
- Saco, Y.; Docampo, M.J.; Fàbrega, E.; Manteca, X.; Diestre, A.; Lampreave, F.; Bassols, A. Effect of Transport Stress on Serum Haptoglobin and Pig-Map in Pigs. Anim. Welf. 2003, 12, 403–409. [Google Scholar] [CrossRef]
- Soler, L.; Gutiérrez, A.; Escribano, D.; Fuentes, M.; Cerón, J.J. Response of Salivary Haptoglobin and Serum Amyloid A to Social Isolation and Short Road Transport Stress in Pigs. Res. J. Vet. Sci. 2013, 95, 298–302. [Google Scholar] [CrossRef]
- Guevara, R.D.; Pastor, J.J.; Manteca, X.; Tedo, G.; Llonch, P. Systematic Review of Animal-Based Indicators to Measure Thermal, Social, and Immune-Related Stress in Pigs. PLoS ONE 2022, 17, e0266524. [Google Scholar] [CrossRef]
- Merlot, E.; Mounier, A.M.; Prunier, A. Endocrine Response of Gilts to Various Common Stressors: A Comparison of Indicators and Methods of Analysis. Physiol. Behav. 2011, 102, 259–265. [Google Scholar] [CrossRef]
- Casal, N.; Manteca, X.; Escribano, D.; Cerón, J.J.; Fàbrega, E. Effect of Environmental Enrichment and Herbal Compound Supplementation on Physiological Stress Indicators (Chromogranin A, Cortisol and Tumour Necrosis Factor-α) in Growing Pigs. Animal 2017, 11, 1228–1236. [Google Scholar] [CrossRef]
- Matijatko, V.; Mrljak, V.; Kis, I.; Kucer, N.; Forsek, J.; Zivicnjak, T.; Romić, Z.; Simec, Z.; Ceron, J.J. Evidence of an acute phase response in dogs naturally infected with Babesia canis. Vet. Parasitol. 2007, 144, 242–250. [Google Scholar] [CrossRef] [PubMed]
- Beunders, R.; Bongers, C.C.W.G.; Pickkers, P. The Effects of Physical Exercise on the Assessment of Kidney Function. J. Appl. Physiol. 2020, 128, 1459–1460. [Google Scholar] [CrossRef]
- Kampman-van de Hoek, E. Impact of Health Status on Amino Acid Requirements of Growing Pigs: Towards Feeding Strategies for Farms Differing in Health Status. Ph.D. Thesis, Wageningen University, Wageningen, The Netherlands, 2015. [Google Scholar]
- Persky, H.; Grinker, R.R.; Mirsky, I.A. The excretion of hippuric acid in subjects with free anxiety. J. Clin. Investig. 1950, 29, 110–114. [Google Scholar] [CrossRef]
- Rey, A.I.; de-Cara, A.; Calvo, L.; Puig, P.; Hechavarría, T. Changes in Plasma Fatty Acids, Free Amino Acids, Antioxidant Defense, and Physiological Stress by Oleuropein Supplementation in Pigs Prior to Slaughter. Antioxidants 2020, 9, 56. [Google Scholar] [CrossRef] [PubMed]
- Gabbs, M.; Leng, S.; Devassy, J.G.; Monirujjaman, M.; Aukema, H.M. Advances in Our Understanding of Oxylipins Derived from Dietary PUFAs. Adv. Nutr. 2015, 6, 513–540. [Google Scholar] [CrossRef] [PubMed]
- Blood, D.C.; Radostits, O.M.; Henderson, J.A. Veterinary Medicine: A Textbook of the Diseases of Cattle, Sheep, Pigs, Goats and Horses; Bailliere Tindall: London, UK, 1979. [Google Scholar]
- Cognasse, F.; Laradi, S.; Berthelot, P.; Bourlet, T.; Marotte, H.; Mismetti, P.; Garraud, O.; Hamzeh-Cognasse, H. Platelet Inflammatory Response to Stress. Front. Immunol. 2019, 10, 1478. [Google Scholar] [CrossRef] [PubMed]
- Levine, S.P.; Towell, B.L.; Suarez, A.M.; Knieriem, L.K.; Harris, M.M.; George, J.N. Platelet activation and secretion associated with emotional stress. Circulation 1985, 71, 1129–1134. [Google Scholar] [CrossRef]
- Calder, P.C. Polyunsaturated Fatty Acids, Inflammation, and Inflammatory Diseases. In The Psychoneuroimmunology of Chronic Disease: Exploring the Links Between Inflammation, Stress, and Illness; American Psychological Association: Washington, DC, USA, 2010; pp. 77–109. [Google Scholar]
- Bhargava, A.; Knapp, J.D.; Fiehn, O.; Neylan, T.C.; Inslicht, S.S. The Lipidome of Posttraumatic Stress Disorder. Biorxiv Prepr. Serv. Biol. 2024. [Google Scholar] [CrossRef]
- Peña, L.A.; Fuks, Z.; Koksnick, R. Stress-Induced Apoptosis and the Sphingomyelin Pathway. Biochem. Pharmacol. 1997, 53, 615–621. [Google Scholar] [CrossRef]
- Kuan, P.-F.; Yang, X.; Kotov, R.; Clouston, S.; Bromet, E.; Luft, B.J. Metabolomics Analysis of Post-Traumatic Stress Disorder Symptoms in World Trade Center Responders. Transl. Psychiatry 2022, 12, 174. [Google Scholar] [CrossRef]
- Pei, G.; Zyla, J.; He, L.; Moura-Alves, P.; Steinle, H.; Saikali, P.; Lozza, L.; Nieuwenhuizen, N.; Weiner, J.; Mollenkopf, H.; et al. Cellular Stress Promotes NOD1/2-dependent Inflammation via the Endogenous Metabolite Sphingosine-1-phosphate. EMBO J. 2021, 40, e106272. [Google Scholar] [CrossRef] [PubMed]
- Morgan, L.; Birkler, R.I.D.; Shaham-Niv, S.; Dong, Y.; Wachsman, T.; Carmi, L.; Yakobson, B.; Adler-Abramovich, L.; Cohen, H.; Zohar, J.; et al. Saliva metabolome alterations after acute stress. Sci. Rep. 2022, 12, 18470. [Google Scholar] [CrossRef] [PubMed]

| Behaviour | Description |
|---|---|
| Affiliative | An affiliative interaction, including sniffing, nosing, licking, or any social behaviour without a response from the receiving animal. |
| Agonistic | An aggressive interaction, including biting, knocking, or any social behaviour triggering a flight-or-fight response from the receiving animal. |
| Enrichment exploration | Playing or investigating by sniffing, nosing, licking, or chewing the enrichment material. |
| Tail biting | When one pig bites, chews, or pulls (using its mouth) the tail of another pig. |
| Ear biting | When one pig bites, chews, or pulls (using its mouth) the ear of another pig. |
| Performance | Pre-Challenge | Challenge | Post-Challenge | p-Value | |||||
|---|---|---|---|---|---|---|---|---|---|
| Males | Females | Males | Females | Males | Females | Gender | Period | Gender × Period | |
| Weight gain (g/d) | 874 (87.1) a | 836 (91.5) a | 449 (208) b | 550 (126) b | 964 (241) a | 573 (204) b | 0.01 | <0.0001 | <0.0001 |
| Feed intake (g/d) | 1846 (194) a | 1884 (113) a | 1584 (284) b | 1674 (209) b | 2098 (161) c | 1988 (160) c | 0.92 | <0.0001 | 0.10 |
| Feed-to-gain ratio | 2.12 (0.16) a | 2.27 (0.19) a | 3.99 (1.23) b | 3.17 (0.74) ab | 2.32 (0.72) a | 3.97 (1.78) b | 0.06 | <0.001 | 0.0001 |
| Lesions | Pre-Challenge | Post-Challenge | p-Value | ||||
|---|---|---|---|---|---|---|---|
| Males | Females | Males | Females | Gender | Period | Gender × Period | |
| Body lesions (%) | 100 a | 77.77 b | 11.11 c | 0.00 d | 0.03 | <0.0001 | 0.99 |
| Ear lesions (%) | 66.66 a | 55.55 a | 0.00 b | 22.22 b | 0.33 | <0.0001 | 0.10 |
| Tail damage severity (%) | 66.66 | 88.88 | 66.66 | 55.55 | 0.85 | 0.22 | 0.27 |
| Tail wound freshness (%) | 66.66 | 88.88 | 66.66 | 66.66 | 0.63 | 0.38 | 0.41 |
| Behaviour | Pre-Challenge | Challenge | Post-Challenge | p-Value | |||||
|---|---|---|---|---|---|---|---|---|---|
| Males | Females | Males | Females | Males | Females | Gender | Period | Gender × Period | |
| Affiliative | 0.255 (0.216) ab | 0.246 (0.105) ab | 0.307 (0.128) a | 0.325 (0.100) a | 0.183 (0.150) b | 0.129 (0.119) b | 0.77 | <0.0001 | 0.85 |
| Agonistic | 0.118 (0.075) a | 0.087 (0.045) a | 0.244 (0.163) b | 0.335 (0.202) b | 0.083 (0.055) a | 0.111 (0.065) a | 0.41 | <0.0001 | 0.24 |
| Exploring enrichment | 0.264 (0.174) a | 0.231 (0.082) a | 0.124 (0.040) b | 0.111 (0.056) b | 0.333 (0.163) c | 0.388 (0.163) c | 0.94 | <0.0001 | 0.43 |
| Tail biting | 0.024 (0.022) a | 0.031 (0.031) a | 0.022 (0.018) a | 0.029 (0.023) a | 0.005 (0.016) b | 0.061 (0.054) c | 0.004 | 0.75 | 0.02 |
| Ear biting | 0.024 (0.042) | 0.050 (0.044) | 0.068 (0.052) | 0.057 (0.039) | 0.038 (0.048) | 0.066 (0.066) | 0.49 | 0.08 | 0.53 |
| Saliva Biomarkers | Pre-Challenge | Post-Challenge | p-Value | ||||
|---|---|---|---|---|---|---|---|
| Males | Females | Males | Females | Gender | Period | Gender × Period | |
| Cortisol (ng/mL) | 148.05 (26.07) | 152.18 (30.54) | 156.88 (91.07) | 172.62 (79.92) | 0.50 | 0.78 | 0.54 |
| Haptoglobin (ng/mL) | 188.02 (138.23) a | 271.43 (142.33) b | 580.80 (421.95) c | 1513.94 (1200.19) d | 0.01 | <0.0001 | 0.07 |
| Biochemical Name (+ Abbreviation) | Super and Sub Pathways | Pre-Challenge | Post-Challenge | q-Value | Ratio |
|---|---|---|---|---|---|
| Amino Acid (Super) | (ng/mL) | (ng/mL) | |||
| Asparagine (Asn) | Alanine and Aspartate Metabolism | 9405 (4414) | 5958 (2211) | 0.0126 | 0.58 |
| Aspartate (Asp) | Alanine and Aspartate Metabolism | 5299 (1532) | 4026 (876) | 0.0099 | 0.73 |
| Betaine | Glycine, Serine, and Threonine Metabolism | 43,727 (10,842) | 32,163 (8753) | 0.0328 | 0.71 |
| Creatinine | Creatine Metabolism | 14,713 (2551) | 16,441 (2571) | 0.0165 | 1.13 |
| Glutamate (Glu) | Glutamate Metabolism | 42,993 (15,140) | 33,176 (9637) | 0.0408 | 0.74 |
| Indoxyl sulphate (Ind-SO4) | Tryptophan Metabolism | 281 (156) | 402 (169) | 0.0225 | 1.48 |
| Methionine sulfoxide (Met-SO) | Methionine, Cysteine, SAM, and Taurine Metabolism | 342 (187) | 212 (97) | 0.0295 | 0.57 |
| Ornithine (Orn) | Urea Cycle and Arginine and Proline Metabolism | 12,286 (4481) | 8077 (2670) | 0.0056 | 0.61 |
| Phenylalanine (Phe) | Phenylalanine Metabolism | 17,733 (6089) | 14,259 (3296) | 0.0297 | 0.77 |
| Proline (Pro) | Urea Cycle and Arginine and Proline Metabolism | 37,174 (14,935) | 25,882 (7451) | 0.0165 | 0.64 |
| Taurine | Methionine, Cysteine, SAM, and Taurine Metabolism | 22,987 (6419) | 17,755 (3975) | 0.0407 | 0.77 |
| Threonine (Thr) | Glycine, Serine, and Threonine Metabolism | 20,514 (7295) | 12,620 (4698) | 0.0050 | 0.58 |
| Tyrosine (Tyr) | Tyrosine Metabolism | 17,373 (6747) | 11,885 (3379) | 0.0073 | 0.64 |
| Lipid (Super) | |||||
| Cer(d18:1/18:0) | Ceramides | 86 (43) | 111 (32) | 0.0255 | 1.34 |
| Deoxycholic acid (DCA) | Secondary Bile Acid Metabolism | 25 (20) | 40 (31) | 0.0492 | 2.09 |
| Docosahexaenoic acid (DHA) | Long-Chain Polyunsaturated Fatty Acid (n3 and n6) | 190 (177) | 317 (222) | 0.0225 | 1.77 |
| Eicosapentaenoic acid (EPA) | Long-Chain Polyunsaturated Fatty Acid (n3 and n6) | 34 (30) | 52 (31) | 0.0099 | 2.05 |
| Octadecenoic acid (FA 18:1) | Long-Chain Monounsaturated Fatty Acid | 23,323 (32,650) | 49,785 (30,599) | 0.0057 | 2.58 |
| Eicosenoic acid (FA 20:1) | Long-Chain Monounsaturated Fatty Acid | 968 (1356) | 1291 (1006) | 0.0057 | 2.66 |
| Eicosadienoic acid (FA 20:2) | Long-Chain Polyunsaturated Fatty Acid (n3 and n6) | 2545 (3980) | 3130 (2320) | 0.0118 | 2.36 |
| Dihomo-gamma-linolenic acid (FA 20:3) | Long-Chain Polyunsaturated Fatty Acid (n3 and n6) | 281 (495) | 521 (423) | 0.0165 | 2.08 |
| Hex2Cer(d18:1/18:0) | Glycerolipid Metabolism | 134 (57) | 153 (53) | 0.0232 | 1.22 |
| Hex3Cer(d18:1/16:0) | Glycerolipid Metabolism | 554 (92) | 690 (122) | 0.0041 | 1.26 |
| Hex3Cer d18:1/24:2 | Glycerolipid Metabolism | 193 (43) | 253 (59) | 0.0057 | 1.31 |
| HexCer(d18:1/16:0) | Glycerolipid Metabolism | 238 (104) | 281 (67) | 0.0362 | 1.19 |
| HexCer(d18:1/22:0) | Glycerolipid Metabolism | 237 (55) | 282 (56) | 0.0295 | 1.21 |
| HexCer(d18:1/23:0) | Glycerolipid Metabolism | 178 (51) | 211 (58) | 0.0328 | 1.22 |
| HexCer(d18:1/24:0) | Glycerolipid Metabolism | 209 (54) | 240 (58) | 0.0202 | 1.18 |
| HexCer(d18:1/24:1) | Glycerolipid Metabolism | 517 (107) | 635 (122) | 0.0126 | 1.24 |
| lysoPC a C20:40 | Lysophospholipid | 3472 (1136) | 4143 (887) | 0.0227 | 1.25 |
| PC aa C38:4 | Phosphatidylcholine (PC) | 149,171 (60,900) | 188,439 (43,783) | 0.0228 | 1.30 |
| PC aa C38:5 | Phosphatidylcholine (PC) | 22,747 (8738) | 28,761 (5641) | 0.0248 | 1.29 |
| PC aa C38:6 | Phosphatidylcholine (PC) | 9782 (3376) | 13,118 (4223) | 0.0099 | 1.37 |
| PC aa C40:6 | Phosphatidylcholine (PC) | 9395 (3341) | 11,863 (3804) | 0.0227 | 1.29 |
| PC ae C36:4 | Phosphatidylcholine (PC) | 3181 (836) | 3871 (463) | 0.0126 | 1.22 |
| PC ae C36:5 | Phosphatidylcholine (PC) | 1282 (323) | 1723 (261) | 0.0041 | 1.36 |
| PC ae C38:5 | Phosphatidylcholine (PC) | 3978 (1035) | 4925 (626) | 0.0126 | 1.24 |
| PC ae C38:6 | Phosphatidylcholine (PC) | 744 (171) | 922 (141) | 0.0099 | 1.25 |
| PC ae C40:1 | Phosphatidylcholine (PC) | 539 (215) | 714 (211) | 0.0057 | 1.38 |
| PC ae C40:6 | Phosphatidylcholine (PC) | 910 (220) | 1084 (256) | 0.0470 | 1.19 |
| SM (OH) C16:1 | Sphingomyelins | 44,529 (8373) | 50,599 (7288) | 0.0225 | 1.14 |
| SM (OH) C22:1 | Sphingomyelins | 3321 (587) | 3822 (540) | 0.0228 | 1.16 |
| SM (OH) C24:1 | Sphingomyelins | 7101 (1582) | 10,827 (2437) | 0.0001 | 1.56 |
| SM C16:0 | Sphingomyelins | 2202 (453) | 3356 (712) | 0.0001 | 1.55 |
| SM C16:1 | Sphingomyelins | 94 (24) | 125 (31) | 0.0063 | 1.32 |
| SM C18:1 | Sphingomyelins | 1634 (493) | 2011 (396) | 0.0295 | 1.23 |
| SM C20:2 | Sphingomyelins | 816 (193) | 996 (178) | 0.0295 | 1.21 |
| SM C22:3 | Sphingomyelins | 4269 (1165) | 5017 (1029) | 0.0326 | 1.18 |
| SM C24:0 | Sphingomyelins | 5908 (1751) | 7912 (1367) | 0.0225 | 1.35 |
| TG(17:0_36:3) | Glycerolipid Metabolism | 1159 (763) | 776 (461) | 0.0499 | 0.65 |
| TG(18:2_35:1) | Glycerolipid Metabolism | 1445 (921) | 878 (534) | 0.0362 | 0.58 |
| TG(18:2_36:4) | Glycerolipid Metabolism | 13,184 (9547) | 6489 (5316) | 0.0410 | 0.46 |
| TG(20:5_36:3) | Glycerolipid Metabolism | 435 (508) | 598 (219) | 0.0445 | 1.39 |
| Xenobiotics (Super) | |||||
| Hippuric acid (HipAcid) | Benzoate Metabolism | 5047 (2342) | 2973 (1437) | 0.0362 | 0.53 |
Disclaimer/Publisher’s Note: The statements, opinions and data contained in all publications are solely those of the individual author(s) and contributor(s) and not of MDPI and/or the editor(s). MDPI and/or the editor(s) disclaim responsibility for any injury to people or property resulting from any ideas, methods, instructions or products referred to in the content. |
© 2025 by the authors. Licensee MDPI, Basel, Switzerland. This article is an open access article distributed under the terms and conditions of the Creative Commons Attribution (CC BY) license (https://creativecommons.org/licenses/by/4.0/).
Share and Cite
Bagaria, M.; Tous, N.; Torrallardona, D.; Cerón, J.J.; Pérez-Calvo, E.; Ren, W.; Argamasilla, R.; Fàbrega, E. Understanding the Impact of Social Stress on Serum Metabolome and Saliva Biomarkers in Growing–Finishing Pigs. Animals 2025, 15, 1228. https://doi.org/10.3390/ani15091228
Bagaria M, Tous N, Torrallardona D, Cerón JJ, Pérez-Calvo E, Ren W, Argamasilla R, Fàbrega E. Understanding the Impact of Social Stress on Serum Metabolome and Saliva Biomarkers in Growing–Finishing Pigs. Animals. 2025; 15(9):1228. https://doi.org/10.3390/ani15091228
Chicago/Turabian StyleBagaria, Marc, Núria Tous, David Torrallardona, Jose Joaquín Cerón, Estefanía Pérez-Calvo, Wen Ren, Rosa Argamasilla, and Emma Fàbrega. 2025. "Understanding the Impact of Social Stress on Serum Metabolome and Saliva Biomarkers in Growing–Finishing Pigs" Animals 15, no. 9: 1228. https://doi.org/10.3390/ani15091228
APA StyleBagaria, M., Tous, N., Torrallardona, D., Cerón, J. J., Pérez-Calvo, E., Ren, W., Argamasilla, R., & Fàbrega, E. (2025). Understanding the Impact of Social Stress on Serum Metabolome and Saliva Biomarkers in Growing–Finishing Pigs. Animals, 15(9), 1228. https://doi.org/10.3390/ani15091228