
Revealing the Hidden Social Structure of Pigs with AI-Assisted Automated Monitoring Data and Social Network Analysis
 ,
,
Simple Summary
Abstract
1. Introduction
2. Materials and Methods
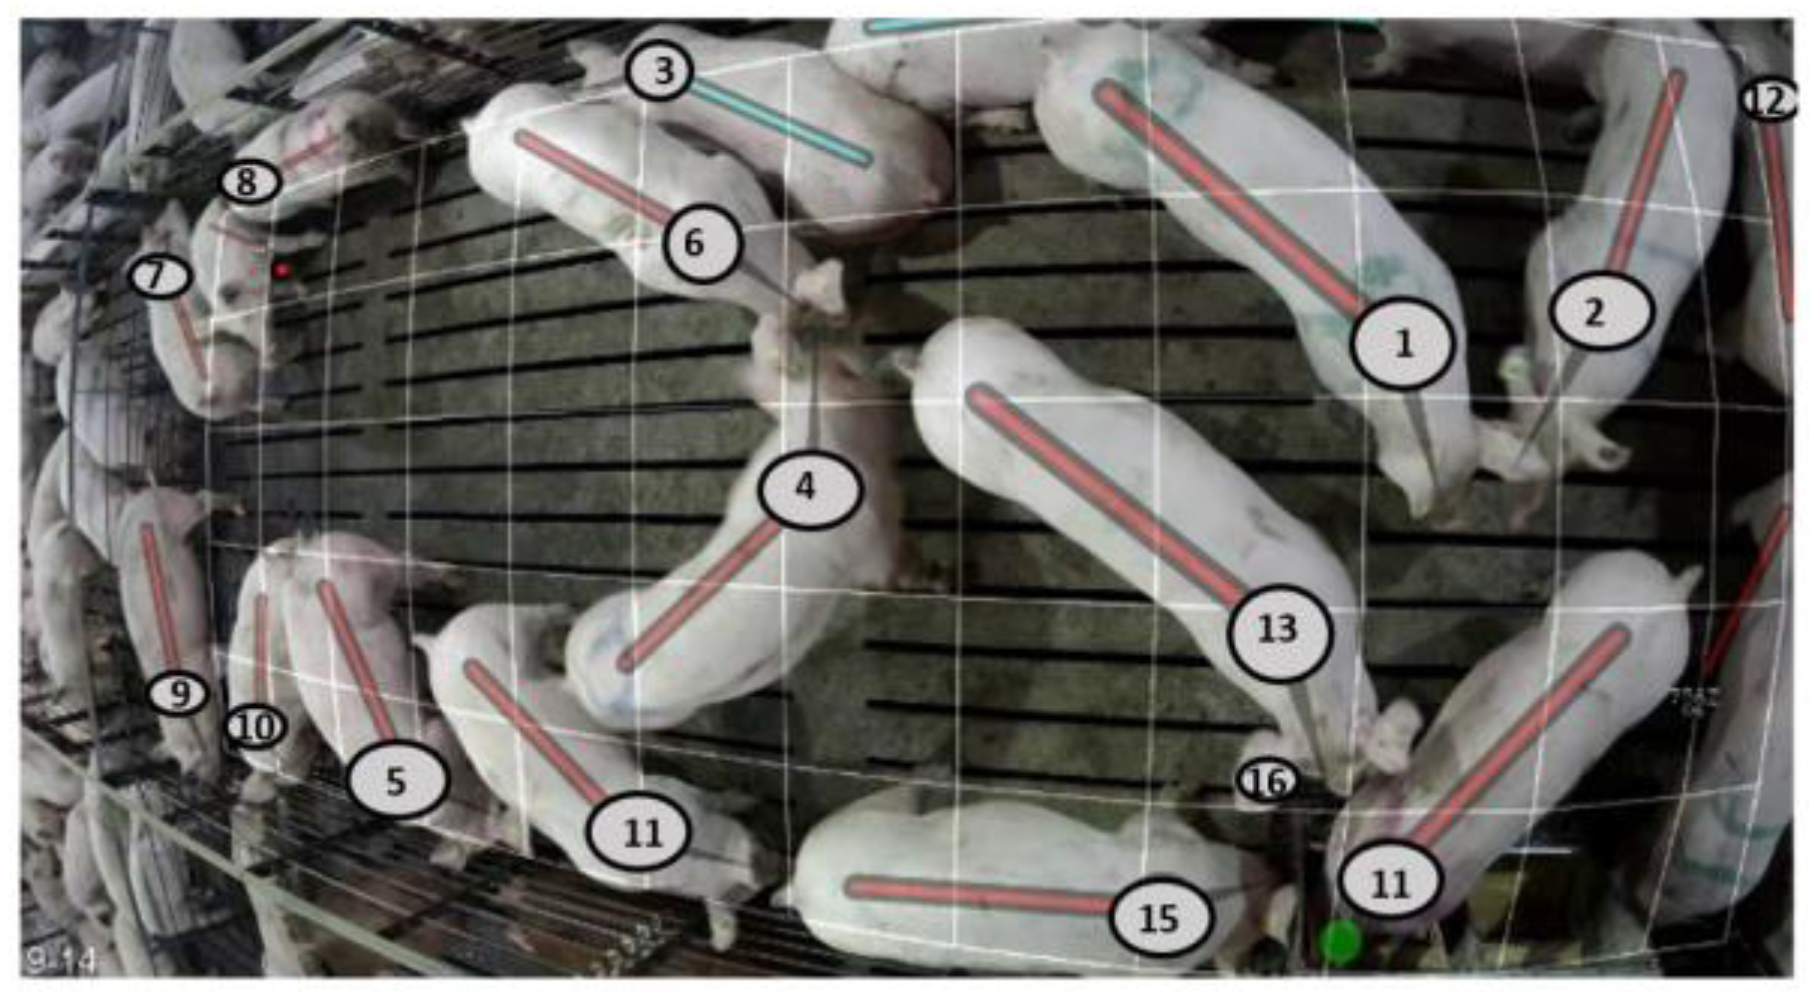
2.1. Automated Data
2.2. SNA
3. Results
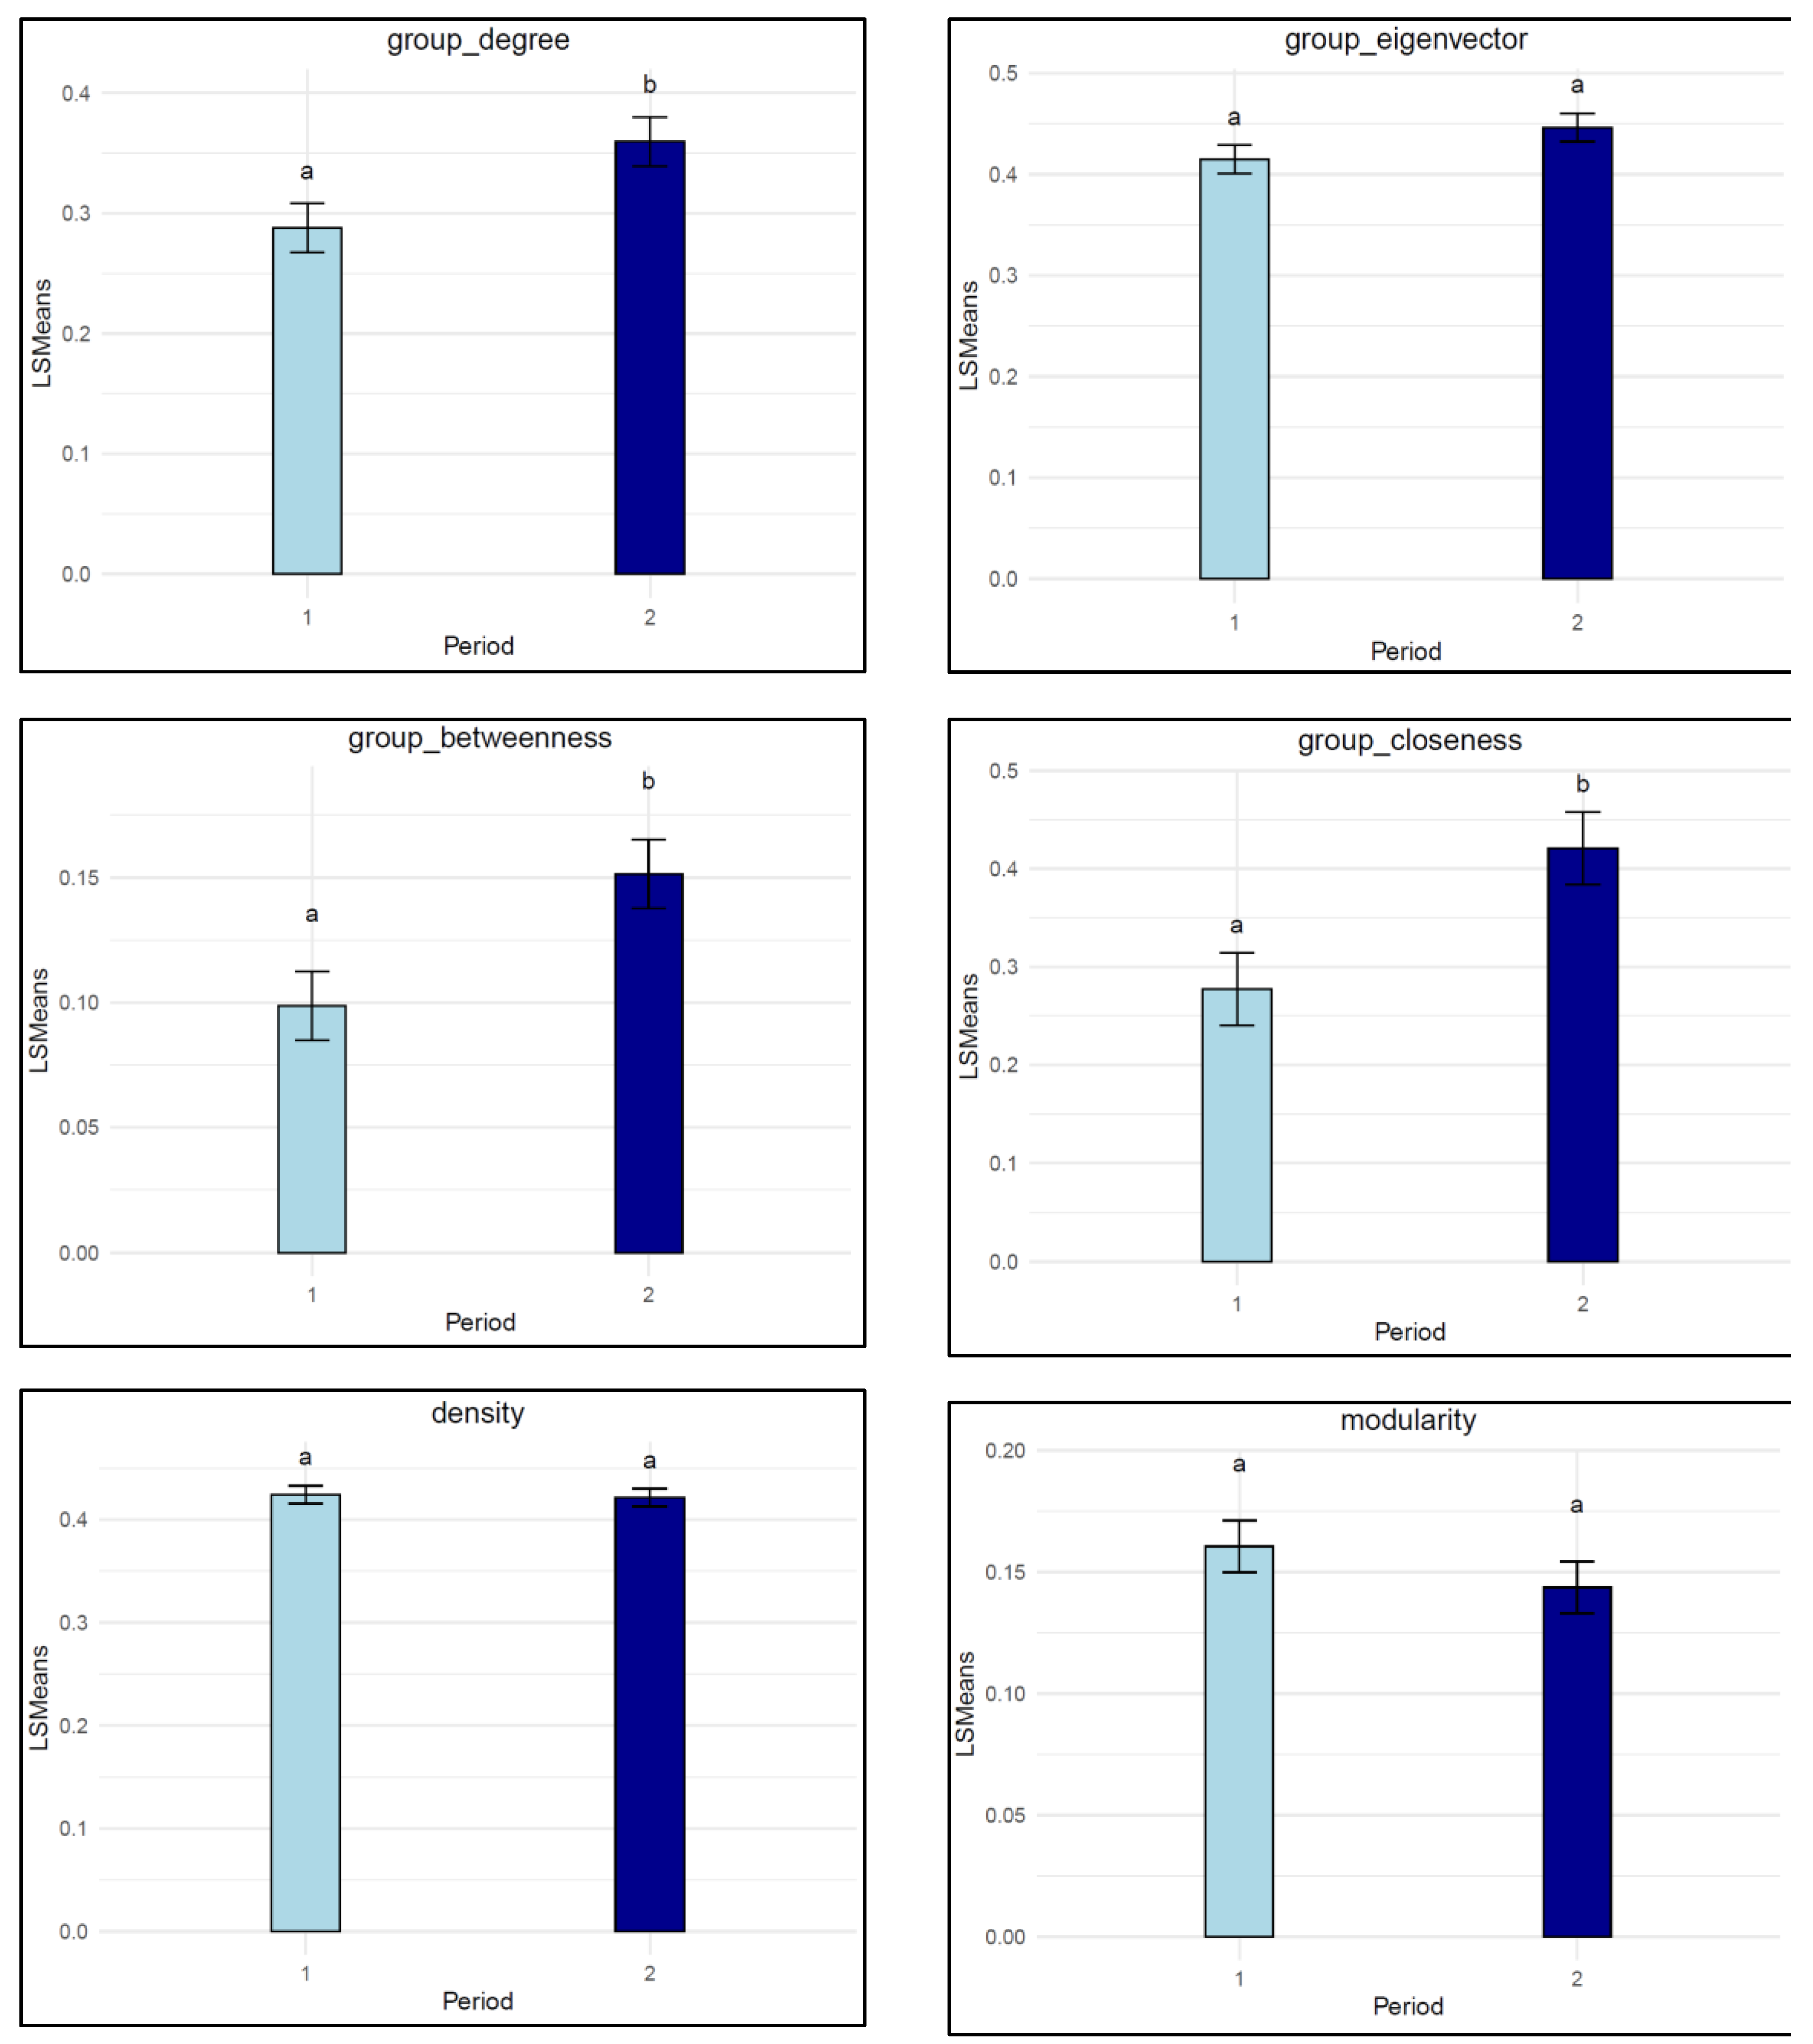
3.1. Group-Level SNA Traits
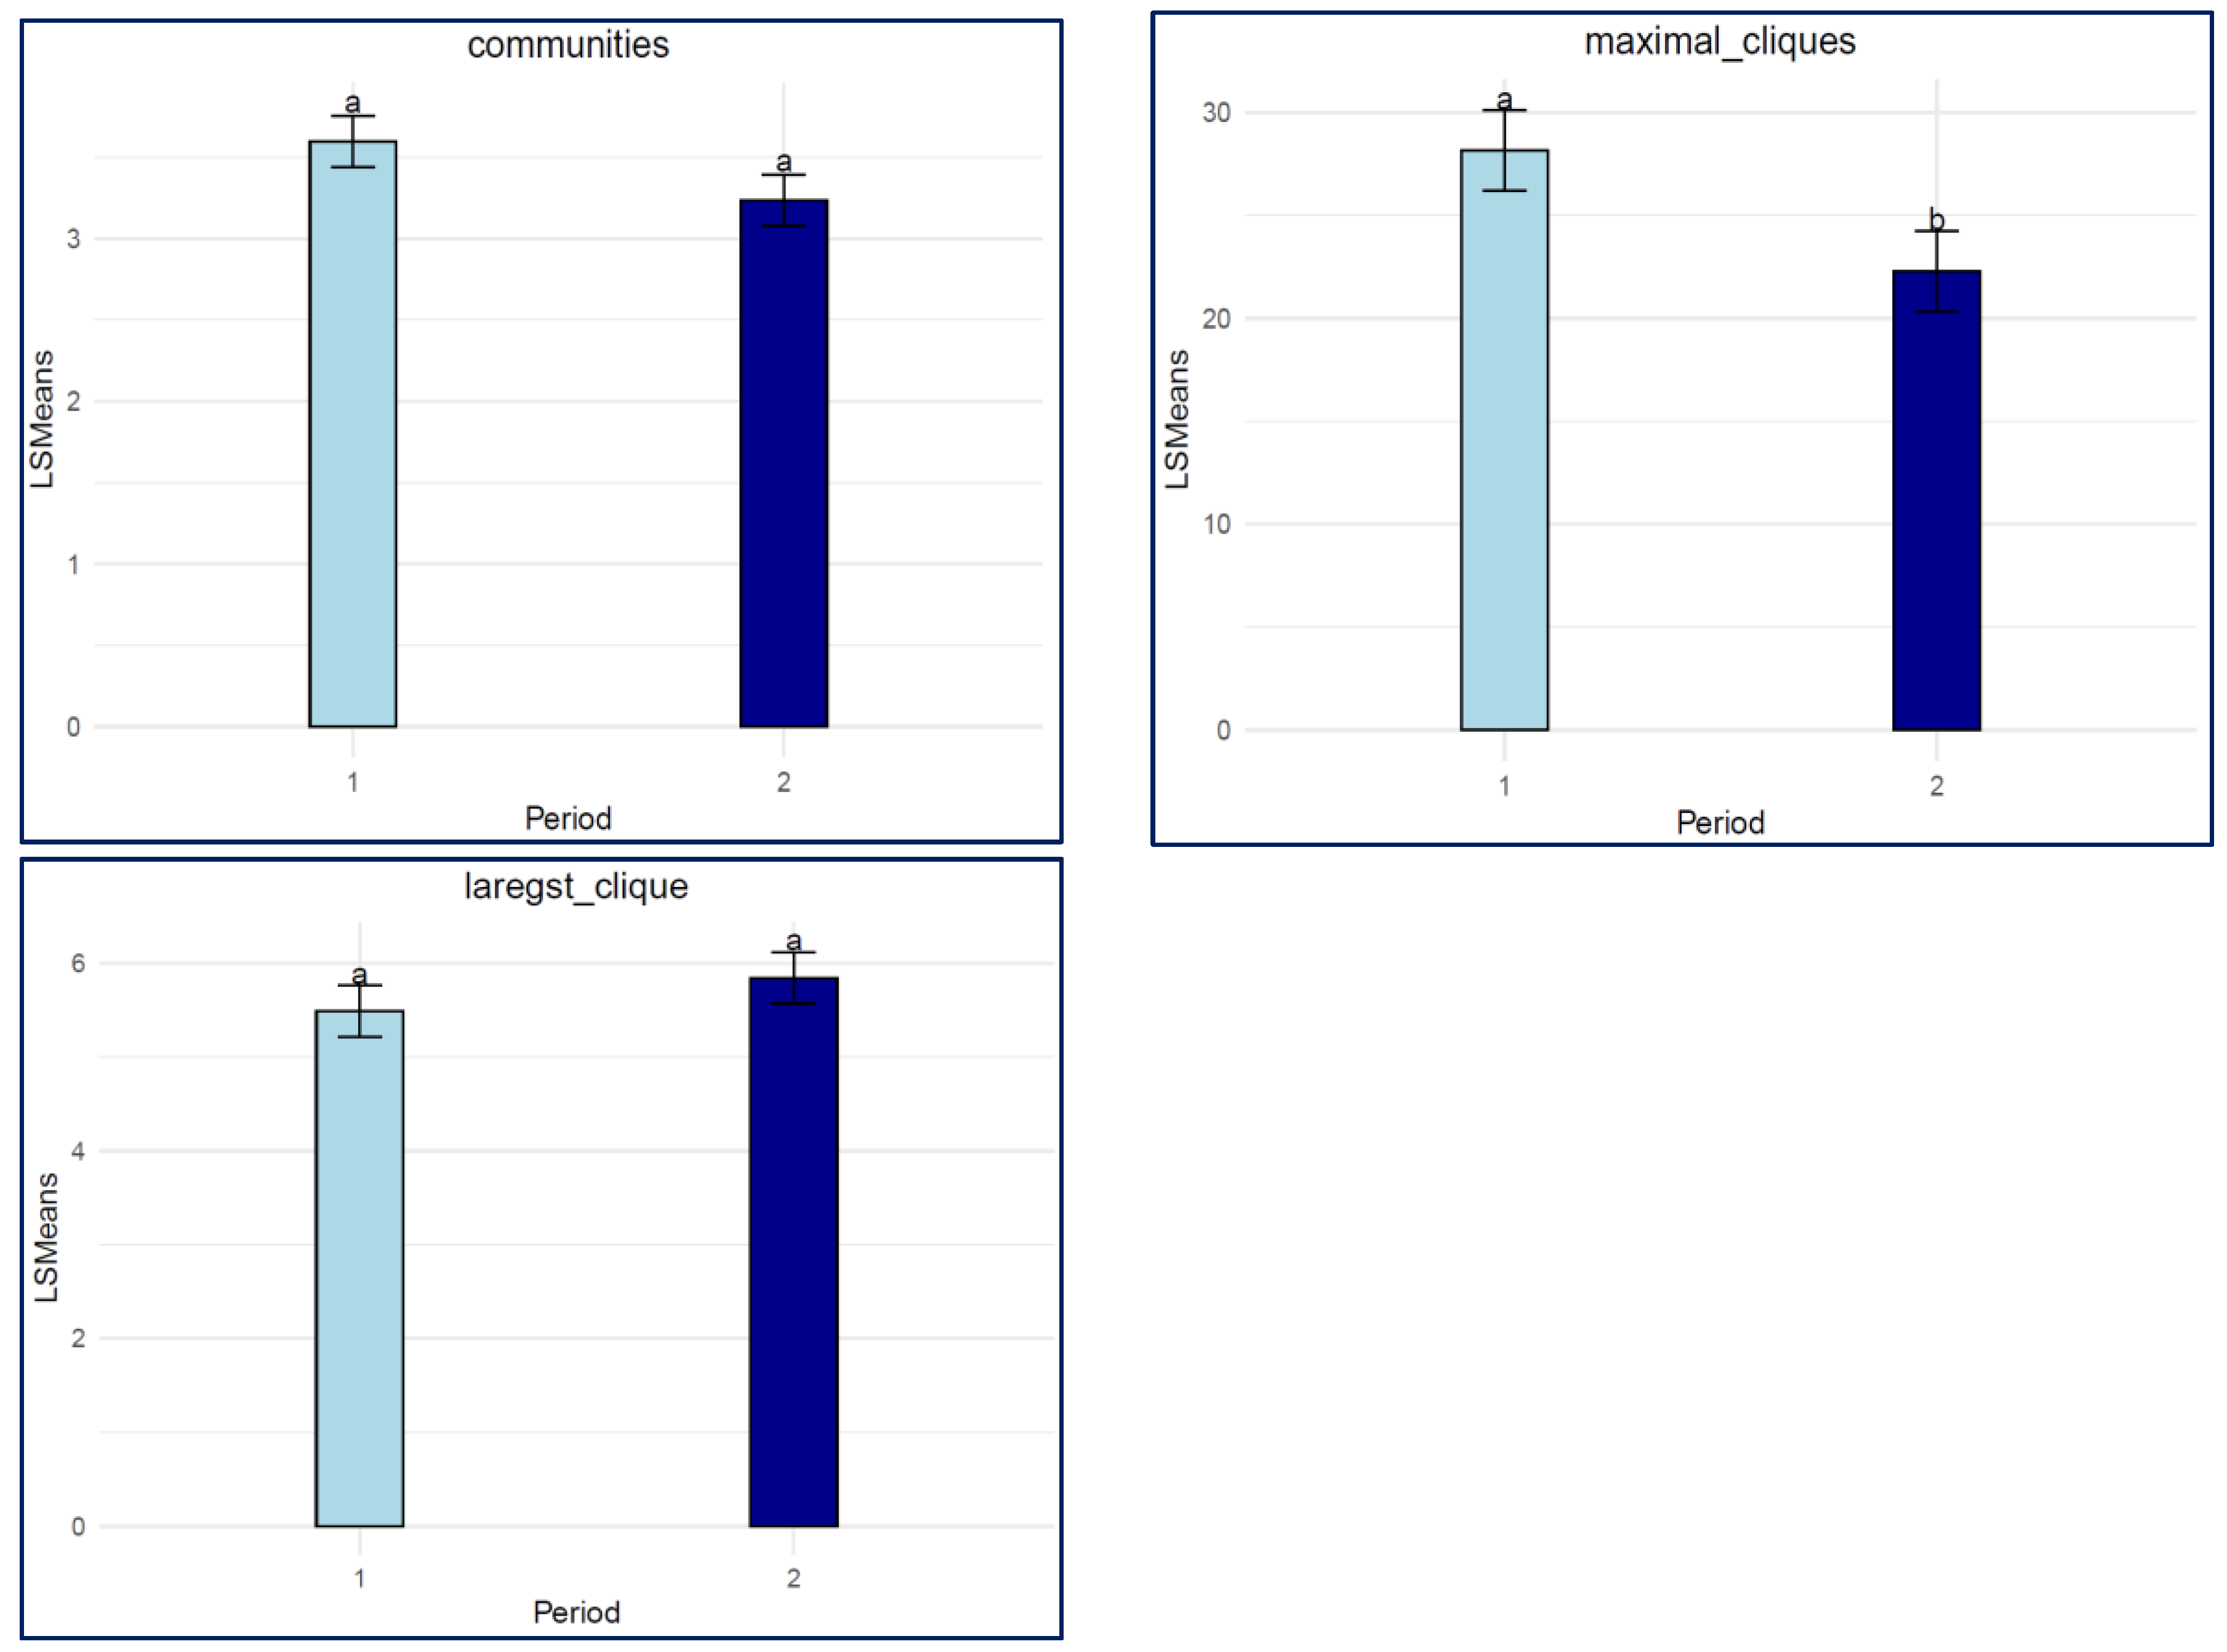
3.2. Communities and Cliques
3.3. Individual SNA Traits
4. Discussion
4.1. Group-Level SNA
4.2. Communities and Cliques
4.3. Individual SNA Traits
4.4. Implications for Management and Breeding
5. Conclusions
Supplementary Materials
Author Contributions
Funding
Institutional Review Board Statement
Informed Consent Statement
Data Availability Statement
Conflicts of Interest
References
- Boumans, I.J.M.M.; de Boer, I.J.M.; Hofstede, G.J.; Bokkers, E.A.M. How social factors and behavioural strategies affect feeding and social interaction patterns in pigs. Physiol. Behav. 2018, 194, 23–40. [Google Scholar] [CrossRef]
- Maselyne, J.; Saeys, W.; Van Nuffel, A. Review: Quantifying animal feeding behaviour with a focus on pigs. Physiol. Behav. 2015, 138, 37–51. [Google Scholar] [CrossRef]
- Wellock, I.J.; Emmans, G.C.; Kyriazakis, I. Predicting the consequences of social stressors on pig food intake and performance. J. Anim. Sci. 2003, 81, 2995–3007. [Google Scholar] [CrossRef] [PubMed]
- Baekbo, P.; Kristensen, C.S.; Larsen, L.E. Porcine circovirus diseases: A review of PMWS. Transbound. Emerg. Dis. 2012, 59 (Suppl. S1), 60–67. [Google Scholar] [CrossRef] [PubMed]
- Chase-Topping, M.; Xie, J.; Pooley, C.; Trus, I.; Bonckaert, C.; Rediger, K.; Bailey, R.I.; Brown, H.; Bitsouni, V.; Barrio, M.B.; et al. New insights about vaccine effectiveness: Impact of attenuated PRRS-strain vaccination on heterologous strain transmission. Vaccine 2020, 38, 3050–3061. [Google Scholar] [CrossRef] [PubMed]
- Brakes, P. Sociality and wild animal welfare: Future directions. Front. Vet. Sci. 2019, 6, 1–7. [Google Scholar] [CrossRef]
- Turner, S.P. Breeding against harmful social behaviours in pigs and chickens: State of the art and the way forward. Appl. Anim. Behav. Sci. 2011, 134, 1–9. [Google Scholar] [CrossRef]
- Wey, T.; Blumstein, D.T.; Shen, W.; Jordán, F. Social network analysis of animal behaviour: A promising tool for the study of sociality. Anim. Behav. 2008, 75, 333–344. [Google Scholar] [CrossRef]
- Croft, D.P.; Madden, J.R.; Franks, D.W.; James, R. Hypothesis testing in animal social networks. Trends Ecol. Evol. 2011, 26, 502–507. [Google Scholar] [CrossRef]
- Farine, D.R.; Whitehead, H. Constructing, conducting and interpreting animal social network analysis. J. Anim. Ecol. 2015, 84, 1144–1163. [Google Scholar] [CrossRef]
- Akkoyunlu, E.A. The Enumeration of Maximal Cliques of Large Graphs. SIAM J. Comput. 2006, 2, 1–6. [Google Scholar] [CrossRef]
- Croft, D.P.; James, R.; Thomas, P.O.R.; Hathaway, C.; Mawdsley, D.; Laland, K.N.; Krause, J. Social structure and co-operative interactions in a wild population of guppies (Poecilia reticulata). Behav. Ecol. Sociobiol. 2006, 59, 644–650. [Google Scholar] [CrossRef]
- Farine, D.R. Measuring phenotypic assortment in animal social networks: Weighted associations are more robust than binary edges. Anim. Behav. 2014, 89, 141–153. [Google Scholar] [CrossRef]
- Agha, S.; Fàbrega, E.; Quintanilla, R.; Sánchez, J.P. Social Network Analysis of Agonistic Behaviour and Its Association with Economically Important Traits in Pigs. Animals 2020, 10, 2123. [Google Scholar] [CrossRef]
- Koene, P.; Ipema, B. Social networks and welfare in future animal management. Animals 2013, 4, 93–118. [Google Scholar] [CrossRef]
- Agha, S.; Foister, S.; Roehe, R.; Turner, S.P.; Doeschl-Wilson, A. Genetic Analysis of Novel Behaviour Traits in Pigs Derived from Social Network Analysis. Genes 2022, 13, 561. [Google Scholar] [CrossRef]
- Foister, S.; Doeschl-Wilson, A.; Roehe, R.; Arnott, G.; Boyle, L.; Turner, S. Social network properties predict chronic aggression in commercial pig systems. PLoS ONE 2018, 13, e0205122. [Google Scholar] [CrossRef]
- Büttner, K.; Czycholl, I.; Mees, K.; Krieter, J. Agonistic Interactions in Pigs–Comparison of Dominance Indices with Parameters Derived from Social Network Analysis in Three Age Groups. Animals 2019, 9, 929. [Google Scholar] [CrossRef] [PubMed]
- Agha, S.; Turner, S.P.; Lewis, C.R.G.; Desire, S.; Roehe, R.; Doeschl-Wilson, A. Genetic Associations of Novel Behaviour Traits Derived from Social Network Analysis with Growth, Feed Efficiency, and Carcass Characteristics in Pigs. Genes 2022, 13, 1616. [Google Scholar] [CrossRef]
- Frost, A.R.; Schofield, C.P.; Beaulah, S.A.; Mottram, T.T.; Lines, J.A.; Wathes, C.M. A review of livestock monitoring and the need for integrated systems. Comput. Electron. Agric. 1997, 17, 139–159. [Google Scholar] [CrossRef]
- Riekert, M.; Klein, A.; Adrion, F.; Hoffmann, C.; Gallmann, E. Automatically detecting pig position and posture by 2D camera imaging and deep learning. Comput. Electron. Agric. 2020, 174, 105391. [Google Scholar] [CrossRef]
- Ocepek, M.; Žnidar, A.; Lavrič, M.; Škorjanc, D.; Andersen, I.L. DigiPig: First Developments of an Automated Monitoring System for Body, Head and Tail Detection in Intensive Pig Farming. Agriculture 2021, 12, 2. [Google Scholar] [CrossRef]
- Zhang, Z.; Zhang, H.; He, Y.; Liu, T. A Review in the Automatic Detection of Pigs Behavior with Sensors. J. Sens. 2022, 2022, 4519539. [Google Scholar] [CrossRef]
- Hollifield, M.K.; Chen, C.Y.; Psota, E.; Holl, J.; Lourenco, D.; Misztal, I. Estimating genetic parameters of digital behavior traits and their relationship with production traits in purebred pigs. Genet. Sel. Evol. 2024, 56, 29. [Google Scholar] [CrossRef]
- Yang, Q.; Xiao, D. A review of video-based pig behavior recognition. Appl. Anim. Behav. Sci. 2020, 233, 105146. [Google Scholar] [CrossRef]
- Pishchulin, L.; Insafutdinov, E.; Tang, S.; Andres, B.; Andriluka, M.; Gehler, P.; Schiele, B. DeepCut: Joint subset partition and labeling for multi person pose estimation. In Proceedings of the IEEE Computer Society Conference on Computer Vision and Pattern Recognition 2016, Las Vegas, NV, USA, 27–30 June 2016; pp. 4929–4937. [Google Scholar] [CrossRef]
- Kuhn, H.W. The Hungarian method for the assignment problem. Nav. Res. Logist. Q. 1955, 2, 83–97. [Google Scholar] [CrossRef]
- Peace, J.B.; Psota, E.; Liu, Y.; Pérez, L.C. E2ETag: An End-to-End Trainable Method for Generating and Detecting Fiducial Markers. In Proceedings of the British Machine Vision Conference (BMVC), Manchester, UK, 7–10 September 2020. [Google Scholar]
- Psota, E.; Fitzgerald, R.; Herring, W. Random 4-Characters Animal ID using Human-Readable Fiducials and Simulation-Based Training. In Proceedings of the CV4 Animals Workshop in Conjunction with the IEEE Computer Vision and Pattern Recognition (CVPR), New Orleans, LA, USA, 28–24 June 2022. [Google Scholar]
- Robitaille, A.L.; Webber, Q.M.R.; Vander Wal, E. Conducting social network analysis with animal telemetry data: Applications and methods using spatsoc. Methods Ecol. Evol. 2019, 10, 1203–1211. [Google Scholar] [CrossRef]
- Farine, D.R. Animal social network inference and permutations for ecologists in R using asnipe. Methods Ecol. Evol. 2013, 4, 1187–1194. [Google Scholar] [CrossRef]
- Butts, T. “Sna” Package in R Software. 2019. Available online: https://cran.r-project.org/web/packages/sna/index.html (accessed on 1 October 2023).
- Oksanen, J.; Simpson, G.; Blanchet, F.; Kindt, R.; Legendre, P.; Minchin, P.; O’Hara, R.; Solymos, P.; Stevens, M.; Szoecs, E.; et al. vegan: Community Ecology Package. R package version 2.7-0. 2025. Available online: https://github.com/vegandevs/vegan (accessed on 1 October 2023).
- Csardi, G.; Nepusz, T.; Traag, V.; Horvát, S.; Zanini, F.; Noom, D.; Müller, K.; igraph: Network Analysis and Visualization in R. R package version 2.1.4. 2025. Available online: https://CRAN.R-project.org/package=igraph (accessed on 1 October 2023).
- Camerlink, I.; Scheck, K.; Cadman, T.; Rault, J.L. Lying in spatial proximity and active social behaviours capture different information when analysed at group level in indoor-housed pigs. Appl. Anim. Behav. Sci. 2022, 246, 105540. [Google Scholar] [CrossRef]
- Blondel, V.D.; Guillaume, J.L.; Lambiotte, R.; Lefebvre, E. Fast unfolding of communities in large networks. J. Stat. Mech. Theory Exp. 2008, 2008, P10008. [Google Scholar] [CrossRef]
- Wasserman, S.; Faust, K. Social Network Analysis; Cambridge University Press: Cambridge, UK, 1994. [Google Scholar] [CrossRef]
- Newman, M.E. Finding Community Structure in Networks Using the Eigenvectors of Matrices. Phys. Rev. E 2006, 74, 036104. [Google Scholar] [CrossRef]
- Freeman, L.C. Centrality in social networks conceptual clarification. Soc. Netw. 1978, 1, 215–239. [Google Scholar] [CrossRef]
- Newman, M.E.J. Modularity and community structure in networks. Proc. Natl. Acad. Sci. USA 2006, 103, 8577–8582. [Google Scholar] [CrossRef] [PubMed]
- Seifikar, M.; Farzi, S.; Barati, M. C-Blondel: An Efficient Louvain-Based Dynamic Community Detection Algorithm. IEEE Trans. Comput. Soc. Syst. 2020, 7, 308–318. [Google Scholar] [CrossRef]
- Makino, K.; Uno, T. New Algorithms for Enumerating All Maximal Cliques. Lect. Notes Comput. Sci. 2004, 3111, 260–272. [Google Scholar] [CrossRef]
- Croft, D.P.; Darden, S.K.; Wey, T.W. Current directions in animal social networks. Curr. Opin. Behav. Sci. 2016, 12, 52–58. [Google Scholar] [CrossRef]
- Alameer, A.; Buijs, S.; O’Connell, N.; Dalton, L.; Larsen, M.; Pedersen, L.; Kyriazakis, I. Automated detection and quantification of contact behaviour in pigs using deep learning. Biosyst. Eng. 2022, 224, 118–130. [Google Scholar] [CrossRef]
- Matthews, S.G.; Miller, A.L.; Plötz, T.; Kyriazakis, I. Automated tracking to measure behavioural changes in pigs for health and welfare monitoring. Sci. Rep. 2017, 7, 17582. [Google Scholar] [CrossRef]
- Goumon, S.; Illmann, G.; Leszkowová, I.; Dostalová, A.; Cantor, M. Dyadic affiliative preferences in a stable group of domestic pigs. Appl. Anim. Behav. Sci. 2020, 230, 105045. [Google Scholar] [CrossRef]
- Coutellier, L.; Arnould, C.; Boissy, A.; Orgeur, P.; Prunier, A.; Veissier, I.; Meunier-Salaün, M.C. Pig’s responses to repeated social regrouping and relocation during the growing-finishing period. Appl. Anim. Behav. Sci. 2007, 105, 102–114. [Google Scholar] [CrossRef]
- Oldham, L.; Camerlink, I.; Arnott, G.; Doeschl-Wilson, A.; Farish, M.; Turner, S.P. Winner–loser effects overrule aggressiveness during the early stages of contests between pigs. Sci. Rep. 2020, 10, 13338. [Google Scholar] [CrossRef] [PubMed]
- Weller, J.E.; Camerlink, I.; Turner, S.P.; Farish, M.; Arnott, G. Socialisation and its effect on play behaviour and aggression in the domestic pig (Sus scrofa). Sci. Rep. 2019, 9, 1–11. [Google Scholar] [CrossRef]
- Peden, R.S.E.; Turner, S.P.; Boyle, L.A.; Camerlink, I. The translation of animal welfare research into practice: The case of mixing aggression between pigs. Appl. Anim. Behav. Sci. 2018, 204, 1–9. [Google Scholar] [CrossRef]
- Peden, R.S.E.; Akaichi, F.; Camerlink, I.; Boyle, L.A.; Turner, S.P. Factors influencing farmer willingness to reduce aggression between pigs. Animals 2019, 9, 6. [Google Scholar] [CrossRef] [PubMed]
- Dubé, C.; Kelton, D.F.; Dubé, C.; Ribble, C.; Kelton, D.; Mcnab, B. Inroduction to network analysis and its implications for animal disease modelling Introduction to network analysis and its implications for animal disease modelling. Rev. Sci. Tech. 2011, 30, 425–436. [Google Scholar] [CrossRef]
- Pasquaretta, C.; Levé, M.; Claidiere, N.; Van De Waal, E.; Whiten, A.; MacIntosh, A.J.J.; Pelé, M.; Bergstrom, M.L.; Borgeaud, C.; Brosnan, S.F.; et al. Social networks in primates: Smart and tolerant species have more efficient networks. Sci. Rep. 2014, 4, 1–8. [Google Scholar] [CrossRef]
- Cheney, D.L.; Silk, J.B.; Seyfarth, R.M. Network connections, dyadic bonds and fitness in wild female baboons. R. Soc. Open Sci. 2016, 3, 160255. [Google Scholar] [CrossRef]
- Llonch, P.; Mainau, E.; Temple, D.; Manteca, X. Aggression in Pigs and Its Welfare Consequences. Fawec 2017, 19, 1–2. [Google Scholar]
- Alba-Casals, A.; Allue, E.; Tarancon, V.; Baliellas, J.; Novell, E.; Napp, S.; Fraile, L. Near Real-Time Monitoring of Clinical Events Detected in Swine Herds in Northeastern Spain. Front. Vet. Sci. 2020, 7, 68. [Google Scholar] [CrossRef]
- Lichoti, J.K.; Davies, J.; Kitala, P.M.; Githigia, S.M.; Okoth, E.; Maru, Y.; Bukachi, S.A.; Bishop, R.P. Social network analysis provides insights into African swine fever epidemiology. Prev. Vet. Med. 2016, 126, 1–10. [Google Scholar] [CrossRef]
- Chen, S.; White, B.J.; Sanderson, M.W.; Amrine, D.E.; Ilany, A.; Lanzas, C. Highly dynamic animal contact network and implications on disease transmission. Sci. Rep. 2014, 4, 4472. [Google Scholar] [CrossRef]


| Measure | Definition |
|---|---|
| Proximity | Proximity was defined by a threshold of 0.5 m Euclidean distance between the shoulders of the “standing” pigs, which was sustained for a duration longer than the average interaction time between each pair of individuals within each pen each day. |
| Weighted SNA graph | A representation of a network where the edges (interactions) between nodes (animals) are assigned numerical values (weights) that reflect the duration of the interactions (proximity). |
| Individual degree centrality | The number of edges (i.e., interactions) attached to a node (animal). |
| Individual betweenness centrality | Betweenness centrality in a weighted network represents how often a node (or individual) acts as a bridge along the shortest paths between other nodes. |
| Individual closeness centrality | The sum of the direct connections between a focal node and other nodes in the network. |
| Individual eigenvector centrality | The connectivity of a node according to the all-degree centrality of the node and the all-degree centrality of the nodes that it connects with [16,38]. |
| Individual clustering coefficient | The proportion of an individual node’s connections that are also connected with each other relative to the number of theoretically possible connections [10]. |
| Centralization | A graph-level centralization is computed from the individual centrality scores of the nodes using the formula where Cmax is the centrality of the most central node. Ci is the centrality of the node, and the centralization was normalized by dividing by the maximum theoretical score for a graph with the same number of nodes [39]. For degree, closeness and betweenness centralization, the most centralized structure is a network where a small number of nodes hold most of the connections. For eigenvector centralization, a high centralization graph indicates that a small number of nodes have a very high eigenvector centrality, while the majority have much lower values. |
| Density | The ratio of the number of edges of the network relative to the total number of possible edges in a group of the same size. |
| Modularity | The strength of the division of a network into communities. It evaluates how well the network is divided into subgroups, where nodes within the same subgroup (or community) are more densely connected to each other than to nodes in other groups [40]. |
| Community detection | The process of identifying subgroups or clusters of nodes within a network that are more densely connected internally compared to the connections in the network [40]. |
| Modularity-based community detections method | The modularity-based method, using the Louvain algorithm for community detections, aims to maximize the modularity score to identify densely connected subgroups within the network [41]. |
| Clique | A subset of nodes where every node is directly connected to every other node in the subset. |
| Maximal clique | A clique is maximal if there is no node in the graph that can be added to this clique to create a larger clique without violating the clique property [42]. |
| Co-membership | The relationship between nodes based on shared membership in specific cliques. |
| Largest clique size | A clique with the maximum number of nodes among all cliques in that graph [42]. |
| Pen | Period | Group Degree | Group Closeness | Group Eigenvector | Group Betweenness | Density | Modularity | ||||||||||||
|---|---|---|---|---|---|---|---|---|---|---|---|---|---|---|---|---|---|---|---|
| Mean (SD) | Max | Min | Mean (SD) | Max | Min | Mean (SD) | Max | Min | Mean (SD) | Max | Min | Mean (SD) | Max | Min | Mean (SD) | Max | Min | ||
| 1 | 1 | 0.36 (0.08) | 0.44 | 0.28 | 0.30 (0.27) | 0.50 | 0.00 | 0.48 (0.06) | 0.53 | 0.41 | 0.12 (0.07) | 0.18 | 0.04 | 0.40 (0.04) | 0.44 | 0.36 | 0.15 (0.06) | 0.22 | 0.10 |
| 1 | 2 | 0.37 (0.08) | 0.47 | 0.32 | 0.42 (0.12) | 0.56 | 0.35 | 0.45 (0.01) | 0.45 | 0.45 | 0.18 (0.05) | 0.24 | 0.14 | 0.40 (0.02) | 0.42 | 0.39 | 0.12 (0.04) | 0.15 | 0.08 |
| 2 | 1 | 0.25 (0.06) | 0.32 | 0.20 | 0.29 (0.09) | 0.39 | 0.23 | 0.37 (0.05) | 0.42 | 0.33 | 0.09 (0.01) | 0.10 | 0.08 | 0.44 (0.02) | 0.46 | 0.42 | 0.19 (0.02) | 0.20 | 0.17 |
| 2 | 2 | 0.3 (0.13) | 0.45 | 0.22 | 0.35 (0.18) | 0.55 | 0.23 | 0.42 (0.04) | 0.46 | 0.39 | 0.14 (0.1) | 0.25 | 0.08 | 0.42 (0.01) | 0.43 | 0.41 | 0.14 (0.03) | 0.17 | 0.11 |
| 3 | 1 | 0.31 (0.1) | 0.41 | 0.22 | 0.34 (0.12) | 0.48 | 0.24 | 0.40 (0.07) | 0.47 | 0.33 | 0.12 (0.05) | 0.18 | 0.08 | 0.42 (0.01) | 0.42 | 0.42 | 0.15 (0.03) | 0.18 | 0.12 |
| 3 | 2 | 0.26 (0.09) | 0.36 | 0.20 | 0.32 (0.11) | 0.45 | 0.24 | 0.43 (0.04) | 0.46 | 0.39 | 0.11 (0.04) | 0.15 | 0.08 | 0.41 (0.03) | 0.44 | 0.38 | 0.18 (0.02) | 0.19 | 0.16 |
| 4 | 1 | 0.31 (0.03) | 0.34 | 0.28 | 0.13 (0.22) | 0.38 | 0.00 | 0.41 (0.02) | 0.43 | 0.40 | 0.10 (0.06) | 0.16 | 0.04 | 0.44 (0.01) | 0.44 | 0.43 | 0.13 (0.04) | 0.17 | 0.10 |
| 4 | 2 | 0.37 (0.04) | 0.40 | 0.33 | 0.45 (0.02) | 0.46 | 0.43 | 0.45 (0.03) | 0.47 | 0.41 | 0.16 (0.03) | 0.18 | 0.12 | 0.44 (0.04) | 0.48 | 0.41 | 0.14 (0.03) | 0.17 | 0.12 |
| 5 | 1 | 0.27 (0.01) | 0.28 | 0.26 | 0.30 (0.03) | 0.32 | 0.27 | 0.42 (0.03) | 0.46 | 0.40 | 0.09 (0.02) | 0.10 | 0.07 | 0.41 (0.03) | 0.44 | 0.39 | 0.18 (0.01) | 0.18 | 0.17 |
| 5 | 2 | 0.39 (0.01) | 0.40 | 0.38 | 0.45 (0.01) | 0.46 | 0.44 | 0.47 (0.05) | 0.51 | 0.42 | 0.14 (0.04) | 0.18 | 0.10 | 0.41 (0.02) | 0.43 | 0.39 | 0.15 (0.03) | 0.17 | 0.12 |
| 6 | 1 | 0.33 (0.08) | 0.42 | 0.26 | 0.37 (0.11) | 0.49 | 0.29 | 0.43 (0.07) | 0.50 | 0.36 | 0.10 (0.05) | 0.15 | 0.06 | 0.44 (0.02) | 0.46 | 0.42 | 0.14 (0.02) | 0.15 | 0.12 |
| 6 | 2 | 0.38 (0.04) | 0.42 | 0.34 | 0.47 (0.06) | 0.54 | 0.42 | 0.45 (0.01) | 0.45 | 0.44 | 0.16 (0.03) | 0.18 | 0.12 | 0.44 (0.02) | 0.46 | 0.42 | 0.16 (0.06) | 0.22 | 0.11 |
| Pen | Period | No. of Communities | No. of Maximal Cliques | Largest Clique Size | ||||||
|---|---|---|---|---|---|---|---|---|---|---|
| Mean (SD) | Max | Min | Mean (SD) | Max | Min | Mean (SD) | Max | Min | ||
| 1 | 1 | 4.0 (1.0) | 5.0 | 3.0 | 27.7 (4.7) | 33.0 | 24.0 | 5.3 (0.6) | 6.0 | 5.0 |
| 2 | 3.0 (0.0) | 3.0 | 3.0 | 20.0 (6.2) | 25.0 | 13.0 | 6.7 (1.2) | 8.0 | 6.0 | |
| 2 | 1 | 3.0 (1.00) | 4.0 | 2.0 | 29.0 (2.0) | 31.0 | 27.0 | 5.7 (0.6) | 6.0 | 5.0 |
| 2 | 3.7 (0.60) | 4.0 | 3.0 | 26.0 (7.2) | 34.0 | 20.0 | 5.3 (0.6) | 6.0 | 5.0 | |
| 3 | 1 | 3.3 (0.60) | 4.0 | 3.0 | 24.0 (2.0) | 26.0 | 22.0 | 5.3 (0.6) | 6.0 | 5.0 |
| 2 | 3.3 (0.60) | 4.0 | 3.0 | 16.0 (5.3) | 22.0 | 12.0 | 5.3 (1.2) | 6.0 | 4.0 | |
| 4 | 1 | 4.0 (0) | 4.0 | 4.0 | 24.3 (3.1) | 27.0 | 21.0 | 6.3 (0.6) | 7.0 | 6.0 |
| 2 | 3.0 (0) | 3.0 | 3.0 | 24.7 (2.1) | 27.0 | 23.0 | 5.0 (1.0) | 6.0 | 4.0 | |
| 5 | 1 | 3.7 (0.6) | 4.0 | 3.0 | 32.0 (3.5) | 34.0 | 28.0 | 5.3 (0.6) | 6.0 | 5.0 |
| 2 | 3.7 (0.6) | 4.0 | 3.0 | 25.3 (2.5) | 28.0 | 23.0 | 5.7 (0.6) | 6.0 | 5.0 | |
| 6 | 1 | 3.0 (0) | 3.0 | 3.0 | 33.7 (2.5) | 36.0 | 31.0 | 5.3 (0.6) | 6.0 | 5.0 |
| 2 | 3.3 (0.6) | 4.0 | 3.0 | 20.0 (2.0) | 22.0 | 18.0 | 6.7 (0.6) | 7.0 | 6.0 | |
| Trait | Early Growing Period | Later Growing Period | ||||
|---|---|---|---|---|---|---|
| Mean (SD) | Max | Min | Mean (SD) | Max | Min | |
| Individual degree centrality | 0.42 (0.16) | 0.83 | 0 | 0.42 (0.18) | 0.90 | 0.06 |
| Individual closeness centrality | 0.02 (0.001) | 0.03 | 0 | 0.03 (0.01) | 0.05 | 0.01 |
| Individual betweenness centrality | 0.04 (0.04) | 0.23 | 0 | 0.04 (0.05) | 0.29 | 0.00 |
| Individual eigenvector centrality | 0.56 (0.24) | 1.00 | 0 | 0.53 (0.26) | 1.00 | 0.04 |
| Individual clustering coefficient | 0.55 (0.17) | 1.00 | 0 | 0.60 (0.20) | 1.00 | 0.00 |
Disclaimer/Publisher’s Note: The statements, opinions and data contained in all publications are solely those of the individual author(s) and contributor(s) and not of MDPI and/or the editor(s). MDPI and/or the editor(s) disclaim responsibility for any injury to people or property resulting from any ideas, methods, instructions or products referred to in the content. |
© 2025 by the authors. Licensee MDPI, Basel, Switzerland. This article is an open access article distributed under the terms and conditions of the Creative Commons Attribution (CC BY) license (https://creativecommons.org/licenses/by/4.0/).
Share and Cite
Agha, S.; Psota, E.; Turner, S.P.; Lewis, C.R.G.; Steibel, J.P.; Doeschl-Wilson, A. Revealing the Hidden Social Structure of Pigs with AI-Assisted Automated Monitoring Data and Social Network Analysis. Animals 2025, 15, 996. https://doi.org/10.3390/ani15070996
Agha S, Psota E, Turner SP, Lewis CRG, Steibel JP, Doeschl-Wilson A. Revealing the Hidden Social Structure of Pigs with AI-Assisted Automated Monitoring Data and Social Network Analysis. Animals. 2025; 15(7):996. https://doi.org/10.3390/ani15070996
Chicago/Turabian StyleAgha, Saif, Eric Psota, Simon P. Turner, Craig R. G. Lewis, Juan Pedro Steibel, and Andrea Doeschl-Wilson. 2025. "Revealing the Hidden Social Structure of Pigs with AI-Assisted Automated Monitoring Data and Social Network Analysis" Animals 15, no. 7: 996. https://doi.org/10.3390/ani15070996
APA StyleAgha, S., Psota, E., Turner, S. P., Lewis, C. R. G., Steibel, J. P., & Doeschl-Wilson, A. (2025). Revealing the Hidden Social Structure of Pigs with AI-Assisted Automated Monitoring Data and Social Network Analysis. Animals, 15(7), 996. https://doi.org/10.3390/ani15070996