
Genetic Diversity and Population Structure of Largefin Longbarbel Catfish (Hemibagrus macropterus) Inferred by mtDNA and Microsatellite DNA Markers
 ,
,
Simple Summary
Abstract
1. Introduction
2. Materials and Methods
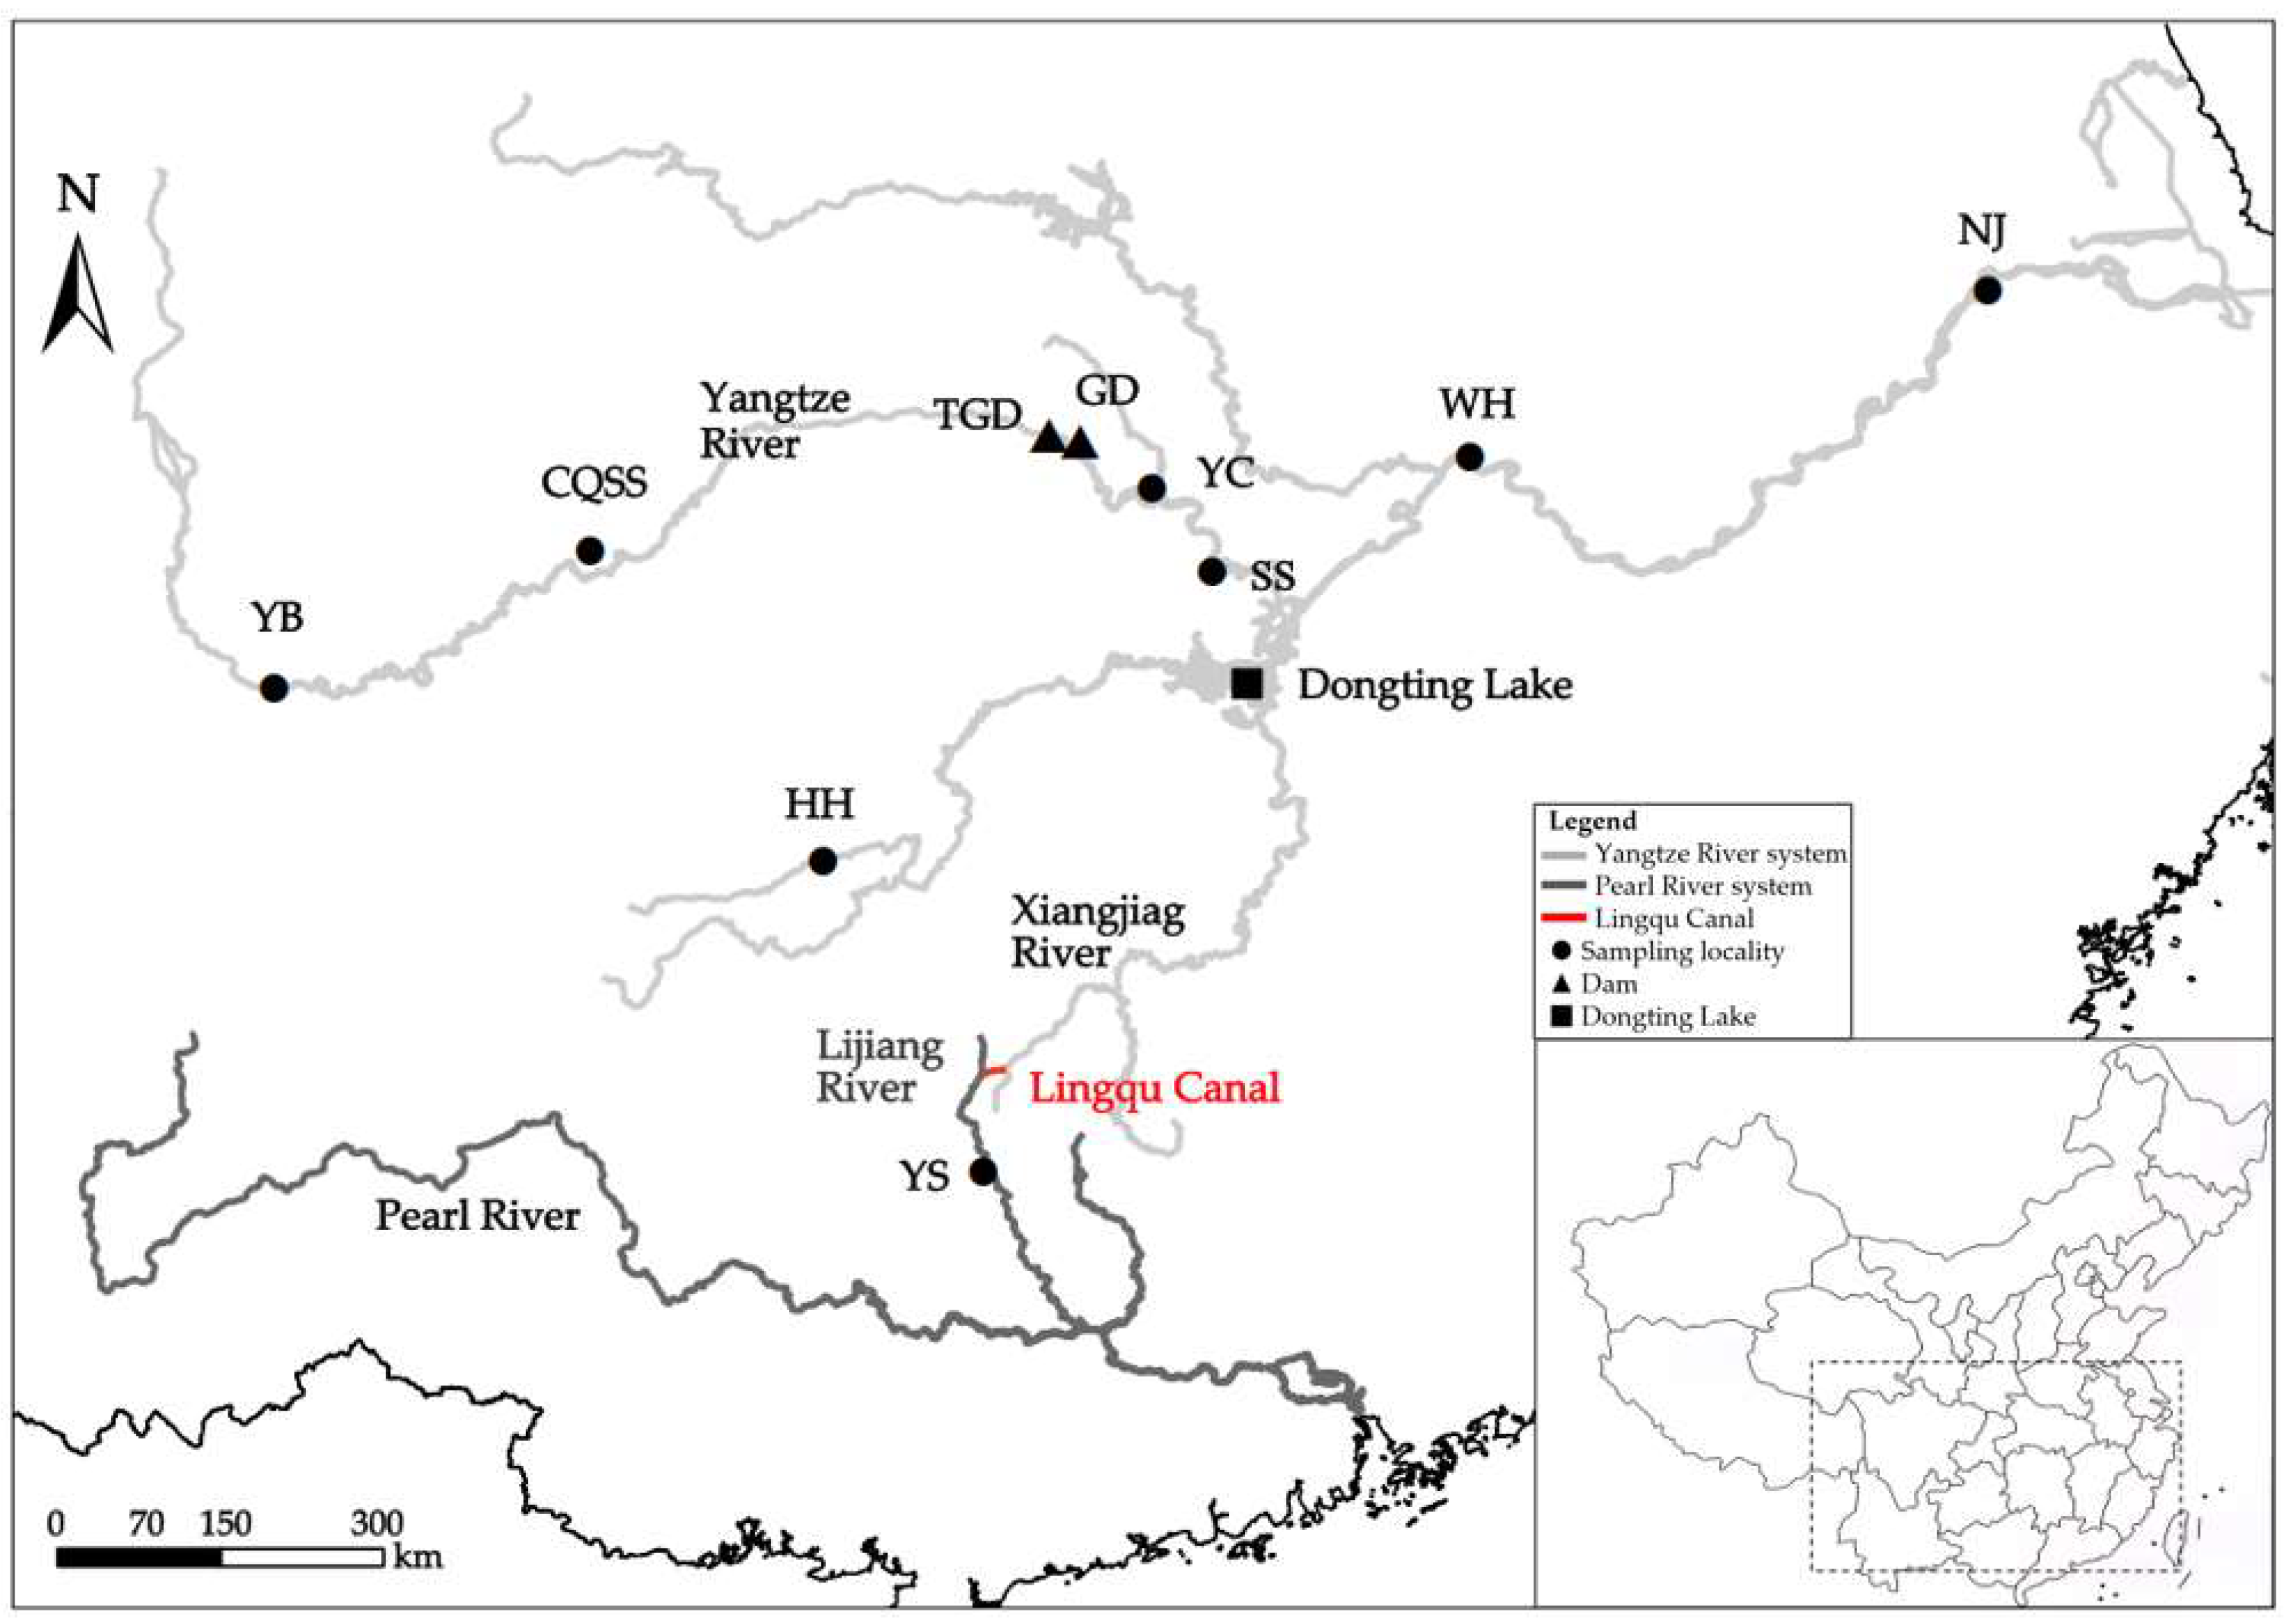
2.1. Sample Collection and DNA Extraction
2.2. Amplication of Cytb Gene Sequence in Largefin Longbarbel Catfish
2.3. Microsatellite Amplification and Typing in Largefin Longbarbel Catfish
2.4. Data Analysis of Cytb in Largefin Longbarbel Catfish
2.5. Data Analysis of SSR in Largefin Longbarbel Catfish
3. Results
3.1. Genetic Diversity
3.1.1. Genetic Diversity of Cytb in Largefin Longbarbel Catfish
3.1.2. SSRs Polymorphism and Genetic Variation in Largefin Longbarbel Catfish
3.2. Genetic Differentiation and Population Structure
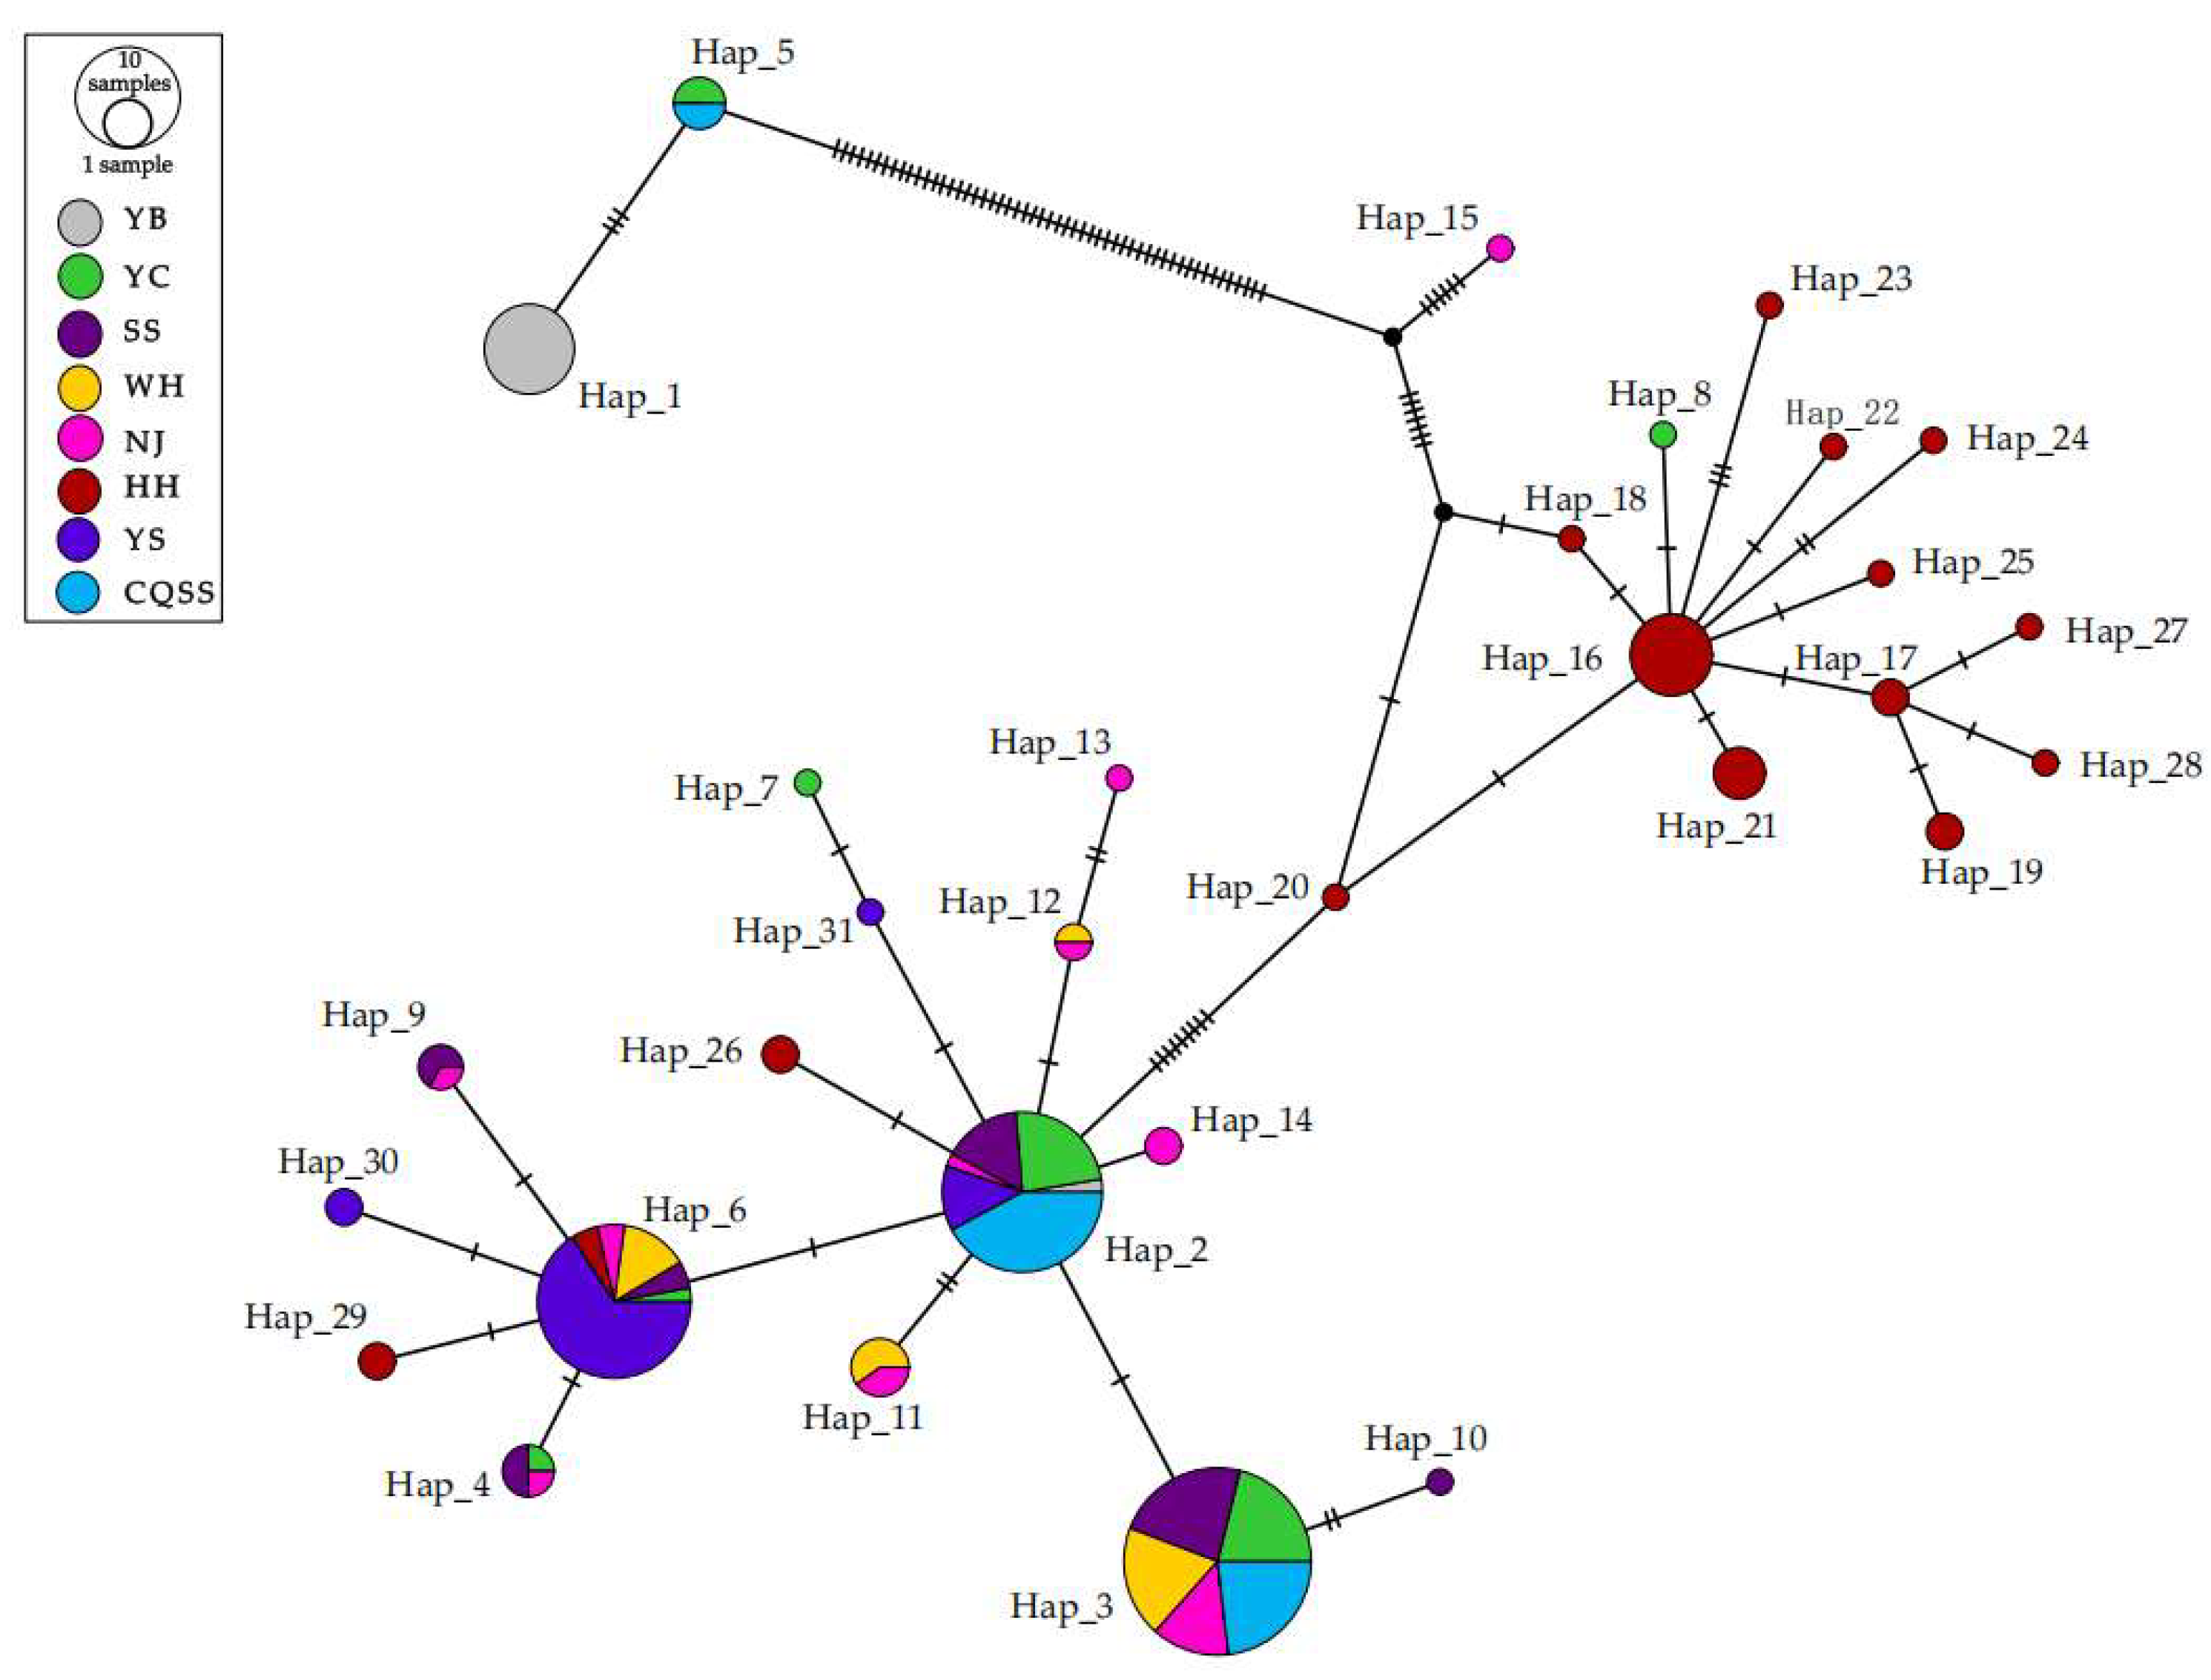
3.2.1. Genetic Differentiation and Population Structure Based on Cytb
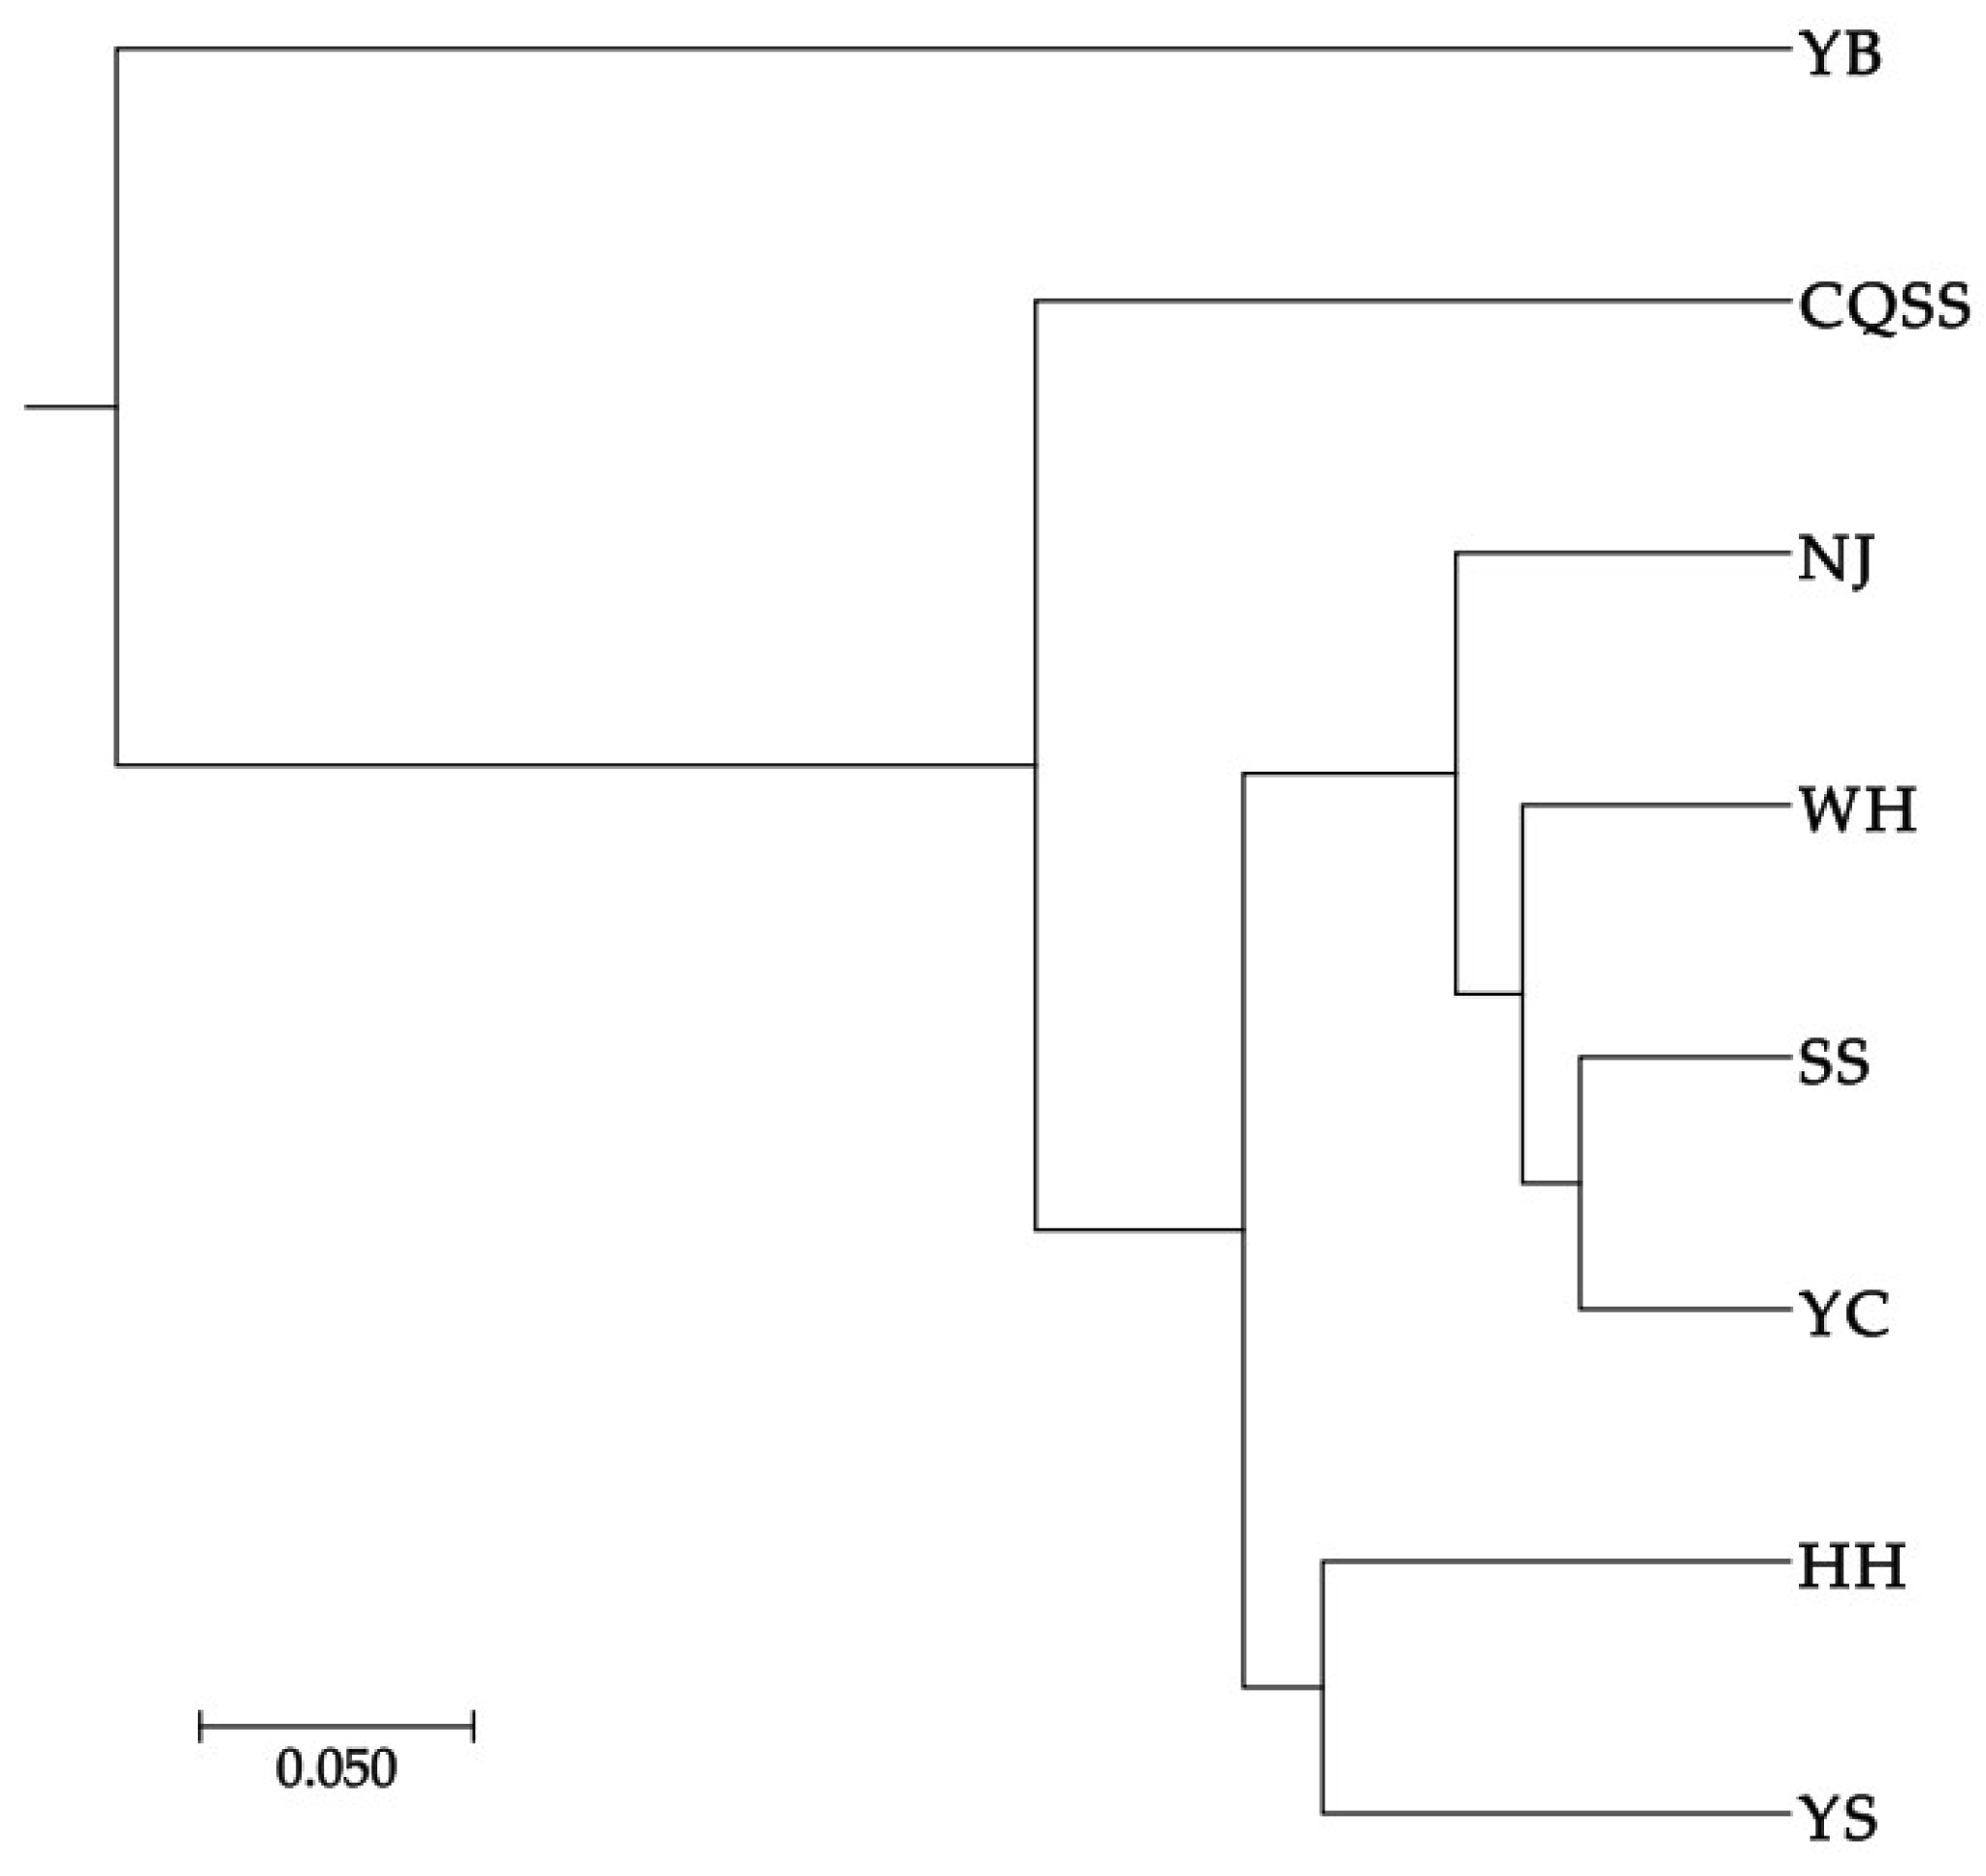
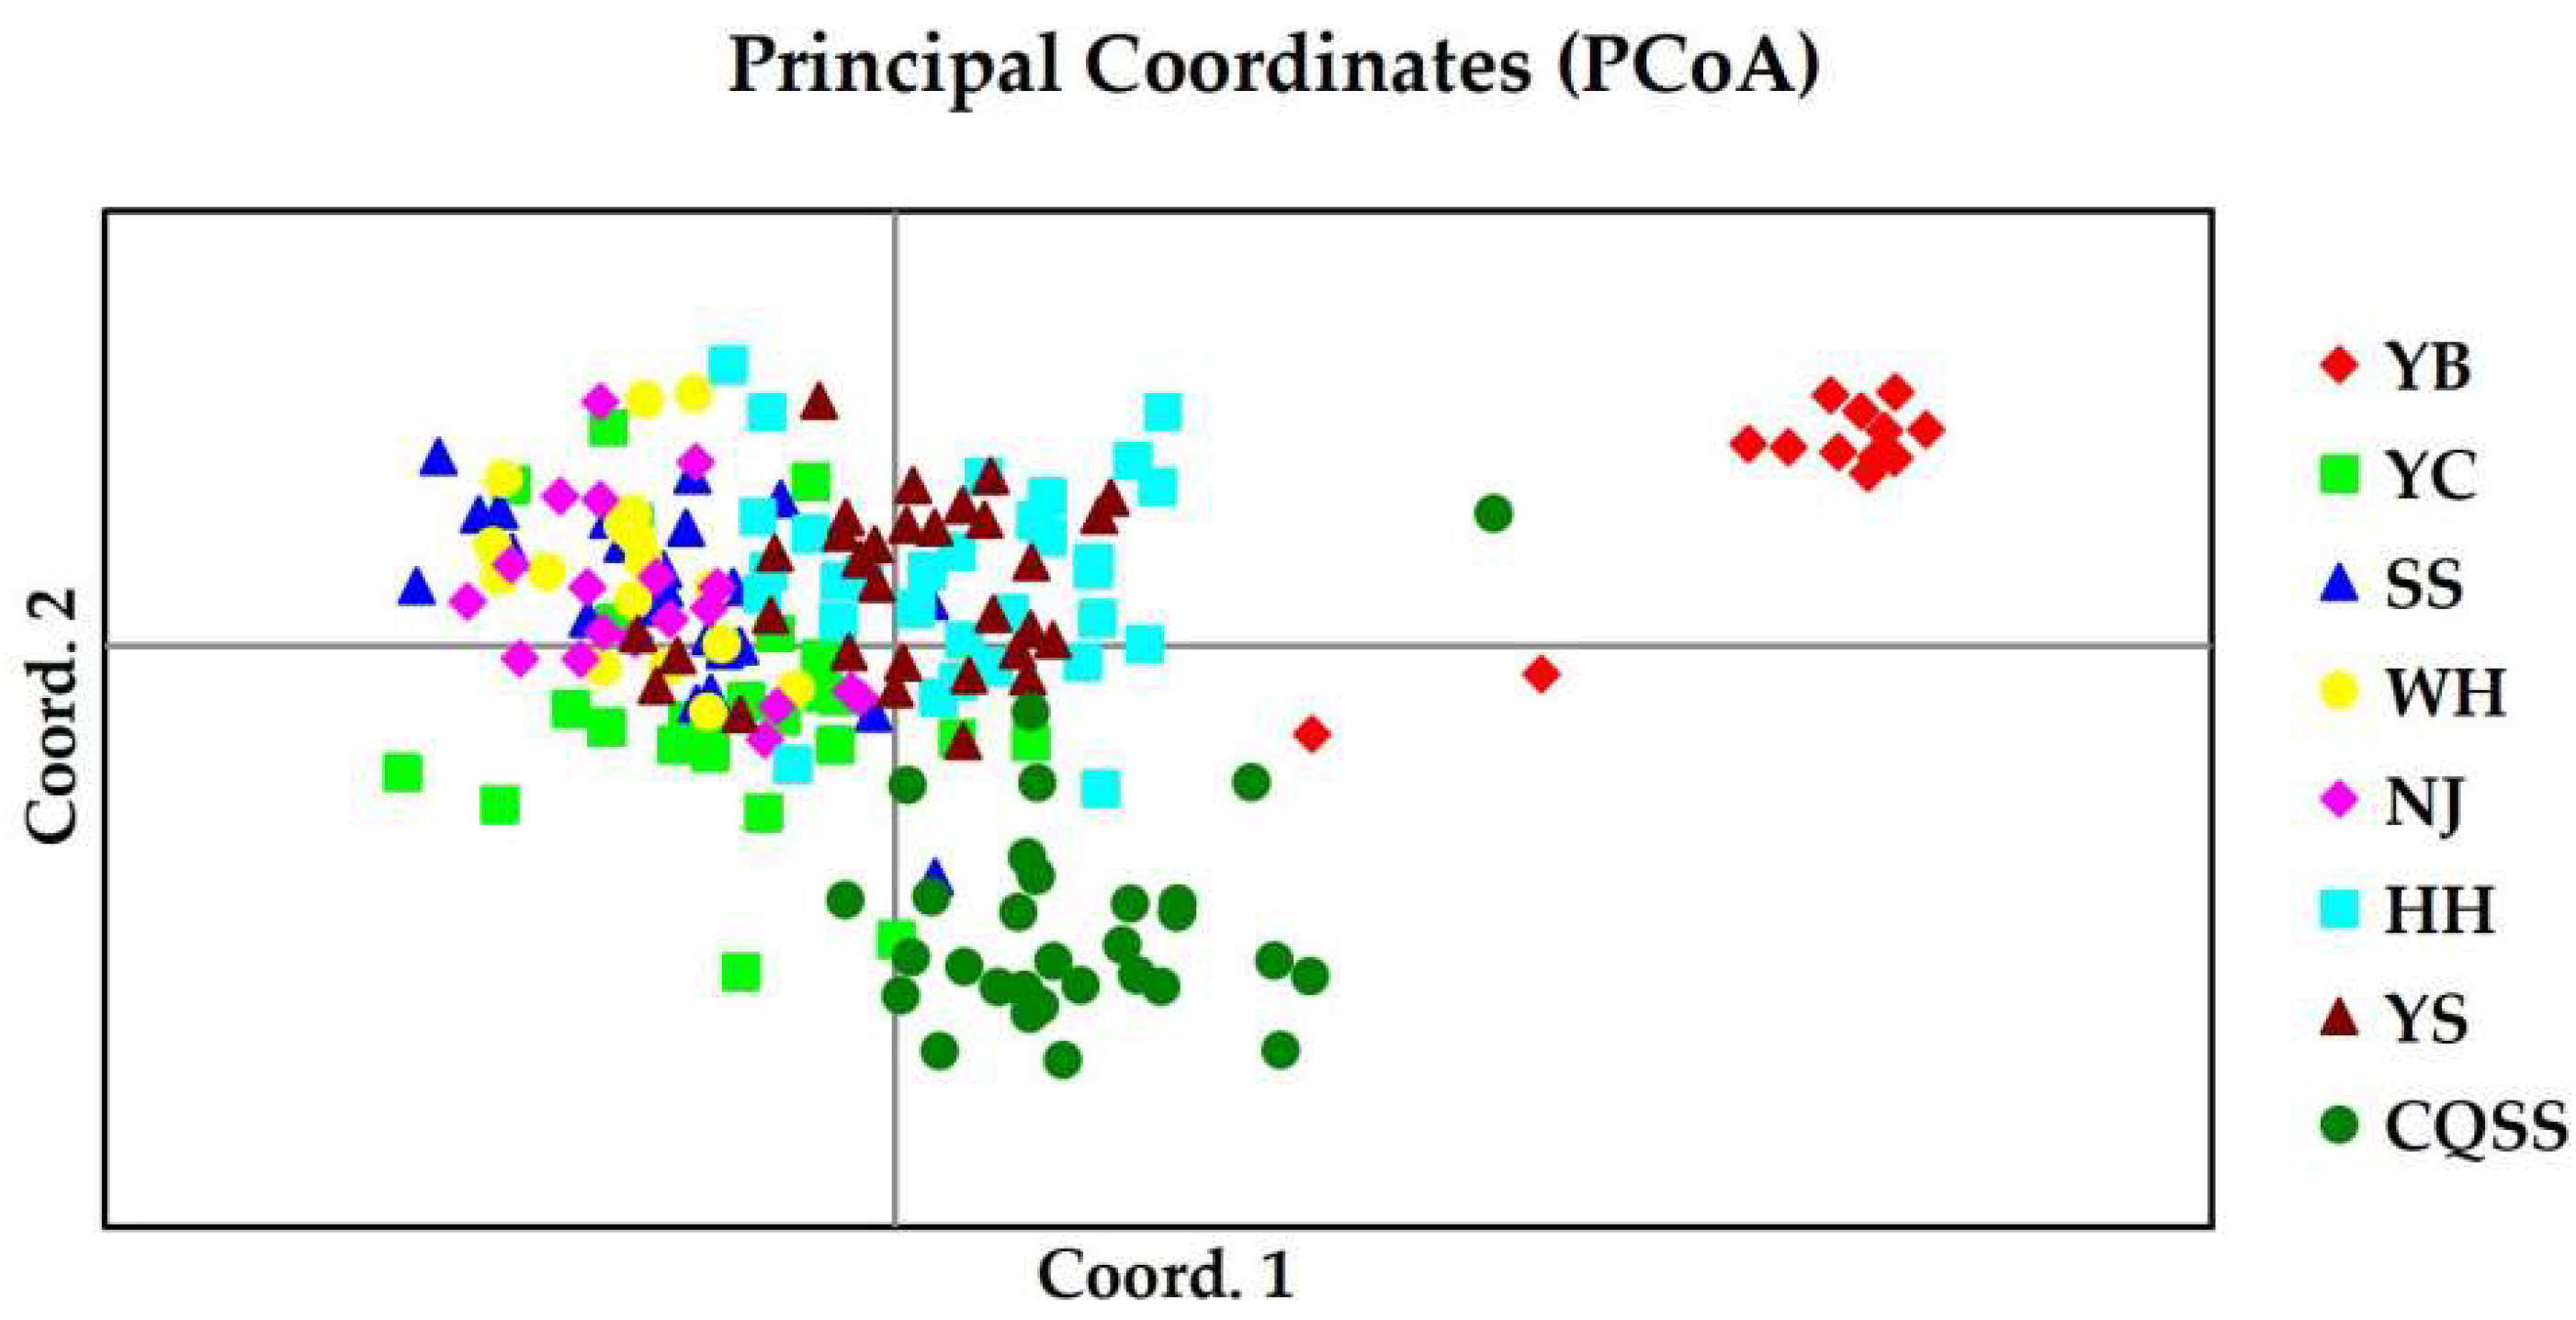
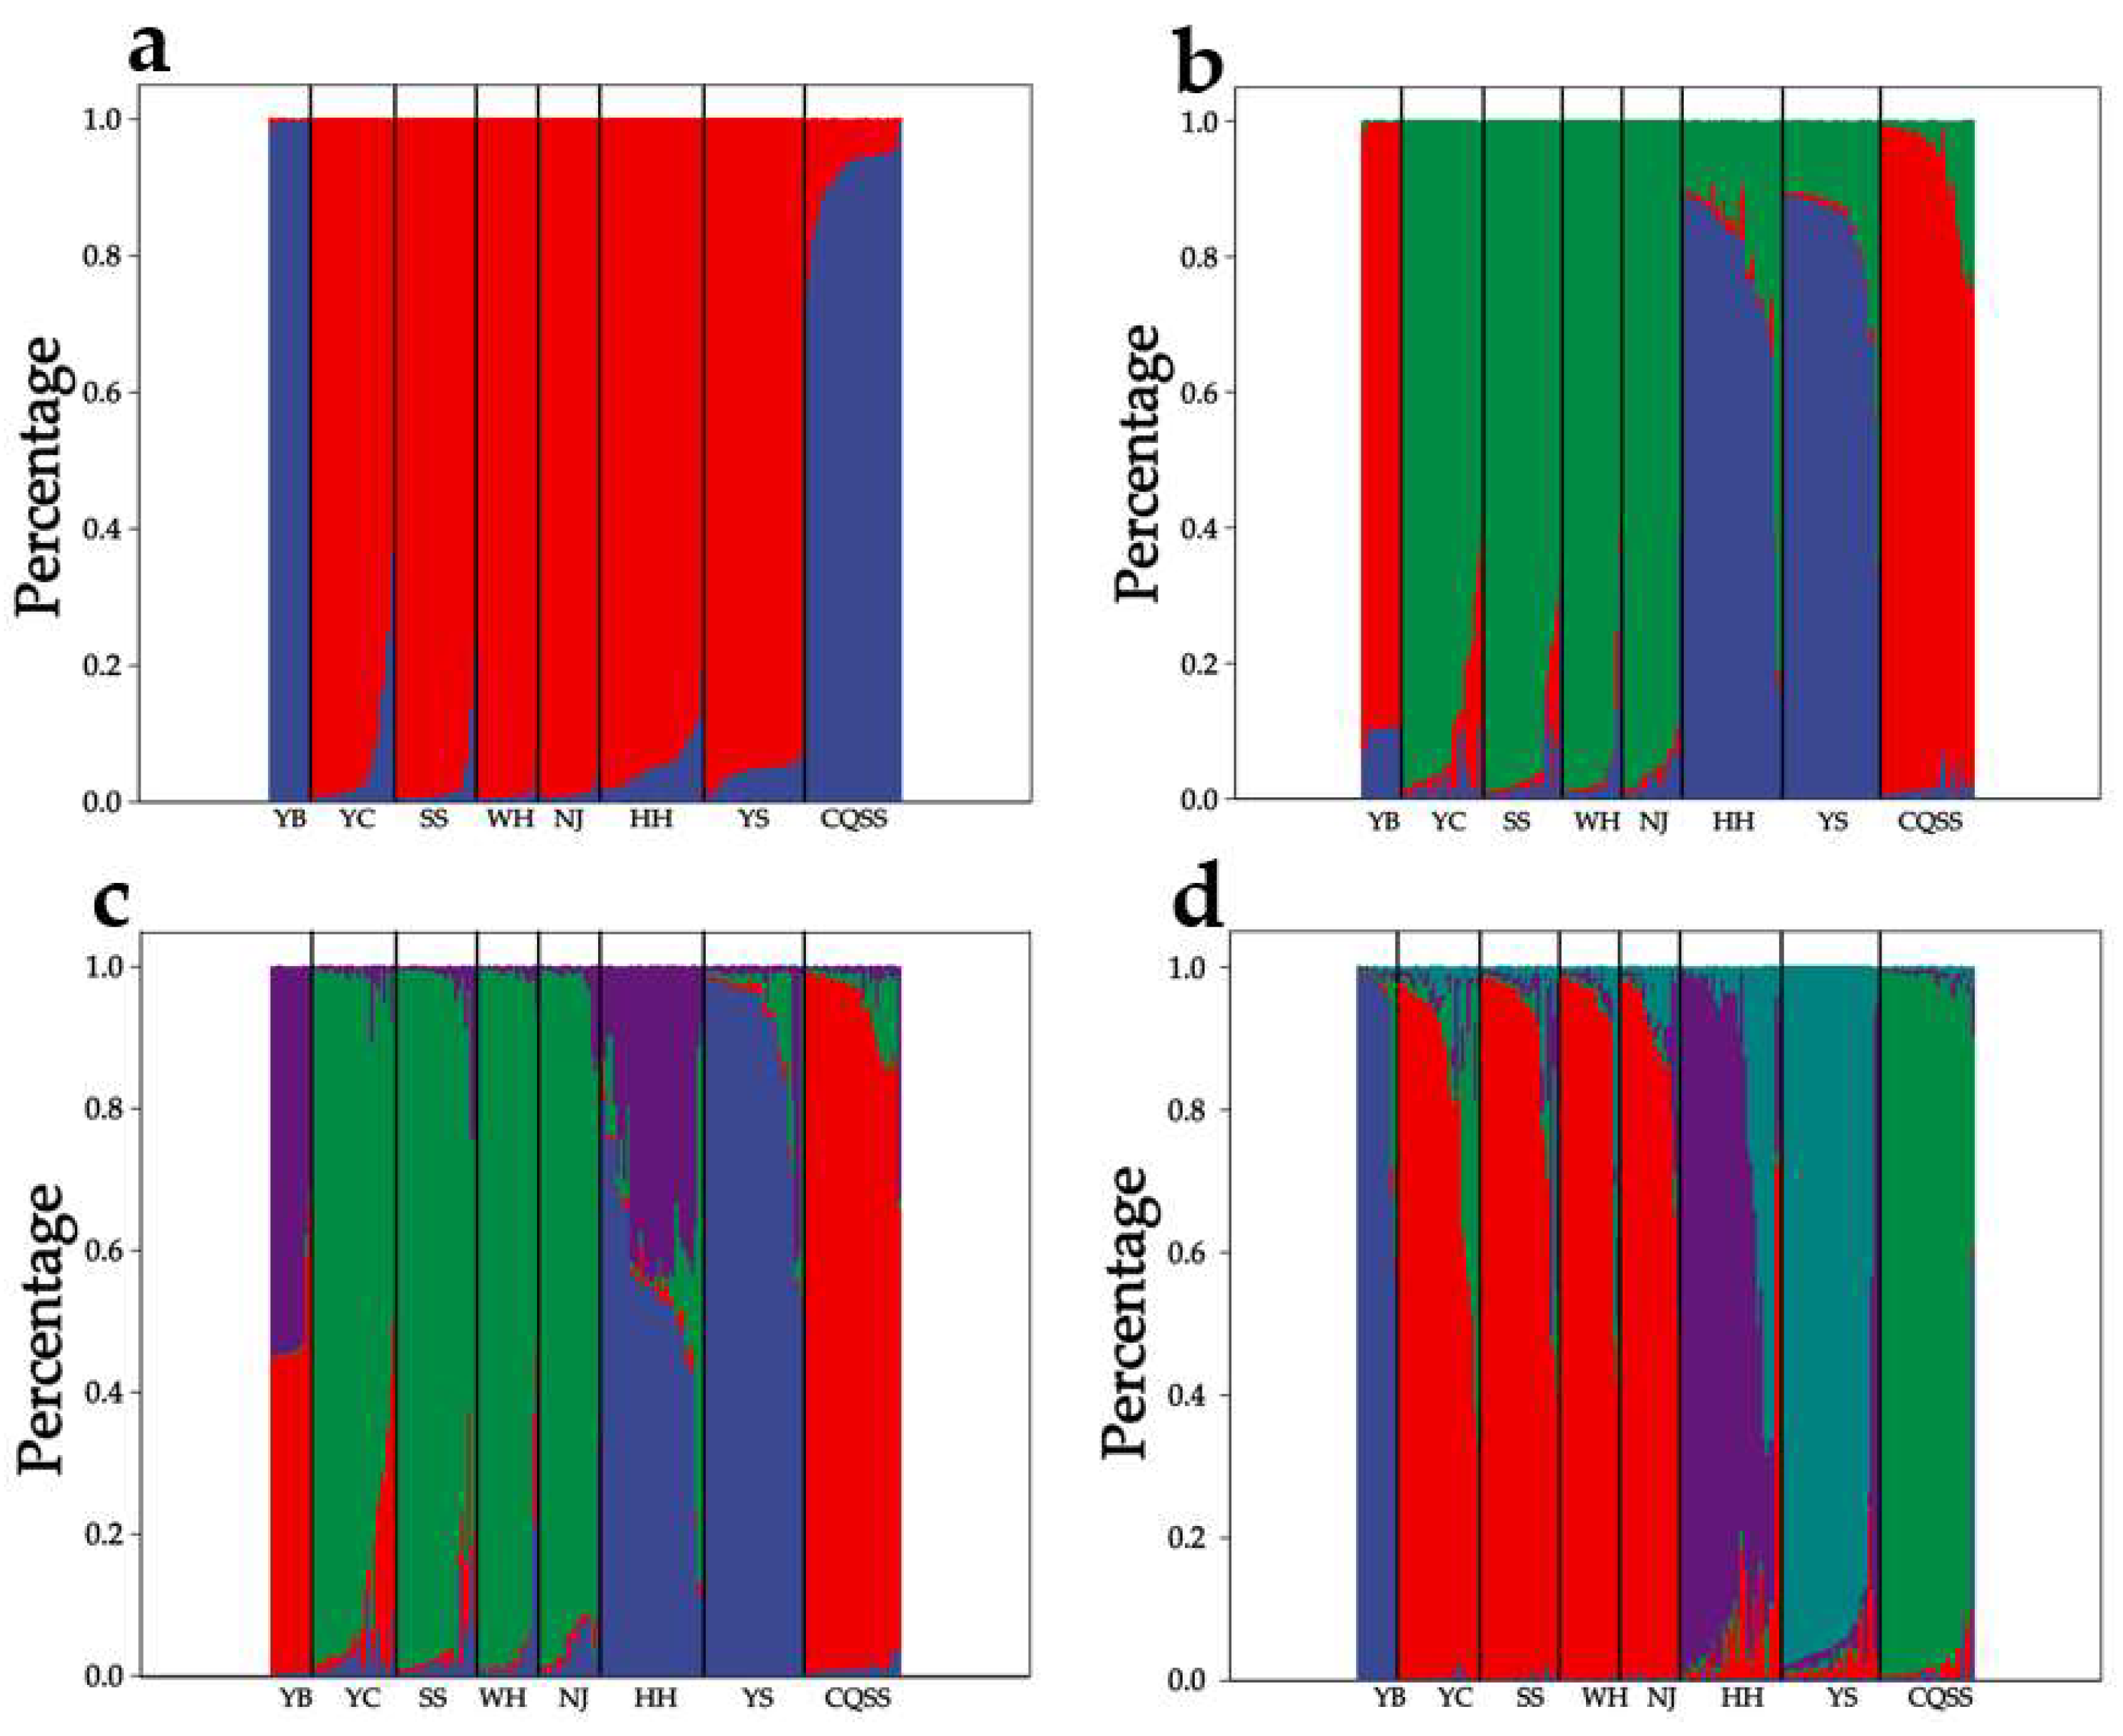
3.2.2. Genetic Differentiation and Population Structure Based on SSR
3.3. Demographic History
4. Discussion
4.1. Genetic Diversity
4.2. Genetic Structure
5. Conclusions
Supplementary Materials
Author Contributions
Funding
Institutional Review Board Statement
Informed Consent Statement
Data Availability Statement
Conflicts of Interest
References
- Ferraris, C.J. Checklist of catfishes, recent and fossil (Osteichthyes: Siluriformes), and catalogue of siluriform primary types. Zootaxa 2007, 1418, 1–628. [Google Scholar] [CrossRef]
- Ba, J.; Li, Y.; Jia, X.; Wang, D.; Duan, X.; Chen, D. Characterization and cross-species amplification of 19 polymorphic microsatellite loci of Hemibagrus macropterus (Bleeker) in the Yangtze River. Conserv. Genet. Resour. 2015, 7, 5–8. [Google Scholar] [CrossRef]
- Zhang, M.; Liu, W.; Li, G. Isolation and characterisation of collagens from the skin of largefin longbarbel catfish (Mystus macropterus). Food Chem. 2009, 115, 826–831. [Google Scholar] [CrossRef]
- Ma, Y.; Zhu, J.; Chen, Y.; Xie, Y.; Zhang, F. Study on artificial propagation and seed cultivation of Mystus macropterus. Chongqing Fish 2012, 2, 20–22. (In Chinese) [Google Scholar]
- Li, X.; Zhu, Y.; Yang, D.; Wu, X.; Li, X.; Zhu, T.; Meng, Z.; Shi, Z.; Zhang, Y. Research progress and prospect of artificial propagation of Mystus macropterus. Fish. Sci. Technol. Inf. 2023, 50, 128–132. (In Chinese) [Google Scholar]
- Li, X.; Wu, X.; Li, X.; Wei, N.; Jiang, M.; Zhu, Y.; Zhu, T. Effect of different opening diet on the growth, the structure of the digestive tract and digestive enzyme activity of larval and juvenile Mystus macropterus. Biology 2024, 13, 749. [Google Scholar] [CrossRef] [PubMed]
- Zhang, L.; Mou, C.; Zhou, J.; Ye, H.; Wei, Z.; Ke, H.; Huang, Z.; Duan, Y.; Zhao, Z.; Zhao, H.; et al. Genetic diversity of Chinese longsnout catfish (Leiocassis longirostris) in four farmed populations based on 20 new microsatellite DNA markers. Diversity 2022, 14, 654. [Google Scholar] [CrossRef]
- Ellegren, H.; Galtier, N. Determinants of genetic diversity. Nat. Rev. Genet. 2016, 17, 422–433. [Google Scholar] [CrossRef]
- Stoffel, M.A.; Johnston, S.E.; Pilkington, J.G.; Pemberton, J.M. Genetic architecture and lifetime dynamics of inbreeding depression in a wild mammal. Nat. Commun. 2021, 12, 2972. [Google Scholar] [CrossRef]
- Moises, E.; Tomr, B.; Lucas, C.; Gillespie, L.; Hateley, S.; Kyriazis, C.C.; Lang, P.L.M.; Leventhal, L.; Nogues-Bravo, D.; Pagowski, V.; et al. Genetic diversity loss in the Anthropocene. Science 2022, 377, 1431–1435. [Google Scholar]
- Ikpeme, E.; Ekerette, E.; Ozoje, M. 220 Mitochondrial DNA polymorphism as a measure of genetic diversity in African tilapia fish. J. Anim. Sci. 2019, 97, 47–48. [Google Scholar] [CrossRef]
- Mishra, A.K.; Lakra, W.S.; Bhatt, J.P.; Goswami, M.; Nagpure, N.S. Genetic characterization of two hill stream fish species Barilius bendelisis (Ham. 1807) and Barilius barna (Ham. 1822) using RAPD markers. Mol. Biol. Rep. 2012, 39, 10167–10172. [Google Scholar] [CrossRef] [PubMed]
- Apostolidis, A.; Moutou, K.; Stamatis, C.; Mamuris, Z. Genetic structure of three marine fishes from the Gulf of Pagasitikos (Greece) based on allozymes, RAPD, and mtDNA RFLP markers. Biologia 2009, 64, 1005–1010. [Google Scholar] [CrossRef]
- Takahashi, H.; Takeshita, N.; Tanoue, H.; Ueda, S.; Takeshima, H.; Komatsu, T.; Kinoshita, I.; Nishida, M. Severely depleted genetic diversity and population structure of a large predatory marine fish (Lates japonicus) endemic to Japan. Conserv. Genet. 2015, 16, 1155–1165. [Google Scholar] [CrossRef]
- Diyie, R.L.; Agyarkwa, S.K.; Armah, E.; Amonoo, N.A.; Owusu-Frimpong, I.; Osei-Atweneboana, M.Y. Genetic variations among different generations and cultured populations of Nile Tilapia (Oreochromis niloticus) in Ghana: Application of microsatellite markers. Aquaculture 2021, 544, 737070. [Google Scholar] [CrossRef]
- Cui, R.; Huang, J.; Wang, S.; Zhang, X. Whole-genome resequencing reveals genetic diversity and selection signatures in five populations of Mandarin Fish (Siniperca chuatsi). Aquac. Rep. 2024, 39, 102406. [Google Scholar] [CrossRef]
- Liu, Z.J.; Cordes, J.F. DNA marker technologies and their applications in aquaculture genetics. Aquaculture 2004, 238, 1–37. [Google Scholar] [CrossRef]
- Panchariya, D.C.; Dutta, P.; Ananya; Chawade, A.; Nayee, N.; Azam, S.; Gandham, R.K.; Majumdar, S.; Kushwaha, S.K. Genetic marker: A genome maping tool to decode genetic diversity of livestock animals. Front. Genet. 2024, 15, 1463474. [Google Scholar] [CrossRef]
- Chen, J.; Wang, W. Genetic diversity and genetic differentiation of Megalobrama populations inferred by mitochondrial markers. Genes Genom. 2021, 43, 1119–1132. [Google Scholar] [CrossRef]
- Zhou, M.Y.; Wang, J.J.; Ren, J.F.; Li, F.; Wu, J.X.; Zhou, J.J.; Li, J.L.; Yang, J.Q.; Lin, H.D. Historical landscape evolution shaped the phylogeography and population history of the cyprinid fishes of Acrossocheilus (Cypriniformes: Cyprinidae) according to mitochondrial DNA in Zhejiang Province, China. Diversity 2023, 15, 425. [Google Scholar] [CrossRef]
- Kuang, T.; Shuai, F.; Li, X.; Chen, W.; Lek, S. Genetic diversity and population structure of Hemibagrus guttatus (Bagridae, Siluriformes) in the larger subtropical Pearl River based on COI and Cyt b genes analysis. Ann. Limnol.-Int. J. Lim. 2021, 57, 7. [Google Scholar] [CrossRef]
- Tautz, D.; Renz, M. Simple sequences are ubiquitous repetitive components of eukaryotic genomes. Nucleic Acids Res. 1984, 12, 4127–4138. [Google Scholar] [CrossRef]
- Luo, Y.T.; Fang, D.A.; Zhou, Y.F.; Xu, D.P.; Peng, Y.X.; Zhang, M.Y.; Mao, C.C.; Tang, X.X.; Xu, J.; You, Y. Genetic diversity, habitat relevance and conservation strategies of the silver carp in the Yangtze River by simple sequence repeat. Front. Ecol. Evol. 2022, 10, 850183. [Google Scholar] [CrossRef]
- Guo, W.; Guo, C.; Wang, Y.; Hu, W.; Mei, J. Population structure and genetic diversity in yellow catfish (Pelteobagrus fulvidraco) assessed with microsatellites. J. Genet. 2019, 98, 26. [Google Scholar] [CrossRef] [PubMed]
- Jin, Y.; He, K.; Xiang, P.; Wang, X.; Tong, L.; Wei, Z.; Zhang, X.; Song, Z. Temporal genetic variation of the Chinese longsnout catfish (Leiocassis longirostris) in the upper Yangtze River with resource decline. Environ. Biol. Fishes 2022, 105, 1139–1151. [Google Scholar] [CrossRef]
- Xuan, Z.; Jiang, T.; Liu, H.; Chen, X.; Yang, J. Mitochondrial DNA and microsatellite analyses reveal strong genetic differentiation between two types of estuarine tapertail anchovies (Coilia) in Yangtze River Basin, China. Hydrobiologia 2021, 848, 1409–1431. [Google Scholar] [CrossRef]
- Zhou, L.; Gao, J.; Yang, Y.; Nie, Z.; Liu, K.; Xu, G. Genetic diversity and population structure analysis of Chinese mitten crab (Eriocheir sinensis) in the Yangtze and Liaohe Rivers. Fishes 2023, 8, 253. [Google Scholar] [CrossRef]
- Yang, L.; Mayden, R.L.; He, S. Population genetic structure and geographical differentiation of the Chinese catfish Hemibagrus macropterus (Siluriformes, Bagridae): Evidence for altered drainage patterns. Mol. Phylogenet. Evol. 2009, 51, 405–411. [Google Scholar] [CrossRef]
- Ye, H.; Fan, J.; Hou, Y.; Yue, H.; Ruan, R.; Li, S.; Hu, C.; Xie, Y.; Li, C. Chromosome-level genome assembly of the largefin longbarbel catfish (Hemibagrus macropterus). Front. Genet. 2023, 14, 1297119. [Google Scholar] [CrossRef]
- Ma, C.; Cheng, Q.; Zhang, Q.; Zhuang, P.; Zhao, Y. Genetic variation of Coilia ectenes (Clupeiformes: Engraulidae) revealed by the complete cytochrome b sequences of mitochondrial DNA. J. Exp. Mar. Biol. Ecol. 2010, 385, 14–19. [Google Scholar] [CrossRef]
- Lalitha, S. Primer Premier 5. Biotech Sofw. Int. Rep. 2000, 1, 270–272. [Google Scholar]
- Holland, M.M.; Pack, E.D.; McElhoe, J.A. Evaluation of GeneMarker® HTS for improved alignment of mtDNA MPS data, haplotype determination, and heteroplasmy assessment. Forensic Sci. Int. Genet. 2017, 28, 90–98. [Google Scholar] [CrossRef] [PubMed]
- Librado, P.; Rozas, J. DnaSP v5: A software for comprehensive analysis of DNA polymorphism data. Bioinformatics 2009, 25, 1451–1452. [Google Scholar] [CrossRef] [PubMed]
- Kumar, S.; Stecher, G.; Tamura, K. MEGA7: Molecular evolutionary genetics analysis version 7.0 for bigger datasets. Mol. Biol. Evol. 2016, 33, 1870–1874. [Google Scholar] [CrossRef] [PubMed]
- Bandelt, H.J.; Forster, P.; Röhl, A. Median-joining networks for inferring intraspecific phylogenies. Mol. Biol. Evol. 1999, 16, 37–48. [Google Scholar] [CrossRef]
- Excoffier, L.; Lischer, H.E.L. Arlequin suite ver 3.5: A new series of programs to perform population genetics analyses under Linux and Windows. Mol. Ecol. Resour. 2010, 10, 564–567. [Google Scholar] [CrossRef] [PubMed]
- Ramos-Onsins, S.E.; Rozas, J. Statistical properties of new neutrality tests against population growth. Mol. Biol. Evol. 2002, 19, 2092–2100. [Google Scholar] [CrossRef]
- Kalinowski, S.T.; Taper, M.L.; Marshall, T.C. Revising how the computer program CERVUS accommodates genotyping error increases success in paternity assignment. Mol. Ecol. 2007, 16, 1099–1106. [Google Scholar] [CrossRef]
- Peakall, R.; Smouse, P.E. GenAlEx 6.5: Genetic analysis in Excel. Population genetic software for teaching and research—An update. Bioinformatics 2012, 28, 2537–2539. [Google Scholar] [CrossRef]
- Rousset, F. GENEPOP’007: A complete re-implementation of the genepop software for Windows and Linux. Mol. Ecol. Resour. 2008, 8, 103–106. [Google Scholar] [CrossRef]
- Hubisz, M.J.; Falush, D.; Stephens, M.; Pritchard, J.K. Inferring weak population structure with the assistance of sample group information. Mol. Ecol. Resour. 2009, 9, 1322–1332. [Google Scholar] [CrossRef]
- Dong, F.; Cheng, P.; Sha, H.; Yue, H.; Wan, C.; Zhang, Y.; Zhang, H.; Wei, Q. Genetic diversity and population structure analysis of blunt snout bream (Megalobrama amblycephala) in the Yangtze River Basin: Implications for conservation and utilization. Aquac. Rep. 2024, 35, 101925. [Google Scholar] [CrossRef]
- Ke, X.; Liu, J.; Gao, F.; Cao, J.; Liu, Z.; Lu, M. Analysis of genetic diversity among six dojo loach (Misgurnus anguillicaudatus) populations in the Pearl River Basin based on microsatellite and mitochondrial DNA markers. Aquac. Rep. 2022, 27, 101346. [Google Scholar] [CrossRef]
- Xiao, M.S.; Xia, H.W.; Ma, Y.H. Genetic variation of the Chinese longsnout catfish Leiocassis longirostris in the Yangtze River revealed using mitochondrial DNA cytochrome b sequences. Acta Ecol. Sin. 2012, 32, 305–313. [Google Scholar] [CrossRef]
- Ha, T.T.T.; Nga, T.T.; Hang, T.N.A.; Alam, M.S. Genetic diversity in Pangasius spp. collected in Bangladesh based on mitochondrial cytochrome b gene sequence analysis. Aquac. Rep. 2020, 17, 100351. [Google Scholar] [CrossRef]
- Zhu, W.; Fu, J.; Luo, M.; Wang, L.; Wang, P.; Liu, Q.; Dong, Z. Genetic diversity and population structure of bighead carp (Hypophthalmichthys nobilis) from the middle and lower reaches of the Yangtze River revealed using microsatellite markers. Aquac. Rep. 2022, 27, 101377. [Google Scholar] [CrossRef]
- Zhou, Y.; Tong, J.; Wang, J.; Yu, X. Development of microsatellite markers and genetic diversity in wild and cultured populations of black carp (Mylopharyngodon piceus) along the Yangtze River. Aquac. Int. 2020, 28, 1867–1882. [Google Scholar] [CrossRef]
- Sha, H.; Luo, X.Z.; Wang, D.; Li, X.H.; Zou, G.W.; Liang, H.W. New insights to protection and utilization of silver carp (Hypophthalmichthys molitrix) in Yangtze River based on microsatellite analysis. Fish. Res. 2021, 241, 105997. [Google Scholar] [CrossRef]
- Reiner, G.; Lang, M.; Willems, H. Impact of different panels of microsatellite loci, different numbers of loci, sample sizes, and gender ratios on population genetic results in red deer. Eur. J. Wildl. Res. 2019, 65, 25. [Google Scholar] [CrossRef]
- Guo, X.Z.; Chen, H.M.; Wang, A.B.; Qian, X.Q. Population genetic structure of the yellow catfish (Pelteobagrus fulvidraco) in China inferred from microsatellite analyses: Implications for fisheries management and breeding. J. World Aquac. Soc. 2022, 53, 174–191. [Google Scholar] [CrossRef]
- Chen, W.; Xiang, D.; Gao, S.; Zhu, S.; Wu, Z.; Li, Y.; Li, J. Whole-genome resequencing confirms the genetic effects of dams on an endangered fish Hemibagrus guttatus (Siluriformes: Bagridae): A case study in a tributary of the Pearl River. Gene 2024, 895, 148000. [Google Scholar] [CrossRef]
- Hou, Y.; Ye, H.; Song, X.; Fan, J.; Li, J.; Shao, J.; Wang, Y.; Lin, D.; Yue, H.; Ruan, R.; et al. Genetic Diversity and Population Structure of Chinese Longsnout Catfish (Leiocassis longirostris) Using Microsatellite DNA Markers. Fishes 2024, 9, 35. [Google Scholar] [CrossRef]
- Henriques, R.; von der Heyden, S.; Lipinski, M.R.; du Toit, N.; Kainge, P.; Bloomer, P.; Matthee, C.A. Spatio-temporal genetic structure and the effects of long-term fishing in two partially sympatric offshore demersal fishes. Mol. Ecol. 2016, 25, 5843–5861. [Google Scholar] [CrossRef] [PubMed]
- Perdices, A.; Cunha, C.; Coelho, M.M. Phylogenetic structure of Zacco platypus (Teleostei, Cyprinidae) populations on the upper and middle Chang Jiang (=Yangtze) drainage inferred from cytochrome b sequences. Mol. Phylogenet. Evol. 2004, 31, 192–203. [Google Scholar] [CrossRef] [PubMed]
- Perdices, A.; Sayanda, D.; Coelho, M.M. Mitochondrial diversity of Opsariichthys bidens (Teleostei, Cyprinidae) in three Chinese drainages. Mol. Phylogenet. Evol. 2005, 37, 920–927. [Google Scholar] [CrossRef]
- Berrebi, P.; Retif, X.; Fang, F.; Zhang, C.G. Population structure and systematics of Opsariichthys bidens (Osteichthyes: Cyprinidae) in south-east China using a new nuclear marker: The introns (EPIC-PCR). Biol. J. Linn. Soc. 2006, 87, 155–166. [Google Scholar] [CrossRef]


| Location | Population Name | Sample Size | Geographic Location | Collection Date |
|---|---|---|---|---|
| Upper reaches of Yangtze River | Yibin (YB) | 13 | Sichuan (28.7669° N, 104.6279° E) | June 2022 |
| Middle reaches of Yangtze River | Yichang (YC) | 26 | Sichuan (30.4152° N, 111.8944° E) | June 2023 |
| Shishou (SS) | 25 | Hubei (29.7382° N, 112.3955° E) | October 2021 | |
| Wuhan (WH) | 19 | Hubei (30.6827° N, 114.5270° E) | November 2021 | |
| Lower reaches of Yangtze River | Nanjing (NJ) | 19 | Jiangsu (32.0646° N, 118.8024° E) | June 2023 |
| Xiang Jiang River (Yangtze River tributary) | Huaihua (HH) | 32 | Hunan (27.3469° N, 109.1798° E) | April 2024 |
| Li Jiang River (Pearl River tributary) | Yangshuo (YS) | 31 | Guangxi (24.7784° N, 110.4965° E) | May 2024 |
| Chongqing city | Stock seed (CQSS) | 30 | Chongqing (29.9138° N, 107.2414° E) | March 2023 |
| Haplotype | Location | |||||||
|---|---|---|---|---|---|---|---|---|
| YB | YC | SS | WH | NJ | HH | YS | CQSS | |
| Hap_1 | 12 | 0 | 0 | 0 | 0 | 0 | 0 | 0 |
| Hap_2 | 1 | 9 | 6 | 0 | 1 | 0 | 5 | 16 |
| Hap_3 | 0 | 11 | 12 | 10 | 7 | 0 | 0 | 12 |
| Hap_4 | 0 | 1 | 2 | 0 | 1 | 0 | 0 | 0 |
| Hap_5 | 0 | 2 | 0 | 0 | 0 | 0 | 0 | 2 |
| Hap_6 | 0 | 1 | 2 | 5 | 2 | 2 | 23 | 0 |
| Hap_7 | 0 | 1 | 0 | 0 | 0 | 0 | 0 | 0 |
| Hap_8 | 0 | 1 | 0 | 0 | 0 | 0 | 0 | 0 |
| Hap_9 | 0 | 0 | 2 | 0 | 1 | 0 | 0 | 0 |
| Hap_10 | 0 | 0 | 1 | 0 | 0 | 0 | 0 | 0 |
| Hap_11 | 0 | 0 | 0 | 3 | 2 | 0 | 0 | 0 |
| Hap_12 | 0 | 0 | 0 | 1 | 1 | 0 | 0 | 0 |
| Hap_13 | 0 | 0 | 0 | 0 | 1 | 0 | 0 | 0 |
| Hap_14 | 0 | 0 | 0 | 0 | 2 | 0 | 0 | 0 |
| Hap_15 | 0 | 0 | 0 | 0 | 1 | 0 | 0 | 0 |
| Hap_16 | 0 | 0 | 0 | 0 | 0 | 10 | 0 | 0 |
| Hap_17 | 0 | 0 | 0 | 0 | 0 | 2 | 0 | 0 |
| Hap_18 | 0 | 0 | 0 | 0 | 0 | 1 | 0 | 0 |
| Hap_19 | 0 | 0 | 0 | 0 | 0 | 2 | 0 | 0 |
| Hap_20 | 0 | 0 | 0 | 0 | 0 | 1 | 0 | 0 |
| Hap_21 | 0 | 0 | 0 | 0 | 0 | 4 | 0 | 0 |
| Hap_22 | 0 | 0 | 0 | 0 | 0 | 1 | 0 | 0 |
| Hap_23 | 0 | 0 | 0 | 0 | 0 | 1 | 0 | 0 |
| Hap_24 | 0 | 0 | 0 | 0 | 0 | 1 | 0 | 0 |
| Hap_25 | 0 | 0 | 0 | 0 | 0 | 1 | 0 | 0 |
| Hap_26 | 0 | 0 | 0 | 0 | 0 | 2 | 0 | 0 |
| Hap_27 | 0 | 0 | 0 | 0 | 0 | 1 | 0 | 0 |
| Hap_28 | 0 | 0 | 0 | 0 | 0 | 1 | 0 | 0 |
| Hap_29 | 0 | 0 | 0 | 0 | 0 | 2 | 0 | 0 |
| Hap_30 | 0 | 0 | 0 | 0 | 0 | 0 | 2 | 0 |
| Hap_31 | 0 | 0 | 0 | 0 | 0 | 0 | 1 | 0 |
| Population | N | h | Hd | π |
|---|---|---|---|---|
| YB | 13 | 2 | 0.154 | 0.0100 |
| YC | 26 | 7 | 0.717 | 0.0108 |
| SS | 25 | 6 | 0.720 | 0.0013 |
| WH | 19 | 4 | 0.661 | 0.0015 |
| NJ | 19 | 10 | 0.860 | 0.0035 |
| HH | 32 | 15 | 0.887 | 0.0048 |
| YS | 31 | 4 | 0.432 | 0.0005 |
| CQSS | 30 | 3 | 0.570 | 0.0085 |
| Total | 195 | 31 | 0.853 | 0.0127 |
| Locus | Forward Primer | Reverse Primer | Allele Ranges (bp) |
|---|---|---|---|
| Hem002 | GAGATCGAGGAGAGCGGGAA | CACCACCTCCGTCATGTTCT | 314–334 |
| Hem003 | TCGGTGTTTGTTGTCCGAAA | ACGCGGGTAGTAGTAGTGGT | 223–248 |
| Hem004 | TATGGAGTTGTCCCGCCCTA | CATGCGCAGTAGAGGGAGAT | 152–191 |
| Hem005 | CAGCTCCGACTCCATGACTG | TAAGCTGCAATGCACCGTTG | 297–320 |
| Hem010 | GTGCACTGATTCAGCTCCCT | CCAACCCTAGTCCTGCAGTG | 259–290 |
| Hem012 | GTACTTGCTCTTGACGCTGC | GCGACCTCACGGTTAGAACA | 222–273 |
| Hem015 | TTCAACAGGTCAGGCTTGCA | GTCCGAACACCAACCGGTAT | 251–270 |
| Hem022 | CTGTGGTGCCTGAGAGATGG | ACCAACACCATGCTTCACCA | 177–202 |
| Hem032 | CAAACCCTGGAGTCCTGTCC | ATGTGCTTCACGGAGCTTGT | 278–314 |
| Hem036 | ACCTGGTTGATGACTGCTGG | TGATGCAGTCTTCGCAGTGT | 261–283 |
| Hem041 | GAAGCGGACAGTGATGACCA | GCTCAACTTCAGCCTGGTGA | 256–291 |
| Hem046 | TTGTGCCCTGTGATAGCCTG | CCAGCCAGGGAGCAAACTTA | 181–287 |
| Hem047 | ACCTCACTGTTCCTGCAGTC | GGGAGAAGTGAGGCAAGAGG | 244–267 |
| Hem048 | AGGGTGATGTGGAAGGACCT | CGACTACCAGCTACCACGTC | 233–281 |
| Locus | Na | Ne | I | Ho | He | F | PIC | Prob | Signif |
|---|---|---|---|---|---|---|---|---|---|
| Hem002 | 9 | 2.599 | 1.256 | 0.495 | 0.615 | 0.196 | 0.557 | 0.153 | ns |
| Hem003 | 18 | 9.902 | 2.500 | 0.874 | 0.899 | 0.027 | 0.891 | 0.000 | *** |
| Hem004 | 18 | 11.491 | 2.579 | 0.747 | 0.913 | 0.181 | 0.906 | 0.000 | *** |
| Hem005 | 17 | 6.850 | 2.247 | 0.774 | 0.854 | 0.094 | 0.840 | 0.716 | ns |
| Hem010 | 19 | 4.349 | 1.889 | 0.682 | 0.770 | 0.114 | 0.743 | 0.017 | * |
| Hem012 | 18 | 7.980 | 2.346 | 0.846 | 0.875 | 0.033 | 0.863 | 0.999 | ns |
| Hem015 | 15 | 4.596 | 1.868 | 0.753 | 0.782 | 0.038 | 0.755 | 0.054 | ns |
| Hem022 | 16 | 8.641 | 2.322 | 0.794 | 0.884 | 0.102 | 0.873 | 0.588 | ns |
| Hem032 | 20 | 10.234 | 2.557 | 0.788 | 0.902 | 0.127 | 0.895 | 0.244 | ns |
| Hem036 | 14 | 4.525 | 1.844 | 0.696 | 0.779 | 0.107 | 0.754 | 0.882 | ns |
| Hem041 | 44 | 13.787 | 3.026 | 0.907 | 0.927 | 0.022 | 0.923 | 0.836 | ns |
| Hem046 | 17 | 2.737 | 1.361 | 0.644 | 0.635 | −0.014 | 0.574 | 0.011 | * |
| Hem047 | 15 | 6.878 | 2.157 | 0.722 | 0.855 | 0.156 | 0.839 | 0.103 | ns |
| Hem048 | 19 | 10.260 | 2.504 | 0.928 | 0.903 | −0.028 | 0.894 | 0.393 | ns |
| Mean | 18.500 | 7.488 | 2.175 | 0.761 | 0.828 | 0.083 | 0.808 | ||
| St Dev | 7.842 | 3.426 | 0.488 | 0.114 | 0.100 | 0.071 | 0.118 |
| Population | Na | Ne | I | Ho | He | F | |
|---|---|---|---|---|---|---|---|
| YB | Mean | 6.786 | 4.293 | 1.539 | 0.697 | 0.713 | 0.013 |
| SE | 0.712 | 0.463 | 0.132 | 0.049 | 0.046 | 0.039 | |
| YC | Mean | 9.357 | 5.062 | 1.764 | 0.734 | 0.760 | 0.043 |
| SE | 0.929 | 0.554 | 0.126 | 0.048 | 0.032 | 0.040 | |
| SS | Mean | 8.714 | 5.145 | 1.744 | 0.783 | 0.765 | −0.020 |
| SE | 0.766 | 0.579 | 0.120 | 0.045 | 0.030 | 0.042 | |
| WH | Mean | 7.929 | 4.904 | 1.712 | 0.789 | 0.765 | −0.035 |
| SE | 0.675 | 0.472 | 0.110 | 0.036 | 0.027 | 0.039 | |
| NJ | Mean | 7.714 | 4.870 | 1.624 | 0.711 | 0.736 | 0.022 |
| SE | 0.854 | 0.723 | 0.139 | 0.030 | 0.034 | 0.036 | |
| HH | Mean | 11.857 | 7.457 | 2.089 | 0.830 | 0.831 | 0.001 |
| SE | 1.346 | 0.891 | 0.128 | 0.029 | 0.025 | 0.021 | |
| YS | Mean | 10.786 | 5.947 | 1.904 | 0.789 | 0.793 | 0.006 |
| SE | 0.973 | 0.720 | 0.123 | 0.034 | 0.028 | 0.023 | |
| CQSS | Mean | 7.857 | 4.455 | 1.568 | 0.706 | 0.706 | 0.028 |
| SE | 0.824 | 0.524 | 0.142 | 0.063 | 0.050 | 0.052 |
| Population | YB | YC | SS | WH | NJ | HH | YS | CQSS |
|---|---|---|---|---|---|---|---|---|
| YB | 0.0569 | 0.0612 | 0.0611 | 0.0614 | 0.0624 | 0.0622 | 0.0573 | |
| YC | 0.8135 | 0.0064 | 0.0065 | 0.0074 | 0.0133 | 0.0066 | 0.0094 | |
| SS | 0.9053 | 0.0369 | 0.0014 | 0.0024 | 0.0096 | 0.0015 | 0.0052 | |
| WH | 0.9031 | 0.0382 | −0.0002 | 0.0025 | 0.0098 | 0.0016 | 0.0053 | |
| NJ | 0.8867 | 0.0168 | −0.0012 | −0.0148 | 0.0102 | 0.0025 | 0.0062 | |
| HH | 0.8780 | 0.4167 | 0.6831 | 0.6762 | 0.5920 | 0.0094 | 0.0127 | |
| YS | 0.9137 | 0.1398 | 0.3805 | 0.3541 | 0.1908 | 0.7195 | 0.0055 | |
| CQSS | 0.8355 | −0.0333 | 0.0381 | 0.0398 | 0.0168 | 0.4824 | 0.1732 |
| Source | d.f. | SS | VC | % | F |
|---|---|---|---|---|---|
| Among populations | 7 | 821.139 | 4.75671 Va | 65.65 | FST = 0.65645 |
| Within populations | 187 | 465.517 | 2.48940 Vb | 34.35 | |
| Total | 194 | 1286.656 | 7.24611 |
| YB | YC | SS | WH | NJ | HH | YS | CQSS | |
|---|---|---|---|---|---|---|---|---|
| YB | - | 1.728 | 1.702 | 1.656 | 1.557 | 2.071 | 1.887 | 1.714 |
| YC | 0.126 | - | 18.279 | 15.648 | 16.312 | 8.115 | 7.332 | 6.365 |
| SS | 0.128 | 0.013 | - | 23.383 | 16.669 | 8.626 | 6.530 | 3.968 |
| WH | 0.131 | 0.016 | 0.011 | - | 12.099 | 8.257 | 6.847 | 3.593 |
| NJ | 0.138 | 0.015 | 0.015 | 0.020 | - | 7.770 | 7.410 | 3.672 |
| HH | 0.108 | 0.030 | 0.028 | 0.029 | 0.031 | - | 11.969 | 4.388 |
| YS | 0.117 | 0.033 | 0.037 | 0.035 | 0.033 | 0.020 | - | 3.968 |
| CQSS | 0.127 | 0.038 | 0.059 | 0.065 | 0.064 | 0.054 | 0.059 | - |
| YB | YC | SS | WH | NJ | HH | YS | CQSS | |
|---|---|---|---|---|---|---|---|---|
| YB | ||||||||
| YC | 0.772 | |||||||
| SS | 0.796 | 0.230 | ||||||
| WH | 0.827 | 0.258 | 0.226 | |||||
| NJ | 0.802 | 0.257 | 0.257 | 0.302 | ||||
| HH | 0.775 | 0.373 | 0.372 | 0.393 | 0.400 | |||
| YS | 0.794 | 0.406 | 0.428 | 0.414 | 0.389 | 0.361 | ||
| CQSS | 0.715 | 0.398 | 0.474 | 0.519 | 0.482 | 0.512 | 0.528 |
| Source | df | TV | MS | Est. Var. | % |
|---|---|---|---|---|---|
| Among Populations | 7 | 179.013 | 25.573 | 0.412 | 7% |
| Among Individuals | 187 | 1063.128 | 5.685 | 0.205 | 3% |
| Within Individuals | 195 | 1028.500 | 5.274 | 5.274 | 90% |
| Total | 389 | 2270.641 | 5.892 | 100% |
Disclaimer/Publisher’s Note: The statements, opinions and data contained in all publications are solely those of the individual author(s) and contributor(s) and not of MDPI and/or the editor(s). MDPI and/or the editor(s) disclaim responsibility for any injury to people or property resulting from any ideas, methods, instructions or products referred to in the content. |
© 2025 by the authors. Licensee MDPI, Basel, Switzerland. This article is an open access article distributed under the terms and conditions of the Creative Commons Attribution (CC BY) license (https://creativecommons.org/licenses/by/4.0/).
Share and Cite
Hou, Y.; Ye, H.; Yue, H.; Li, J.; Huang, L.; Qu, Z.; Ruan, R.; Lin, D.; Liang, Z.; Xie, Y.; et al. Genetic Diversity and Population Structure of Largefin Longbarbel Catfish (Hemibagrus macropterus) Inferred by mtDNA and Microsatellite DNA Markers. Animals 2025, 15, 770. https://doi.org/10.3390/ani15060770
Hou Y, Ye H, Yue H, Li J, Huang L, Qu Z, Ruan R, Lin D, Liang Z, Xie Y, et al. Genetic Diversity and Population Structure of Largefin Longbarbel Catfish (Hemibagrus macropterus) Inferred by mtDNA and Microsatellite DNA Markers. Animals. 2025; 15(6):770. https://doi.org/10.3390/ani15060770
Chicago/Turabian StyleHou, Yanling, Huan Ye, Huamei Yue, Junyi Li, Ling Huang, Ziling Qu, Rui Ruan, Danqing Lin, Zhiqiang Liang, Yong Xie, and et al. 2025. "Genetic Diversity and Population Structure of Largefin Longbarbel Catfish (Hemibagrus macropterus) Inferred by mtDNA and Microsatellite DNA Markers" Animals 15, no. 6: 770. https://doi.org/10.3390/ani15060770
APA StyleHou, Y., Ye, H., Yue, H., Li, J., Huang, L., Qu, Z., Ruan, R., Lin, D., Liang, Z., Xie, Y., & Li, C. (2025). Genetic Diversity and Population Structure of Largefin Longbarbel Catfish (Hemibagrus macropterus) Inferred by mtDNA and Microsatellite DNA Markers. Animals, 15(6), 770. https://doi.org/10.3390/ani15060770