Simple Summary
Accurate identification of the insect species is the initial step in forensic entomology case analysis. Phorid flies are significant forensic insects found on indoor and buried corpses. Due to their minute size, species identification of their immature stages presents certain challenges. This study utilized Fourier transform infrared (FTIR) combined with multivariate analytical methods to identify three common species of necrophagous phorid fly immatures. The research demonstrated that using spectral data from the fingerprint region (1800–900 cm−1) coupled with partial least squares-discriminant analysis (PLS-DA) effectively discriminates the species. This study provides an effective tool for the rapid identification of immature species in forensic entomology.
Abstract
Phorid flies serve as the main colonizers of human remains in both indoor and burial environments. Their developmental patterns can be utilized to estimate the minimum postmortem interval (minPMI). Accurate species identification, particularly for immature stages, is essential before utilizing their developmental data to estimate minPMI. This study employed Fourier transform infrared spectroscopy (FTIR) coupled with principal components analysis (PCA) and partial least squares-discriminant analysis (PLS-DA) to investigate species identification of eggs (0 h, 8 h, 16 h), larvae (12 h, 60 h, 84 h), and pupae (1 d, 5 d, 10 d) of three necrophagous Phoridae species, Dohrniphora cornuta, Diplonevra funebris, and Megaselia scalaris at 24 °C. The results showed that the FTIR spectra within the fingerprint region (1800–900 cm−1) differed among the three immature phorid flies. These differences were primarily manifested in absorption peak intensities. The PLS-DA analysis successfully distinguished the three species at the same developmental stage. This study demonstrated the feasibility of utilizing FTIR spectroscopy coupled with chemometric methods to both rapidly identify the species of immature small flies and simultaneously estimate their age.
1. Introduction
Insects are the most numerous and diverse organisms on Earth [1]. They exhibit a variety of feeding habits, typically categorized as phytophagous, saprophagous, carnivorous, and omnivorous [2]. When a corpse is present, saprophagous insects, particularly necrophagous flies (e.g., blow flies and flesh flies), are among the first to arrive. They lay eggs or first-instar larvae on the corpse, whose larvae feed on it and develop. Consequently, by analyzing the developmental data of these necrophagous flies, the minimum postmortem interval (minPMI)—defined as the time between the first insect colonization of a body and the discovery of the corpse—can be estimated indirectly [3,4,5]. However, the developmental parameters, including development time [6,7,8,9], larval body length [10,11,12], intra-puparial morphological changes [13,14,15], gene expression patterns, etc. [16,17], vary significantly among different insect species. Simply applying developmental data from one species to another can lead to significant errors in minPMI estimation. Therefore, accurate species identification, particularly for immature stages, is essential before utilizing insect developmental data to estimate minPMI.
In medico-legal entomology, species identification is typically conducted by rearing larvae and pupae collected from crime scenes to adulthood and then identifying them based on morphological characteristics [1,18,19]. Alternatively, DNA-based methods, such as species identification through sequencing and alignment of the COI gene [20,21,22] or the complete mitochondrial genome [23,24,25] of juvenile insects, are relatively time-consuming and costly. In recent years, it has also been reported that gas chromatography-mass spectrometry (GC-MS) may be used for the detection of hydrocarbons in the cuticle of juvenile insects for the identification of species [26,27], but this method requires more expensive equipment.
Fourier transform infrared spectroscopy (FTIR) is a faster and cheaper technique to identify species by the position and intensity of characteristic peaks. FTIR spectroscopy demonstrates significant application value in taxonomic research. Within archeology, FTIR analysis of variations in organic matter, mineral composition, and crystallinity within human bones enables the differentiation of skeletal samples from diverse origins [28,29]. In plant taxonomy, FTIR spectroscopy not only accurately distinguishes between different plant species but also complements traditional morphological classification, thereby enhancing identification efficiency and accuracy [30]. For microbial classification, FTIR technology has been proven to be a highly efficient and rapid tool for the robust discrimination of distinct strains [31]. Similarly, in the field of forensic entomology, FTIR spectroscopy holds considerable potential for the identification of necrophagous insect species. Barbosa et al. reported that adults of Oxysarcodexia timida (Aldrich, 1916), O. thornax (Walker, 1849), Peckia chrysostoma (Wiedemann, 1830), P. lambens (Wiedemann, 1830), Ravinia belforti (Lopes, 1939), and Tricharaea occidua (Wiedemann, 1830) (Diptera: Sarcophagidae) native to Neotropical regions could be distinguished by Attenuated total reflection Fourier transform infrared (ATR-FTIR) spectroscopy combined with variable selection techniques such as genetic algorithm-linear discriminant analysis (GA-LDA) and successive projection algorithm-linear discriminant analysis (SPA-LDA) [32]. Pickering et al. utilized ART-FTIR spectroscopy coupled with a support vector machine (SVM) algorithm to rapidly discriminate the maggots of Calliphora vomitoria Linnaeus, 1758, Lucilia sericata (Meigen, 1826) (Diptera: Calliphoridae), and Musca domestica Linnaeus, 1758 (Diptera: Muscidae), with a cross-validation accuracy of 86.21% [33]. Zhang et al. employed ATR-FTIR spectroscopy to acquire spectral data from empty pupariums of five fly species and combined this with machine learning methods, including SVM, artificial neural networks (ANN), and random forest (RF), for species differentiation, with the SVM model demonstrating the highest classification accuracy [34].
Compared to larger fly species, diminutive phorid flies can penetrate enclosures that are relatively sealed (such as closed rooms, vehicle interiors, sealed plastic bags, and coffins) through narrow crevices [35,36,37,38,39]. They are capable of rapidly colonizing corpses and may become the primary or even the only entomological evidence available at crime scenes [40]. This study aims to systematically evaluate the effectiveness of FTIR spectroscopy for species identification of phorid flies at immature developmental stages (egg, larva, and pupa), thereby establishing a rapid diagnostic protocol based on spectral signatures to facilitate accurate species determination of immature phorid flies in forensic entomology practice.
2. Materials and Methods
2.1. Insect
The adult specimens of Dohrniphora cornuta (Bigot, 1857), Diplonevra funebris (Meigen, 1826), and Megaselia scalaris (Loew, 1866) were collected using rotten lean pork as bait in Shenyang City (123°25′ E, 41°48′ N), Liaoning Province, China. Each specimen was identified following the taxonomic keys [41]. All species were reared in the laboratory on fresh lean pork and maintained at 21–24 °C and 75% relative humidity with a 12 h light-dark photoperiod [42].
2.2. Sample Preparation
For each of the three species, 3–5 pairs of adult flies were introduced into a 1000 mL narrow-necked bottle (Sichuan Shubo Co., Ltd., Chongzhou, China). Fresh lean pork was placed inside the bottle to attract oviposition. The bottle was sealed with industrial filter cloth (Suzhou Tebang Environmental Protection Technology Co., Ltd., Suzhou, China). The bottle was then placed in an artificial climate chamber (Ningbo Laifu Technology Co., Ltd., Ningbo, China) set at 24 °C, 75% relative humidity, and a 12 h light-dark photoperiod. Upon detection of eggs, timing was initiated; eggs laid within 2 h were designated as the 0 h eggs. These eggs were gently transferred using a soft, fine-bristle brush into Petri dishes. An appropriate amount of distilled water was sprayed to maintain humidity, and the dishes were sealed with parafilm. Timing for larval development commenced upon the emergence of the first-instar larva; first-instar larvae hatched within 2 h were designated as 0 h larvae. The larvae were then gently transferred into 1000 mL narrow-necked bottles containing fresh lean pork as a food source. Larval growth was monitored daily. Timing for pupal development commenced upon observation of the first prepupa formation. The prepupae formed within 2 h were designated as 0 h pupae. The pupae were transferred into Petri dishes, which were then sealed with parafilm for daily observations. Throughout the development of the three phorid fly species, samples were collected as follows: eggs at 0 h, 8 h, and 16 h (nine eggs per time point); larvae at 12 h, 60 h, and 84 h (three larvae per time point); and pupae at 1 d, 5 d, and 10 d (three pupae per time point). The selected time points represent the early, middle, and late developmental stages of eggs, larvae, and pupae. Collected samples were frozen and stored at −80 °C.
2.3. Collection of FTIR Spectra
The samples were thoroughly rinsed with distilled water before using. For egg stage sample preparation, three eggs were pooled as one independent sample and ground thoroughly in an agate mortar with 0.02 g of spectroscopic-grade KBr (Shanghai Macklin Biochemical Co., Ltd., Shanghai, China). The entire homogenate was pressed into a transparent pellet in the manual hydraulic press (Specac Co., Ltd., Kent, UK). For larval and pupal stages, an individual larva or pupa was weighed using an analytical balance (Tianma Balance Instrument Co., Ltd., Tianjin, China). Spectroscopic-grade KBr was then weighed according to a 1:100 (w/w) ratio (larva/pupa:KBr). The specimen and KBr were combined in an agate mortar and ground thoroughly. Subsequently, 0.02 g of the mixture was accurately weighed and then transferred into a pellet die set, subsequently compressed into a transparent pellet.
The prepared pellet was mounted on the sample stage of an Agilent Cary 630 FTIR spectrometer (Agilent Technologies, Inc., Santa Clara, CA, USA) for spectral acquisition. Spectra were collected over the range of 4000–400 cm−1 with 32 scans per measurement and a resolution of 4 cm−1. Technical triplicates were performed for each sample. For each species at each time point, three independent biological replicates were analyzed, resulting in the use of a total of 81 eggs, 27 larvae, and 27 pupae. A background spectrum was collected immediately before each sample measurement. After completing data collection for each sample, the pellet die set was meticulously cleaned with distilled water, followed by absolute ethanol to avoid cross-contamination.
2.4. Data Analysis
The intensities of the major absorption peaks in the biological fingerprint region across different developmental stages of three phorid fly species were compared using the Kruskal–Wallis test, followed by Dunn’s post hoc test for pairwise comparisons. Statistical significance was defined as α = 0.05. All statistical analyses were performed using GraphPad Prism 9.5 software.
The raw spectral data were subjected to first-order derivative transformation using the Savitzky–Golay convolution algorithm (15 smoothing points) in OMNIC 9.2 software, followed by standard normal variate (SNV) transformation performed in MATLAB R2024a. The preprocessed data were split into training and test sets at a ratio of 7:3. Based on the training set, principal component analysis (PCA) and partial least squares-discriminant analysis (PLS-DA) models were established in SIMCA 14.1. The optimal model was selected through comparative analysis of model parameters and visualization results. The performance of the chosen model was ultimately evaluated using the test set. A confusion matrix was generated with R 4.4.3 software.
3. Results
3.1. FTIR Spectra of Three Necrophagous Phorid Flies at Different Developmental Stages
The average spectra of the fingerprint region for the three phorid fly species at immature stages are shown in Figure 1. Eggs of all three species exhibited intense absorption peaks near 1084 cm−1, 1241 cm−1, 1350 cm−1, 1384 cm−1, 1455 cm−1, 1544 cm−1, 1645 cm−1, and 1746 cm−1 (Figure 1). While no species-specific characteristic absorption peaks were identified, significant differences in peak intensities were observed among the species (Figure 1 and Figure 2).
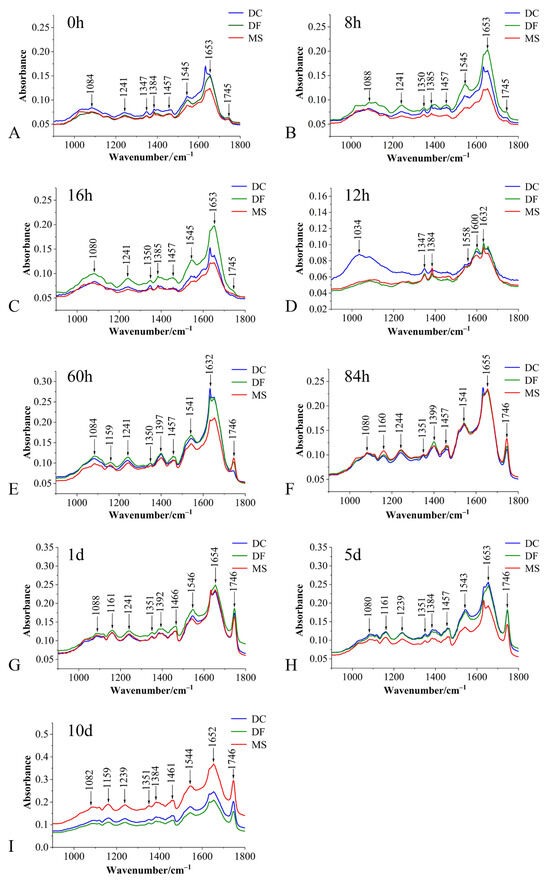
Figure 1.
Average spectra of the biological fingerprint region for three Phoridae species at different developmental stages. (A–C): egg stage; (D–F): larval stage; (G–I): pupal stage; DC: Dohrniphora cornuta; DF: Diplonevra funebris; MS: Megaselia scalaris.
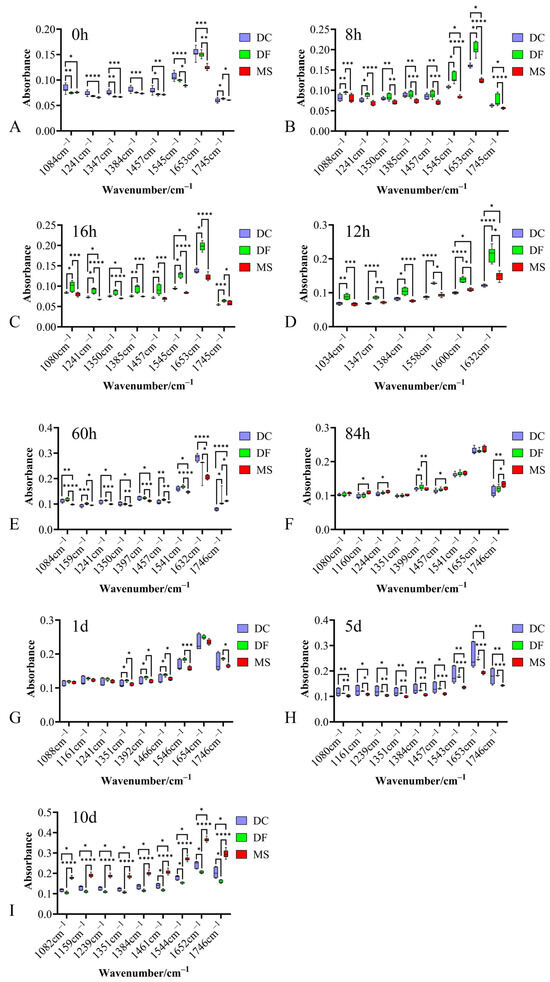
Figure 2.
Box plot of absorption peak intensities in the biological fingerprint region spectra for three Phoridae species at different developmental stages. (A–C): egg stage; (D–F): larval stage; (G–I): pupal stage; DC: Dohrniphora cornuta; DF: Diplonevra funebris; MS: Megaselia scalaris. * represents p < 0.05, ** represents p < 0.01, *** represents p < 0.001, **** represents p < 0.0001.
Compared to the average spectra of eggs and 12 h larvae, distinct differences in absorbance at the 1159 cm−1 peak were also evident in 60 h and 84 h larvae, and pupae (Figure 1A–I).
These absorption peaks primarily reflect vibrational characteristics of functional groups or chemical bonds associated with carbohydrates, lipids, proteins, and DNA within the tissues (Table 1).

Table 1.
Identification of the main absorption peaks in the fingerprint region of three Phoridae species.
3.2. Discrimination Analysis of Three Necrophagous Phorid Flies at the Identical Developmental Time Points
Based on the FTIR data from the biological fingerprint region, PCA and PLS-DA models were established for each immature stage at 24 °C.
In the PCA models, the first two principal components (PC1 and PC2) collectively accounted for the following proportions of variance in the original data: 59.1–79.9% for the egg stage, 71.8–78.1% for the larval stage, and 57.9–75.2% for the pupal stage (Figure 3A,C,E, Figure 4A,C,E and Figure 5A,C,E). Samples from different species showed partial clustering by species; however, the sample points were relatively scattered with overlapping clusters (Figure 4A,E and Figure 5E).
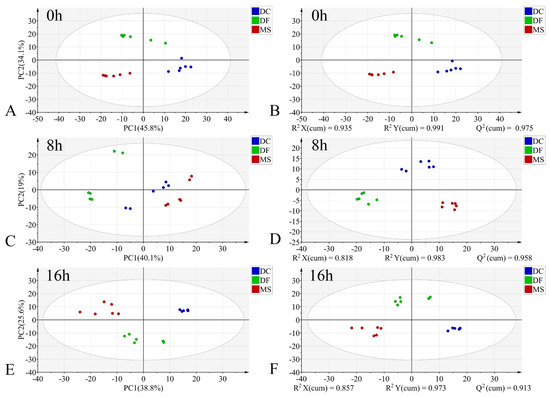
Figure 3.
PCA and PLS-DA score plots of FTIR data in the biological fingerprint region for three Phoridae species at the same time point during the egg stage. (A,C,E): PCA; (B,D,F): PLS-DA; DC: Dohrniphora cornuta; DF: Diplonevra funebris; MS: Megaselia scalaris.
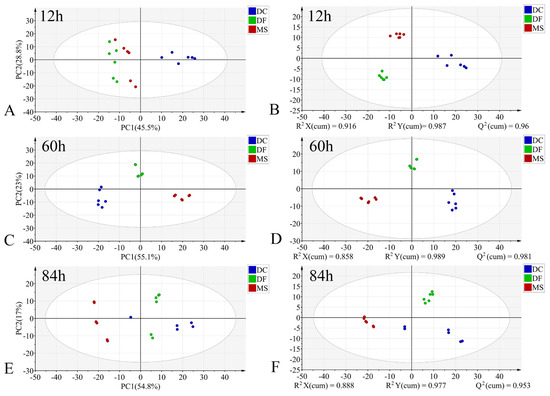
Figure 4.
PCA and PLS-DA score plots of FTIR data in the biological fingerprint region for three Phoridae species at the same time point during the larval stage. (A,C,E): PCA; (B,D,F): PLS-DA; DC: Dohrniphora cornuta; DF: Diplonevra funebris; MS: Megaselia scalaris.
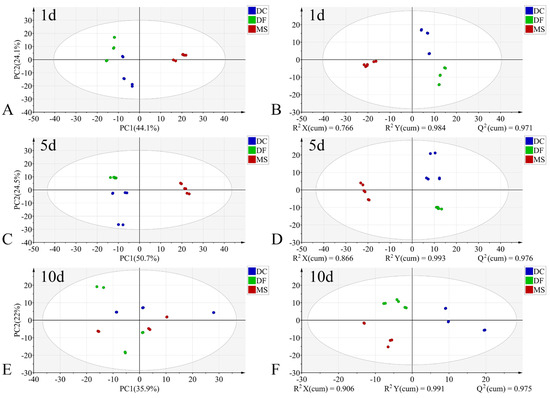
Figure 5.
PCA and PLS-DA score plots of FTIR data in the biological fingerprint region for three Phoridae species at the same time point during the pupal stage. (A,C,E): PCA; (B,D,F): PLS-DA; DC: Dohrniphora cornuta; DF: Diplonevra funebris; MS: Megaselia scalaris.
In the PLS-DA models, samples at identical time points exhibited clearer clustering trends compared to the PCA models (Figure 3B,D,F, Figure 4B,D,F and Figure 5B,D,F). The model parameters indicated good performance: R2X > 0.766, R2Y > 0.973, and Q2 > 0.913, reflecting strong explanatory and predictive capabilities. Permutation tests further confirmed the models were not overfitted (R2 < 0.391, Q2 < −0.368). External validation using the test set demonstrated 100% classification accuracy for all PLS-DA models (Table 2).

Table 2.
Cross-validation, permutation test, and external validation of the PLS-DA models for different developmental stages of three phorid flies.
3.3. Discrimination Analysis of Three Necrophagous Phorid Flies at the Same Developmental Stage
In addition to the biological fingerprint region (1800–900 cm−1) spectral data, we also constructed PLS-DA models using the full-range spectra (4000–400 cm−1), VIP-selected full-range features (4000–400 cm−1, VIP > 1), and VIP-selected fingerprint region features (1800–900 cm−1, VIP > 1) to analyze and compare sample clustering patterns within the same developmental stage.
For the egg stage, the PLS-DA model constructed using the 1800–900 cm−1 dataset exhibited good performance: R2X = 0.97, R2Y = 0.909, Q2 = 0.688, the model has a good degree of interpretation and prediction, permutation test intercepts R2 = 0.262 and Q2 = −1.17, without fitting, the accuracy of model evaluation is 100% (Table 3). In the corresponding score plot (Figure 6C), samples from different developmental times clustered by species. In contrast, the discriminant model built using the full-range 4000–400 cm−1 dataset showed signs of overfitting (permutation test R2 = 0.416, Q2 = −1.39) (Table 3). Its score plot revealed high dispersion of sample points across different species and developmental times, with indistinct clustering trends (Figure 6A). The model utilizing the 4000–400 cm−1 (VIP > 1) dataset achieved a classification accuracy of 96.3% (Table 3), but incurred one misclassification where a 16 h M. scalaris egg was incorrectly assigned to the 8 h group (Figure 7). Conversely, the discriminant model based on 1800–900 cm−1 (VIP > 1) demonstrated robust performance: R2X = 0.948, R2Y = 0.86, Q2 = 0.725, permutation test intercepts R2 = 0.198 and Q2 = −1.05, confirming good explanatory and predictive power, no overfitting, and 100% classification accuracy (Table 3). Its score plot (Figure 6D) showed reduced sample dispersion and clearer clustering. Notably, along the X-axis, samples clustered primarily according to developmental time within each species.

Table 3.
Cross-validation, permutation test, and external validation of the PLS-DA models for the egg stage across different datasets.
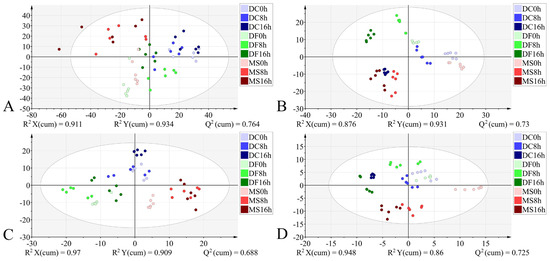
Figure 6.
PLS-DA score plots based on the different datasets from the egg stage. (A): 4000–400 cm−1; (B): 4000–400 cm−1 (VIP > 1); (C): 1800–900 cm−1; (D): 1800–900 cm−1 (VIP > 1). DC: Dohrniphora cornuta; DF: Diplonevra funebris; MS: Megaselia scalaris.
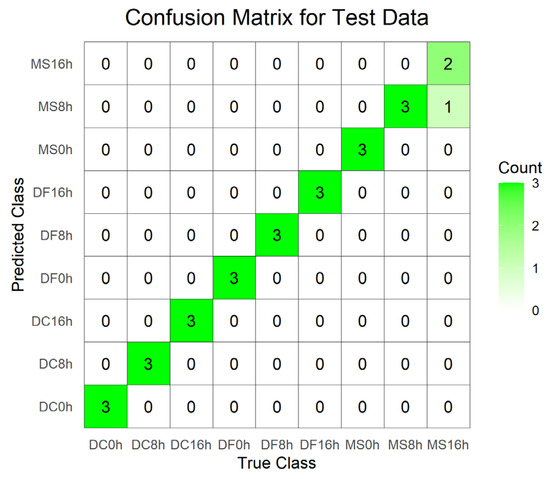
Figure 7.
Confusion matrix of the test set for the PLS-DA model constructed from spectral data 4000–400 cm−1 (VIP > 1) of the egg stage. DC: Dohrniphora cornuta; DF: Diplonevra funebris; MS: Megaselia scalaris.
During the larval stage, models constructed using all four datasets exhibited favorable classification performance: R2X > 0.85, R2Y > 0.878, Q2 > 0.708, demonstrating good model fit. External validation achieved 100% accuracy. However, permutation testing revealed overfitting in the model based on the 4000–400 cm−1 dataset (Table 4). The model utilizing the 1800–900 cm−1 dataset outperformed others in terms of explanatory power, predictive capability, and visual clustering in the score plot. Samples from the three phorid fly species exhibited a stronger tendency to cluster by developmental time than by species along the X-axis (Figure 8, Table 4).

Table 4.
Cross-validation, permutation test, and external validation of the PLS-DA models for the larval stage across different datasets.
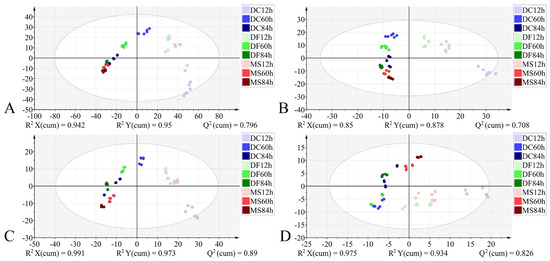
Figure 8.
PLS-DA score plots based on the different datasets from the larval stage. (A): 4000–400 cm−1; (B): 4000–400 cm−1 (VIP > 1); (C): 1800–900 cm−1; (D): 1800–900 cm−1 (VIP > 1). DC: Dohrniphora cornuta; DF: Diplonevra funebris; MS: Megaselia scalaris.
For the pupal stage, models constructed using all four datasets demonstrated good performance: R2X > 0.882, R2Y > 0.813, Q2 > 0.669, indicating strong explanatory and predictive capabilities, with all achieving 100% classification accuracy. However, permutation tests indicated the presence of overfitting in models constructed using both the full 4000–400 cm−1 spectral range and the VIP-filtered (VIP > 1) subset of this range (Table 5). The model based on the 1800–900 cm−1 dataset demonstrated superior interpretability and predictive capability compared to the model using VIP > 1 from the same spectral range (Table 5). In the corresponding score plot (Figure 9), samples generally exhibited distinct species-specific clustering at identical developmental times. Notably, along the Y-axis, samples from the three phorid species showed a trend of grouping by developmental time.

Table 5.
Cross-validation, permutation test, and external validation of the PLS-DA models for the pupal stage across different datasets.
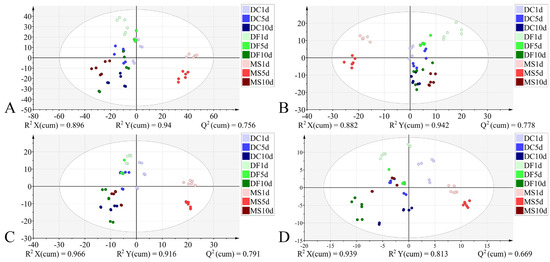
Figure 9.
PLS-DA score plots based on the different datasets from the pupal stage. (A): 4000–400 cm−1; (B): 4000–400 cm−1 (VIP > 1); (C): 1800–900 cm−1; (D): 1800–900 cm−1 (VIP > 1). DC: Dohrniphora cornuta; DF: Diplonevra funebris; MS: Megaselia scalaris.
4. Discussion
FTIR spectroscopy enables rapid analysis of trace biological samples by detecting vibrational signatures of chemical groups within biomolecules, directly reflecting molecular structure and composition. While widely reported for species identification in plants and mammals [43,44,45], its application in forensic entomology remains limited. To date, studies have only demonstrated its use for discriminating six species of neotropical Sarcophagidae adults [32], larvae of C. vomitoria, L. sericata, and M. domestica [33], as well as empty pupariums of Aldrichina grahami, Sarcophaga africa, Chrysomya megacephala, Sarcophaga peregrina, and M. domestica [34]. This study employed FTIR spectroscopy to detect changes in chemical functional groups during the immature stages of necrophagous phorid flies for the first time.
Distinct differences were observed in the average FTIR spectra of eggs (0 h, 8 h, 16 h), larvae (12 h, 60 h, 84 h), and pupae (1 d, 5 d, 10 d) across three phorid fly species: D. cornuta, D. funebris, and M. scalaris. PCA and PLS-DA are two important multivariate analysis methods in chemometrics, with PCA being an unsupervised pattern recognition method and PLS-DA being a supervised one [46]. Two distinct models, the PCA and PLS-DA, were constructed based on the spectral data in this study. In most PCA models, the cumulative variance captured by the first two components is below 75%, which is considered suboptimal. Compared to the PCA model, the PLS-DA model demonstrated tighter clustering of samples belonging to the same species in the score plot, indicating superior performance for this purpose.
Subsequently, we established PLS-DA models for three different developmental stages of phorid flies using four different datasets. For the egg stage, the model constructed using the 4000–400 cm−1 dataset exhibited the highest R2Y (0.934) and Q2 (0.764) values among all datasets. However, permutation validation revealed R2 > 0.4, indicating overfitting, and the score plot showed high dispersion among sample points. The model built with the 4000–400 cm−1 (VIP > 1) dataset resulted in misclassification. When using the 1800–900 cm−1 dataset and the 1800–900 cm−1 (VIP > 1) dataset, the former model demonstrated superior parameters except for a slightly lower Q2 compared to the latter. Permutation tests confirmed neither model was overfitted. Sample points in the score plot of the 1800–900 cm−1 model exhibited lower dispersion and more distinct clustering. For the larval stage, the model based on the 4000–400 cm−1 dataset showed overfitting. The other three datasets did not exhibit overfitting. Among these, the 1800–900 cm−1 dataset yielded optimal model parameters and the lowest dispersion of sample points in the score plot. For the pupal stage, models built with both the 4000–400 cm−1 and 4000–400 cm−1 (VIP > 1) datasets displayed overfitting. The model constructed using the 1800–900 cm−1 dataset demonstrated better parameters than the model based on the 1800–900 cm−1 (VIP > 1) dataset. Sample points in the score plot of the 1800–900 cm−1 model showed lower dispersion. In summary, after comparing model parameters and score plots, we conclude that the model constructed using the 1800–900 cm−1 spectral data is optimal. This is consistent with the findings of previous studies [32,47,48,49,50].
Furthermore, in the score plots generated using the 1800–900 cm−1 dataset, besides the distinct clustering of egg samples by species at different developmental time points, larval and pupal stage samples also exhibited clustering according to developmental time. In the score plots generated using the 1800–900 cm−1 (VIP > 1) dataset, samples from the egg, larval, and pupal stages all exhibited a trend of clustering by developmental time, particularly evident during the early stage of each developmental period. Recently, some researchers also reported that it is feasible to determine the intra-puparial age of Calliphora vicina and Phormia regina by combining FTIR spectroscopy with chemometric methods [46,51].
This indicates that FTIR spectroscopy combined with chemometric methods is applicable not only for identifying species during the immature stages of phorid flies, but also for determining their age. In forensic entomology practice, larval or pupal specimens collected at crime scenes are typically subjected to species identification via morphological or molecular biological methods [1,2]. Once the species is determined, the minPMI is subsequently estimated based on the species-specific developmental data. In contrast, FTIR requires only a single set of spectral data to simultaneously achieve species identification and developmental stage determination within a few hours. This dual-purpose analytical capability provides a novel technological pathway for the rapid and efficient estimation of the minPMI.
However, this study is preliminary and has several limitations. Sampling was conducted at only three time points per developmental stage (early, middle, and late), with a limited number of specimens. It remains unclear whether similar discriminatory performance could be achieved with larger sample sizes and higher sampling density. Furthermore, the effectiveness of this method in identifying larvae of different instars requires further investigation. Samples in this study were directly frozen and stored at −80 °C. In forensic entomology, however, a common preservation method involves heat or Carnoy’s solution killing larvae or pupae, followed by immersion in ethanol [52,53,54]. Whether samples preserved using this method exhibit FTIR spectral differences compared to frozen samples is uncertain, given that heating, ethanol, and Carnoy’s solution can break hydrogen bonds and ionic bonds in nucleic acids and protein conformations, thereby denaturing these macromolecules [55,56]. Additionally, different geographical environments can also lead to variations in the FTIR spectra of species, such as Dendrobium officinale [57] and Larimichthys crocea [58], thereby affecting species identification results based on infrared spectroscopy. Nevertheless, our study did not account for this factor. There is no doubt that the combination of morphological and molecular techniques currently represents the most reliable approach for insect identification. The FTIR method cannot yet replace them. However, FTIR technology demonstrates unique advantages in estimating minPMI, as it enables simultaneous species identification and age determination. This positions FTIR as a promising tool for future applications. Nevertheless, before this method can be practically implemented, substantial work remains to be done. This includes validating its effectiveness on specimens preserved in organic solvents and dried specimens, evaluating its performance in distinguishing different instars larvae and geographic populations, and establishing an FTIR spectral database for the immature stages of common necrophagous flies.
5. Conclusions
This study represents the first analysis of the FTIR spectral characteristics of three species of immature phorid flies. Distinct differences were observed in the intensity of the major absorption peaks within the fingerprint region (1800–900 cm−1) among the three Phoridae species. The classification performance of PLS-DA was superior to that of PCA. The FTIR combined with PLS-DA not only effectively discriminated phorid flies at the same developmental stage, but also simultaneously estimated their age. Our work demonstrates the significant application potential of FTIR spectroscopy coupled with multivariate analysis techniques for the rapid identification of immature stages of necrophagous insect species.
Author Contributions
Conceptualization: W.J. and D.F.; Data Curation: W.J.; Methodology: W.J., Y.T. and D.F.; Analysis: W.J., Y.T. and D.F.; Funding Acquisition: D.F.; Project Administration: Y.T. and D.F.; Software: W.J.; Supervision: D.F.; Validation: Y.T. and W.J.; Visualization: Y.T. and W.J.; Writing—Original Draft: W.J. and D.F.; Writing—Reviewing and Editing: Y.T. and D.F. All authors have read and agreed to the published version of the manuscript.
Funding
This study was funded by the National Natural Science Foundation of China (grant number 31772541) and the General Research Project of the Liaoning Provincial Department of Education for Higher Education Institutions (grant number LJ212511035006).
Institutional Review Board Statement
Dohrniphora cornuta (Bigot, 1857), Diplonevra funebris (Meigen, 1826), and Megaselia scalaris (Loew, 1866) are necrophagous species easily trapped using pork baits. The samples collected and used for this study do not involve humans or animals. Therefore, this study did not need ethical approval or permissions to collect the samples.
Informed Consent Statement
Not applicable.
Data Availability Statement
Data are provided within the article. Further details or information can be directed to the corresponding author.
Conflicts of Interest
The authors declare no conflicts of interest.
References
- Byrd, J.H.; Castner, J.L. Forensic Entomology: The Utility of Arthropods in Legal Investigations, 2nd ed.; CRC Press: Boca Raton, FL, USA, 2010; p. 17. [Google Scholar]
- Cai, J.F. Forensic Entomology; People’s Medical Publishing House: Beijing, China, 2015; p. 19. [Google Scholar]
- Greenberg, B. Flies as forensic indicators. J. Med. Entomol. 1991, 28, 565–577. [Google Scholar] [CrossRef]
- Amendt, J.; Krettek, R.; Zehner, R. Forensic entomology. Naturwissenschaften 2004, 91, 51–65. [Google Scholar] [CrossRef]
- Amendt, J.; Bugelli, V.; Bernhardt, V. Time flies-age grading of adult flies for the estimation of the post-mortem interval. Diagnostics 2021, 11, 152. [Google Scholar] [CrossRef] [PubMed]
- Kotzé, Z.; Villet, M.H.; Weldon, C.W. Effect of temperature on development of the blowfly, Lucilia cuprina (Wiedemann) (Diptera: Calliphoridae). Int. J. Legal. Med. 2015, 129, 1155–1162. [Google Scholar] [CrossRef] [PubMed]
- Wang, Y.; Zhang, Y.N.; Liu, C.; Hu, G.L.; Wang, M.; Yang, L.J.; Chu, J.; Wang, J.F. Development of Aldrichina grahami (Diptera: Calliphoridae) at constant temperatures. J. Med. Entomol. 2018, 55, 1402–1409. [Google Scholar] [CrossRef]
- Feng, D.X.; Liu, G.C. Pupal age estimation of forensically important Megaselia spiracularis Schmitz (Diptera: Phoridae). Forensic Sci. Int. 2013, 231, 199–203. [Google Scholar] [CrossRef]
- Feng, D.X.; Liu, G.C. Pupal age estimation of forensically important Megaselia scalaris (Loew) (Diptera: Phoridae). Forensic Sci. Int. 2014, 236, 133–137. [Google Scholar] [CrossRef]
- Wang, Y.; Zhang, Y.N.; Hu, G.L.; Wang, M.; Zhu, R.; Zhai, Y.S.; Sun, J.; Li, X.F.; Wang, L.H.; Wu, M.W.; et al. Development of Megaselia spiracularis (Diptera: Phoridae) at different constant temperatures. J. Therm. Biol. 2020, 93, 102722. [Google Scholar] [CrossRef]
- Zhang, Y.N.; Li, L.L.; Liao, M.Q.; Kang, C.T.; Hu, G.W.; Guo, Y.; Wang, Y.; Wang, J.F. Development of Megaselia scalaris at constant temperatures and its significance in estimating the time of death. Int. J. Legal. Med. 2024, 138, 97–106. [Google Scholar] [CrossRef]
- Han, W.; Feng, D.X.; Tang, Y.N. The effect of soil type and moisture on the development of forensically important Megaselia scalaris and Dohrniphora cornuta (Diptera: Phoridae). Insects 2024, 15, 666. [Google Scholar] [CrossRef]
- Ramos-Pastrana, Y.; Londoño, C.A.; Wolff, M. Intra-puparial development of Lucilia eximia (Diptera, Calliphoridae). Acta. Amaz. 2017, 47, 63–70. [Google Scholar] [CrossRef][Green Version]
- Karabey, T.; Sert, O. The analysis of pupal development period in Lucilia sericata (Diptera: Calliphoridae) forensically important insect. Int. J. Leg. Med. 2018, 132, 1185–1196. [Google Scholar] [CrossRef] [PubMed]
- Flissak, J.C.; Moura, M.O. Intrapuparial development of Sarconesia chlorogaster (Diptera: Calliphoridae) for postmortem interval estimation (PMI). J. Med. Entomol. 2018, 55, 277–284. [Google Scholar] [CrossRef]
- Boehme, P.; Spahn, P.; Amendt, J.; Zehner, R. Differential gene expression during metamorphosis: A promising approach for age estimation of forensically important Calliphora vicina pupae (Diptera: Calliphoridae). Int. J. Legal Med. 2013, 127, 243–249. [Google Scholar] [CrossRef]
- Shang, Y.; Ren, L.; Yang, L.; Wang, S.; Chen, W.; Dong, J.; Ma, H.; Qi, X.; Guo, Y. Differential gene expression for age estimation of forensically important Sarcophaga peregrina (Diptera: Sarcophagidae) intrapuparial. J. Med. Entomol. 2020, 57, 65–77. [Google Scholar] [CrossRef]
- Chen, L.S. Chinese Necrophagous Flies; Guizhou Science and Technology Publishing House: Guiyang, China, 2013; pp. 35–216. [Google Scholar]
- Amendt, J.; Goff, M.L.; Campobasso, C.P.; Grassberger, M. Current Concepts in Forensic Entomology; Springer: Berlin, Germany, 2010; pp. 43–45. [Google Scholar]
- Nelson, L.A.; Wallman, J.F.; Dowton, M. Using COI barcodes to identify forensically and medically important blowflies. Med. Vet. Entomol. 2007, 21, 44–52. [Google Scholar] [CrossRef]
- Jordaens, K.; Sonet, G.; Richet, R.; Dupont, E.; Braet, Y.; Desmyter, S. Identification of forensically important Sarcophaga species (Diptera: Sarcophagidae) using the mitochondrial COI gene. Int. J. Legal. Med. 2013, 127, 491–504. [Google Scholar] [CrossRef]
- Meng, F.; Ren, L.; Wang, Z.; Deng, J.; Guo, Y.; Chen, C.; Finkelbergs, D.; Cai, J. Identification of forensically important blow flies (Diptera: Calliphoridae) in China based on COI. J. Med. Entomol. 2017, 54, 1193–1200. [Google Scholar] [CrossRef]
- Shang, Y.; Ren, L.; Chen, W.; Zha, L.; Cai, J.; Dong, J.; Guo, Y. Comparative mitogenomic analysis of forensically important sarcophagid flies (Diptera: Sarcophagidae) and implications of species identification. J. Med. Entomol. 2019, 2, 392–407. [Google Scholar] [CrossRef]
- Palevich, N.; Carvalho, L.; Maclean, P. Characterization of the complete mitochondrial genome of the New Zealand parasitic blowfly Calliphora vicina (Insecta: Diptera: Calliphoridae). Mitochondrial. DNA. B. Resour. 2021, 3, 1270–1272. [Google Scholar] [CrossRef]
- Dai, S.T.; Feng, D.X.; Sun, D.P. Characterization and phylogenetic analysis of the complete mitochondrial genomes of two tiny necrophagous phorid flies, Metopina sagittata and Puliciphora borinquenensis (Diptera: Phoridae). J. Med. Entomol. 2022, 59, 120–128. [Google Scholar] [CrossRef] [PubMed]
- Ye, G.; Li, K.; Zhu, J.; Zhu, G.; Hu, C. Cuticular hydrocarbon composition in pupal exuviae for taxonomic differentiation of six necrophagous flies. J. Med. Entomol. 2007, 44, 450–456. [Google Scholar] [CrossRef] [PubMed]
- Braga, M.V.; Pinto, Z.T.; de Carvalho Queiroz, M.M.; Matsumoto, N.; Blomquist, G.J. Cuticular hydrocarbons as a tool for the identification of insect species: Puparial cases from Sarcophagidae. Acta Trop. 2013, 128, 479–485. [Google Scholar] [CrossRef]
- Bayarı, S.H.; Özdemir, K.; Sen, E.H.; Araujo-Andrade, C.; Erdal, Y.S. Application of ATR-FTIR spectroscopy and chemometrics for the discrimination of human bone remains from different archaeological sites in Turkey. Spectrochim. Acta A Mol. Biomol. Spectrosc. 2020, 237, 118311. [Google Scholar] [CrossRef]
- Leskovar, T.; Zupanič Pajnič, I.; Jerman, I.; Črešnar, M. Separating forensic, WWII, and archaeological human skeletal remains using ATR-FTIR spectra. Int. J. Legal. Med. 2020, 134, 811–821. [Google Scholar] [CrossRef]
- Javier-Astete, R.; Melo, J.; Jimenez-Davalos, J.; Zolla, G. Classification of Amazonian fast-growing tree species and wood chemical determination by FTIR and multivariate analysis (PLS-DA, PLS). Sci. Rep. 2023, 13, 7827. [Google Scholar] [CrossRef]
- Ghosh, S.B.; Bhattacharya, K.; Nayak, S.; Mukherjee, P.; Salaskar, D.; Kale, S.P. Identification of different species of Bacillus isolated from Nisargruna Biogas Plant by FTIR, UV-Vis and NIR spectroscopy. Spectrochim. Acta A Mol. Biomol. Spectrosc. 2015, 148, 420–426. [Google Scholar] [CrossRef]
- Barbosa, T.M.; de Lima, L.A.S.; Dos Santos, M.C.D.; Vasconcelos, S.D.; Gama, R.A.; Lima, K.M.G. A novel use of infra-red spectroscopy (NIRS and ATR-FTIR) coupled with variable selection algorithms for the identification of insect species (Diptera: Sarcophagidae) of medico-legal relevance. Acta Trop. 2018, 185, 1–12. [Google Scholar] [CrossRef]
- Pickering, C.L.; Hands, J.R.; Fullwood, L.M.; Smith, J.A.; Baker, M.J. Rapid discrimination of maggots utilising ATR-FTIR spectroscopy. Forensic Sci. Int. 2015, 249, 189–196. [Google Scholar] [CrossRef]
- Zhang, X.; Yang, F.; Xiao, J.; Qu, H.; Jocelin, N.F.; Ren, L.; Guo, Y. Analysis and comparison of machine learning methods for species identification utilizing ATR-FTIR spectroscopy. Spectrochim. Acta A Mol. Biomol. Spectrosc. 2024, 308, 123713. [Google Scholar] [CrossRef]
- Reibe, S.; Madea, B. Use of Megaselia scalaris (loew) (Diptera: Phoridae) for post-mortem interval estimation indoors. Parasitol. Res. 2010, 106, 637–640. [Google Scholar] [CrossRef] [PubMed]
- Disney, R.H.L.; Garcia-Rojo, A.; Lindström, A.; Manlove, J.D. Further occurrences of Dohrniphora cornuta (Bigot) (Diptera, Phoridae) in forensic cases indicate likely importance of this species in future cases. Forensic Sci. Int. 2014, 241, 20–22. [Google Scholar] [CrossRef] [PubMed]
- Mariani, R.; García-Mancuso, R.; Varela, G.L.; Kierbel, I. New records of forensic entomofauna in legally buried and exhumed human infants remains in Buenos Aires, Argentina. J. Forensic. Leg. Med. 2017, 52, 215–220. [Google Scholar] [CrossRef] [PubMed]
- Pittner, S.; Bugelli, V.; Benbow, M.E.; Ehrenfellner, B.; Zissler, A.; Campobasso, C.P.; Oostra, R.J.; Aalders, M.C.G.; Zehner, R.; Lutz, L.; et al. The applicability of forensic time since death estimation methods for buried bodies in advanced decomposition stages. PLoS ONE 2020, 15, 243395. [Google Scholar] [CrossRef]
- Zou, T.L.; Feng, D.X.; Huang, G.Y.; Sun, D.P.; Dai, S.T. Species composition and succession of necrophagous insects on small buried baits in China. J. Med. Entomol. 2022, 59, 1182–1190. [Google Scholar] [CrossRef]
- Li, L.; Feng, D.X.; Wu, J. Research progress of carrion-breeding phorid flies for post-mortem interval estimation in forensic medicine. J. Forensic Med. 2016, 32, 363–366. [Google Scholar]
- Liu, G.C. A Taxonomic Study of Chinese Phorid flies Diptera: Phoridae; Northeastern University Press: Shenyang, China, 2001; pp. 93–103. [Google Scholar]
- Feng, D.X.; Wu, J.; Sun, D.P. Intrapuparial age estimation of forensically important Dohrniphora cornuta (Diptera: Phoridae). J. Med. Entomol. 2021, 58, 616–624. [Google Scholar] [CrossRef]
- Zhao, H.R.; Wang, X.Y.; Chen, G.H.; Wen, S.M. Identification of wheat varieties by Fourier transform infrared spectroscopy. Spectrosc. Spectr. Anal. 2004, 24, 1338–1341. [Google Scholar]
- Wei, X.; Yu, K.; Wu, H.; Shen, C.; Li, H.; Liu, R.; Sun, Q.; Wang, Z. Species identification of teeth of human and non-human. Forensic Sci. Int. 2022, 333, 111205. [Google Scholar] [CrossRef]
- Wei, X.; Yu, K.; Wu, D.; Huang, P.; Sun, Q.; Wang, Z. Species identification of semen stains by ATR-FTIR spectroscopy. Int. J. Legal. Med. 2021, 135, 73–80. [Google Scholar] [CrossRef]
- Zhang, R.; Gao, Y.; Hu, G.; Wang, Y.; Li, L.; Guo, Y.; Shao, S.; Liu, S.; Wang, Y. Age estimation of Phormia regina pupae based on ATR-FTIR and chemometrics. Spectrochim. Acta A Mol. Biomol. Spectrosc. 2025, 325, 125175. [Google Scholar] [CrossRef] [PubMed]
- Zheng, H.R.; Zhou, J.; Zhou, J.Y.; Chen, X.S.; Liu, J.; Wang, B. Identification of textile artifacts using infrared spectroscopy and chemometrics. J. Zhejiang Sci.-Tech. Univ. Nat. Sci. 2022, 47, 490–495. [Google Scholar]
- Guo, S.; Wei, G.; Chen, W.; Lei, C.; Xu, C.; Guan, Y.; Ji, T.; Wang, F.; Liu, H. Fast and deep diagnosis using blood-based ATR-FTIR spectroscopy for digestive tract Cancers. Biomolecules 2022, 12, 1815. [Google Scholar] [CrossRef] [PubMed]
- Coutinho, C.P.; Sá-Correia, I.; Lopes, J.A. Use of Fourier transform infrared spectroscopy and chemometrics to discriminate clinical isolates of bacteria of the Burkholderia cepacia complex from different species and ribopatterns. Anal. Bioanal. Chem. 2009, 394, 2161–2171. [Google Scholar] [CrossRef]
- Manheim, J.; Doty, K.C.; McLaughlin, G.; Lednev, I.K. Forensic hair differentiation using attenuated total reflection fourier transform infrared (ATR FT-IR) spectroscopy. Appl. Spectrosc. 2016, 70, 1109–1117. [Google Scholar] [CrossRef]
- Thümmel, L.; Tintner-Olifiers, J.; Amendt, J. A methodological approach to age estimation of the intra-puparial period of the forensically relevant blow fly Calliphora vicina via Fourier transform infrared spectroscopy. Med. Vet. Entomol. 2025, 39, 22–32. [Google Scholar] [CrossRef]
- Zuha, R.M.; Omar, B. Developmental rate, size, and sexual dimorphism of Megaselia scalaris (Loew) (Diptera: Phoridae): Its possible implications in forensic entomology. Parasitol. Res. 2014, 113, 2285–2294. [Google Scholar] [CrossRef]
- da Silva, S.M.; Moura, M.O. Intrapuparial development of Hemilucilia semidiaphana (Diptera: Calliphoridae) and its use in forensic entomology. J. Med. Entomol. 2019, 56, 1623–1635. [Google Scholar] [CrossRef]
- Barros-Cordeiro, K.B.; Pujol-Luz, J.R.; Báo, S.N. A study of the pupal development of five forensically important flies (Diptera: Brachycera). J. Med. Entomol. 2021, 58, 1643–1653. [Google Scholar] [CrossRef]
- Yao, W.B. Biochemistry, 9th ed.; People’s Medical Publishing House: Beijing, China, 2022; pp. 88–90, 126–127. [Google Scholar]
- Jia, N.; Lin, S.; Yu, Y.; Zhang, G.; Li, L.; Zheng, D.; Liu, D. The effects of ethanol and Rutin on the structure and gel properties of whey protein isolate and related mechanisms. Foods 2022, 11, 3480. [Google Scholar] [CrossRef]
- Su, J.; Yang, S.; Wang, Y. Geographical origin identification of Dendrobium officinale based on FT-NIR and ATR-FTIR spectroscopy. J. Instr. Anal. 2025, 44, 1005–1015. [Google Scholar]
- Yang, M.; Yang, Y.; Mei, G.; Zhang, X.; Huang, L. Identification of 4 kinds of main Larimichthys crocea production areas based on Fourier transform infrared spectroscopy. J. Food Saf. Qual. 2024, 15, 121–129. [Google Scholar]
Disclaimer/Publisher’s Note: The statements, opinions and data contained in all publications are solely those of the individual author(s) and contributor(s) and not of MDPI and/or the editor(s). MDPI and/or the editor(s) disclaim responsibility for any injury to people or property resulting from any ideas, methods, instructions or products referred to in the content. |
© 2025 by the authors. Licensee MDPI, Basel, Switzerland. This article is an open access article distributed under the terms and conditions of the Creative Commons Attribution (CC BY) license (https://creativecommons.org/licenses/by/4.0/).