Article

A New Strategy to Identify Naturally Presenting SLA-I Bound Peptides Derived from the O Serotype of Foot-and-Mouth Disease Virus, by Mild Acid Elution in a VP1 Stably Expressed PK15 Cell Line

1
College of Animal Medicine, Jilin Agricultural University, Changchun 130118, China
2
College of Life and Health, Dalian University, Dalian 116622, China
3
The Dalian Animal Virus Antigen Epitope Screening and Protein Engineering Drug Developing Key Laboratory, Dalian 116622, China
*
Authors to whom correspondence should be addressed.
Animals 2025, 15(21), 3097; https://doi.org/10.3390/ani15213097 (registering DOI)
Submission received: 17 August 2025 / Revised: 16 October 2025 / Accepted: 20 October 2025 / Published: 24 October 2025
(This article belongs to the Section Pigs)

Simple Summary

The naturally presented antigenic peptides bound with swine leukocyte antigen class I (SLA-I) are crucial in developing multi-epitope vaccines in foot-and-mouth disease virus (FMDV). In this article, a transient expression plasmid, pEGFP-N1-VP1, was used to establish a VP1-stably expressed PK15 cell line. Using mild acid elution, 37 peptides that bound to SLA-I were separated and identified. These peptides will be used as candidates for a multi-epitope vaccine in FMDV.

Abstract

Multi-epitopes of FMDV can be used to develop a novel vaccine. Determining how to screen naturally presenting epitope peptides derived from FMDV is crucial for advancing progress in this area. In this study, a transient expression plasmid named pEGFP-N1-VP1 was transfected into Porcine Kidney Epithelial cells 15 (PK15). The positive cells that stably expressed the O-VP1 gene of FMDV were screened with gradient concentrations of G418 (Geneticin). The constructed pEGFP-N1-VP1/PK15 cell line was eluted by pH 3.3 phosphate buffer to isolate the eluted peptides, followed by desalting, liquid chromatography–tandem mass spectrometry (LC–MS/MS), a flow cytometric analysis of SLA-I expression, and an ELISA detection of SLA-I bound peptides. It was demonstrated that a PK15 cell line stably expressing the VP1 gene was initially screened out at 500 μg/mL of G418, followed by culturing at 300 μg/mL. The O-VP1 expression was identified using an image analysis system, RT-PCR, and Western blot analysis. Thirty-seven peptides derived from O-VP1 were eluted from the constructed cell line. The flow cytometric analysis and ELISA detection results showed that the eluted peptides were associated with SLA-I and bound. This is the first known study to construct a cell line for screening naturally presenting antigenic peptides derived from the O serotype of FMDV.

1. Introduction

Foot-and-mouth disease (FMD) is a highly contagious and devastating infectious disease affecting livestock. It is caused by the FMD virus (FMDV), which belongs to the species Aphthovirus vesiculae, genus Aphthovirus, and family Picornaviridae [1]. Previously, FMD was widespread in Africa, South America, and Asia, significantly reducing livestock production and causing a severe economic impact on the livestock industry [2,3,4]. Currently, FMD continues to spread worldwide [5,6,7]. In early 2025, two unrelated strains of FMDV serotype O were discovered in Germany, Hungary, and Slovakia, indicating that FMD freedom in continental Europe was disrupted [8,9,10]. According to the serological tests, the FMDV can be divided into seven serotypes worldwide: A, O, C, Asia 1, and Southern African Territories (SAT) 1, SAT2, and SAT3 [11,12]. FMDV is made up of 60 particles, and each particle is mainly composed of four capsid proteins: VP1, VP2, VP3, and VP4. FMDV structural protein VP1 is the major antigenic fragment, which plays a crucial role in inducing immunity in animals [13,14,15]. Therefore, it is crucial to study the FMDV structural protein VP1 for vaccine development [16,17].
Currently, the method used to prevent FMDV infection in endemic areas involves injecting a chemically inactivated whole-virus vaccine into animals, which exhibits robust immunogenicity and provides protection. However, the inactivated vaccine is associated with drawbacks such as high production costs, the requirement for biosafety level 3 facilities in its production, potential biological safety risks during vaccine manufacture, and limited efficacy against antigenically variable strains [18,19,20]. In addition, this type of vaccine has a limitation in inducing cellular immunity [21,22]. These challenges underscore the need for alternative vaccine development. Nowadays, scientists have recognized a new approach that differs from traditional vaccines. This new method utilizes an antigenic immunodominant region to design an epitope vaccine, which comprises many epitopes composed of short peptides. The new vaccines do not carry any virus protein but can induce safe and effective immune protection [23]. Epitopes derived from viral proteins consist of B-cell epitopes, T helper (Th) epitopes, and cytotoxic T lymphocyte (CTL) epitopes [24]. Previous research on FMDV antigens has mainly focused on the study of B-cell and Th epitopes, which can mainly induce humoral immunity, but with less attention paid to CTL epitopes [25,26]. Recent studies have shown that CTL epitopes that bind to the peptide binding groove of the heavy chain of class I of the major histocompatibility complex (MHC) simultaneously noncovalently bind with light chain Beta 2 microglobulin (β2m), also play a key role against FMDV [24,27,28,29]. Crucially, these epitopes can induce CTLs to kill infected target cells and FMDV particles once they are presented on the surface of antigen-presenting cells (APCs), thereby inducing a cellular immune response in vivo [24,29,30]. Although humoral immunity is the primary defense against FMDV, for FMDV persistent infection and “carrier state” of animals, cellular immunity induced by CTL epitopes will be more effective in eliminating these states. Therefore, CTL epitopes along with B-cell and Th epitopes from FMDV might be used to develop a new type of FMDV vaccine that can not only supply safer protection to animals but also eradicate FMD completely in the future, by means of CTL epitopes to induce a cytotoxic cellular immunity to kill target cells along with the FMDV particles in animals. In addition, this type of vaccine, constituted by epitopes from different strains of FMDV, might be used to control these strains in the future.
In order to screen CTL epitopes from the VP1 protein of FMDV, many strategies were tried, including the construction of the covalently linked heavy chain and light chain of the swine MHC class I, i.e., SLA-I complex to screen antigenic peptides derived from FMDV [31,32]; and the renaturation of the heavy chain, light chain, and antigenic peptides derived from FMDV [27,33]. However, these strategies were all processed to screen peptides binding to SLA-I molecules in vitro; the screened peptides were not naturally presented by SLA-I molecules in vivo, which implies that the efficiency of screening CTL epitopes might be low. Previously, researchers had tried a mild acid-eluted peptide strategy applied to the surface of human or murine MHC class I complexed with naturally expressed tumor or other pathogen antigens in cell lines, which proved that the isolated antigenic peptides were naturally presented by MHC class I molecules and were functional in the developing vaccine [34,35,36]. However, to date, no swine cell lines have been used to screen and isolate antigenic peptides derived from FMDV, particularly those complexed with SLA-I and naturally expressed FMDV antigens in cell lines.
To establish a swine cell line for identifying naturally presented antigenic peptides from FMDV by SLA-I molecules, we transfected Porcine Kidney Epithelial 15 (PK15) cells with a primary transiently expressed plasmid pEGFP-N1-VP1. This process aimed to screen for a stably expressed VP1 fusion gene cell line using G418 (Geneticin), followed by eluting the peptides presented by cells derived from the O serotype of FMDV. As a result, we successfully created the stably expressed pEGFP-N1-VP1/PK15 cell line, and 37 peptides from O-VP1 were eluted from it. Of these, 12 peptides showed relatively higher abundance values, and they were subsequently proven to bind to SLA-I in vitro, indicating that the eluted peptides should be presented by SLA-I.

2. Materials and Methods

2.1. Plasmids, Reagents, Cell Lines, and Primers

The plasmid pEGFP-N1-VP1 (a transient expression vector) was provided by Professor Shi-Jun Zheng from the China Agricultural University [37]. The expression plasmid SLA-1*04:01/pET-21a (+) was kindly given by Professor Chun Xia from the China Agricultural University. The expression plasmids SLA-2*04:02:01/pET-21a (+) and SLA-3*xd/pET-21a (+) were constructed by our group. The PK15 cell line was purchased from the China Veterinary Microbiology Culture Collection Center (CVCC, Beijing, China). Dulbecco’s Modified Eagle Medium (DMEM) and fetal bovine serum (FBS) were purchased from Gibco Company (Boston, MA, USA). A horseradish peroxidase conjugated goat anti-mouse Immunoglobulin G (IgG) monoclonal antibody, the SanPrep Column Plasmid Mini-Preps Kit, and the SanPrep Column DNA Gel Extraction Kit were purchased from Sangon Biotech Co., Ltd. (Shanghai, China). The reverse transcription kit, T4 DNA Ligase, and Taq polymerase were purchased from TaKaRa Biotechnology Co., Ltd. (Dalian, China). LipofectamineTM 2000 was purchased from Invitrogen Corporation (Waltham, CA, USA). G418 was purchased from Sigma-Aldrich (GoldBio, St. Louis, MO, USA). Mouse anti-Green Fluorescent Protein (GFP) monoclonal antibody was purchased from Beyotime (Shanghai, China). The monoclonal antibodies, including the heavy chain of SLA-I and the light chain β2m, were all produced and kept in our lab. Other antibodies are described and explained in Section 2. Acetonitrile (HPLC grade) was purchased from Kermel Company (Tianjin, China). Superstar Electrochemiluminescence (ECL) Plus Detection Reagent was purchased from Solarbio (Beijing, China). A pair of primers to detect VP1 gene expression was taken from a previously reported [37], consisting of the forward primer VP1-F (5′-ACCACCTCCACAGGTGAGTCG-3′) and the reverse primer VP1-R (5′-CAAAAGCTGTTTCACAGGCG-3′). The primers were synthesized by Sangon Biotech Co., Ltd. (Shanghai, China).

2.2. Cell Culture

Cells were recovered from liquid nitrogen and cultivated at 37 °C in 5% CO2 for 12–18 h in a 10% FBS DMEM. The cell condition was monitored until they recovered their natural state. Then the medium was replaced by fresh DMEM containing 10% FBS. After the cells had grown and spread to the entire bottom of the flask, they were digested with 0.25% trypsin for approximately 5 min at 37 °C. Then, the digested cells were transferred into 24-well plates with 7–8 × 10⁴ cells per well. The cells were cultivated at 37 °C with a 5% CO2 for 24 h until the cell density reached about 70–80%.

2.3. G418 Lethal Concentration Curve Measurement

Approximately 4 × 10⁵ PK15 cells were transferred to 24-well plates and cultivated at 37 °C, 5% CO2. When the cell density reached approximately 70–80%, 500 μL of G418 was added to the 24-well plates at a series of concentrations: 0, 100, 200, 300, 400, 500, 600, 700, 800, 900, and 1000 μg/mL, diluted in DMEM containing 10% FBS. Each treatment was performed in triplicate wells at 37 °C and 5% CO2 in a culture incubator. Cells were observed daily. Every 48 h, the cells were treated with a fresh 10% FBS DMEM containing a gradient concentration of G418. The lowest G418 concentration that kills all cells within 7 days was identified as the final treatment dose for stable transfection of exogenous plasmids. Viable cells were counted by using an EVE Automatic cell counter (NanoEnTek, Seoul, Republic of Korea) as previously reported [38]. Then, the G418 lethal concentration curve for PK15 cells was drawn.

2.4. PK15 Cell Transfection Efficiency Assay

Approximately 4 × 10⁵ PK15 cells were transferred to 24-well plates and cultivated at 37 °C, 5% CO2. When the cell density reached 70–80% in each well, the normal DMEM containing 10% FBS was replaced by FBS-free OPti-DMEM before transfection. The PK15 cells were transfected with the lipofectamineTM 2000/pEGFP-N1-VP1 complexes at ratios of 1:1–1:3, liposomes to plasmids. Transfection was performed in triplicate in each well, and the transfection efficiency, represented by the percentage of EGFP-positive cells, was determined by flow cytometry. Simultaneously, a negative control for PK15 cells, consisting of no liposomes and plasmids, was set up and detected as described above.

2.5. PK15 Cell Transfection and G418 Screening

For these experiments, 4 × 10⁵ PK15 cells were transferred to 24-well plates and cultivated at 37 °C, 5% CO2. When the density of the transfected PK15 cells reached 70–80% of each well, lipofectamineTM 2000/pEGFP-N1-VP1 was transfected into the cells at a ratio of 1:1. After transfection for 24 h, the transfected cells were washed twice by Phosphate-Buffered Saline (PBS), and the medium was refreshed by DMEM containing 10% FBS and G418 (500 μg/mL) once after 48 h. After 7 days, the cell masses emitting clear green fluorescence in the well were marked, and 2 μL of 0.25% trypsin was gently pipetted onto them using a micro-pipette. The cells were then transferred to new 96-well plates to cultivate. The cells in the 96-well plates were observed using fluorescence inverted microscopy until they were clearly visible and growing in number. The cells in the 96-well plates were then transferred into 24-well plates and maintained with medium containing 10% FBS and G418 (500 μg/mL). After the cells had grown to fully cover the well, they were transferred to 6-well plates and cultivated in medium containing 10% FBS and G418 (500 μg/mL), and then to a 6 cm culture dish. Finally, the cells were transferred to a 10 cm culture dish for further cultivation and passage, and then stored in a −80 °C refrigerator. At various time points after transfection–3, 6, 12, 24, 48, 72, 168, 336, and 480 h–some cells were used to detect and evaluate the effects of transfection and screening on the transfected PK15 cells. In brief, the transfected cells were fixed with 4% paraformaldehyde, incubated for 30 min at room temperature, and then washed three times with PBS. Then, Triton X-100 was added to the fixed cells to a final concentration of 0.2% to permeate the cellular membrane for 10 min, followed by three washes with PBS. Then, 4′,6-diamidino-2-phenylindole (DAPI) was added to the cells to a final concentration of 1 μg/mL to dye the cell nucleus for 10 min, followed by washing with PBS three times. The cells were detected using an ImageXpress Micro XLS Widefield High-Content Analysis System (Molecular Devices, Sunnyvale, CA, USA) under a 20× plan objective lens and photographed by using the DAPI and Fluorescein Isothiocyanate (FITC) channels. The data were analyzed using Thermo Scientific HCS Studio 2.0 (Waltham, MA, USA).

2.6. Identification of the Stable Expression of the VP1 Gene in pEGFP-N1-VP1/PK15 Cells

To confirm whether the target plasmid was successfully transfected into PK15 cells and to identify the transcription of the VP1 gene in cells, total RNA was extracted from the transfected cells using the TRIzol Reagent kit (Invitrogen Inc., Carlsbad, MA, USA) according to the previously reported methods [39]. The RNA samples were stored at −80 °C, ready for use. The extracted total RNA was reverse-transcribed into cDNA using avian myeloblastosis virus (AMV) reverse transcriptase (TaKaRa, Dalian, China) and oligo (dT) primers according to the manufacturer’s recommendations. A template of 1 μg of cDNA was used to amplify the VP1 gene with the primers VP1-F and VP1-R. The PCR reaction was conducted as follows: 94 °C for 5 min for pre-denaturation, followed by 94 °C for 30 s, 56 °C for 45 s, and 72 °C for 1 min, for 30 cycles; finally, 72 °C was maintained for 10 min. The PCR product was stored at −20 °C for subsequent gene cloning. The PCR product was recovered by a SanPrep Column DNA Gel Extraction Kit (Sangon Biotech Co., Ltd., Shanghai, China), cloned into the pMD 18-T vector, and then sequenced.
For the identification of VP1 protein expression in pEGFP-N1-VP1/PK15 cells, 2 × 10⁶ stably transfected cells were collected to isolate intracellular proteins by the Radio Immunoprecipitation Assay (RIPA) lysis buffer. Then, the protein concentration was determined with the Bicinchoninic Acid (BCA) method [40]. Next, 20 μg of denatured protein samples were determined by SDS-PAGE and then transferred to a 0.45 μm Polyvinylidene Divinylidene (PVDF) membrane. The membrane was blocked for 1 h at room temperature with PBS containing 5% skim milk, and incubated with a VP1 antibody (1:1000, mouse origin, kindly offered by Professor Shi-Jun Zheng from the China Agricultural University, Beijing, China), and a referenced Glyceraldehyde-3-phosphate Dehydrogenase (GAPDH) mouse monoclonal antibody (Proteintech Group, Inc., Chicago, IL, USA) at 4 °C. The samples were washed three times for 10 min each time with PBS containing 0.3% Tween 20. The membrane was incubated for 1 h at room temperature with horseradish peroxidase (HRP) labeled with goat anti-mouse IgG monoclonal antibody (1:5000), and then visualized using Superstar ECL Plus Detection Reagent (Solarbio, Beijing, China). Immunoreactive bands were quantified densitometrically to analyze the relative expression of VP1 using ImageJ software (1.53k; NIH, Bethesda, MD, USA), with GAPDH serving as the loading control.

2.7. Detection of the Peptides Eluted with Mild Weak Acids from the Surface of pEGFP-N1-VP1/PK15 Cells by LC–MS/MS

In order to elute and detect peptides, the pEGFP-N1-VP1/PK15 cells were cultivated to the logarithmic phase in DMEM containing 10% FBS and 300 μg/mL G418 at 37 °C and 5% CO2. Then 1 × 10⁸ cells were collected, washed twice with PBS, and centrifuged at 1500 rpm for 5 min at room temperature. The cells were then eluted with phosphate buffer (0.131 mol/L citric acid, 0.066 mol/L Na2HPO4, pH 3.3) for 30 s at room temperature, as described by Storkus et al. [36], with modifications tailored to our system. The elution mixture was centrifuged at 1500 rpm for 5 min to remove cells. The elution sample was centrifuged at 4500× g for 5 min using an Amicon Ultra-15 Protein Centrifugal Filter (3000) to remove large fragments of proteins or other large molecules. The filtrates were desalted using Stage-tip C18 (EmporeTM Octadecyl C18, 47 mm Extraction Disks, MA, USA) according to slightly modified previously reported methods [41]. First, 100 μL of acetonitrile was added to the membrane of the Stage-tip C18 until the acetonitrile fully flowed through the membrane. The C18 column was balanced by 100 μL of 0.1% Trifluoroacetic Acid (TFA)/H2O and then centrifuged at 500× g until the solution fully flowed through the membrane. The balance process was repeated three times. The column was transferred to a new 2 mL Eppendorf (EP) tube, and then the peptide samples were loaded onto the column membrane and incubated for 5 min at room temperature. This was followed by centrifugation at 500× g until the samples had all flowed through. The filtrate was reloaded onto the membrane to repeat the filtration. The column was washed three times with 100 μL of 0.1% TFA/H2O and centrifuged three times at 500× g, as above. The column was transferred to a new 2 mL Eppendorf tube. Then, 100 μL of elution buffer containing 0.1% TFA and 50% acetonitrile was used to elute the peptide samples absorbed into the column membrane, followed by centrifugation at 400× g until the buffer had fully flowed through. The elution was repeated twice. The two eluates were combined and collected in a 500 μL Eppendorf tube for lyophilization in a SpeedVac concentrator (Hunan Hercy Instrument Co., Ltd., Changsha, China), completing the drying process.
The lyophilized peptides were dissolved in 20 μL of a 0.1% formic acid/water solution. Then, 4 μL of samples were injected into a C18 (3 µm, 100 Å, 75 µm × 15 cm), and separated through a 90 min chromatographic gradient using high performance liquid chromatograph (HPLC, Thermo ScientificTM Easy nLC 1200, Waltham, MA, USA), with a balance between mobile A phase of 0.1% formic acid in water and mobile B phase of 0.1% formic acid in 80% acetonitrile/H2O at a flow velocity of 350 nL/min.
Mass spectra data were detected using an Orbitrap Fusion Lumos ultra-high resolution mass spectrometer (Thermo Scientific, Waltham, MA, USA) with the following parameters: spray voltage, 2.0 kV; capillary temperature, 320 °C; RF Lens, 40. The resolution was set at 120,000 at m/z 200 for primary MS data and 30,000 at m/z 200 for MS/MS data. The parent ion scanning range was from 350 to 1550 m/z, while the daughter ion m/z scanning started at 110 m/z. The ion screening window was set at 1.6 m/z. The fragmentation mode was set at high-energy collision dissociation (HCD). The energy was selected as normalized collision energy (NCE) 32. The data-dependent MS/MS was first set at the top 20 and then analyzed artificially. The dynamic exclusion time was set at 60 s. The data were analyzed by Proteome Discoverer 2.1 (Thermo Fisher, MA, USA).

2.8. Detection of the Eluted Peptides Associated to SLA Class I-Presenting

To determine whether the eluted peptides were associated with SLA-I binding and presentation, a flow cytometric analysis of SLA-I expression was conducted, as previously reported [42] and modified. In brief, the monoclonal antibody of the heavy chain of SLA-I, light chain β2m (both produced and kept in our laboratory) and SLA-I complex antibody (produced in Hubei Qiangyao Biological Technology Co., Ltd., (Ezhou, China) and kept in our lab) were used to detect the expression of SLA-I on the surface of cells before and after elution with phosphate buffer. The acid-treated cells were immediately washed with PBS at pH 7.2 and then re-cultured in RPMI 1640 containing 10% FBS. Cells at a concentration of 4 × 10⁵ were collected and seeded in a 1.5 mL centrifuge tube. The cells were then washed with PBS buffer and blocked with 3% BSA for 15 min. The processed cells were incubated with one of three monoclonal antibodies against the heavy chain, β2m, and SLA-I complex, respectively, for one hour at 4 °C. Then, APC-labeled Rat anti-Mouse IgG1 clone (Becton Dickinson, San Jose, CA, USA) was used as a secondary antibody and incubated with the above-processed cells for one hour at 4 °C. A negative control was established using the primary PK15 cells processed as described above. All treated cells were detected using a FACS-Calibur (Becton Dickinson Immunocytometery System, San Jose, CA, USA) and analyzed with FlowJo software (Becton Dickinson Immunocytometry Systems, version 10, Ashland, OR, USA).
Meanwhile, in order to identify whether the eluted peptides were bound to SLA-I molecules, some representative eluted peptides, along with a positive peptide As64 (ALLRSATYY) [33] and a control random peptide CN (DPSPGQSCN), were synthesized linearly in GenScript Corporation (Suzhou, China). A peptide binding affinity assay was adapted from published micro-scale refold-ELISA-based methods to detect the binding affinity of identified peptides with the SLA-I complex, with moderate modifications [43,44]. In brief, 1 μmol/L heavy chain (HC) of SLA-I and 1.5 μmol/L pre-refolded β2m were refolded in 0.33 mmol/L Tris-Maleate and 0.5% Lutrol-F68 in the presence of 70 μmol/L peptide, prediluted to 2 mmol/L working stocks in 100 mmol/L Tris-HCL, pH 8.0. Micro-refolds were incubated at 18 °C for 48 h before the relative capacity of each peptide to support stable SLA-I-peptide-β2m complex formation was quantified by sandwich ELISA. After diluting the HC antibody (produced in Hubei Qiangyao Biological Technology Co., Ltd., and stored in our lab) to 10 μg/mL in 2% BSA, 50 μL per well was added to the ELISA plate, and coated overnight. The plates were washed 3 times with 0.05% Tween 20 + 2% BSA, then blocked with 5% BSA at room temperature for 1 h. Subsequently, the plate was washed 3 times with 0.05% Tween 20 + 2% BSA. The SLA-I-Peptide-β2m renaturation product was diluted to 1:100, and 100 μL was added to each well of the ELISA plate. The solution was then incubated at 4 °C for 2 h; 0.05% Tween was used to wash the plate 5 times with 20 + 2% BSA, 100 μL per well of HRP-labeled rabbit-anti swine β2m polyclonal antibody (produced in Hubei Qiangyao Biological Technology Co., Ltd., and kept in our lab), to achieve a final concentration of 0.2 μg/mL, and incubated for 1 h at 4 °C; the plate was washed 5 times with 0.05% Tween 20 + 2% BSA. HRP-labeled goat-anti rabbit IgG (abcam) was diluted with 2% BSA to 0.02 μg/mL and incubated at room temperature for 1 h. Tetramethyl benzidine substrate and STOP solution were used to progress and terminate reactions, respectively, before obtaining absorbance readings at 450 nm on a Bio-Rad 680 Microplate Reader (Hercules, SA, USA). Each detection was set as a triplicate well.

2.9. Statistical Analysis

All values were expressed as mean ± SD. Experimental results are presented as mean ± standard error of mean (SEM) (minimum 3 repeats). Analyses were conducted in GraphPad Prism 8 (GraphPad Software, San Diego, CA, USA). One-way analysis of variance (ANOVA; repeated measures test) was used to determine the significance of differences among the groups. Statistical significance was set at p < 0.05.

3. Results

3.1. G418 Lethal Concentration Curve

The PK15 cell lethal assay was performed over seven days using a series of G418 concentrations. A curve illustrating the relationship between the mean number of viable cells and G418 concentration was plotted, as shown in Supplementary Figure S1. It demonstrates that when the G418 concentration reaches 500 μg/mL, all cells are killed. Therefore, the effective G418 concentration for screening stable transfectants is determined to be 500 μg/mL.

3.2. Detection of the Transfection Efficiency of PK15 Cells by Flow Cytometry for Different Liposome Complex Ratios

The transfection efficiency of the transfected cell line was detected by flow cytometry after 6 h for different ratios of liposome to plasmid; for 1:1, 1:2, and 1:3. When the ratio was 1:1, 1:2, and 1:3, the transfection efficiency of PK15 cells represented by expressed EGFP positive efficiency was 13.5, 9.83 and 7.45 percent, respectively. It was demonstrated that the transfection efficiency at a 1:1 ratio was significantly higher than at the other ratios, despite a 0.5% background value in the negative control, as shown in Figure 1.

3.3. Detection of the VP1-Fused Green Fluorescent Protein Expression in Stably Transfected Cells

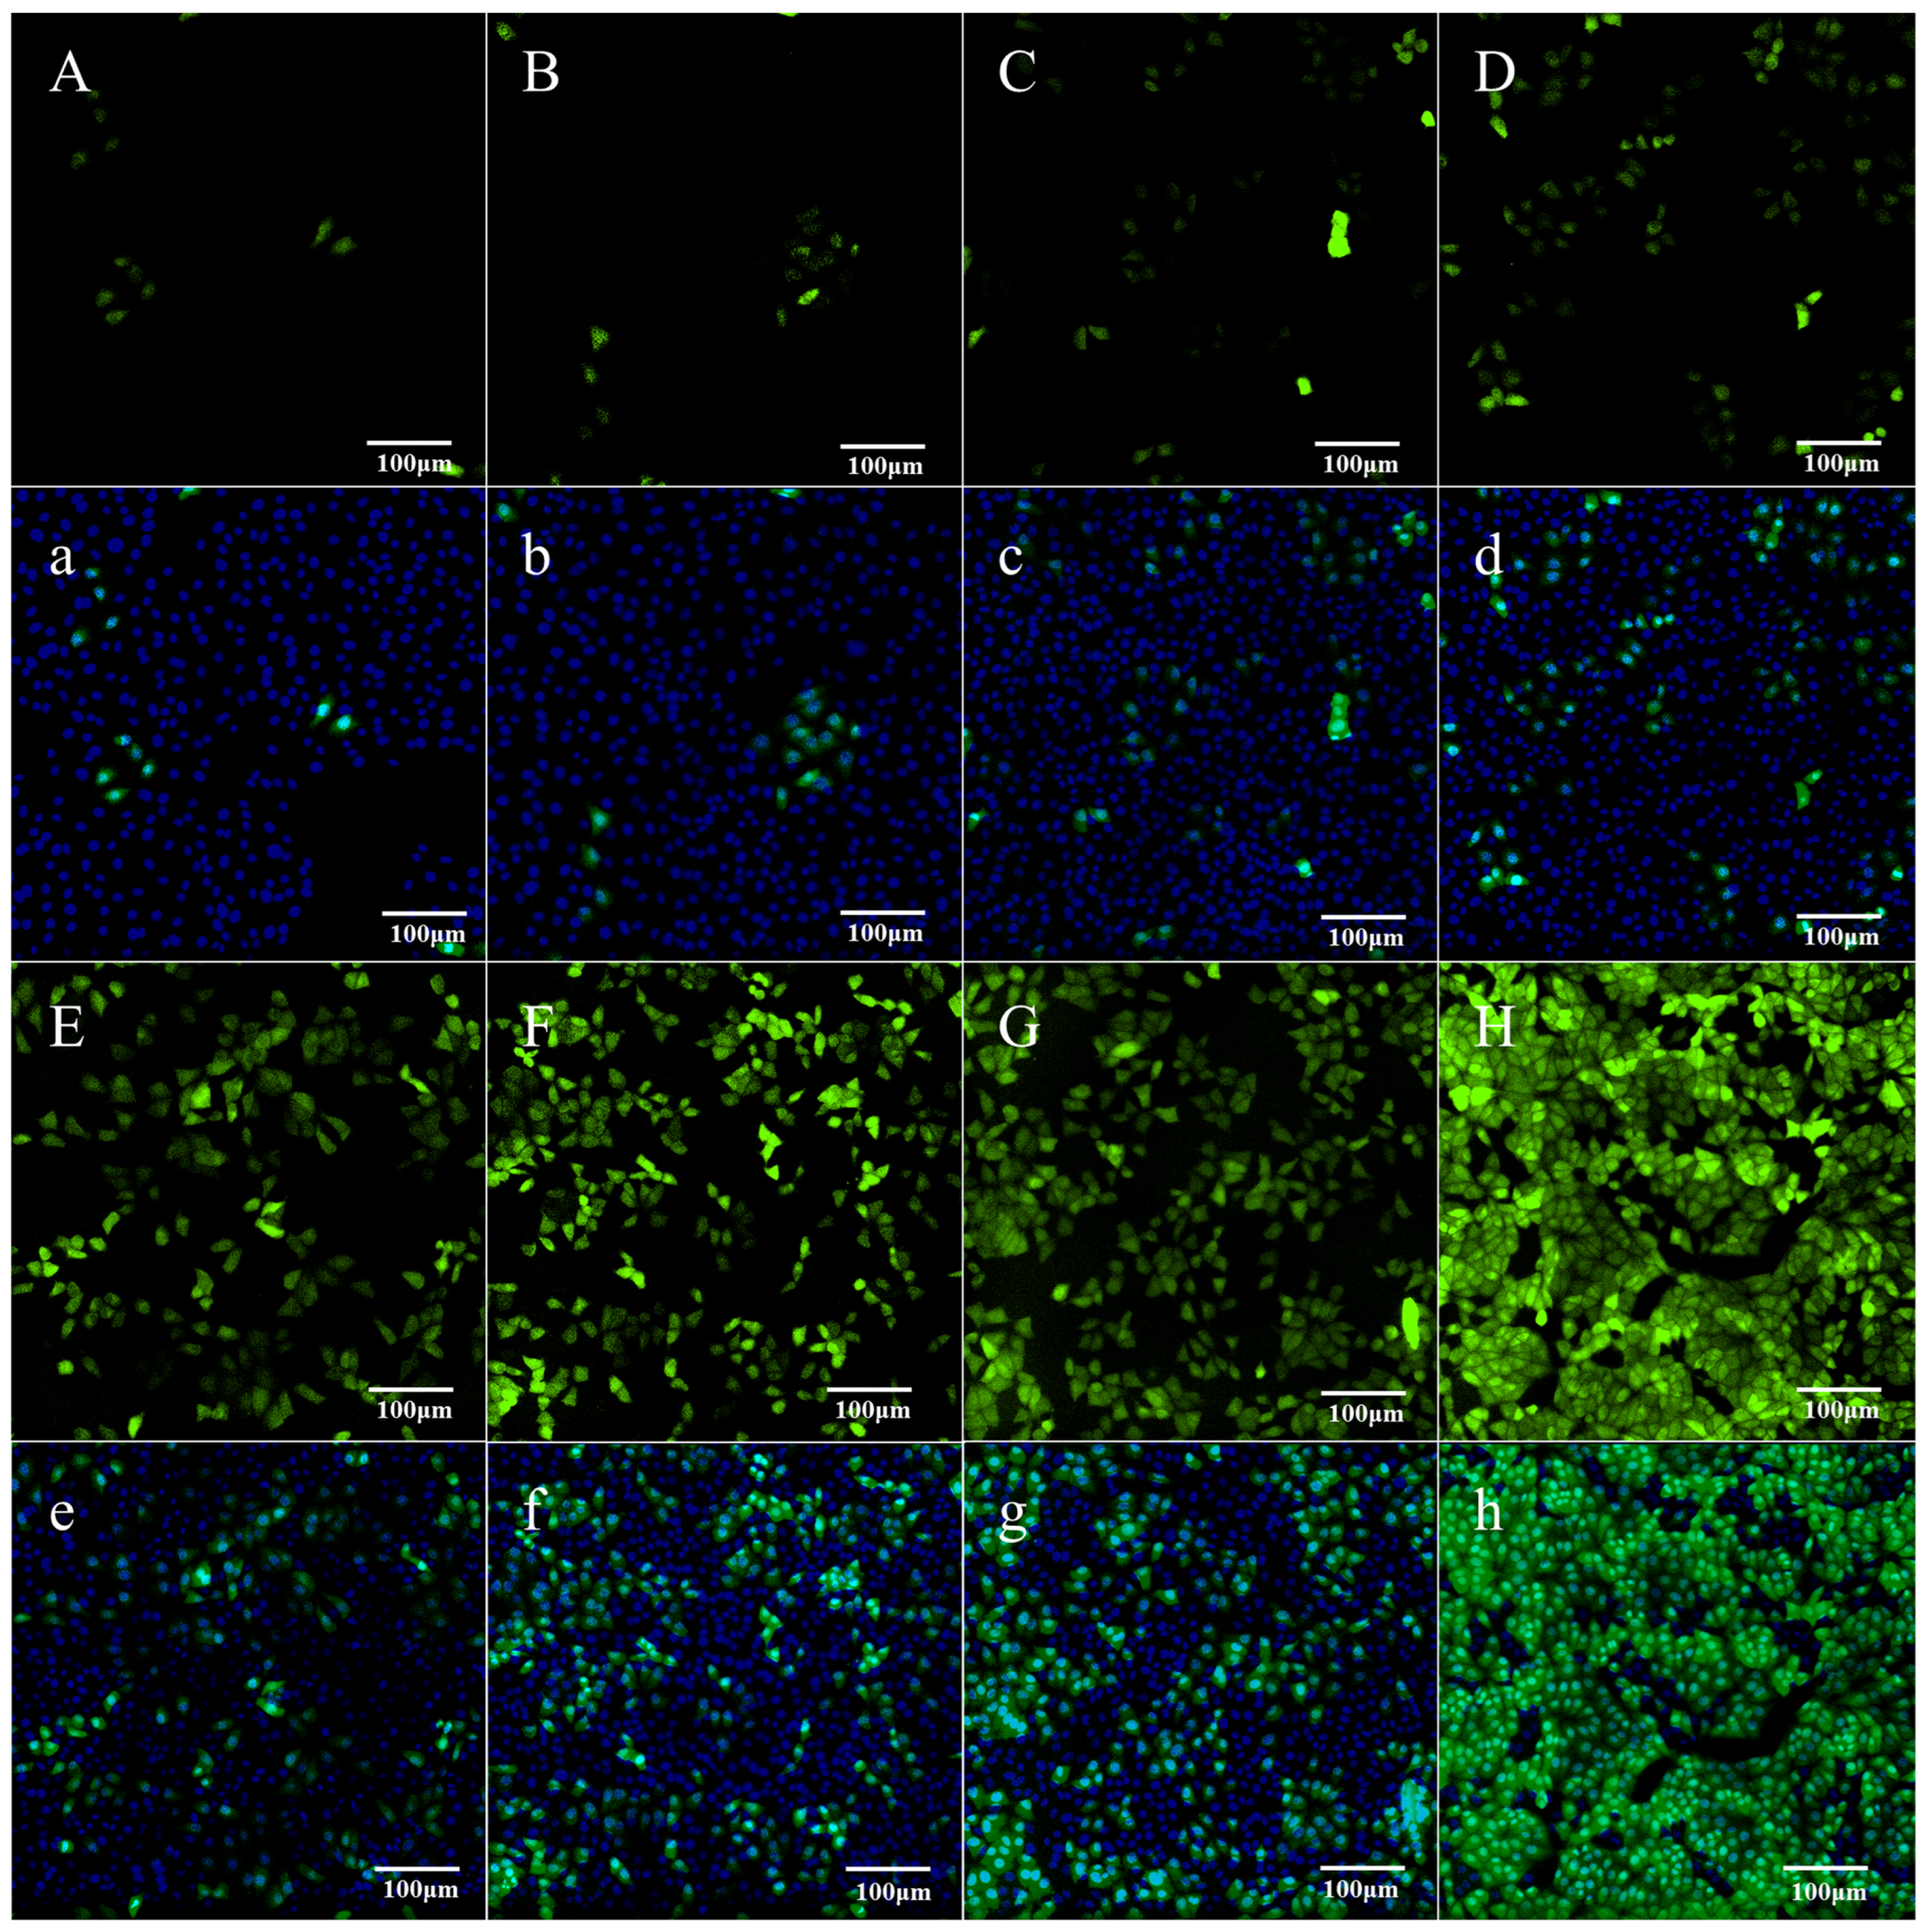
By using a 1:1 ratio of liposomes to plasmids, the pEGFP-N1-VP1 was successfully transfected into PK15 cells and detected at different times by an ImageXpress Micro XLS Widefield High-Content Analysis System (Molecular Devices, Sunnyvale, CA, USA), as shown in Figure 2. Screening under 500 μg/mL of G418 has revealed that transfected PK15 cells with green fluorescence can be detected after 3 h; however, they do not grow by 6 h, indicating that many transiently expressed cells were killed during this time. From 12 h onward, the number of transfected cells with green fluorescence increased (Figure 2A–F,a–f). At 7 days (168 h), a few cell masses displaying clear green fluorescence formed (Figure 2G,g). Then, the marked cell masses were transferred to 96-well plates and cultivated with DMEM containing 500 μg/mL of G418. After 10 days, wells that still displayed stable green fluorescence were selected as positive cell wells. The positive cells were progressively cultivated from 96-well to 24-well plates under the same conditions as above, followed by 6-well plates, a 6 cm culture dish, and a 10 cm culture dish, in sequence. Figure 2 shows that at 14 days (336 h), more than 90% of cells were fluorescent (Figure 2H,h). Through continued screening and cultivation, nearly 100% of the transfected cells were fluorescent at 20 days (480 h) after transfection, as shown in Figure 3, indicating that the cells stably express the VP1-fused EGFP protein.

3.4. Detection of the Expression of the VP1 Gene in pEGFP-N1-VP1/PK15 Cells

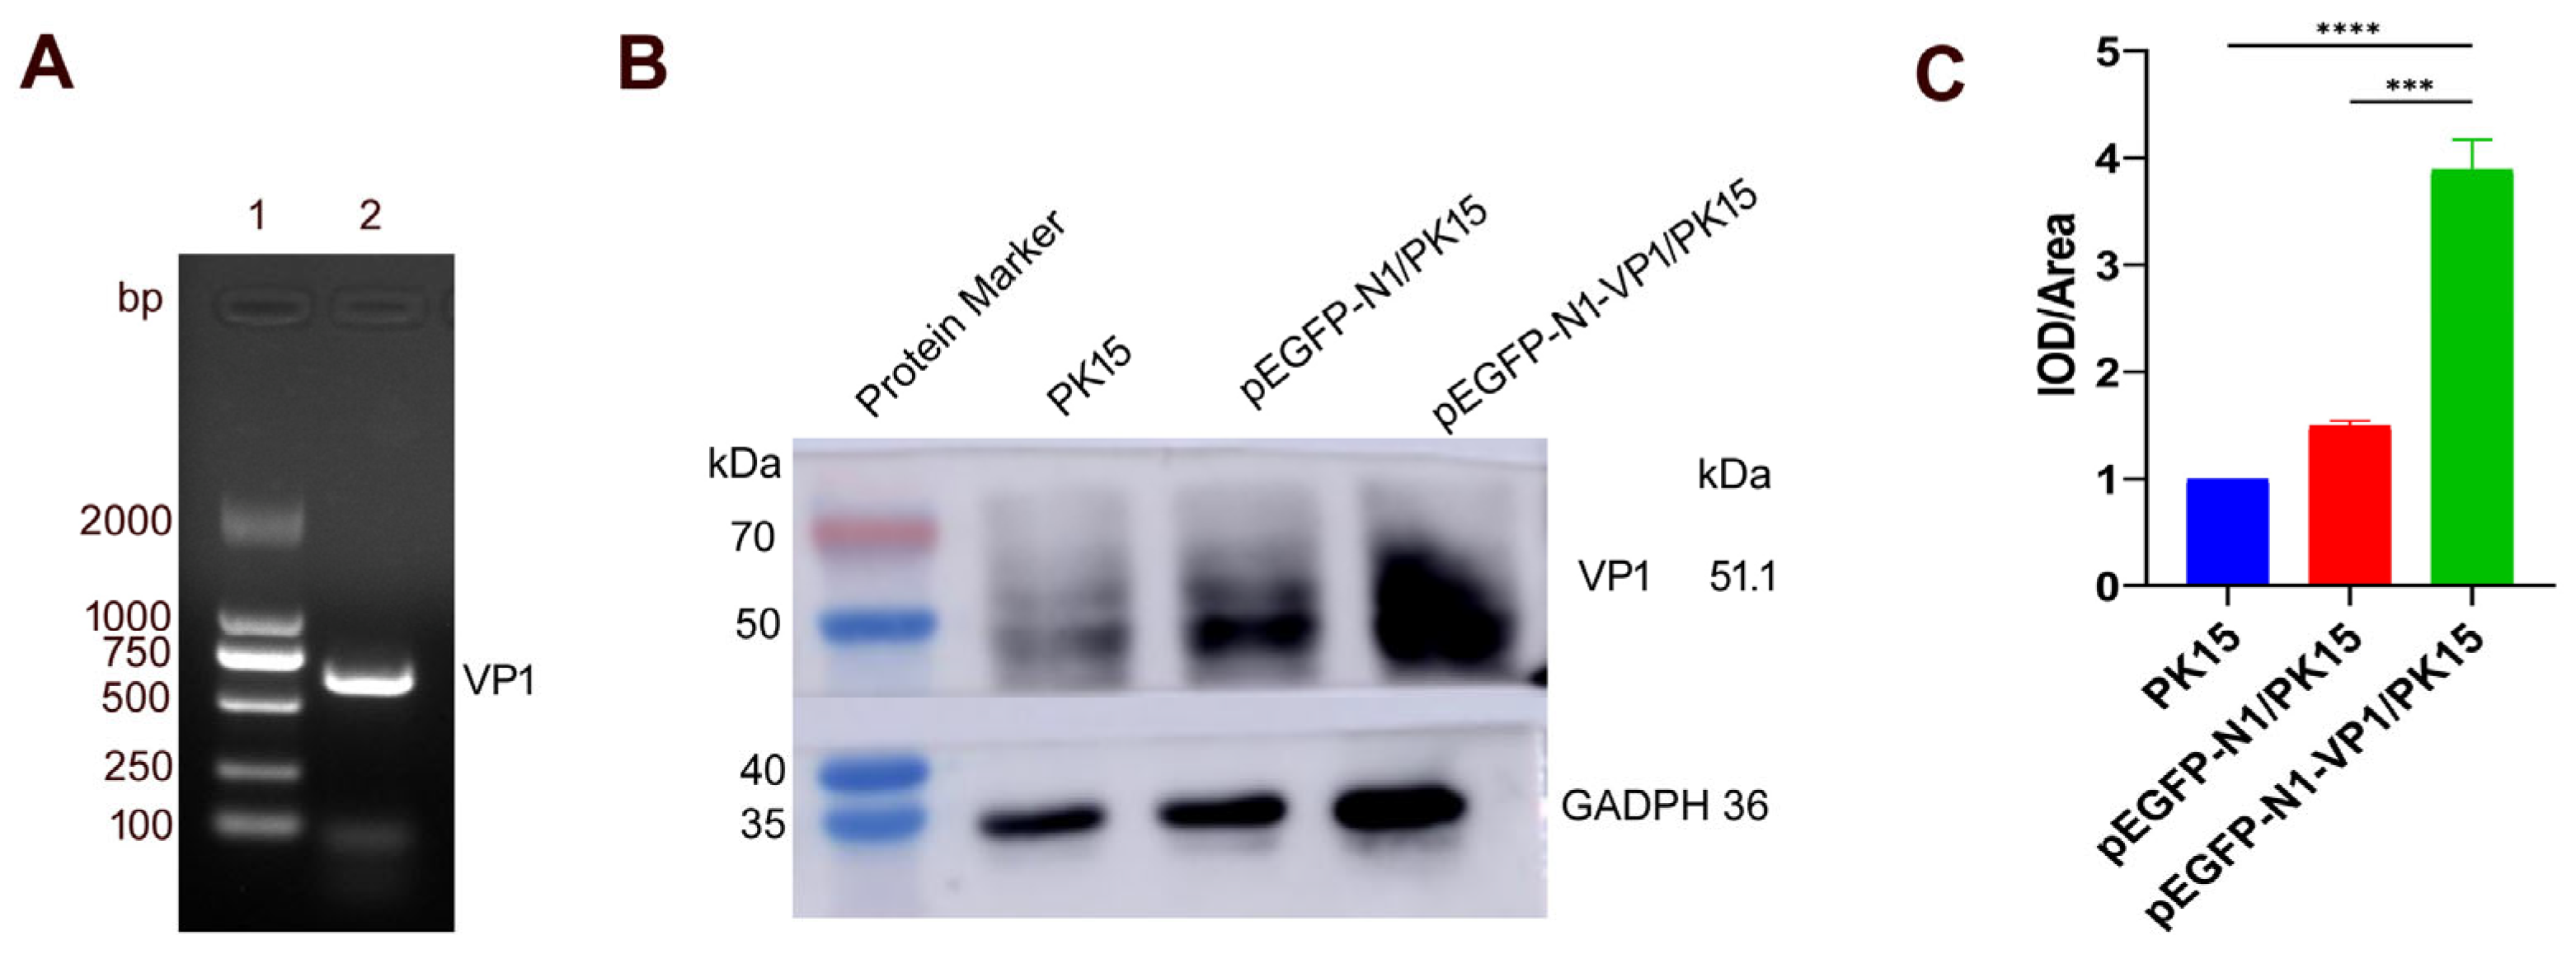
To identify whether VP1 was stably expressed in the mRNA of the pEGFP-N1-VP1/PK15 cells, RT-PCR was performed to detect the VP1 transcription product. The results of this, in Figure 4, show that a specific amplified fragment was about 600 bp, which is consistent with the theoretical value of 639 for the length of the stably transcribed VP1 in pEGFP-N1-VP1/PK15 cells (Figure 4A). The PCR product was recovered using a SanPrep Column DNA Gel Extraction Kit (Sangon Biotech Co., Ltd., Shanghai, China) and ligated into the pMD 18-T vector, which was then transferred to TOP 10 competent cells. Positive clones were selected for sequencing. The sequencing results show that the sequence of the VP1 clone was completely consistent with that of VP1 in the pEGFP-N1-VP1 plasmid (Supplementary Figure S2). Western blot results (Figure 4B) demonstrate that the VP1 fusion protein was stably expressed in the transfected PK15 cell line, as confirmed by the anti-VP1 monoclonal antibody (mAb). The control PK15 cells and the transfected pEGFP-N1/PK15 did not express the protein. The fusion protein had a molecular weight consistent with the EGFP protein, which is 28.0 kDa, and the VP1 protein, which is 23.1 kDa. Therefore, the theoretical value of the molecular weight of the VP1 fusion protein should be about 51.1 kDa, which is consistent with the measurements shown in Figure 4B. By the qualification of the relative expression of VP1, it was shown that the expression of VP1 fusion protein in pEGFP-N1-VP1/PK15 cells was quite significantly higher than that in PK15 and pEGFP-N1/PK15 controls (p < 0.001), respectively, indicating that the VP1 fusion protein was expressed truly (Figure 4C).

3.5. Detection of the Peptides Eluted with Mild Weak Acids by LC–MS/MS

The eluted peptide sample was detected using a high-performance liquid chromatography and an Orbitrap Fusion Lumos ultra-high-resolution mass spectrometer. The primary data was analyzed by Proteome Discoverer 2.1. The peptides were searched for in a self-constructed O-VP1.fasta database and screened using a fixed-value Peptide-Spectral Match (PSM) validator. A medium screening standard was used. After analysis, at least 37 peptides with 8–11 amino acids, derived from O-VP1.fasta were identified, as shown in Table 1. They just fit the antigen-binding groove of MHC class I molecules [45]. Most of the peptides were modified after being presented, such as through oxidation or deamination. Among them, the first 12 peptides displayed a relatively higher abundance value (XCorr Sequest High Throughput value over 1). The mass spectrogram of the first 12 peptides is shown in Supplementary Figure S3.

3.6. Detection of the Eluted Peptides Associated with SLA-I Binding and Presenting

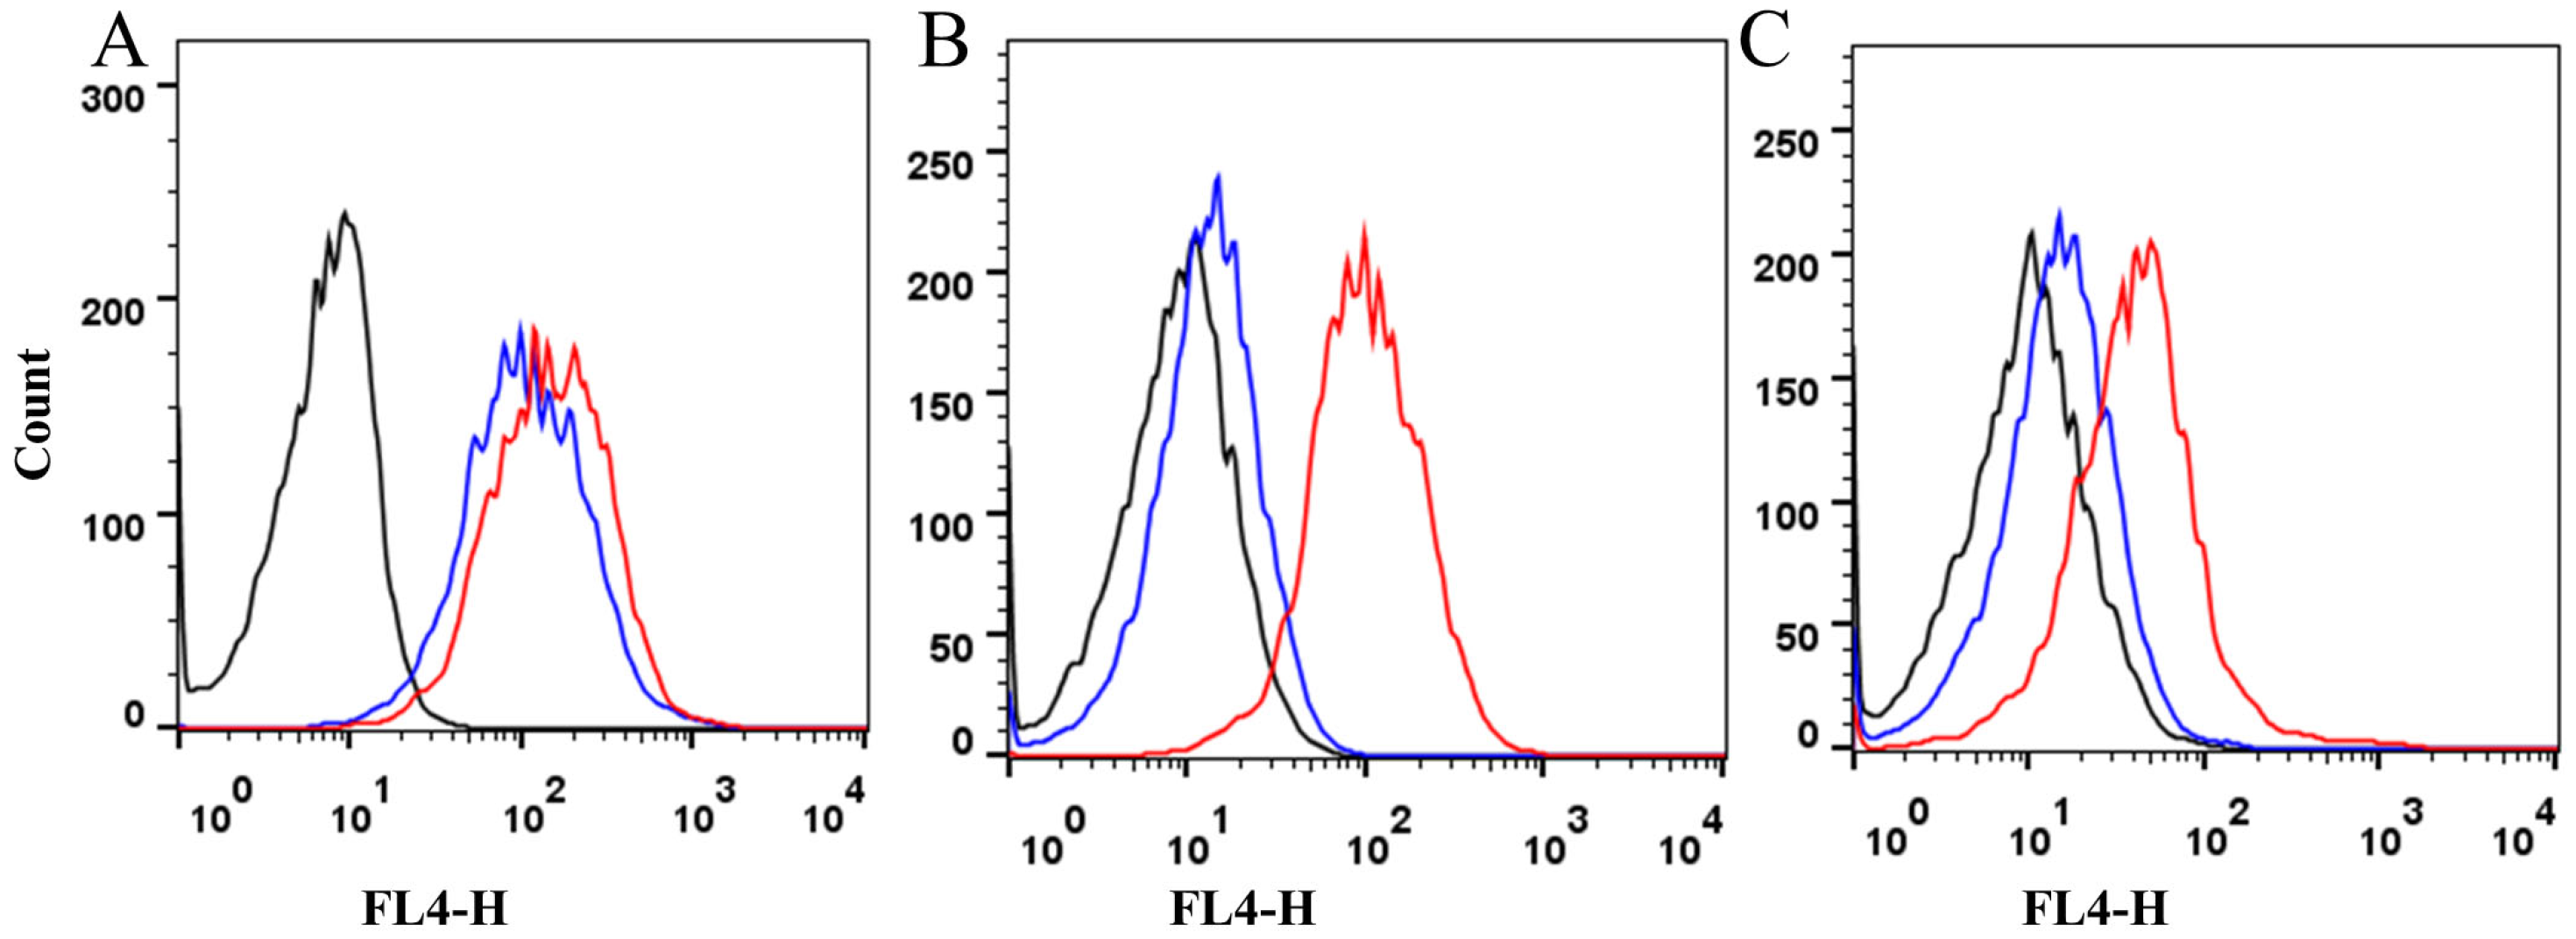
As shown in Figure 5, flow cytometric analysis showed that the SLA-I expression on the cell surface of the pEGFP-N1-VP1/PK15 was greatly decreased after acid elution treatment, detected by the light chain β2m monoclonal antibody and the SLA-I complex antibody, which indicated that β2m, along with eluted peptides, was lost after acid elution treatment. However, it seems that the heavy chain expression on the pEGFP-N1-VP1/PK15 changed little after acid elution treatment, which indicated that the heavy chain of the SLA-I could still remain associated with the cell surface on the pEGFP-N1-VP1/PK15 cells.
A micro-refolding and sandwich ELISA-based approach enabled relative quantification of peptide binding affinity for SLA-1*04:01, SLA-2*04:02:01 (completely matched to SLA-2*PK15) and SLA-3*xd (completely matched to SLA-3*PK15). Thirteen eluted peptides, including most of the first 12 peptides (No.4 and No.11 eluted peptides were not used because of the same linear amino acids as No.3 and No.7, respectively), and three after the 12th peptides, No.19, 22 and 33, were detected. In addition, one peptide As64 [27,29] and one random peptide NA (DPSPGQSCN) were used as positive and negative controls, respectively, while the refolded formation of a heavy chain (HC) of SLA-I and light chain of β2m was used as a negative control. As shown in Figure 6A, for the SLA-1*04:01 molecule, compared to the negative control, except for No.8, 12, and 22, all of the other eluted peptides were significantly more strongly bound with SLA-1*04:01, just like the positive peptide As64, while the control random peptide CN was not. Among them, the No.6 peptide showed the strongest binding affinity with SLA-1*04:01, even stronger than the positive peptide As64. Moreover, two other peptides, namely No. 10 and 33, which showed a comparative binding affinity with As64 to SLA-1*04:01, were previously cloned from PK15 cells [46]. For SLA-2*04:02:01, which were completely matched to SLA-2 derived from PK15, shown in Figure 6B, most of the eluted peptides showed significant binding against the negative control except for No.5. However, no peptide showed a stronger binding affinity with SLA-2:04:02:01 than As64, although including three comparative peptides No.12, 22 and 33 with As64 in binding affinity to SLA-2:04:02:01. For SLA-3*xd molecules, completely matched to SLA-3 from PK15, there were two peptides, notably No.6 and 7, showing negative binding affinity with SLA-3*xd, and other peptides showed significantly binding affinity with SLA-3*xd, as shown in Figure 6C. Just similar to SLA-2:04:02:01, there are three peptides, specifically No.8, 19 and 33, showing comparative binding affinity to SLA-3*xd.

4. Discussion

Nowadays, multi-epitope vaccines are one of the alternatives to traditionally inactivated FMDV vaccines due to their safety and efficiency in resisting different serotypes of the virus [47,48]. To design multi-epitope FMDV vaccines, identifying new epitopes, especially CTL epitopes, should be the key task. In fact, some researchers have begun to study the CTL epitopes derived from FMDV that can induce CD8+ T lymphocyte-dominated cellular immunity [31,49]. However, to date, these epitopes have been mostly designed using the conventional method of computer prediction tools [24,45] or by in vitro renaturation complexed with the heavy chain of SLA-I and the light chain of swine β2m [27,41,46], rather than the naturally presented peptides. Up to now, there are still no reports that a specific cell line was used to isolate the naturally presented SLA-I-bound peptides derived from FMDV.
In this study, we established a VP1-transfected PK15 cell line that stably expresses the VP1 gene of the O serotype of FMDV. The VP1 gene fused with the EGFP gene was expressed in cells, as detected by RT-PCR and Western blot analysis. Since the VP1 gene was fused to EGFP, the cells that stably expressed the VP1 gene should have displayed green fluorescence, as detected by an ImageXpress Micro XLS Widefield High-Content Analysis System. The results indicate that the VP1 proteins were expressed in the cytoplasm of cells as endogenous antigens, as shown in Figure 3 and Figure 4. According to the mechanism of processing and presenting the endogenous antigen of cells, the endogenously expressed VP1 proteins should be processed and degraded into peptides after being digested through proteasomes [50,51,52]. Some of the peptides were transported to and bound to the heavy chain of MHC class I molecules, which was ligated non-covalently to the light chain (β2m) to form a complex. The complex was refolded in the Golgi apparatus and then presented onto the surface of the cellular membrane to bind CD8+ T lymphocytes and induce cellular immunity [53]. If the peptides bound to the MHC class I molecules were eluted and extracted, natural CTL epitopes could be identified [54,55]. In this study, the primary objective was to establish a PK15 cell line that could stably express VP1 using a transient expression vector, pEGFP-N1-VP1, allowing the VP1 protein to be continuously processed and presented by the cells. During the establishment, we found that the concentration of G418 and the ratio of liposomes to plasmids were crucial points in screening PK15 cell transfectants to stably express VP1. After a long selection process, stably expressed VP1 fused EGFP transfected PK15 cells, obtained with a concentration of G418 at 500 μg/mL and a 1:1 ratio of liposomes to plasmids, were screened, isolated, and gradually increased in number through cultivation. However, while cultivating the complete positive cells, the concentration of G418 was adjusted to 300 μg/mL to ensure that the VP1 gene fused with the EGFP gene was stably expressed in PK15 cells.
To determine whether the VP1 gene fused with the EGFP gene was stably expressed, we performed RT-PCR and Western blot assays on the cells. These results successfully demonstrate that VP1 fused with the EGFP gene is expressed at both the nucleic acid and protein levels. The above results indicate that we successfully constructed a cell line that stably expresses the O serotype of the VP1 gene, which can then be used for peptide elution. However, to date, most reports on acid-eluted antigenic peptides have been conducted in human or murine natural cell lines isolated from tissues associated with tumors or direct viral infection [34,35,56]. As for swine, there is still no report associated with the identification of the naturally presenting peptides by acid-elution. Because FMDV pathogen experiments require high-grade biosafety, it is not a feasible strategy for most labs or groups to obtain cells that can directly express the VP1 protein from FMDV-challenged tissues. Therefore, constructing a cell line that stably expresses the VP1 protein should be the key strategy to solve this problem. In this research, we transfected the transiently expressed plasmid pEGFP-N1-VP1 into PK15 cells using a G418 gradient concentration screening method and a gradient-enlarged culture. A cell line that stably expresses the VP1 protein has been successfully constructed in our lab. Then, using the mild acid elution method, we identified 37 eluted peptides, each with 8–11 amino acids, from the surface of the constructed pEGFP-N1-VP1/PK15 cell line by liquid chromatography–tandem mass spectrometry (LC–MS/MS). Among them, the first 12 peptides with XCorr Sequest HT values (abundance values) over 1 are the top higher-reliability antigenic peptides, as shown in Table 1 and Supplementary Figure S3. The peptide binding groove of SLA-I, similar to the other MHC class I, can mostly accommodate 8–11 amino acids, which just matches the length of the eluted peptides in this assay [45,57]. The flow cytometric analysis further confirmed that the eluted peptides should be associated with and presented by SLA-I molecules. This is because the peptides, along with the light chain of β2m, bound to the heavy chain of SLA-I through hydrogen bonds, were eluted and consequently lost. This finding aligns with previous reports on other MHC class I detection methods [32,37]. However, because the heavy chain of SLA-I can be embedded on the surface of cells through transmembrane and intracellular regions, just like other MHC class I [53], the expression of the heavy chain of class I on the cell surface decreased slightly, as shown in Figure 5. This differs from Santin et al., who reported that the expression of the heavy chain of MHC I in tumor cells increases after acid treatment [42]. It may also be due to the varying levels of MHC I expression in different cells. There are three constitutively expressed classical and polymorphic SLA-I genes in the genome, namely SLA-1, SLA-2 and SLA-3. Among them, SLA-1 and SLA-2 are more polymorphic than SLA-3, which means that SLA-1 and SLA-2 are used more frequently in APCs [58]. Therefore, in order to prove that the eluted peptides were SLA-I bound, we adopted a micro-scale refold-ELISA-based method to detect the binding affinity of eluted peptides with SLA-1*04:01, SLA-2*04:02:01, and SLA-3*xd, all of which were isolated from PK15 cells. The ELISA results indicated that all of the eluted peptides were significantly bound with at least one of three SLA-I molecules compared to the negative control, while the control random peptide CN showed non-significantly bound with SLA-I, as shown in Figure 6, although some of the peptides did not display a significant peptide-binding affinity with one of SLA-1*04:01, or SLA-2*04:02:01, or SLA-3*xd. Therefore, it can be deduced that all the eluted peptides were SLA-I bound, although different peptides showed different peptide-binding preferences with different SLA-I molecules. For example, the No. 8 peptide did not display a significant peptide-binding affinity with SLA-1*04:01, but showed extremely significant peptide-binding affinity with SLA-1*04:02:01 and SLA-3*xd. Other peptides, such as No.12, 22, 5, 6 and 7 had a similar phenomenon to peptide No.8. Based on these data, it could be deduced that the SLA-1, SLA-2 and SLA-3 in PK15 cells can cooperatively present peptides. However, it seems that SLA-1*04:01 and SLA-2*04:02:01 play a more crucial role in peptide-presenting than that of SLA-3*xd, because SLA-1*04:01 can bind a dominant peptide No.6 with the highest affinity, while SLA-2*04:02:01 covers a more comprehensive range of peptide-binding than SLA-3*xd. It should be noted that the order of each peptide-binding affinity was not completely consistent with that of the abundance value shown in Table 1, which might be attributed to the different environment for peptides in vivo or in vitro. However, we proved that the eluted peptides were SLA-I-associated and bound. These results indicate that the eluted peptides derived from the VP1 protein could be processed, assembled, and presented to the surface of the pEGFP-N1-VP1/PK15 cell membrane by SLA-I molecules. Therefore, the eluted peptides should be potential CTL epitopes restricted by SLA-I molecules, as previously reported [54,55]. This assay also proves that the constructed pEGFP-N1-VP1/PK15 cells can be used for screening and studying the naturally presenting CTL epitopes in vivo.

5. Conclusions

In conclusion, we constructed a cell line that can stably express the transfected VP1 recombinant plasmids in PK15 based on a transient expression vector. This cell line can be used to study the presentation and elution of antigenic peptides and to further identify functional CTL epitopes matched to SLA-I molecules. This research lays the groundwork for screening CTL epitopes and developing multi-epitope FMDV vaccines.

Supplementary Materials

The following supporting information can be downloaded at: https://www.mdpi.com/article/10.3390/ani15213097/s1, Figure S1: The G418 lethal concentration curve for PK15 cells. The y-axis shows the mean number of living cells after treatment. The x-axis shows the concentration of G418. Viable cells were counted on the 7th day by an EVE Automatic cell counter (NanoEnTek, Seoul, Korea); Figure S2: Comparing the sequence of the VP1 in the transfected pEGFP-N1-VP1 plasmid clone and that of the VP1 in the primary pEGFP-N1-VP1 plasmid. (A) Nucleotide sequence comparison. The top sequence is from the primary plasmid, denoted as O-VP1, while the lower sequence is from the transfected pEGFP-N1-VP1 plasmid clone, denoted as ZB092001076 (1-PEGFP-VP1-N1) PEGFP-N5_J_G12. The nucleotide homology rate between the two sequences is 100%. (B) Amino acid sequence comparison. The top sequence is from the primary plasmid, denoted as O-VP1, while the lower sequence is from the transfected pEGFP-N1-VP1 plasmid clone, denoted as 1-PEGFP-VP1-N1.AA. The amino acid homology rate between the two sequences is 100%; Figure S3: The representative eluted peptides detected by LC–MS/MS. (A–L), the top 12 eluted peptides had XCorr Sequest High Throughput values greater than one. Among them, the peptides shown in Figure S3B, D, E, G, I, J, and K were modified with deamination or oxidation.

Author Contributions

Conceptualization, F.-S.G., Z.-B.L. and G.-X.H.; methodology, Y.-Y.G., Z.-H.Z. and Y.H.; formal analysis, Y.-Y.G., Z.-H.Z., C.-J.S. and Y.H.; investigation, Z.-H.Z., C.-J.S., Y.H., Y.-D.C., Y.T. and Z.-B.L.; data curation, Y.-Y.G., C.-J.S. and Z.-B.L.; writing—original draft preparation, Y.-Y.G., Z.-H.Z. and Y.H.; writing—review and editing, Y.-Y.G., Z.-H.Z., C.-J.S., Y.-D.C., Y.T., F.-S.G., Z.-B.L. and G.-X.H.; visualization, Y.-Y.G., C.-J.S., Y.-D.C., Y.T. and Z.-B.L.; supervision, F.-S.G. and G.-X.H.; project administration, F.-S.G.; funding acquisition, F.-S.G. All authors have read and agreed to the published version of the manuscript.

Funding

This study was financially supported by the National Natural Science Foundation of China (grant number 32273022). This research was also funded by the Innovative Development Project in the Department of Education of Liaoning Province (LJ242511258002), the Dalian University Discipline Construction Special Project (grant number DLUXK-2025-FX-003), and by the Talent Innovation and Entrepreneurship Team in Dalian University (grant numbers XLJ202005).

Institutional Review Board Statement

Not applicable.

Informed Consent Statement

Not applicable.

Data Availability Statement

The datasets analyzed are available from the corresponding author on reasonable request.

Acknowledgments

We thank Shi-jun Zheng in China Agricultural University for his kind provision of the plasmid pEGFP-N1-VP1.

Conflicts of Interest

The authors declare no conflicts of interest.

References

  1. Stenfeldt, C.; Eschbaumer, M.; Humphreys, J.; Medina, G.N.; Arzt, J. The pathogenesis of foot-and-mouth disease virus: Current understandings and knowledge gaps. Vet. Res. 2025, 56, 119. [Google Scholar] [CrossRef]
  2. Saraiva, V. Foot-and-mouth disease in the Americas: Epidemiology and ecologic changes affecting distribution. Ann. N. Y. Acad. Sci. 2004, 1026, 73–78. [Google Scholar] [CrossRef]
  3. Dehoux, J.P.; Hounsou-Ve, G. Outbreak of foot-and-mouth disease in Northern Benin during the 1990–1991 dry season. Rev. Elev. Med. Vet. Pays Trop. 1991, 44, 261–262. [Google Scholar] [CrossRef]
  4. Paton, D.J.; King, D.P.; Knowles, N.J.; Hammond, J. Recent spread of foot-and-mouth disease in the Far East. Vet. Rec. 2010, 166, 569–570. [Google Scholar] [CrossRef]
  5. Dahiya, S.S.; Subramaniam, S.; Rautaray, S.S.; Rout, M.; Mohapatra, J.K.; Singh, R.P. A foot-and-mouth disease virus serotype O field strain from an outbreak in India has a three-codon deletion in the 3A coding region. Arch. Virol. 2025, 170, 112. [Google Scholar] [CrossRef]
  6. Dinana, Z.; Suwarno, S.; Mustofa, I.; Rahmahani, J.; Kusnoto, K.; Maharani, A.T.; Fitria, A.L.; Witaningrum, A.M.; Maulana, F.K.; Said, N.S.; et al. Molecular characterization of VP1 gene during the foot and mouth disease virus outbreak in East Java, Indonesia, in 2022. Vet. World 2024, 17, 2469–2476. [Google Scholar] [CrossRef] [PubMed]
  7. Tesfaye, Y.; Khan, F.; Gelaye, E. Molecular characterization of foot-and-mouth disease viruses collected from Northern and Central Ethiopia during the 2018 outbreak. Vet. World 2020, 13, 542–548. [Google Scholar] [CrossRef] [PubMed]
  8. WOAH. Event 6177 Germany-Foot and Mouth Disease Virus (Inf. with). Available online: https://wahis.woah.org/#/in-event/6177/dashboard (accessed on 16 May 2025).
  9. WOAH. Event 6317 Hungary-Foot and Mouth Disease Virus (Inf. with). Available online: https://wahis.woah.org/#/in-event/6317/dashboard (accessed on 16 May 2025).
  10. WOAH. Event 6359 Slovakia-Foot and Mouth Disease Virus (Inf. with). Available online: https://wahis.woah.org/#/in-event/6359/dashboard (accessed on 16 May 2025).
  11. Tully, D.C.; Fares, M.A. Unravelling selection shifts among foot-and-mouth disease virus (FMDV) serotypes. Evol. Bioinform. Online 2007, 2, 211–225. [Google Scholar] [CrossRef]
  12. Seeyo, K.B.; Nishi, T.; Kawaguchi, R.; Ungvanijban, S.; Udon, R.; Fukai, K.; Yamakawa, M.; Rukkwamsuk, T. Evolution of antigenic and genetic characteristics of foot-and-mouth disease virus serotype A circulating in Thailand, 2007-2019. Virus Res. 2020, 290, 198166. [Google Scholar] [CrossRef]
  13. Mason, P.W.; Grubman, M.J.; Baxt, B. Molecular basis of pathogenesis of FMDV. Virus Res. 2003, 91, 9–32. [Google Scholar] [CrossRef] [PubMed]
  14. Tosh, C.; Hemadri, D.; Sanyal, A. Evidence of recombination in the capsid-coding region of type A foot-and-mouth disease virus. J. Gen. Virol. 2002, 83, 2455–2460. [Google Scholar] [CrossRef]
  15. Parry, N.; Fox, G.; Rowlands, D.; Brown, F.; Fry, E.; Acharya, R.; Logan, D.; Stuart, D. Structural and serological evidence for a novel mechanism of antigenic variation in foot-and-mouth disease virus. Nature 1990, 347, 569–572. [Google Scholar] [CrossRef]
  16. Dus Santos, M.J.; Wigdorovitz, A.; Trono, K.; Rios, R.D.; Franzone, P.M.; Gil, F.; Moreno, J.; Carrillo, C.; Escribano, J.M.; Borca, M.V. A novel methodology to develop a foot and mouth disease virus (FMDV) peptide-based vaccine in transgenic plants. Vaccine 2002, 20, 1141–1147. [Google Scholar] [CrossRef]
  17. Nanda, R.K.; Hajam, I.A.; Edao, B.M.; Ramya, K.; Rajangam, M.; Chandra Sekar, S.; Ganesh, K.; Bhanuprakash, V.; Kishore, S. Immunological evaluation of mannosylated chitosan nanoparticles based foot and mouth disease virus DNA vaccine, pVAC FMDV VP1-OmpA in guinea pigs. Biologicals 2014, 42, 153–159. [Google Scholar] [CrossRef]
  18. Song, B.M.; Lee, G.H.; Kang, S.M.; Tark, D. Evaluation of vaccine efficacy with 2B/T epitope conjugated porcine IgG-Fc recombinants against foot-and-mouth disease virus. J. Vet. Med. Sci. 2024, 86, 999–1007. [Google Scholar] [CrossRef] [PubMed]
  19. Diaz-San Segundo, F.; Medina, G.N.; Stenfeldt, C.; Arzt, J.; de Los Santos, T. Foot-and-mouth disease vaccines. Vet. Microbiol. 2017, 206, 102–112. [Google Scholar] [CrossRef] [PubMed]
  20. Yu, S.C.; Lee, I.K.; Kong, H.S.; Shin, S.H.; Hwang, S.Y.; Ahn, Y.J.; Park, J.H.; Kim, B.Y.; Song, Y.C. Foot-and-Mouth Disease Virus-like Particles Produced in E. coli as Potential Antigens for a Novel Vaccine. Vet. Sci. 2025, 12, 539. [Google Scholar] [CrossRef] [PubMed]
  21. Zheng, M.; Jin, N.; Zhang, H.; Jin, M.; Lu, H.; Ma, M.; Li, C.; Yin, G.; Wang, R.; Liu, Q. Construction and immunogenicity of a recombinant fowlpox virus containing the capsid and 3C protease coding regions of foot-and-mouth disease virus. J. Virol. Methods 2006, 136, 230–237. [Google Scholar] [CrossRef]
  22. Li, J.; Zhong, Y.; Li, H.; Zhang, N.; Ma, W.; Cheng, G.; Liu, F.; Liu, F.; Xu, J. Enhancement of Astragalus polysaccharide on the immune responses in pigs inoculated with foot-and-mouth disease virus vaccine. Int. J. Biol. Macromol. 2011, 49, 362–368. [Google Scholar] [CrossRef]
  23. Shao, J.; Liu, W.; Gao, S.; Chang, H.; Guo, H. A recombinant multi-epitope trivalent vaccine for foot-and-mouth disease virus serotype O in pigs. Virology 2024, 596, 110103. [Google Scholar] [CrossRef]
  24. Bhutta, M.S.; Awais, M.; Sadaqat, S.; Zanchi, F.B.; Shahid, N.; Qayyum Rao, A. A novel immunoinformatics approach for developing a poly-epitope vaccine targeting foot and mouth disease virus, exploiting structural VP proteins. J. Biomol. Struct. Dyn. 2025, 43, 6171–6187. [Google Scholar] [CrossRef]
  25. de Leon, P.; Canas-Arranz, R.; Defaus, S.; Torres, E.; Forner, M.; Bustos, M.J.; Revilla, C.; Dominguez, J.; Andreu, D.; Blanco, E.; et al. Swine T-Cells and Specific Antibodies Evoked by Peptide Dendrimers Displaying Different FMDV T-Cell Epitopes. Front. Immunol. 2020, 11, 621537. [Google Scholar] [CrossRef]
  26. Francis, M.J.; Hastings, G.Z.; Syred, A.D.; McGinn, B.; Brown, F.; Rowlands, D.J. Non-responsiveness to a foot-and-mouth disease virus peptide overcome by addition of foreign helper T-cell determinants. Nature 1987, 330, 168–170. [Google Scholar] [CrossRef]
  27. Feng, L.; Sun, M.W.; Jiang, P.; Li, Z.B.; Gao, H.; Zhai, X.X.; Han, Y.; Zhang, Z.H.; Gao, F.S. Purification, crystallization and preliminary X-ray crystallographic studies of swine MHC class I complexed with an FMDV CTL epitope Hu64. Res. Vet. Sci. 2018, 119, 205–208. [Google Scholar] [CrossRef]
  28. Guzman, E.; Taylor, G.; Charleston, B.; Ellis, S.A. Induction of a cross-reactive CD8(+) T cell response following foot-and-mouth disease virus vaccination. J. Virol. 2010, 84, 12375–12384. [Google Scholar] [CrossRef] [PubMed]
  29. Feng, L.; Gao, Y.Y.; Sun, M.; Li, Z.B.; Zhang, Q.; Yang, J.; Qiao, C.; Jin, H.; Feng, H.S.; Xian, Y.H.; et al. The Parallel Presentation of Two Functional CTL Epitopes Derived from the O and Asia 1 Serotypes of Foot-and-Mouth Disease Virus and Swine SLA-2*HB01: Implications for Universal Vaccine Development. Cells 2022, 11, 4017. [Google Scholar] [CrossRef] [PubMed]
  30. Gao, F.S.; Feng, L.; Zhang, Q.; Yan, R.Q.; Li, Y.G.; Li, X.S. Immunogenicity of two FMDV nonameric peptides encapsulated in liposomes in mice and the protective efficacy in guinea pigs. PLoS ONE 2013, 8, e68658. [Google Scholar] [CrossRef]
  31. Gao, F.S.; Zhai, X.X.; Jiang, P.; Zhang, Q.; Gao, H.; Li, Z.B.; Han, Y.; Yang, J.; Zhang, Z.H. Identification of two novel foot-and-mouth disease virus cytotoxic T lymphocyte epitopes that can bind six SLA-I proteins. Gene 2018, 653, 91–101. [Google Scholar] [CrossRef]
  32. Gao, F.S.; Fang, Q.M.; Li, Y.G.; Li, X.S.; Hao, H.F.; Xia, C. Reconstruction of a swine SLA-I protein complex and determination of binding nonameric peptides derived from the foot-and-mouth disease virus. Vet. Immunol. Immunopathol. 2006, 113, 328–338. [Google Scholar] [CrossRef]
  33. Gao, F.S.; Feng, L.; Jiang, P.; Li, Z.B.; Gao, H.; Zhai, X.X.; Zhang, Z.H.; Hu, X. Expression, purification, crystallization and preliminary X-ray diffraction analysis of swine leukocyte antigen 2 complexed with a CTL epitope AS64 derived from Asia1 serotype of foot-and-mouth disease virus. BMC Vet. Res. 2018, 14, 407. [Google Scholar] [CrossRef] [PubMed]
  34. Delluc, S.; Tourneur, L.; Fradelizi, D.; Rubio, M.T.; Marchiol-Fournigault, C.; Chiocchia, G.; Buzyn, A. DC-based vaccine loaded with acid-eluted peptides in acute myeloid leukemia: The importance of choosing the best elution method. Cancer Immunol. Immunother. 2007, 56, 1–12. [Google Scholar] [CrossRef]
  35. Zitvogel, L.; Mayordomo, J.I.; Tjandrawan, T.; DeLeo, A.B.; Clarke, M.R.; Lotze, M.T.; Storkus, W.J. Therapy of murine tumors with tumor peptide-pulsed dendritic cells: Dependence on T cells, B7 costimulation, and T helper cell 1-associated cytokines. J. Exp. Med. 1996, 183, 87–97. [Google Scholar] [CrossRef]
  36. Storkus, W.J.; Zeh, H.J., 3rd; Salter, R.D.; Lotze, M.T. Identification of T-cell epitopes: Rapid isolation of class I-presented peptides from viable cells by mild acid elution. J. Immunother. Emphas. Tumor Immunol. 1993, 14, 94–103. [Google Scholar] [CrossRef]
  37. Li, X.; Wang, J.; Liu, J.; Li, Z.; Wang, Y.; Xue, Y.; Li, X.; Cao, H.; Zheng, S.J. Engagement of soluble resistance-related calcium binding protein (sorcin) with foot-and-mouth disease virus (FMDV) VP1 inhibits type I interferon response in cells. Vet. Microbiol. 2013, 166, 35–46. [Google Scholar] [CrossRef] [PubMed]
  38. Furusawa, Y.; Yamanouchi, Y.; Iizumi, T.; Zhao, Q.L.; Mitsuhashi, Y.; Morita, A.; Enomoto, A.; Tabuchi, Y.; Kondo, T. Checkpoint kinase 2 is dispensable for regulation of the p53 response but is required for G2/M arrest and cell survival in cells with p53 defects under heat stress. Apoptosis 2017, 22, 1225–1234. [Google Scholar] [CrossRef]
  39. Gao, F.S.; Bai, J.; Gong, X.J.; Zhang, X.H.; Zhang, W.J.; Guo, D.; Zhang, S. Analyzing the genetic characteristics and function of the swine leukocyte antigen 2 gene in a Chinese inbreed of pigs. Microbiol. Immunol. 2012, 56, 208–215. [Google Scholar] [CrossRef] [PubMed]
  40. Walker, J.M. The bicinchoninic acid (BCA) assay for protein quantitation. Methods Mol. Biol. 1994, 32, 5–8. [Google Scholar] [CrossRef] [PubMed]
  41. Jin, Y.; Yu, Y.; Qi, Y.; Wang, F.; Yan, J.; Zou, H. Peptide profiling and the bioactivity character of yogurt in the simulated gastrointestinal digestion. J. Proteom. 2016, 141, 24–46. [Google Scholar] [CrossRef]
  42. Santin, A.D.; Bellone, S.; Ravaggi, A.; Pecorelli, S.; Cannon, M.J.; Parham, G.P. Induction of ovarian tumor-specific CD8+ cytotoxic T lymphocytes by acid-eluted peptide-pulsed autologous dendritic cells. Obs. Obstet. Gynecol. 2000, 96, 422–430. [Google Scholar]
  43. Sylvester-Hvid, C.; Kristensen, N.; Blicher, T.; Ferre, H.; Lauemoller, S.L.; Wolf, X.A.; Lamberth, K.; Nissen, M.H.; Pedersen, L.O.; Buus, S. Establishment of a quantitative ELISA capable of determining peptide—MHC class I interaction. Tissue Antigens 2002, 59, 251–258. [Google Scholar] [CrossRef]
  44. Walters, L.C.; Harlos, K.; Brackenridge, S.; Rozbesky, D.; Barrett, J.R.; Jain, V.; Walter, T.S.; O'Callaghan, C.A.; Borrow, P.; Toebes, M.; et al. Pathogen-derived HLA-E bound epitopes reveal broad primary anchor pocket tolerability and conformationally malleable peptide binding. Nat. Commun. 2018, 9, 3137. [Google Scholar] [CrossRef]
  45. Hopkins, L.M.; Schall, M.; Leykam, J.F.; Gerlach, J.A. Characterization of major histocompatibility complex-associated peptides from a small volume of whole blood. Anal. Biochem. 2004, 328, 155–161. [Google Scholar] [CrossRef] [PubMed]
  46. Zhang, N.; Qi, J.; Feng, S.; Gao, F.; Liu, J.; Pan, X.; Chen, R.; Li, Q.; Chen, Z.; Li, X.; et al. Crystal structure of swine major histocompatibility complex class I SLA-1 0401 and identification of 2009 pandemic swine-origin influenza A H1N1 virus cytotoxic T lymphocyte epitope peptides. J. Virol. 2011, 85, 11709–11724. [Google Scholar] [CrossRef]
  47. Hu, B.; Li, C.; Lu, H.; Zhu, Z.; Du, S.; Ye, M.; Tan, L.; Ren, D.; Han, J.; Kan, S.; et al. Immune responses to the oral administration of recombinant Bacillus subtilis expressing multi-epitopes of foot-and-mouth disease virus and a cholera toxin B subunit. J. Virol. Methods 2011, 171, 272–279. [Google Scholar] [CrossRef]
  48. Li, Q.; Wubshet, A.K.; Wang, Y.; Heath, L.; Zhang, J. B and T Cell Epitopes of the Incursionary Foot-and-Mouth Disease Virus Serotype SAT2 for Vaccine Development. Viruses 2023, 15, 797. [Google Scholar] [CrossRef] [PubMed]
  49. Patch, J.R.; Pedersen, L.E.; Toka, F.N.; Moraes, M.; Grubman, M.J.; Nielsen, M.; Jungersen, G.; Buus, S.; Golde, W.T. Induction of foot-and-mouth disease virus-specific cytotoxic T cell killing by vaccination. Clin. Vaccine Immunol. 2011, 18, 280–288. [Google Scholar] [CrossRef]
  50. Krensky, A.M. The HLA system, antigen processing and presentation. Kidney Int. Suppl. 1997, 58, S2–S7. [Google Scholar] [PubMed]
  51. Brodsky, F.M.; Guagliardi, L.E. The cell biology of antigen processing and presentation. Annu. Rev. Immunol. 1991, 9, 707–744. [Google Scholar] [CrossRef]
  52. Billetta, R.; Filaci, G.; Zanetti, M. Major histocompatibility complex class I-restricted presentation of influenza virus nucleoprotein peptide by B lymphoma cells harboring an antibody gene antigenized with the virus peptide. Eur. J. Immunol. 1995, 25, 776–783. [Google Scholar] [CrossRef]
  53. Nakagawa, Y.; Shimizu, M.; Norose, Y.; Takahashi, M.; Takahashi, H. Induction of rapid apoptosis for class I MHC molecule-restricted CD8(+) HIV-1 gp160-specific murine activated CTLs by free antigenic peptide in vivo. Int. Immunol. 2013, 25, 11–24. [Google Scholar] [CrossRef]
  54. Wolk, B.; Trautwein, C.; Buchele, B.; Kersting, N.; Blum, H.E.; Rammensee, H.G.; Cerny, A.; Stevanovic, S.; Moradpour, D.; Brass, V. Identification of naturally processed hepatitis C virus-derived major histocompatibility complex class I ligands. PLoS ONE 2012, 7, e29286. [Google Scholar] [CrossRef] [PubMed]
  55. Calhoun, R.F., 2nd; Naziruddin, B.; Enriquez-Rincon, F.; Duffy, B.F.; Ritter, J.M.; Sundaresan, S.; Patterson, G.A.; Cooper, J.D.; Mohanakumar, T. Evidence for cytotoxic T lymphocyte response against human lung cancer: Reconstitution of antigenic epitope with peptide eluted from lung adenocarcinoma MHC class I. Surgery 2000, 128, 76–85. [Google Scholar] [CrossRef] [PubMed]
  56. Chromik, J.; Schnurer, E.; Georg Meyer, R.; Wehler, T.; Tuting, T.; Wolfel, T.; Huber, C.; Herr, W. Proteasome-inhibited dendritic cells demonstrate improved presentation of exogenous synthetic and natural HLA-class I peptide epitopes. J. Immunol. Methods 2006, 308, 77–89. [Google Scholar] [CrossRef]
  57. Murphy, J.P.; Yu, Q.; Konda, P.; Paulo, J.A.; Jedrychowski, M.P.; Kowalewski, D.J.; Schuster, H.; Kim, Y.; Clements, D.; Jain, A.; et al. Multiplexed Relative Quantitation with Isobaric Tagging Mass Spectrometry Reveals Class I Major Histocompatibility Complex Ligand Dynamics in Response to Doxorubicin. Anal. Chem. 2019, 91, 5106–5115. [Google Scholar] [CrossRef]
  58. Ando, A.; Kawata, H.; Shigenari, A.; Anzai, T.; Ota, M.; Katsuyama, Y.; Sada, M.; Goto, R.; Takeshima, S.N.; Aida, Y.; et al. Genetic polymorphism of the swine major histocompatibility complex (SLA) class I genes, SLA-1, -2 and -3. Immunogenetics 2003, 55, 583–593. [Google Scholar] [CrossRef] [PubMed]
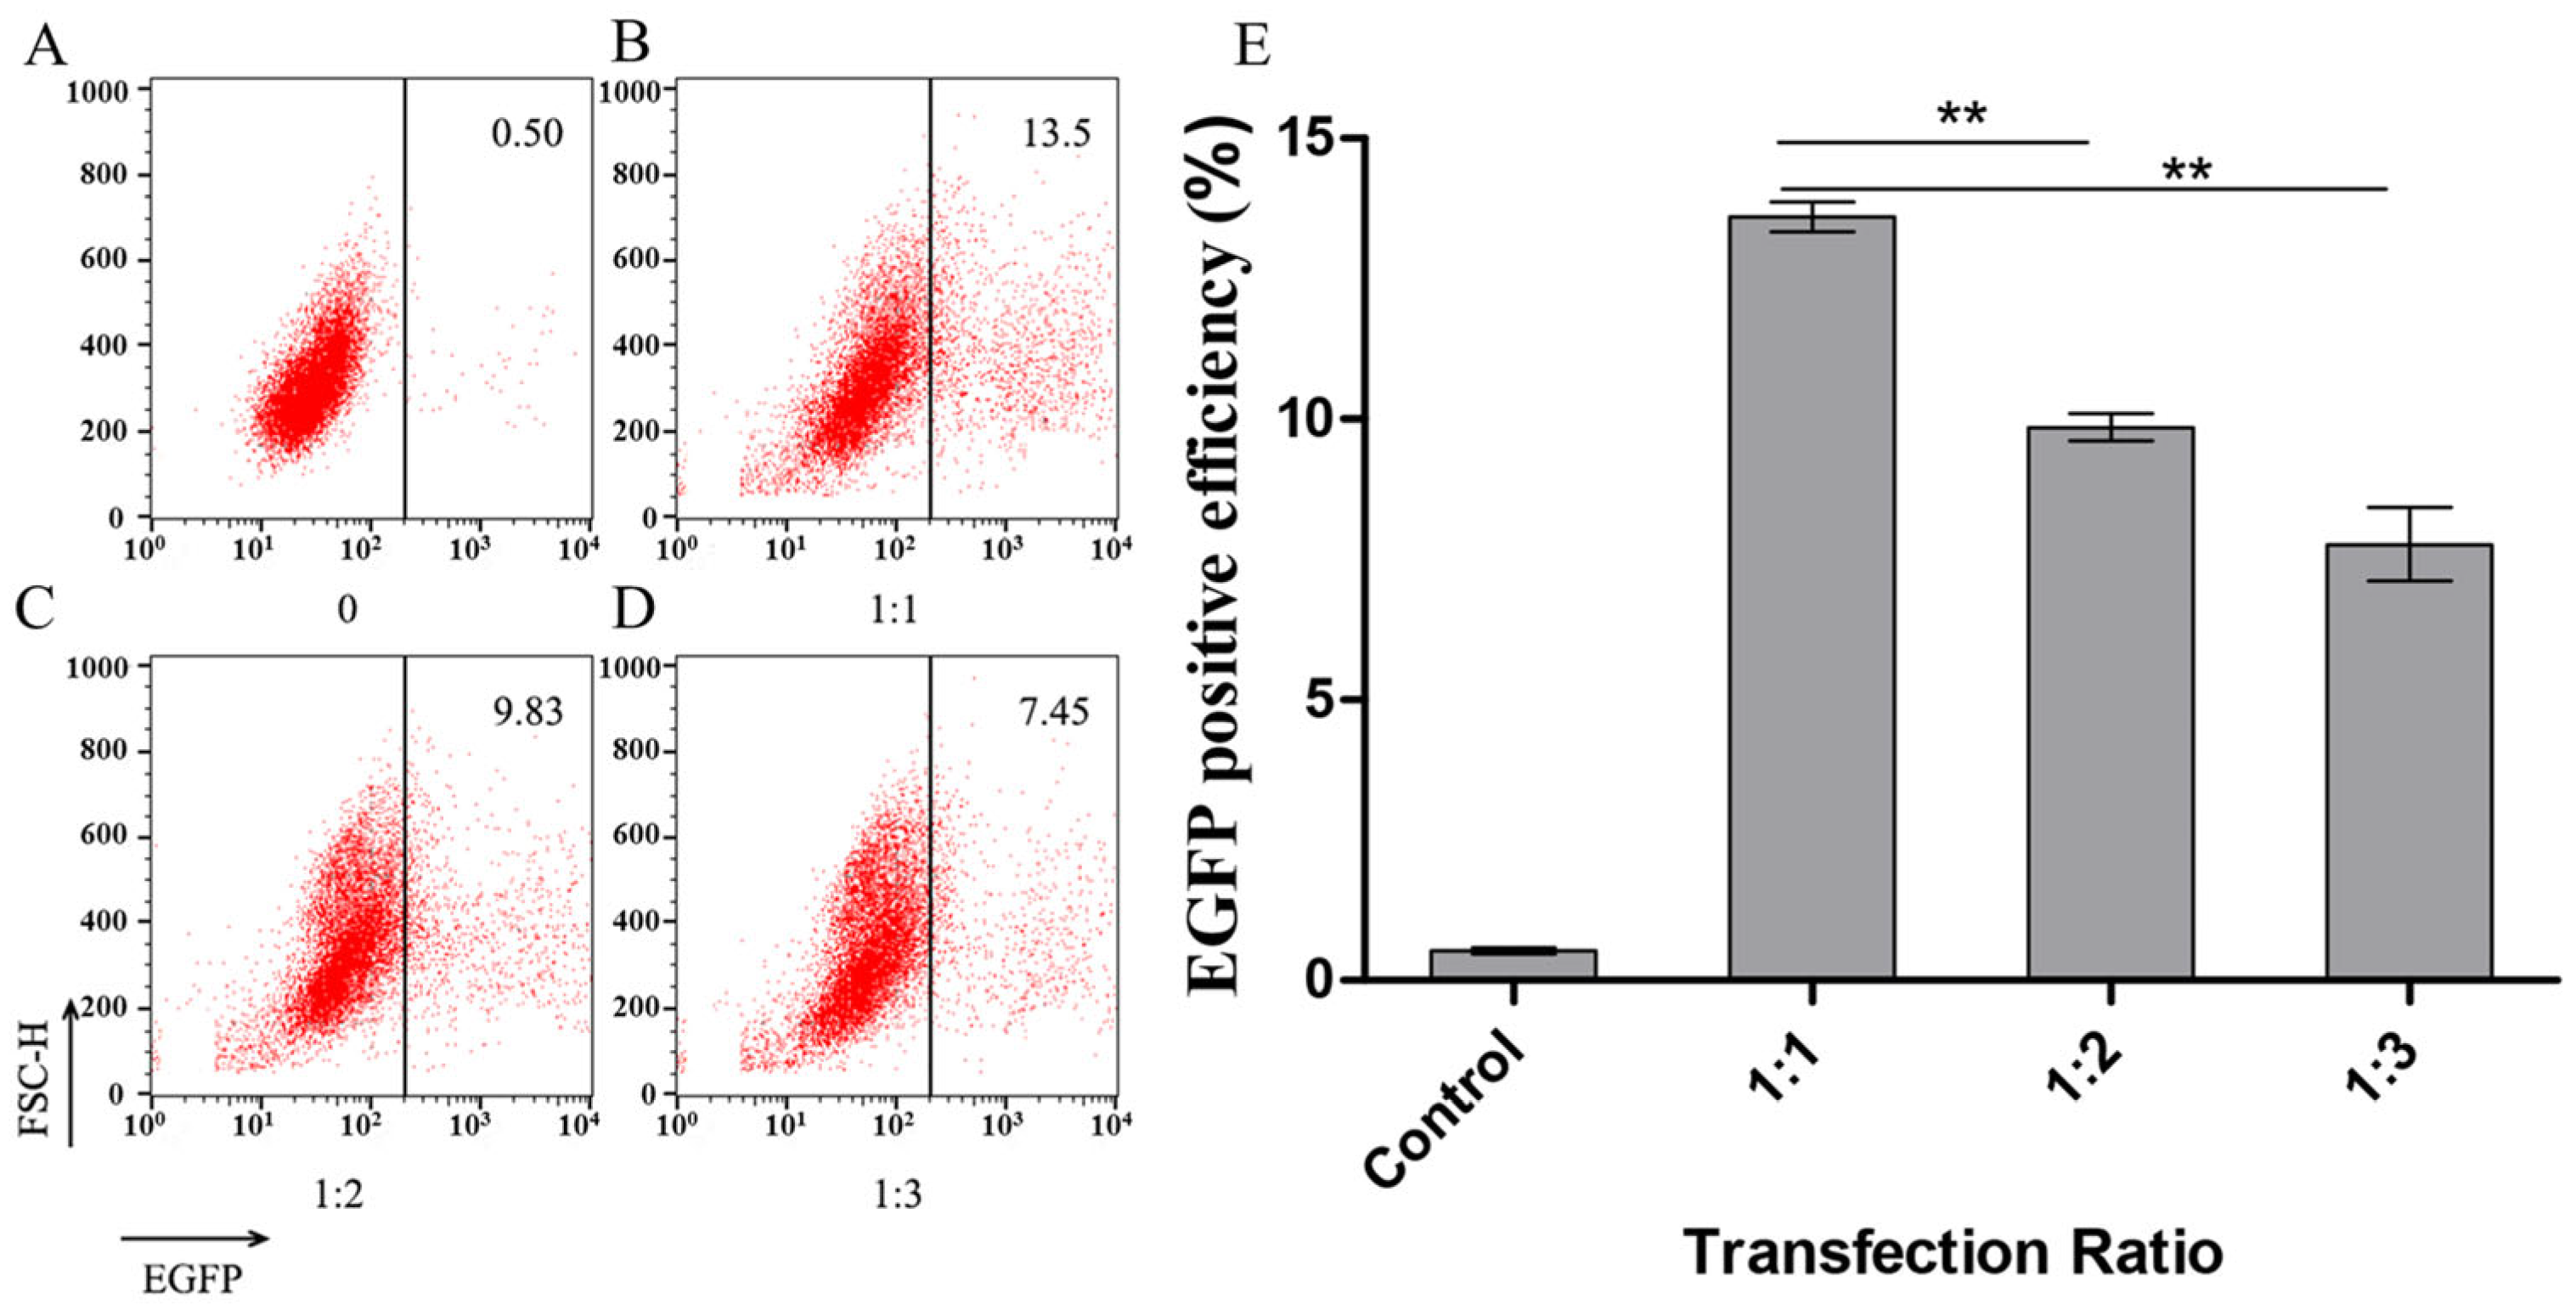
Figure 1. Detection of the transfection efficiency of PK15 cells by flow cytometry. (A) A representative detection of the control PK15 cells with no transfectant is marked as 0 under the X-axis of the figure. 0.50 is represented as a background value for the detection. (BD) Representative detections of the transfection efficiency of PK15 cells at (B) 1:1, (C) 1:2, and (D) 1:3 ratios of liposomes to plasmids. The transfection efficiency was 13.5, 9.83 and 7.45 percent, respectively. (E) Analysis of the transfection efficiency of PK15 cells at different ratios of liposomes to plasmids by statistics. ** p < 0.01.
Animals 15 03097 g001
Figure 2. Detection of transfection results for pEGFP-N1-VP1 vectors at different times after transfection. (AG) Detection of the expression of fluorescence associated VP1 fused to EGFP protein, which emits light green for transfected PK15 cells when measured by an ImageXpress Micro XLS Widefield High-Content Analysis System. The measurement times are 3, 6, 12, 24, 48, 72, and 168 h after transfection, respectively. (ag) Detection of the expression of both fluorescence-associated proteins and the nucleus stained with 4′,6-diamidino-2-phenylindole for the systems corresponding to A–H. The cells with only blue nucleus staining are negative cells for VP1 fused to EGFP expression, while the cells with dark green cytoplasm and cyan nucleus stains are positive cells for VP1 fused to EGFP expression. (H) An analogous measurement to (AG) after increasing cultivation from a cell mass emitting fluorescence. This measurement was taken 336 h after transfection. (h) An analogous measurement to (ag) for the same system as (H).
Animals 15 03097 g002
Figure 3. (A) Detection of the expression of VP1 fused to EGFP protein (green) in the stably transfected pEGFP-N1-VP1/PK15 cell line at 480 h after transfection. (B) Detection of the cell nuclei stained with DAPI in light blue for the same system. (C) A composite image of (A,B). The cells with nuclei stained only blue are negative for EGFP-VP1 expression, while the cells with cytoplasm stained dark green and nuclei stained cyan are positive for VP1 fused to EGFP expression.
Animals 15 03097 g003
Figure 4. Identification of the stable expression of VP1 in the pEGFP-N1-VP1/PK15 cell line. (A) Detection of VP1 transcription from the stably transfected pEGFP-N1-VP1/PK15 cell line by RT-PCR. Lane 1, DNA 2000 Maker; lane 2, the amplified VP1 fragment from stably transfected cells. (B) Detection of VP1 expression in the stably transfected pEGFP-N1-VP1/PK15 cell line by a Western blot assay. The reference protein is Glyceraldehyde-3-phosphate Dehydrogenase (GAPDH), with a molecular weight of about 36 kDa, while the fusion VP1-EGFP protein has a molecular weight of about 51.1 kDa. The control PK15 cells and the transfected pEGFP-N1/PK15 cells did not express the protein of interest. (C) Analysis of the relative expression of VP1 in contrast to PK15 and pEGFP-N1-VP1/PK15 controls, respectively. **** p < 0.0001; *** p < 0.001.
Animals 15 03097 g004
Figure 5. Flow cytometric analysis of SLA-I expression by pEGFP-N1-VP1/PK15 cells before and after acid elution treatment. The SLA-I expression on the surface of different cells was detected by (A) heavy chain monoclonal antibody, (B) light chain β2m monoclonal antibody before and after acid elution treatment, and (C) SLA-I antibody. The black line indicates the negative control cell of primary PK15; the red line indicates SLA-I expression before acid elution treatment; the blue line indicates SLA-I expression after acid elution treatment.
Animals 15 03097 g005
Figure 6. Peptides’ binding affinity with SLA-I was detected by ELISA. (A) Peptides binding affinity with SLA-1*04:01, (B) Peptides binding affinity with SLA-2*04:02:01, (C) Peptides binding affinity with SLA-3*xd. No coating represented a blank control, which consisted of no coating with HC antibody and no antigen added to the well, although HRP-labeled β2m antibody and HRP-labeled goat anti-mouse IgG were added. HC + β2m represented a negative control. NA represented a negative peptide. As64 represented a positive control. Data for three biological repeats with average absorbance ± SEM are reported. A significant eluted peptide was identified by comparing it with the negative control at a threshold of p < 0.05. **** p < 0.0001; *** p < 0.001; ** p < 0.01; * p < 0.05.
Animals 15 03097 g006
Table 1. The identified peptides derived from the VP1 protein of the O serotype of FMDV, eluted from the surface of pEGFP-N1-VP1/PK15 cell lines by LC–MS/MS.
No.Amino Acid
Sequence
Observed Mass (Da)m/zChargeSequence LengthXCorr Sequest High
Throughput a
1VGALLRTA800.4989400.7527281.6470474
2TDVSFILDR *1205.608402.54453101.264194489
3QINVLDLMQ1073.566537.2855291.230585575
4QINVLDLMQ *1074.55537.7767291.215035796
5EVAVKHEGNL *1096.563548.78482101.133248448
6VLTQKAARTLP1197.731399.91423111.12214005
7QINVLDLMQTP *b1289.629645.31782111.096101761
8LRTATYYFA1105.568553.2893291.094873786
9NVLDLMQTPA *1103.529552.26382101.065254211
10LTQKAARTL *1002.594501.8008291.051743507
11QINVLDLMQTP *b1273.634637.32192111.041987658
12PNGAPEAAL839.4258420.2158291.041754007
13KVTPKDQIN *1043.573522.2921290.987775028
14VAVKHEGNLT *1068.568534.78772100.986433804
15INVLDLMQTP1143.608572.31182100.978185475
16KDQINVLDLM *1206.592603.7962100.948512673
17QINVLDLMQT *1176.582588.79972100.942279458
18VTNPRGDL *872.4472436.7239280.904682457
19RGDLQVLTQ *1030.553515.7751290.901747465
20PNGAPEAAL *840.4098420.7085290.896400273
21LTWVPNGAPE1083.547420.70852100.881147504
22QKAARTLP *885.5152443.2597280.85133779
23NLTWVPNGA971.4945486.2554290.841899395
24TPKDQINVLD *1143.589572.2932100.839494526
25GDLQVLTQ873.4676437.2395280.83877182
26ENYGGETQVQ1124.485562.74622100.837942123
27QINVLDLMQ *1075.534538.2697290.837528408
28PRGDLQVLTQ1126.621563.8142100.83436358
29KAARTLPTSFN1205.664603.32962110.831243873
30INVLDLMQTP1145.576573.28852100.830663443
31INVLDLMQTP *1144.592572.80132100.829244375
32LQVLTQKA *901.5353451.2715280.817822039
33KAARTLPTSF1091.621546.30912100.812230647
34IKATRVTE917.5415459.2744280.80939424
35INVLDLMQ *946.4914473.7455280.807365835
36TQVQRRQH *1055.523528.267280.803292811
37RGDLQVLTQ *1031.537516.2765290.802214622
* denotes a peptide modified with deamination or oxidation; a denotes the abundance value (if the value is over 1, this indicates that the peptide has a higher abundance value); b denotes different modifications in the same peptide.
Disclaimer/Publisher’s Note: The statements, opinions and data contained in all publications are solely those of the individual author(s) and contributor(s) and not of MDPI and/or the editor(s). MDPI and/or the editor(s) disclaim responsibility for any injury to people or property resulting from any ideas, methods, instructions or products referred to in the content.