Article

Supplementary Feeding Regulates Muscle Development of Oula Sheep (Tibetan Sheep, Ovis aries) Through Glucose Metabolism Pathway

1
Academy of Animal Science and Veterinary Medicine, Qinghai University, Xining 810016, China
2
Plateau Livestock Genetic Resources Protection and Innovative Utilization Key Laboratory of Qinghai Province, Xining 810016, China
3
Key Laboratory of Livestock and Poultry Genetics and Breeding on the Qinghai-Tibet Plateau (Qinghai), Ministry of Agriculture and Rural Affairs, Xining 810016, China
4
State Key Laboratory of Biocontrol, School of Life Sciences, Sun Yat-sen University, Guangzhou 510275, China
*
Authors to whom correspondence should be addressed.
These authors contributed equally to this work.
Animals 2025, 15(17), 2626; https://doi.org/10.3390/ani15172626
Submission received: 8 August 2025 / Revised: 4 September 2025 / Accepted: 4 September 2025 / Published: 8 September 2025
(This article belongs to the Section Animal Physiology)

Simple Summary

To systematically investigate the core factors regulating muscle development in the locally bred high-quality meat sheep Oula under the grassland grazing production model on the Qinghai–Tibet Plateau, this study included muscle tissue from Oula sheep under 2 nutritional estimation models: grazing production, and post-grazing supplementary feeding production, involving 6-month-old female lambs and 18-month-old female sheep. Transcriptome sequencing was conducted. The results revealed that the CD4 and ICAM1 genes and the PI3K-Akt signaling pathway may play important roles during the lamb stage. During the growth stage, the AGL, PGM2L1, PRKAA2, NEDD4, and GBE1 genes may serve as core genes regulating skeletal muscle growth in Oula sheep after supplementary feeding through signaling pathways such as starch and sucrose metabolism and the insulin signaling pathway.

Abstract

To investigate the genetic regulatory mechanism of supplementary feeding on muscle development in Oula sheep, we employed transcriptomic analysis to explore the differentially expressed genes (DEGs) in the longissimus dorsi muscle of Oula sheep at different ages under conditions of supplementary feeding and non-supplementary feeding, as well as the significantly enriched Gene Ontology (GO) terms and Kyoto Encyclopedia of Genes and Genomes (KEGG) signaling pathways of DEGs. Moreover, by combining with the method of weighted gene co-expression network analysis, we screened for the potential hub genes that might play crucial roles. The results demonstrated that the CD4 and ICAM1 genes and the PI3K-Akt signaling pathway might exert important functions during the lamb stage. At the growth stage, the AGL, PGM2L1, PRKAA2, NEDD4, and GBE1 genes might serve as core genes to regulate the growth of skeletal muscle in Oula sheep after supplementary feeding through signaling pathways such as starch and sucrose metabolism and insulin signaling pathway. This outcome provides a molecular-level interpretation of the regulatory mechanism of supplementary feeding on muscle growth and development in Oula sheep at different ages, offering a theoretical basis for the further improvement of the meat quality of Oula sheep and the enhancement of the quality of livestock products in the Qinghai–Tibet Plateau region.

1. Introduction

The Oula sheep is a high-quality local breed found in high-altitude regions such as Qinghai, southern Gansu, and Tibet. This breed is characterized by its cold resistance and ability to thrive on coarse forage, with grazing being the primary feeding method. However, due to the unique geographical conditions of the Qinghai–Tibet Plateau, the alpine meadows provide insufficient forage resources during the long winter months to meet the growth needs of Oula sheep. Therefore, supplementary feeding in winter is crucial for the growth of Oula sheep. As a meat-type sheep, Oula sheep exhibit rapid growth and excellent fattening performance [1], and the meat is rich in protein and minerals, making it a high-quality meat product [2]. The proliferation and differentiation of muscle cells are regulated by various genes and transcription factors [3,4]. In mammals, skeletal muscle accounts for 40% to 60% of total body weight; thus, understanding the mechanisms underlying muscle cell growth and development can help us better regulate the growth rate of livestock muscle, enhancing the yield and quality of animal products. Studies indicate that the number of muscle fibers in mammals primarily increases during the fetal stage, with a constant number of muscle fibers postnatally. After birth, muscle growth is mainly due to an increase in fiber size and the differentiation of muscle fiber types [5]. Consequently, investigating the effects of supplementary feeding versus no supplementary feeding on the postnatal skeletal muscle development of Oula sheep is of critical importance.
With the development of second-generation sequencing technology, RNA-seq has been widely applied in the regulatory research of growth and development in livestock and poultry. A growing body of research has demonstrated that genes such as Myosin Light Chain (MYL) [6,7], B-cell translocation gene 2 (BTG2) [8], Fibroblast Growth Factor 6 (FGF6) [9], and Myostatin (MSTN) [7] play significant roles in muscle development in livestock and poultry. Wang et al. identified key regulatory genes in cattle muscle that are involved in signaling pathways such as cAMP, cGMP-PKG, and MAPK, which regulate growth and development [10]. Zhao et al. conducted transcriptomic sequencing of the longissimus dorsi muscle in goats and found that differentially expressed genes at various ages primarily function through pathways related to cellular energy [5]. Additionally, calcium ion binding, ECM-receptor interaction, and focal adhesion have been found to play critical roles in the mechanisms of fetal muscle differentiation in goats [11]. However, the mechanisms by which supplementary feeding influences muscle fiber development in meat sheep at different growth stages remain unclear.
Therefore, this study focuses on the Oula sheep as the research subject to investigate the genetic differences and regulatory mechanisms of muscle growth under supplementary feeding and non-supplementary feeding conditions. The findings aim to provide a theoretical basis for the genetic regulation and improvement of muscle growth and development in Oula sheep, as well as to offer new insights for the development of animal husbandry in the Qinghai–Tibet region.

2. Materials and Methods

2.1. Moral Statement

This trial was conducted with the approval of Qinghai Academy of Animal Husbandry and Veterinary Science (2025-QHMKY-008).

2.2. Sample Collection

A total of 30 healthy, weight-matched 6-month-old ewe lambs (with an average weight of 30.44 kg) and 30 healthy, weight-matched 18-month-old female Oula sheep (with an average weight of 41.06 kg) were selected from the same flock in the Henan Mongolian Autonomous County of Qinghai Province. The sheep were randomly assigned to two groups: a grazing group (un-supply) and a grazing plus supplementation group, with each group consisting of 5 replicates and 3 sheep per replicate. The experimental sheep were released for grazing at 09:00 and returned at 17:00 daily. The supplemented group received supplemental feeding upon return, with the dietary composition and nutritional ingredients shown in Table 1. The experimental duration was set to 60 days. At the end of the experiment, 5 sheep were randomly selected from each age group of both groups for slaughter, and samples of the longissimus dorsi muscle were collected.

2.3. RNA Extraction and Sequencing

RNA was extracted from the samples using the TRIzol reagent kit (TaKaRa) following the method described by Bao et al. [12]. The integrity of the extracted RNA was assessed, using Agilent 5400 detection of RNA purity and integrity, RNA purity and integrity meet the requirements for subsequent sequencing and research. cDNA libraries were subsequently constructed through reverse transcription. Quality control was performed on the cDNA libraries, and those meeting quality standards were sequenced using the Illumina platform. The raw sequencing data underwent quality control using FastQC, with low-quality reads being removed to obtain clean reads. The resulting clean reads were then aligned to the sheep reference genome using HISAT2 (2.2.1) software.
The data that support the findings of this study have been deposited into CNGB Sequence Archive (CNSA) of China National GeneBank DataBase (CNGBdb) with accession number CNP0004540.

2.4. Analysis of Differentially Expressed Genes

Differentially expressed genes were selected based on the criteria of Fold Change > 2 and p-value < 0.05. The identified differentially expressed genes underwent Gene Ontology (GO) and Kyoto Encyclopedia of Genes and Genomes (KEGG) enrichment analyses to reveal the primary biological functions and signaling pathways in which these genes are enriched. All the significant GO functions and KEGG pathways that are enriched were plotted, and the top 30 most significant ones were selected if there are more than 30.

2.5. Weighted Gene Co-Expression Network Analysis

A co-expression network was constructed for all differentially expressed genes using Weighted Gene Co-expression Network Analysis (WGCNA) by R package (1.71), allowing for the assessment of variability in gene expression among samples. The Pearson correlation coefficient was utilized to measure the correlation between genes, and these correlation values were subsequently weighted through power transformation to select an appropriate soft threshold. Based on the correlation heatmap between modules (the classified gene set), specific modules of interest were identified for further analysis. The genes from these selected modules were then intersected with the differentially expressed genes identified during the lamb and growth to find genes that were both significantly differentially expressed and present in the selected modules. Interaction analysis of these genes was performed using the STRING database (https://cn.string-db.org/, accessed on 27 December 2024) to construct a co-expression network, and the results were visualized using Cytoscape 3.10.3 software.

2.6. Validation by qPCR

Quantitative PCR (qPCR) was employed to validate the reliability of the transcriptome data. Primers were designed using the NCBI website, with ACTB serving as the reference gene for gene expression validation (Table 2).

3. Results and Analysis

3.1. Differential Gene Expression Profiles

The RNA quality control results are shown in Table 3 and gene expression group heatmap is shown in Figure 1A. The supplemented lambs and growing sheep clustered distinctly into two groups compared to their non-supplemented counterparts, indicating that supplementation does indeed impact gene expression. To analyze the genetic differences in muscle growth associated with supplementation in Oula sheep, we identified DEGs between the supplemented and non-supplemented groups at different stages. A total of 138 unique DEGs were identified in the LS (lamb supply) vs. LUS (lamb un-supply) comparison, and 122 unique DEGs were found in the GS (growth supply) vs. GUS (growth un-supply) comparison (Figure 1B). Overall, there were 1369 DEGs in the LS vs. LUS comparison, with 1109 upregulated and 260 downregulated genes. In the GS vs. GUS comparison, there were 589 DEGs, comprising 329 upregulated genes and 260 downregulated genes (Figure 1C,D).

3.2. GO and KEGG Enrichment Analysis of DEGs

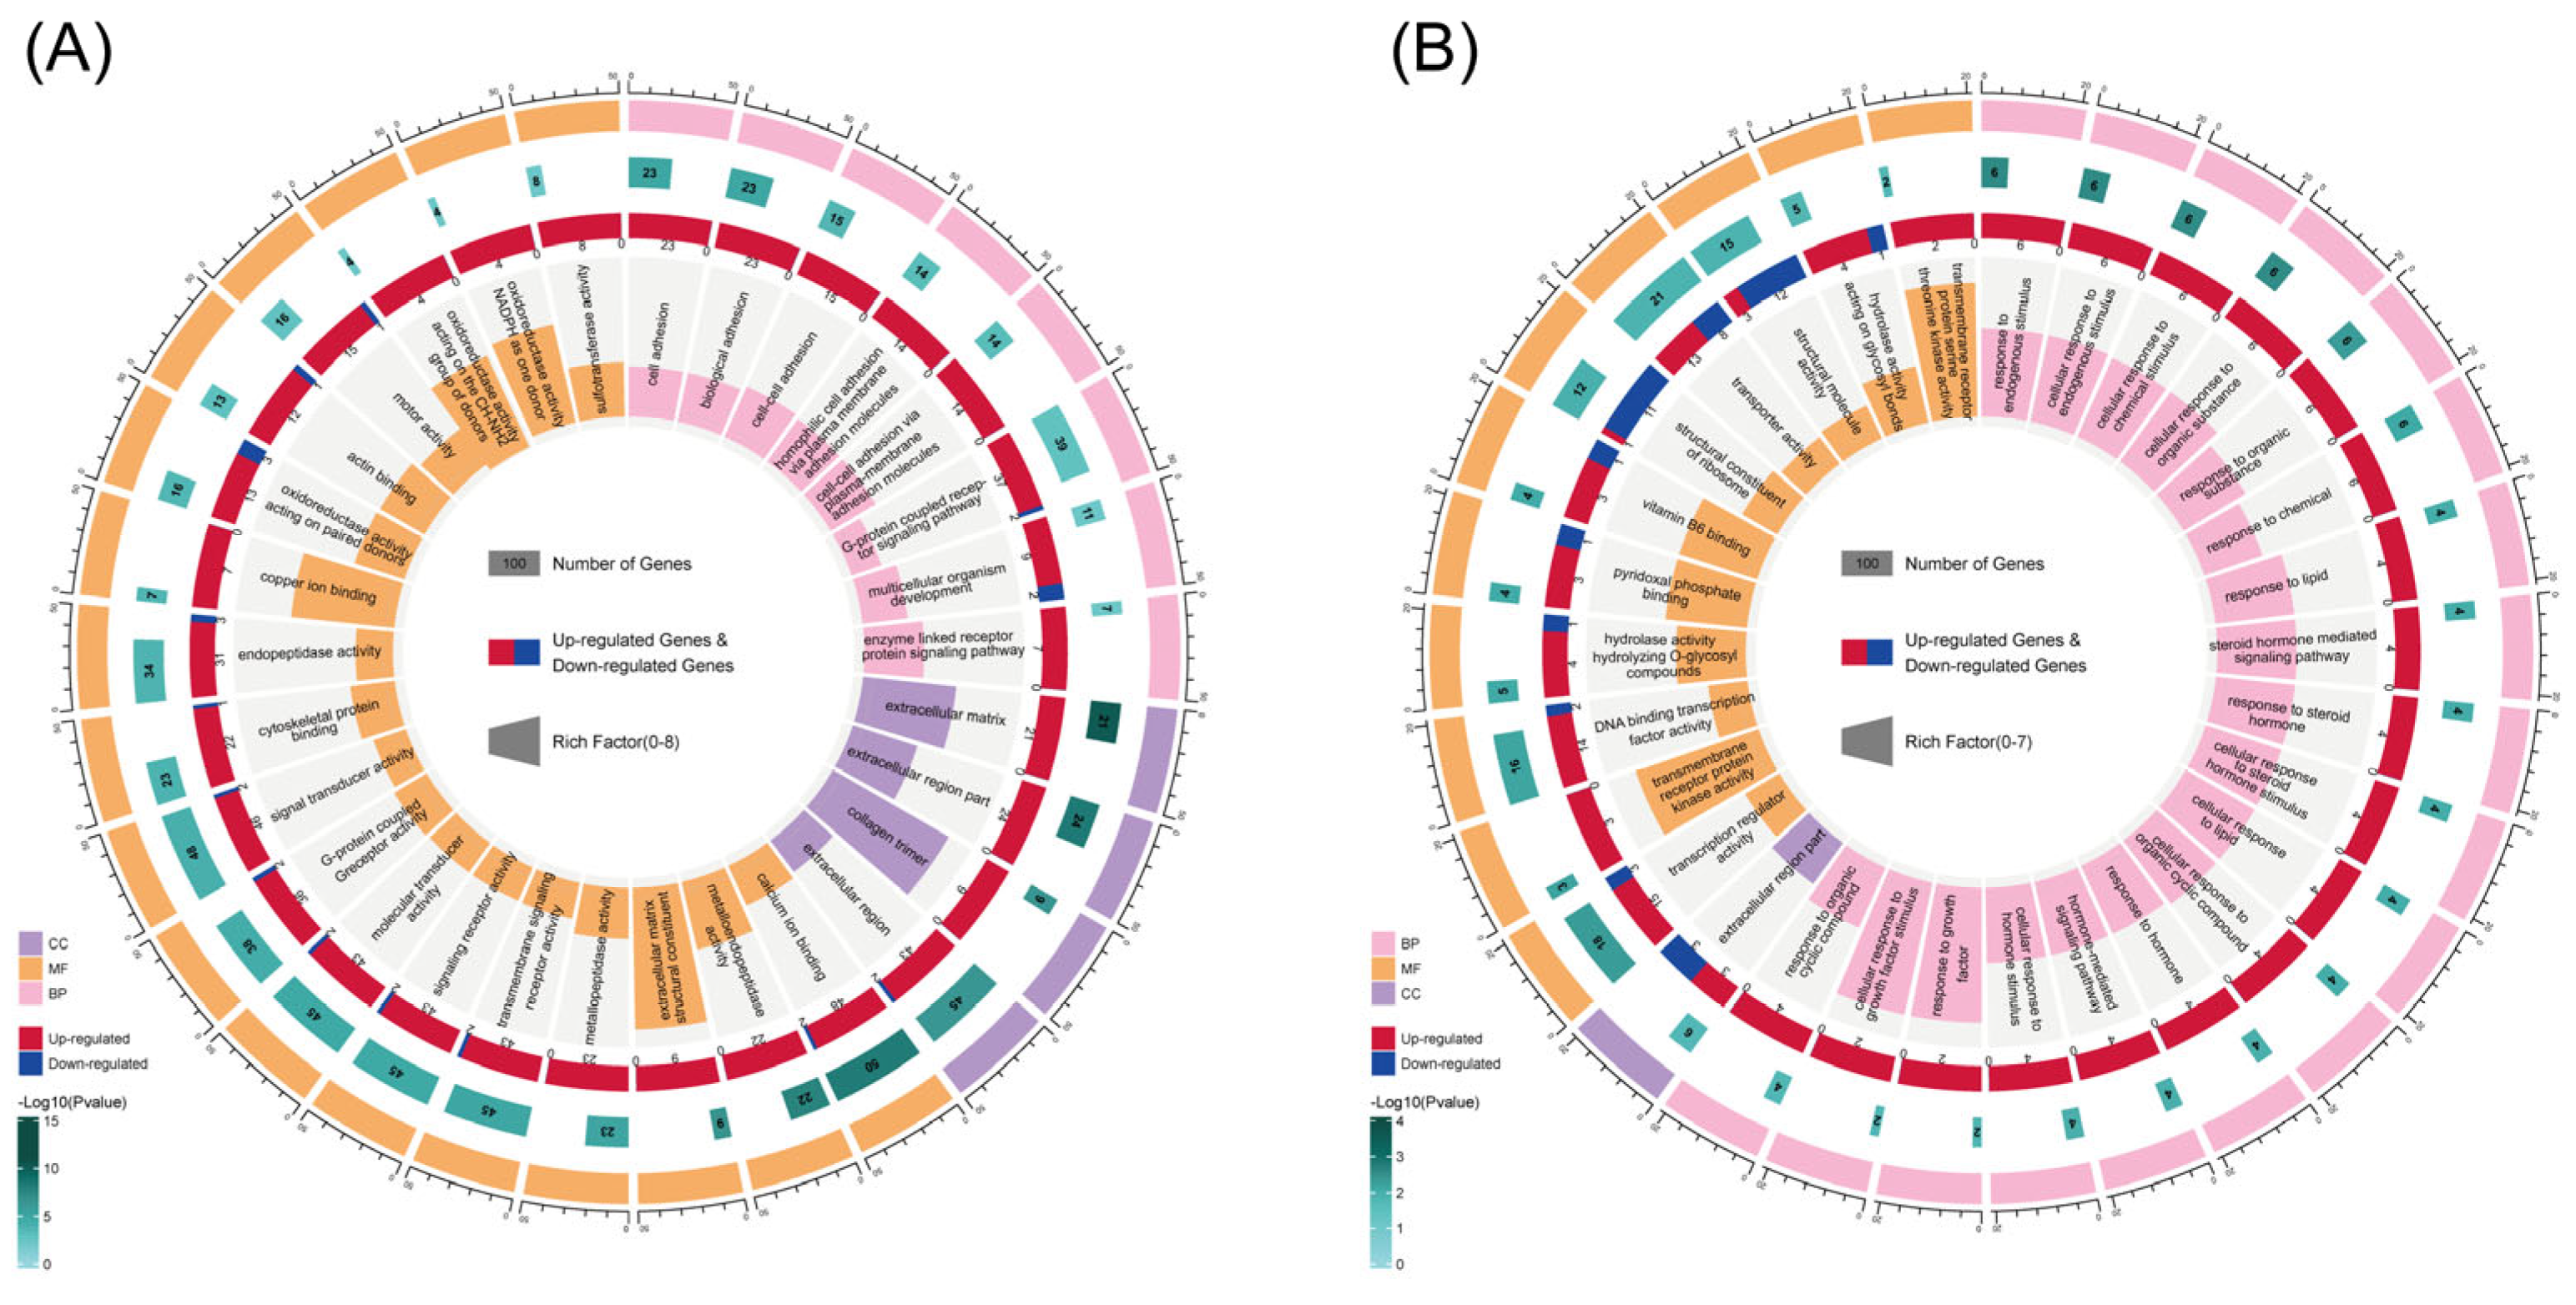
The DEGs in the LS vs. LUS comparison underwent GO functional annotation, resulting in a total of 717 GO terms, with 75 of these being significantly enriched. The significant GO terms were primarily concentrated in categories related to the extracellular matrix and signaling pathways. Figure 2A displays the top 30 most significant GO terms, which include extracellular matrix, extracellular matrix structural constituent, collagen trimer, copper ion binding, oxidoreductase activity (acting on the CH-NH2 group of donors), and oxidoreductase activity (acting on paired donors with the incorporation or reduction in molecular oxygen, where NAD(P)H serves as one donor and incorporates one atom of oxygen). These terms may play critical roles in regulating muscle development following supplementation during the lamb stage.
In the GS vs. GUS comparison, the DEGs were also subjected to GO functional annotation, revealing a high enrichment of terms such as transmembrane receptor protein kinase activity, response to growth factor, cellular response to growth factor stimulus, and transmembrane receptor protein serine/threonine kinase activity. These findings suggest that these terms may play significant regulatory roles in muscle growth and development during the growing stage of Oula sheep. Additionally, the DEGs were significantly enriched in functions related to carbohydrate and lipid metabolism, including hydrolase activity (hydrolyzing O-glycosyl compounds), response to lipid, cellular response to lipid, and hydrolase activity (acting on glycosyl bonds) (Figure 2B).
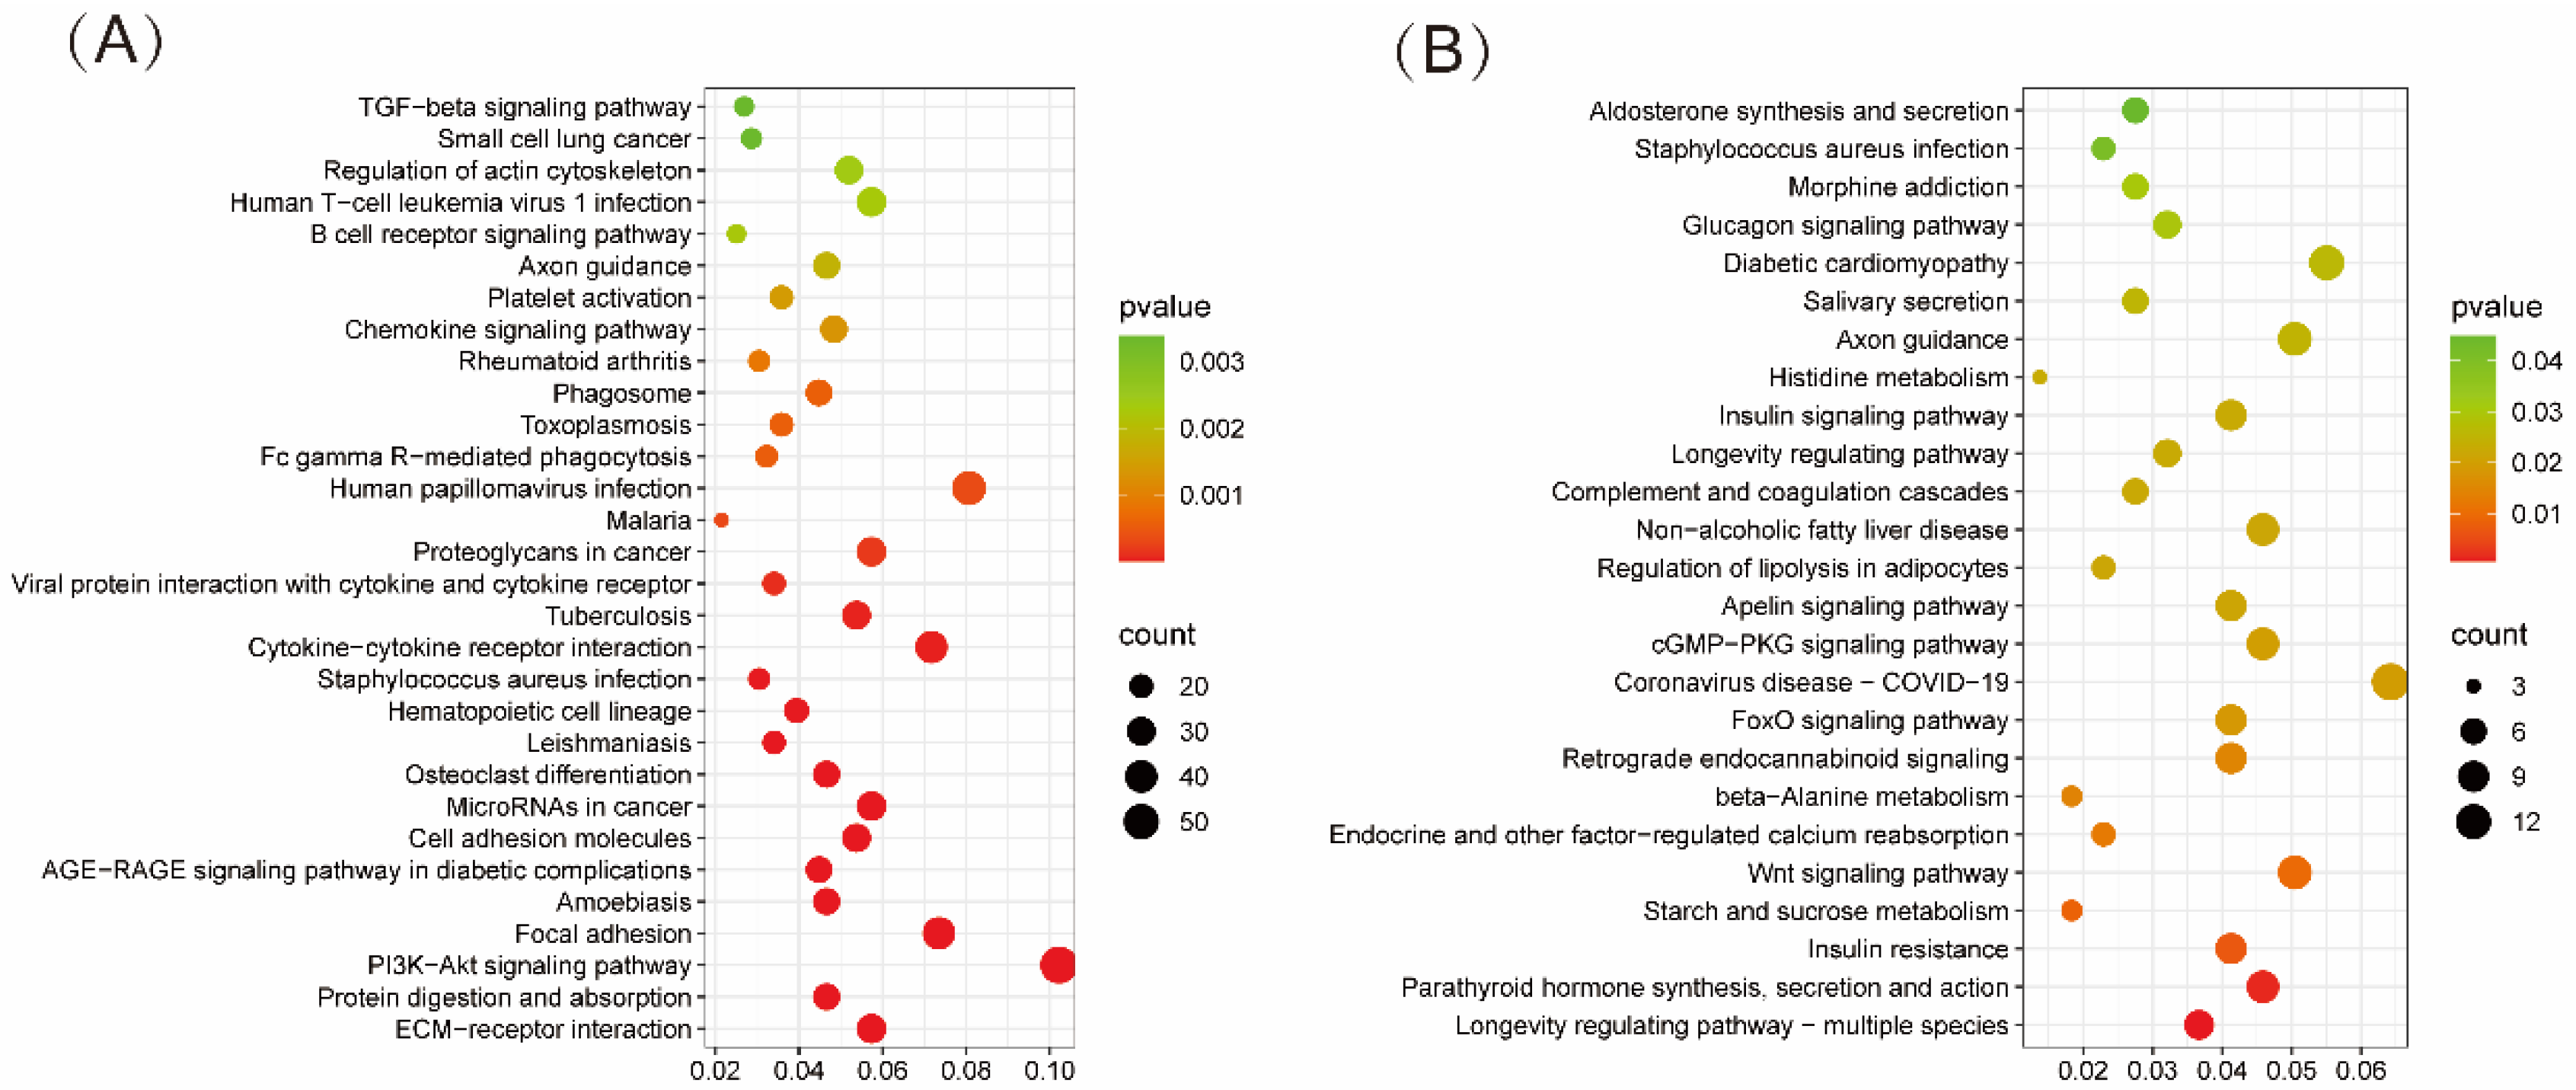
KEGG enrichment analysis aids in further elucidating the potential functions of DEGs and the signaling pathways they participate in. The results indicate that DEGs in the LS vs. LUS comparison are significantly enriched in the PI3K-Akt signaling pathway (p = 1.73 × 10⁻⁸), which encompasses 57 DEGs closely related to the signaling and metabolic regulation of muscle cells. Notably, AKT plays a critical role in glucose metabolism, and its downstream effector molecule, mTOR, promotes cell proliferation and metabolism, being associated with protein synthesis. Additionally, pathways such as Protein digestion and absorption and ECM-receptor interaction were also significantly enriched (Figure 3A).
In the GS vs. GUS comparison, DEGs were primarily enriched in pathways related to starch and sucrose metabolism, beta-Alanine metabolism, regulation of lipolysis in adipocytes, insulin signaling pathway, and Histidine metabolism. These pathways are predominantly associated with the metabolism of nutrients and hormonal regulation (Figure 3B).

3.3. WGCNA Co-Expression Module

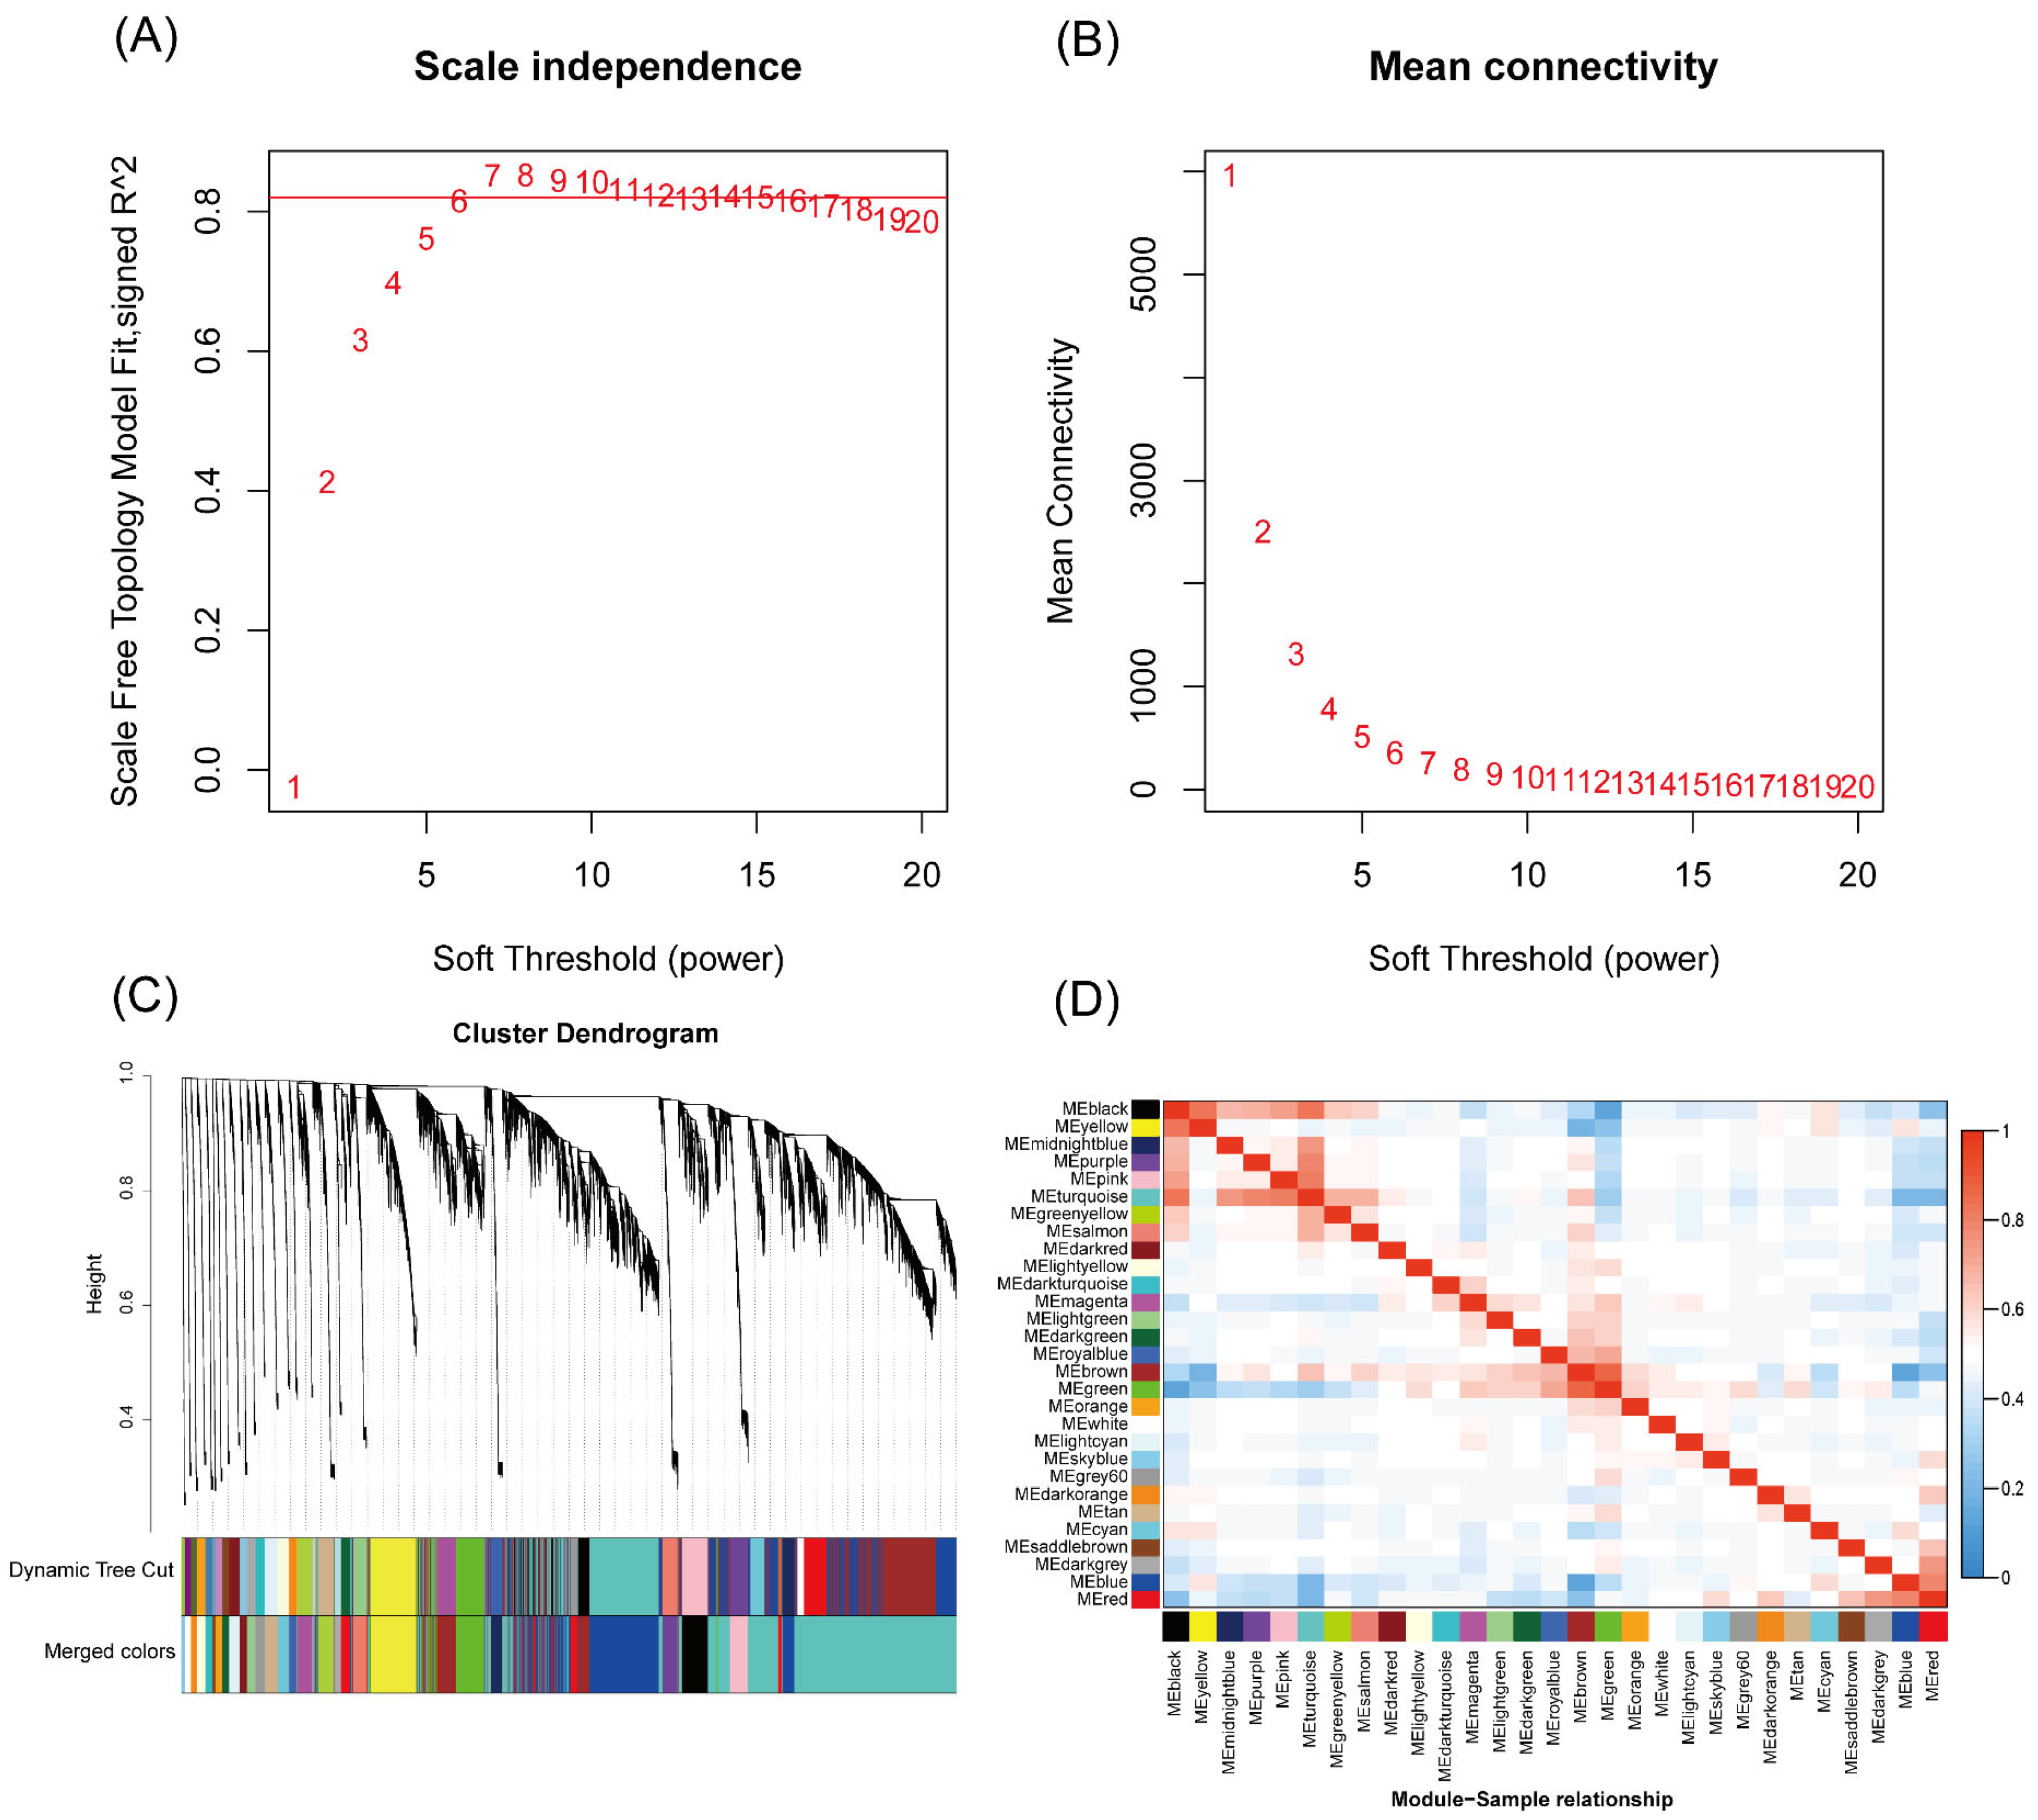
Based on the scale-free fit index results, a soft threshold of β = 8 was selected, corresponding to the first value with R2 ≥ 0.8 (Figure 4A,B). Hierarchical clustering of the DEGs was performed using the dissimilarity between genes. Different modules were identified through dynamic cutting, and modules with a correlation coefficient greater than 0.75 were merged, resulting in a total of 30 modules (Figure 4C). Correlation analysis among the modules revealed that MEbrown and MEgreen exhibited relatively high correlations with other modules (Figure 4D).

3.4. Construction of Gene Co-Expression Network and Screening of Hub Genes

To identify hub genes during the lamb and growing periods, we intersected the genes from the MEbrown and MEgreen modules with the DEGs from the LS vs. LUS and GS vs. GUS comparisons. This process allowed us to filter out genes that were significantly differentially expressed in both LS vs. LUS and GS vs. GUS and were present in the MEbrown and MEgreen modules. The resulting gene interaction network is presented in Figure 5.
During the lamb stage, CD4 and ICAM1 emerged as hub genes (Figure 5A). CD4 primarily functions within the immune system, and ICAM1 is associated with cell adhesion and signaling. In the growing stage, the top-ranking genes included AGL, PGM2L1, PRKAA2, PRKACB, AR, and NEDD4, along with ERBB4 and GBE1 (Figure 5B). The enzyme encoded by the AGL gene is involved in glycogen metabolism, the protein encoded by PGM2L1 is related to glucose metabolism. PRKAA2 regulates energy balance, and PRKACB plays a role in cellular signaling. AR is associated with hormonal signaling, and NEDD4 participates in the ubiquitination of proteins, whereas GBE1 is involved in starch and sucrose metabolism. Most of these genes are linked to nutrient metabolism and may regulate muscle growth and development through the metabolism and absorption of nutrients.

3.5. qPCR Validation

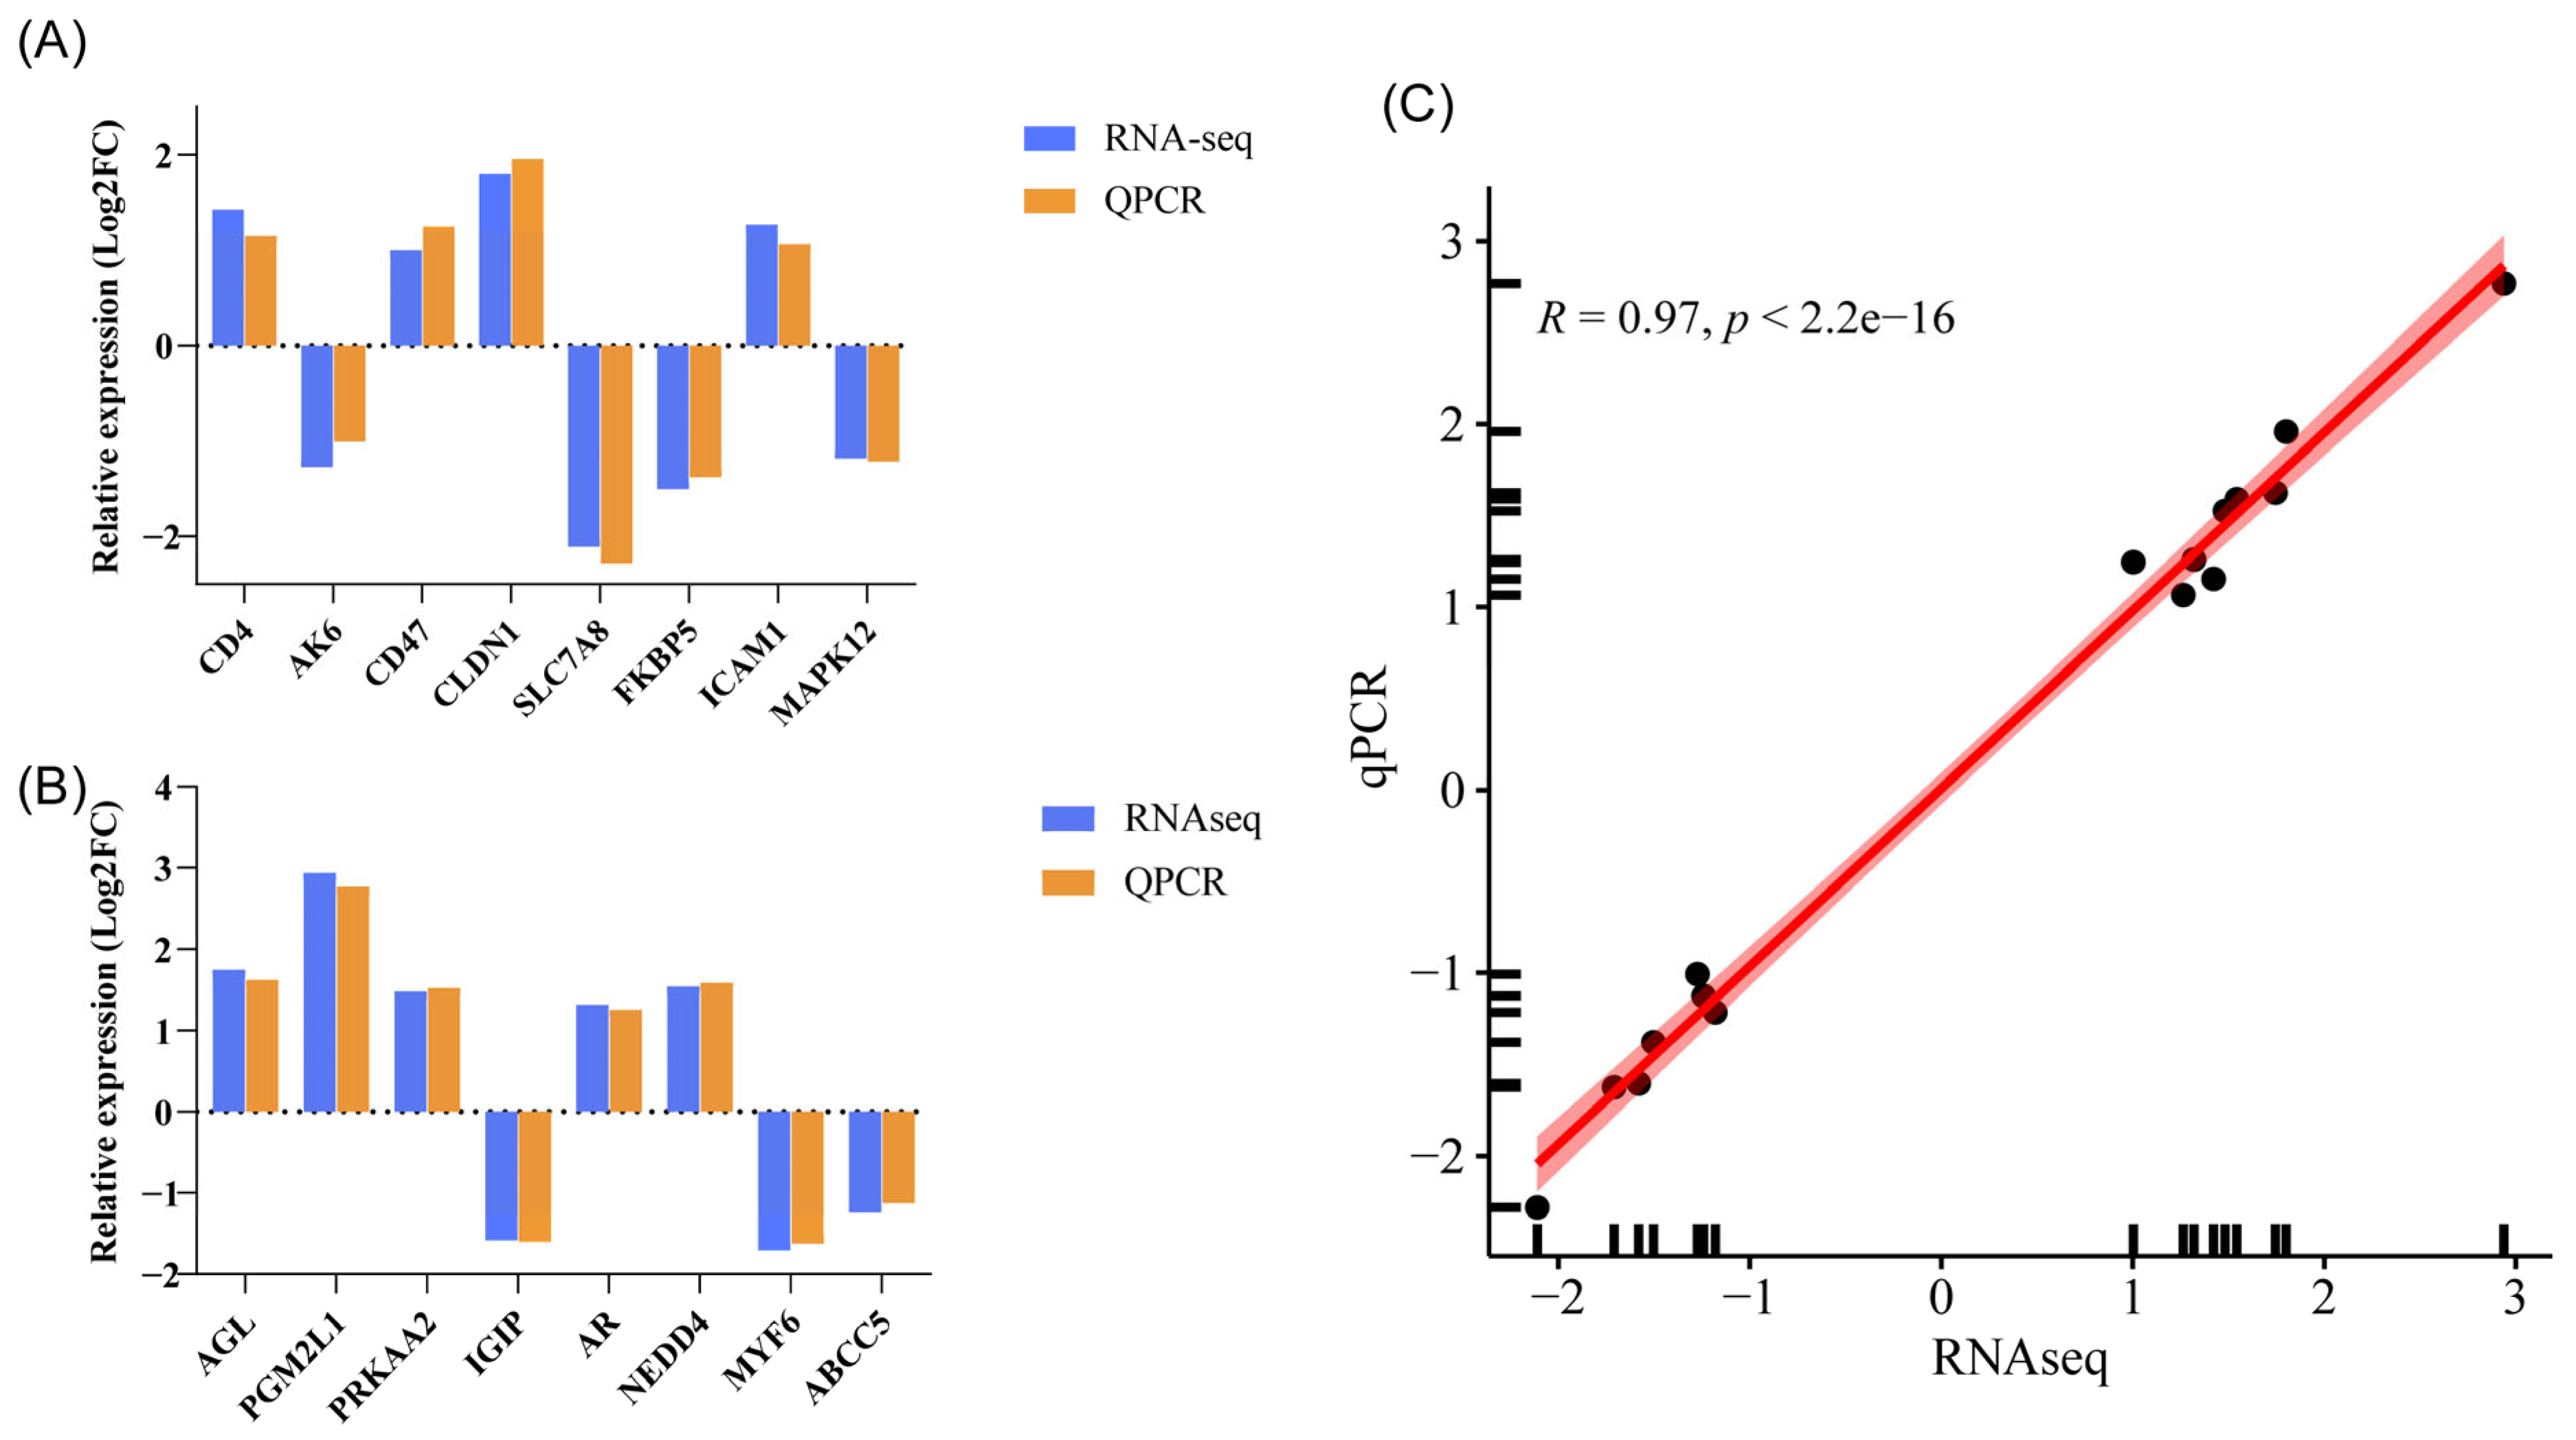
Eight DEGs from both the LS vs. LUS and GS vs. GUS comparisons were selected for qPCR validation to assess their relative expression levels. The results were consistent with the transcriptome data (Figure 6).

4. Discussion

Muscle growth is a critical factor influencing animal production performance. After birth, the development of muscle primarily involves increases in the diameter and length of muscle fibers, while the number of muscle fibers remains constant. CD4, ICAM1, CD47, and CLDN1 are significantly differentially expressed genes identified in the LS vs. LUS comparison, all of which are related to signaling transduction. CD4 is a glycoprotein that plays a role in recognizing antigens presented to T cell receptors and serves as a co-receptor expressed by T cells [13]. ICAM1 is an adhesion molecule involved in inflammatory responses and the migration of immune cells; silencing this gene has been shown to alter the expression levels and concentrations of transcripts and metabolites associated with glycolysis [14]. Additionally, GO functions such as extracellular matrix and oxidoreductase activity, along with KEGG signaling pathways including ECM-receptor interaction, Protein digestion and absorption, and the PI3K-Akt signaling pathway, were significantly enriched. The PI3K-Akt signaling pathway is one of the crucial intracellular signaling pathways that enhances glucose utilization [15] and promotes glycogenolysis in the liver [16]. Furthermore, it can stimulate downstream mTOR effector molecules to facilitate cell proliferation and metabolism [17] while also playing a regulatory role in immune responses [18]. These findings suggest that supplementation during the lamb period can enhance the body’s immune response and the absorption utilization of nutrients such as glycogen, thereby promoting the growth and development of skeletal muscle. In this context, the CD4 and ICAM1 genes, along with the PI3K-Akt signaling pathway, may play key roles.
Previous research has shown that skeletal muscle fiber types can be categorized into slow-twitch oxidative (Type I), fast-twitch oxidative (Type IIa), and fast-twitch glycolytic (Type IIb) fibers. Muscles with a higher proportion of Type IIb fibers exhibit faster growth rates than those dominated by the other two fiber types [19]. In this study, we identified the genes AGL, PGM2L1, and PRKAA2 during the growth phase of Oula sheep, all of which are directly involved in or indirectly regulate processes related to carbohydrate metabolism. AGL (Amylo-alpha-1,6-glucosidase, 4-alpha-glucanotransferase) is a multifunctional enzyme that plays a crucial role in glycolysis, encoding glycogen debranching enzyme (GDE) [20,21]. Complete or partial deficiency or mutation of AGL leads to autosomal recessive glycogen metabolism disorders, known as Type III glycogen storage disease [22,23]. PGM2L1 (Phosphoglucomutase 2 like 1) catalyzes various phosphotransferase reactions, including those involving (deoxy)ribose-1-phosphate and glucose-1-phosphate, contributing to the formation of intermediates such as 1,6-bisphosphate glucose [24], 1,6-bisphosphate mannose, and ribose-1,5-bisphosphate [25]. Notably, 1,6-bisphosphate glucose is directly involved in glycolysis, while ribose-1,5-bisphosphate can regulate the activity of phosphofructokinase, and 1,6-bisphosphate mannose may serve as a metabolic regulator [26]. These compounds are significantly linked to metabolic regulation, particularly carbohydrate metabolism. PRKAA2 (protein kinase AMP-activated alpha 2 subunit) encodes a catalytic subunit of AMPK, which regulates glycolysis by enhancing glucose uptake and promoting glycolytic pathways to generate more ATP [27]. Yang et al. also reported that AMPK activation can upregulate glycolysis [28]. Furthermore, studies have indicated that PRKAA2 may play a regulatory role in the immune response, metabolism, and nutrient absorption in sheep, potentially influencing their growth performance [29]. This research highlights the critical role of these genes in the metabolic processes that underpin muscle growth and development in sheep, providing valuable insights for improving livestock production efficiency.
Additionally, the DEGs identified in the comparison between GS and GUS were significantly enriched in several metabolic pathways related to nutrient utilization, including starch and sucrose metabolism, Beta-Alanine Metabolism, Histidine Metabolism, Regulation of Lipolysis in Adipocytes, and the insulin signaling pathway. In the starch and sucrose metabolism pathway, four annotated DEGs were identified: AGL, PGM2L1, GBE1, and GAA. The insulin signaling pathway showed significant enrichment with nine differentially expressed genes, among which are the hub genes PRKAA2 and PRKACB. The starch and sucrose metabolism pathway involves the initial breakdown of disaccharides and polysaccharides into smaller molecules such as maltose, fructose, and glucose during digestion. Subsequently, glucose is further broken down through glycolysis to provide energy. When the glucose levels in the body rise, insulin secretion is upregulated as a regulatory response. Insulin is a key factor in glucose metabolism and lipid homeostasis, playing a critical role in glucose uptake and peripheral glucose regulation [30]. Furthermore, research has indicated a connection between insulin and longevity regulation [31]. The Longevity Regulating Pathway—Multiple Species was the most significantly enriched pathway identified in the KEGG analysis. This interconnectedness of the enriched KEGG signaling pathways aligns with the functional roles of the identified hub genes, most of which are associated with carbohydrate metabolism. These findings suggest that core genes such as AGL, PGM2L1, PRKAA2, NEDD4, and GBE1 may function through pathways like starch and sucrose metabolism and the insulin signaling pathway to regulate skeletal muscle growth and development in Oula sheep following supplementation. These insights enhance our understanding of the molecular mechanisms underlying nutrient metabolism and muscle development, providing potential targets for improving livestock growth performance.
In summary, this study investigated the regulatory mechanisms underlying the effects of supplemental feeding on skeletal muscle growth and development in Oula sheep at different ages through mRNA expression profiling. The findings provide new insights into alleviating the slow growth of Tibetan sheep during winter in high-altitude regions, thereby contributing to the development of feed-efficient Tibetan sheep breeds. However, our research remains limited to the transcriptomic level. Further validation of the identified genes is necessary to screen for core genes regulating skeletal muscle development. Moreover, focusing solely on the genetic level is insufficient; studies at the protein expression level would serve as an important complement. There is a need to integrate genomic and proteomic analyses to comprehensively explore the impact of glycolytic differences on muscle development in Tibetan sheep.

5. Conclusions

This study investigated the changes in multiple genes related to muscle growth in Oula sheep under supplemented and non-supplemented conditions at different ages, as well as the potential regulatory mechanisms involved. It was found that during the lamb stage, CD4 and ICAM1 may enhance the immune response and regulate carbohydrate metabolism through a series of interactions, with the PI3K-Akt signaling pathway potentially playing a critical role in this process. In the growth phase, the genes AGL, PGM2L1, PRKAA2, NEDD4, and GBE1 may function as core genes that regulate muscle growth and development in Oula sheep through signaling pathways such as starch and sucrose metabolism and the insulin signaling pathway.

Author Contributions

Conceptualization, Y.L., Y.W., M.Y., S.W. and M.L.; Formal analysis, Y.L., Y.W., M.Y. and M.L.; Funding acquisition, S.W.; Investigation, Y.L., S.W. and S.H.A.R.; Methodology, Y.L., Y.W., M.Y. and M.L.; Project administration, S.W.; Resources, S.W.; Software, Y.L., Y.W., M.Y. and M.L.; Supervision, S.W.; Validation, Y.L., Y.W., M.Y. and S.H.A.R.; Visualization, S.H.A.R.; Writing—original draft, Y.L., Y.W. and M.Y.; Writing—review and editing, Y.L., Y.W. and S.H.A.R. All authors have read and agreed to the published version of the manuscript.

Funding

This study was supported by the Qinghai Province Major Science and Technology Special Project: Mining and Innovative Utilization of Genetic Resources of Yak and Tibetan Sheep (2021-NK-A5).

Institutional Review Board Statement

This trial was conducted with the approval of Qinghai Academy of Animal Husbandry and Veterinary Science (2025-QHMKY-008).

Informed Consent Statement

Written informed consent was obtained from the owner of the animals involved in this study.

Data Availability Statement

All data generated or analyzed during this study are included in this published article.

Conflicts of Interest

The authors declare no competing interests.

References

  1. Zhao, Y.; Zhang, Y.; Yu, R.; Wu, Y.; Chen, Y.; Zhao, R.; Zhang, C.; Su, J. Single Base Editing System Mediates Site-Directed Mutagenesis of Genes GDF9 and FecB in Ouler Tibetan Sheep. Sheng Wu Gong Cheng Xue Bao Chin. J. Biotechnol. 2023, 39, 204–216. [Google Scholar] [CrossRef]
  2. Shi, X.; Li, J.; Chen, J.; Tian, Z.; Chen, C.; Yu, Q. Concentrations of HSP27 and Aβ-crystallin in Oula Tibetan Sheep Meat and Their Relationship with Meat Quality during Postmortem Aging. J. Food Sci. 2021, 86, 5253–5261. [Google Scholar] [CrossRef]
  3. Chen, S.-L.; Wu, C.-C.; Li, N.; Weng, T.-H. Post-Transcriptional Regulation of Myogenic Transcription Factors during Muscle Development and Pathogenesis. J. Muscle Res. Cell Motil. 2024, 45, 21–39. [Google Scholar] [CrossRef]
  4. Hadjiargyrou, M. Mustn1: A Developmentally Regulated Pan-Musculoskeletal Cell Marker and Regulatory Gene. Int. J. Mol. Sci. 2018, 19, 206. [Google Scholar] [CrossRef]
  5. Zhao, X.; Ye, J.; Lin, X.; Xue, H.; Zou, X.; Liu, G.; Deng, M.; Sun, B.; Guo, Y.; Liu, D.; et al. Identification of Key Functional Genes and LncRNAs Influencing Muscle Growth and Development in Leizhou Black Goats. Genes 2023, 14, 881. [Google Scholar] [CrossRef]
  6. Ye, Y.; Wu, G.; Wang, H.; Duan, M.; Shang, P.; Chamba, Y. The Role of the MYL4 Gene in Porcine Muscle Development and Its Molecular Regulatory Mechanisms. Animals 2024, 14, 1370. [Google Scholar] [CrossRef]
  7. Song, Y.; Zhang, Q.; Shi, J.; Fu, L.; Cheng, S. Screening of Genes Related to Growth, Development and Meat Quality of Sahan Crossbred F1 Sheep Based on RNA-Seq Technology. Front. Vet. Sci. 2022, 9, 831519. [Google Scholar] [CrossRef] [PubMed]
  8. Li, J.; Chen, Z.; Bai, Y.; Wei, Y.; Guo, D.; Liu, Z.; Niu, Y.; Shi, B.; Zhang, X.; Cai, Y.; et al. Integration of ATAC-Seq and RNA-Seq Analysis to Identify Key Genes in the Longissimus Dorsi Muscle Development of the Tianzhu White Yak. Int. J. Mol. Sci. 2023, 25, 158. [Google Scholar] [CrossRef] [PubMed]
  9. Wei, Y.; Guo, D.; Bai, Y.; Liu, Z.; Li, J.; Chen, Z.; Shi, B.; Zhao, Z.; Hu, J.; Han, X.; et al. Transcriptome Analysis of mRNA and lncRNA Related to Muscle Growth and Development in Gannan Yak and Jeryak. Int. J. Mol. Sci. 2023, 24, 16991. [Google Scholar] [CrossRef] [PubMed]
  10. Wang, J.; Li, B.; Yang, X.; Liang, C.; Raza, S.H.A.; Pan, Y.; Zhang, K.; Zan, L. Integration of RNA-Seq and ATAC-Seq Identifies Muscle-Regulated Hub Genes in Cattle. Front. Vet. Sci. 2022, 9, 925590. [Google Scholar] [CrossRef]
  11. Ye, J.; Zhao, X.; Xue, H.; Zou, X.; Liu, G.; Deng, M.; Sun, B.; Guo, Y.; Liu, D.; Li, Y. RNA-Seq Reveals miRNA and mRNA Co-Regulate Muscle Differentiation in Fetal Leizhou Goats. Front. Vet. Sci. 2022, 9, 829769. [Google Scholar] [CrossRef]
  12. Bao, G.; Li, S.; Zhao, F.; Wang, J.; Liu, X.; Hu, J.; Shi, B.; Wen, Y.; Zhao, L.; Luo, Y. Comprehensive Transcriptome Analysis Reveals the Role of lncRNA in Fatty Acid Metabolism in the Longissimus Thoracis Muscle of Tibetan Sheep at Different Ages. Front. Nutr. 2022, 9, 847077. [Google Scholar] [CrossRef]
  13. Janakiraman, M.; Na, S.-Y.; Krishnamoorthy, G. A Novel CD4 Knockout Mouse Strain with a Spontaneous Frameshift Mutation in the CD4 Locus. PLoS ONE 2022, 17, e0266589. [Google Scholar] [CrossRef]
  14. Zhang, Y.; Willis-Owen, S.A.G.; Spiegel, S.; Lloyd, C.M.; Moffatt, M.F.; Cookson, W.O.C.M. The ORMDL3 Asthma Gene Regulates ICAM1 and Has Multiple Effects on Cellular Inflammation. Am. J. Respir. Crit. Care Med. 2019, 199, 478–488. [Google Scholar] [CrossRef]
  15. Li, S.; Fu, Y.; Wang, W.; Qiu, J.; Huang, Y.; Li, X.; Yang, K.; Yu, X.; Ma, Y.; Zhang, Y.; et al. Olanzapine Induces Adipogenesis and Glucose Uptake by Activating Glycolysis and Synergizing with the PI3K-AKT Pathway. Curr. Neuropharmacol. 2024, 23, 412–425. [Google Scholar] [CrossRef]
  16. Pitaloka, D.M.I.; Ko, C.-H.; Lin, M.-T.; Yeh, S.-L.; Yeh, C.-L. Glutamine Administration Promotes Hepatic Glucose Homeostasis through Regulating the PI3K/Akt Pathway in High-Fat Diet-Induced Obese Mice with Limb Ischemia. Nutr. Res. 2019, 68, 45–53. [Google Scholar] [CrossRef] [PubMed]
  17. Zhang, Y.; Xu, D.; Song, S.; Wang, G.; Su, H.; Wu, Y.; Zhang, Y.; Liu, H.; Li, Q.; Wang, X.; et al. AKT/mTOR-Mediated Autophagic Signaling Is Associated with TCDD-Induced Cleft Palate. Reprod. Toxicol. 2024, 130, 108731. [Google Scholar] [CrossRef]
  18. Zhang, B.-T.; Leung, P.-C.; Wong, C.-K.; Wang, D.-J. The Immunomodulatory Effects of Vitamin D on COVID-19 Induced Glioblastoma Recurrence via the PI3K-AKT Signaling Pathway. Int. J. Mol. Sci. 2024, 25, 12952. [Google Scholar] [CrossRef] [PubMed]
  19. Oksbjerg, N.; Therkildsen, M. Chapter 3—Myogenesis and Muscle Growth and Meat Quality. In New Aspects of Meat Quality; Woodhead Publishing Series in Food Science, Technology and Nutrition; Purslow, P.P., Ed.; Woodhead Publishing: Cambridge, UK, 2017; pp. 33–62. ISBN 978-0-08-100593-4. [Google Scholar]
  20. Herszberg, B.; Mata, X.; Giulotto, E.; Decaunes, P.; Piras, F.M.; Chowdhary, B.P.; Chaffaux, S.; Guérin, G. Characterization of the Equine Glycogen Debranching Enzyme Gene (AGL): Genomic and cDNA Structure, Localization, Polymorphism and Expression. Gene 2007, 404, 1–9. [Google Scholar] [CrossRef]
  21. Zimmermann, A.; Rossmann, H.; Bucerzan, S.; Grigorescu-Sido, P. A Novel Nonsense Mutation of the AGL Gene in a Romanian Patient with Glycogen Storage Disease Type IIIa. Case Rep. Genet. 2016, 2016, 8154910. [Google Scholar] [CrossRef] [PubMed]
  22. Anushiravani, A.; Faghihi, M.A.; Dastsooz, H.; Lankarani, K.B. Glycogen Storage Disease IIIa: A Private Homozygous Splice Site Mutation in AGL Gene. Gene Rep. 2017, 9, 61–64. [Google Scholar] [CrossRef]
  23. Lucchiari, S.; Donati, M.a.; Melis, D.; Filocamo, M.; Parini, R.; Bresolin, N.; Comi, G.p. Mutational Analysis of the AGL Gene: Five Novel Mutations in GSD III Patients. Hum. Mutat. 2003, 22, 337. [Google Scholar] [CrossRef]
  24. Morava, E.; Schatz, U.A.; Torring, P.M.; Abbott, M.-A.; Baumann, M.; Brasch-Andersen, C.; Chevalier, N.; Dunkhase-Heinl, U.; Fleger, M.; Haack, T.B.; et al. Impaired Glucose-1,6-Biphosphate Production Due to Bi-Allelic PGM2L1 Mutations Is Associated with a Neurodevelopmental Disorder. Am. J. Hum. Genet. 2021, 108, 1151–1160. [Google Scholar] [CrossRef]
  25. Maliekal, P.; Sokolova, T.; Vertommen, D.; Veiga-da-Cunha, M.; Van Schaftingen, E. Molecular Identification of Mammalian Phosphopentomutase and Glucose-1,6-Bisphosphate Synthase, Two Members of the α-D-Phosphohexomutase Family*. J. Biol. Chem. 2007, 282, 31844–31851. [Google Scholar] [CrossRef]
  26. Safari, M.S.; Woerl, P.; Garmsiri, C.; Weber, D.; Kwiatkowski, M.; Hotze, M.; Kuenkel, L.; Lang, L.; Erlacher, M.; Gelpi, E.; et al. Glucose-1,6-Bisphosphate: A New Gatekeeper of Cerebral Mitochondrial Pyruvate Uptake. Mol. Metab. 2024, 88, 102018. [Google Scholar] [CrossRef]
  27. Bai, X.; Lu, H.; Cui, Y.; Yu, S.; Ma, R.; Yang, S.; He, J. PRKAA2-Mediated Mitophagy Regulates Oxygen Consumption in Yak Renal Tubular Epithelial Cells under Chronic Hypoxia. Cell. Signal. 2024, 124, 111450. [Google Scholar] [CrossRef]
  28. Yang, Y.; Han, L.; Yu, Q.; Gao, Y.; Song, R. Study of the AMP-Activated Protein Kinase Role in Energy Metabolism Changes during the Postmortem Aging of Yak Longissimus Dorsal. Animals 2020, 10, 427. [Google Scholar] [CrossRef]
  29. Li, W.; Wang, X.; Zhang, X.; Li, F.; Zhang, D.; Li, X.; Zhang, Y.; Zhao, Y.; Zhao, L.; Xu, D.; et al. Polymorphism of Sheep PRKAA2 Gene and Its Association with Growth Traits. Anim. Biotechnol. 2023, 34, 1324–1330. [Google Scholar] [CrossRef] [PubMed]
  30. Todorovic, S.; Simeunovic, V.; Prvulovic, M.; Dakic, T.; Jevdjovic, T.; Sokanovic, S.; Kanazir, S.; Mladenovic, A. Dietary Restriction Alters Insulin Signaling Pathway in the Brain. BioFactors 2024, 50, 450–466. [Google Scholar] [CrossRef] [PubMed]
  31. Lennicke, C.; Cochemé, H.M. Redox Regulation of the Insulin Signalling Pathway. Redox Biol. 2021, 42, 101964. [Google Scholar] [CrossRef] [PubMed]
Figure 1. Analysis of differentially expressed genes with gene FPKM value. (A) gene expression cluster heat map. (B) differential expression gene Venn map. Yellow: the DEGs of LS Group vs. LUS Group; Light purple: the DEGs of GS Group vs. GUS Group. (C) LS vs. LUS DEGs volcano map. Green: the Downregulated DEGs; Red: the Upregulated DEGs. (D) GS vs. GUS DEGs volcano map. Green: the Downregulated DEGs; Red: the Upregulated DEGs.
Animals 15 02626 g001
Figure 2. GO enrichment circle of differentially expressed genes. (A) LS vs. LUS DEGs GO enrichment. (B) GS vs. GUS DEGs GO enrichment. The 3 major functional categories of GO annotations—CC (Cellular Component), BP (Biological Process), and MF (Molecular Function)—are represented by purple, yellow, and pink in the outermost and innermost rings, respectively. The second layer from the right inward displays a heatmap with numerical labels indicating the significance level of each function (−Log10 (p-value)). The third layer displays Upregulated-DEGs and Downregulated-DEGs within that function, along with their respective counts, using red and blue colors and corresponding numerical values. The innermost bar chart indicates the total number of DEGs annotated with that GO functional category.
Animals 15 02626 g002
Figure 3. KEGG enrichment bubble plot. (A) KEGG enrichment of DEGs in the LS vs. LUS. (B) KEGG enrichment of DEGs in the GS vs. GUS. “count” represents the number of DEGs, the X-axis represents “GeneRatio”, and the Y-axis is sorted according to “p-value”.
Animals 15 02626 g003
Figure 4. Scale-free fit index and average connectivity from WGCNA. (A) Soft threshold and cor-relation coefficient, where the x-axis represents the soft threshold (power value, β) and the y-axis shows the correlation between connectivity (k) and the probability (p(k)). The red line indicates the soft threshold and corresponding correlation coefficient for this study. (B) Soft threshold versus average connectivity of the network. (C) Hierarchical clustering dendrogram of modules. (D) Heatmap of correlations between modules.
Animals 15 02626 g004
Figure 5. Common gene PPI network. The darker the color, the higher the core degree of the gene in the PPI network. (A) Intersection of significantly differentially expressed genes from the LS vs. LUS comparison with genes from the brown and green modules. CD4 and ICAM1 may be the hub gene in LS vs. LUS. (B) Intersection of significantly differentially expressed genes from the GS vs. GUS comparison with genes from the brown and green modules. AGL (Amylo-alpha-1, 6-glucosidase, 4-alpha-glucanotransferase), PRKACB (Protein kinase cAMP-activated catalytic subunit beta; Belongs to the protein kinase superfamily), PRKAA2 (Non-specific serine/threonine protein kinase), AR (Androgen receptor), NEDD4 (E3 ubiquitin-protein ligase), PGM2L1 (Phosphoglucomutase 2 like 1) may play a central regulatory role in the GS vs. GUS process.
Animals 15 02626 g005
Figure 6. Verification of RNA-seq gene expression. (A) LS vs. LUS DEGs. (B) GS vs. GUS DEGs. (C) Correlation between RNA-seq and qPCR. A black dot represents a gene, and the red line indicates the linear fitting relationship between RNAseq and qPCR.
Animals 15 02626 g006
Table 1. Dietary composition and nutrient levels (dry matter basis).
IngredientsContents %Nutrient Levels (2)Contents %
Corn39.92CP15.09
Soybean meal12.99ME (MJ/kg)2.62
Wheat bran7.73Ca0.79
Rapeseed cake6.93TP0.4
Limestone1.42Lys0.67
Premix (1)1.01Met0.26
Dried corn stalk30.00NDF33.34
Total100.00ADF19.79
(1) The premix provided the following per kg of diets: Cu 18 mg, Fe 50 mg, Mn 15 mg, Zn 16 mg, I 0.36 mg, Se 0.56 mg, Co 0.08 mg, VA 2000 IU, VD 342 IU, VE 200 IU. (2) Nutrient levels were calculated values.
Table 2. Primer sequences used for qPCR.
GeneAccession No.Forward (5′ → 3′)Reverse (5′ → 3′)Tm/°CSize/bp
ACTBXM_060405599.1GTCAGCCGGTCCCATGGTCACACGGAGTACTTGCGCTC61.4102
CD4NM_001129902.1AACACTGAACTGAGCCATCGAGTACAGGTATAAGTCCCCGAGTCA61.1111
ICAM1NM_001009731.1GCAGTATCTCCTGTGACCGAAGTTTGAGTAGCACAACGGGT59.4141
CD47XM_060417299.1TGTCCAAGCCCAGCAGTAACTCCTACGACGGCATCACTCT60.3104
CLDN1NM_001185016.1AGTGACAACATCGTGACGGCTCAGCAAGGAGTCGAAGACTTT60.3106
SLC7A8XM_004010333.6AAGGTGTGCTAGAGAATGCCGGTGACCCCGAGCTCAGCATA61109
AK6NM_001285802.2GAATGGCCACTGCACAATCAATCCACCTCCTAGTCTAACAGC58.9106
FKBP5XM_042237057.2GAACGAGTTCGAGTCAGCCACTCGTTGTGCTCCTTAGCCT118118
AGLXM_012176992.4AATTACCCACTTCCTGGAGAAGCTGAAATGATCCAGCTTGTTGAAGAT59.8131
PGM2L1XM_042233221.2TTAGCCTTCGCCAGAACATCGTGGCCAGATGACACACAGAGAG61.4109
PRKAA2NM_001112816.1AGCACGATGTCCACTGGATGTCCAGCTGCTTCATAGCTCG60.0144
ARNM_001308584.1CAGCTGCTCCACCGATCTTAAAAGATGGTCGAACTGCCTCCTA60.5179
NEDD4XM_027971804.2CACTCAGGGTTTTGATGGCGCTGAGAAGCATCAATGGCCAAG59.7136
MYF6XM_060411574.1GAACCGGGATGTGCCCTGGTCCACGATGGAAGAGAGGC60.4184
IGIPXM_060415335.1AAGAAGCGCAGTGTGTCGGCAAGCCGGCTGATGCACAA61.3118
Table 3. RNA-seq sequencing data statistics.
SampleRaw Reads NumberClean Reads NumberClean Reads Rate (%)Clean Q30 Bases Rate (%)GC Content (%)Mapping Ratio (%)Unique Mapping Ratio (%)
LUS146,648,84442,782,07891.7193.4248.4593.8180.77
LUS242,687,70039,800,02893.2492.0850.7194.3083.45
LUS348,102,64647,210,96098.1593.0752.0395.9384.65
LUS449,855,83048,932,74098.1593.0552.0395.9384.65
LUS549,225,04847,874,61897.2693.5052.0595.8784.82
LS141,212,10438,519,37293.4791.9951.894.6483.34
LS246,013,90643,545,54294.6492.1749.3695.4381.43
LS345,748,46843,155,13894.3392.3952.4294.8784.31
LS445,241,12041,792,79892.3892.549.0194.8980.92
LS546,274,00843,830,93894.7292.0651.9294.9583.81
GUS142,393,60038,654,05891.1893.5949.6593.4880.62
GUS249,635,30045,807,12292.2993.3749.2295.0678.09
GUS346,117,25042,157,56491.4193.1348.3494.3675.47
GUS443,868,83443,798,78099.8492.9349.1893.6877.80
GUS546,738,46045,956,58898.3393.2051.3096.2483.05
GS143,475,57839,881,43691.7393.451.2395.0182.66
GS248,228,64245,179,51493.6891.4250.9194.6681.91
GS347,582,04245,289,16695.1892.2351.9295.3284.98
GS448,922,81445,936,31893.9092.4150.0394.9380.61
GS550,433,51849,632,89898.4193.3952.2596.4585.27
Disclaimer/Publisher’s Note: The statements, opinions and data contained in all publications are solely those of the individual author(s) and contributor(s) and not of MDPI and/or the editor(s). MDPI and/or the editor(s) disclaim responsibility for any injury to people or property resulting from any ideas, methods, instructions or products referred to in the content.