Article

Reduced Dietary Protein Levels Improved Growth Performance, Promoted Efficient Nutrient Utilization, Increased Fecal Lactobacillus, and Reduced Fecal Malodorous Compounds in Late-Fattening Barrows

Institute of Animal Husbandry and Veterinary Science, Zhejiang Academy of Agricultural Sciences, Hangzhou 310021, China
*
Authors to whom correspondence should be addressed.
Animals 2025, 15(16), 2465; https://doi.org/10.3390/ani15162465
Submission received: 8 July 2025 / Revised: 11 August 2025 / Accepted: 12 August 2025 / Published: 21 August 2025
(This article belongs to the Section Pigs)

Simple Summary

In swine production, the fattening phase is a critical stage for controlling feed costs and reducing malodorous compound emissions, as fattening pigs consume substantial amounts of feed and excrete large quantities of feces. Dietary protein content plays a key role in this regard. Excessive protein intake leads to unnecessary waste of protein resources and increased nitrogen-related emissions in feces. However, insufficient dietary protein content can also stunt pig growth rate. This study investigated the effects of diets with a 2% reduction in crude protein on the production performance, nutrient digestibility, fecal microbiota, and fecal malodorous compounds of late-fattening barrows. The results are expected to provide a reference for formulating precise protein-nutritional diets for the fattening of barrows.

Abstract

The objective of this study was to evaluate the effect of reducing dietary protein levels on barrows during the late fattening period. Fifty Duroc × Landrace × Yorkshire barrows with body weights averaging 76.30 ± 6.57 kg were randomly divided into normal protein (NP) and low protein (LP) groups. The feeding experiment lasted for 55 days. Dietary crude protein (CP) contents were 13.5% in the NP and 11.5% in the LP during days 1–28 and 12.5% and 10.5% during days 29–55, respectively. Results showed that compared with the NP, the LP increased the average daily gain (ADG) of barrows during days 29–55 (p < 0.05); enhanced the digestibility of nutrients, including dry matter (p < 0.01), CP (p < 0.01), calcium (p < 0.01), and phosphorus (p < 0.05); and decreased serum blood urea nitrogen (p < 0.01), total cholesterol (p < 0.05), and free fatty acids (p < 0.05). Lowering dietary CP increased fecal Lactobacillus abundance (p < 0.01); reduced concentrations of fecal ammonia nitrogen, histamine, butylamine, putrescine, 1,2-heptaenediamine, p-cresol, and indole-3-acetic acid (p < 0.01); and had no negative effects on meat quality (p > 0.05). These results suggested that reducing dietary CP by 2% could improve growth, promote efficient nutrient utilization, increase beneficial fecal microbiota abundance, and reduce the emission of fecal malodorous compounds in late-fattening barrows.

1. Introduction

Protein, as one of the most significant nutrients for maintaining pig health and growth, is the primary nutritional factor first considered in formulating diets. Protein components are among the most expensive ingredients in diets. On the one hand, while reducing dietary protein levels can lower production costs, insufficient protein supply may severely impede pig growth. On the other hand, excessive fermentation of undigested dietary protein in the hindgut damages gut health by producing harmful metabolites and promoting pathogenic bacterial proliferation [1]. Consequently, optimal dietary protein levels are not only critical for pig gut health and production performance potential but are also closely linked to farm economic benefits.
The growth-fattening phase is a critical stage in swine production, with features distinct from those of the nursery phase. During this period, pigs consume approximately 75% of the total feed required throughout the life cycle of commercial pigs, and feed accounts for 65–75% of the total cost of pork production [2]. In addition, the daily fecal excretion of growing-fattening pigs is 2–4 times that of the nursery stage, if it is considered that diet digestibility will be less in the finishing stage and that feed intake is expected to be greater in heavier pigs (NRC, 2012; Table 16-1A) [3]. Thus, providing precisely balanced protein diets for pigs during this stage is of great significance for reducing feed costs, minimizing nitrogen-related emissions, and maintaining production performance.
In recent years, increasing studies have shown that feeding no less than 12% crude protein (CP) diets supplemented with four essential amino acids (EAAs)—Lys, Met, Thr, and Trp—has no negative impacts on the production performance of fattening pigs [4,5]. In fact, advances in crystalline amino acids technology have made it possible to further reduce dietary CP in pigs, especially with the development of feed-grade Val and Ile. Furthermore, the CP levels (calculated by total nitrogen) recommended by the NRC (2012) [3] is about 2–4% lower than those noted in the previous NRC (1998) edition [6]. However, most existing studies have focused on fattening pigs weighing less than 120 kg. With the growing pursuit of pork quality, fattening pigs slaughtered at a larger body weight (approximately 140 kg) have become increasing common, especially in China. Thus, it is necessary to explore the precise dietary protein requirements of fattening pigs slaughtered at large weights.
The selection of energy systems also exerts non-negligible influences while formulating low protein (LP) diets. Currently, digestive energy (DE) and metabolic energy (ME) are still being employed in some studies [7,8], resulting in inaccurate estimates of energy values in experimental diets. This is because the efficiency of calculating net energy (NE) from DE or ME differs markedly between protein feeds and energy feeds. Importantly, NE better meets the actual energy requirements of pigs by accounting for the metabolic utilization processes of feed energy in the body. It is specifically recommended for formulating LP diets [9,10,11]. Therefore, more NE-based studies should be conducted in pigs, particularly focusing on the regulation of protein nutrition.
In view of the foregoing, we hypothesized that there is still potential to reduce dietary protein content while meeting the requirements of various EAAs in fattening pigs. The present study assessed the effects of diets with a 2% reduction in CP, formulated based on NE values and supplemented with six EAAs, on the production performance, fecal microbiota, and fecal malodorous compounds of late-fattening barrows. The results provide guidance for precise dietary protein supplementation in fattening barrows.

2. Materials and Methods

2.1. Ethics Statement

Experimental procedures were approved by the Zhejiang Academy of Agricultural Sciences Experimental Animal Welfare and Ethics Committee (Hangzhou, 25ZALAS23, 14 November 2023).

2.2. Experimental Design and Feeding Management

Fifty healthy Duroc × Landrace × Yorkshire crossbred barrows (76.30 ± 6.57 kg) were selected and randomly divided into two groups on the basis of initial body weight. The control group was fed a normal protein (NP) diet, and the experimental group was fed an LP diet. Each group consisted of five pens, with five pigs per pen. The experimental period was divided into phase Ⅰ (days 1–28) and phase Ⅱ (days 29–55). Dietary CP in the NP group was set at 13.5% in phase Ⅰ and 12.5% in phase Ⅱ, compared with 11.5% and 10.5% in the LP group, respectively. All pigs were provided with ad libitum access to feed and clean drinking water. The diets comprised corn–soybean meal, and other nutritional parameters were fitted according to the NRC (2012) [3] nutrient requirements (Table 1).

2.3. Measurement of Growth Performance

During the feeding experiment, feed consumption was recorded for each pen per day. Each pig was weighed after an overnight fast at the beginning, the end of phase Ⅰ, and the end of phase Ⅱ. Average daily gain (ADG), average daily feed intake (ADFI), and feed-to-gain ratio were calculated and analyzed for each group.

2.4. Measurement of Nutrient Digestibility

Dietary samples of approximately 500 g from each feed bag were collected, pooled according to dietary CP treatments, and stored at −20 °C until chemical analysis. Before the end of the feeding experiment, fecal samples from each pen were collected over 5 consecutive days and stored at −20 °C immediately after collection. Part of each sample was placed in sample bags with 10% hydrochloric acid solution to fix excreta nitrogen for measuring nitrogen content and calculating CP concentration. For each pen, the 5-day fecal samples were pooled, oven-dried at 60 °C to a constant weight, and ground for subsequent chemical analysis. Acid-insoluble ash (AIA) in samples was selected as an endogenous indicator.
Fecal samples and experimental diets were analyzed by AOAC [12] for dry matter (method 930.15; AOAC, 2007) and for nitrogen (method 976.05; AOAC, 2007), and CP was calculated as N×6.25 for ether extract (EE) (method 922.06; AOAC, 2007) and for ash (method 961.14; AOAC, 2007). The organic matter of samples was calculated by subtracting the ash from the dry matter. Calcium (Ca) and phosphorus (P) of these samples were determined by inductively coupled plasma optical emission spectroscopy (ICP-OES; method 985.01A, B, and D; AOAC, 2007) after acid digestion, and by AIA according to the methods of McCarthy et al. (1974) [13]. Apparent total tract digestibility (ATTD; %) of nutrients was calculated using the following formula:
ATTD (%) = 1 − [(AIAdiet × Nutrientfeces)/(AIAfeces × Nutrientdiet)] × 100.

2.5. Sample Collection and Preparation

At the end of the feeding experiment, two pigs closest to the average body weight were picked up from each pen and employed for subsequent feces collection, blood sampling, and slaughter.
Fresh fecal samples were collected from each selected pig using sterile cotton swabs after rectal stimulation, placed into 2 mL sterile centrifuge tubes, and stored at −80 °C for 16S ribosomal RNA (rRNA) sequencing and measurement of fecal malodorous compounds.
Blood samples were drawn from each selected pig via the jugular vein following overnight fasting, and centrifuged at 2500× g for 10 min at 4 °C to obtain serum. The serum samples were collected and stored at −80 °C until further analysis.

2.6. Measurement of Serum Biochemical Indices

Total protein (TP), blood urea nitrogen (BUN), glucose (GLU), triglyceride (TG), total cholesterol (TCHO), and nonesterified fatty acid (NEFA) in the serum were determined using appropriate assay kits provided by Nanjing Jiancheng Bioengineering Institute (Nanjing, China).

2.7. Measurement of Carcass Traits and Meat Quality

The selected pigs were transported to an abattoir and slaughtered by electrical stunning. Carcass traits and meat quality indices were measured for each pig.
The hot carcass weight of each pig was determined and used to obtain the dressing percentage by calculating the ratio of carcass weight to live body weight. Average backfat thickness was calculated via measuring at three points: the first thoracic vertebra, the last thoracic vertebra, and the last lumbar vertebra (X1). The distance (X2) from the end of the gluteus medius muscle to the edge of the spinal canal was measured while the carcass was hung upside down. Lean meat rate was calculated according to the following regression equation:
Y (lean meat rate) = 57.742 − 0.5871X1 + 0.2023X2.
Longissimus muscle samples were removed from the 10th rib on the left side of the carcass, preserved at 4 °C for 24 h, and used for measuring meat quality. The pH 24h value was determined using a PH-STAR instrument (MATTHÄUS, Chengdu, China). Meat color values, including pork brightness (L*), redness (a*), and yellowness (b*), were determined using a CR-410 colorimeter (Konica Minolta, Tokyo, Japan). Drip loss percentage was calculated from the weight change of muscle samples, trimmed to a size of approximately 2 cm × 2 cm × 3 cm, 45 min after slaughter and after hanging for 24 h at 4 °C. Cooking loss percentage was determined by weighing ~20 g meat samples sealed in bags before and after cooking at 70 °C for 30–45 min. Shear force was measured using these cooked samples, cut into 1 cm × 1 cm × 4 cm strips, using a C-LM3 muscle tenderness meter (Northeast Agricultural University, Yangling, China). Milling loss percentage was obtained by weighing ~1 cm thick muscle slices with a sampler before and after pressing with a pressure meter. Intramuscular fat (IMF) content was determined using Soxhlet extraction after samples were oven-dried at 60 °C. All indices were measured using three replicates, except for shear force, which included five replicates.

2.8. Analysis of Fecal Microbiota

Genomic DNA of intestinal bacteria was extracted from fecal samples using the cetyltrimethylammonium bromide/sodium dodecyl sulfate method. PCR amplification was performed for the V3–V4 region of the bacterial 16S rRNA gene using Phusion High-Fidelity PCR Master Mix with GC Buffer (NEB, Ipswich, MA, USA). PCR products were used to construct a DNA library after purifying and sequencing on a Thermo Fisher Ion S5TMXL platform (Thermo Scientific, Waltham, MA, USA).
All sequenced raw data were filtered, denoised, and merged, and chimeric sequences were removed. Obtained sequences with ≥97% similarity were assigned to the same operational taxonomic units (OTUs). Observed species and α-diversity indices including Simpson index, Shannon index, Chao1, and ACE were calculated using QIIME 2 2023.7 software (http://qiime2.org (accessed on 18 August 2023)). The top 10 most abundant bacterial communities at the phylum, family, and genus levels were compared between groups.

2.9. Determination of Fecal Malodorous Compounds

2.9.1. Ammonia Nitrogen

Fecal samples were firstly mixed with 10 mL/g ammonia-free water. Mixtures were centrifuged at 10,000× g for 10 min at 4 °C, and 1 mL of supernatant was extracted and added to 1 mL potassium chloride solution and 49 mL ammonia-free water. A 1.5 mL volume of Nessler’s reagent was added, and the absorbance at 420 nm was measured against an ammonia-free water blank using a UV–Vis spectrophotometer (MAPADA, Shanghai, China). The content of ammonia nitrogen (NH3-N) was calculated as described previously by Diao et al. [14].

2.9.2. Biogenic Amines

Fecal samples were mixed with 8 mL/g 0.4 M perchloric acid solution and incubated at −20 °C for 12 h. The mixtures were centrifuged at 10,000× g for 10 min at 4 °C, and 1 mL of supernatant was extracted and added to 1 mL 10 mg/mL acetone solution, followed by the addition of 1 mL of 2 M sodium hydroxide-saturated sodium bicarbonate buffer. The mixtures were incubated for 30 min in a 40 °C water bath in the dark. Extracts were mixed with 1 mL methanol following anhydrous ether extraction, concentrated, and dried to detect the contents of biogenic amines including histamine, 2-phenylethylamine, butylamine, spermine, tyramine, putrescine, cadaverine, and 1,2-heptanediamine using an Agilent 1200 Series HPLC instrument (Agilent, Santa Clara, CA, USA), as described previously by Yang et al. [15].

2.9.3. VFAs

Fecal samples were mixed with 10 mL/g ultrapure water, centrifuged at 10,000× g for 10 min at 4 °C, and 1 mL of supernatant was extracted; 200 μL crotonic acid was added as an internal standard. The mixed solutions were prepared for determination of volatile fatty acids (VFAs), including acetic acid, propionic acid, butyric acid, isobutyric acid, and isovaleric acid using an Agilent 7890N gas chromatography instrument (Agilent), as described previously by Wang et al. [16].

2.9.4. Phenolic and Indole-Related Compounds

Fecal samples (~0.3 g) were added to 1.2 mL of ultrapure water, centrifuged at 10,000× g for 10 min at 4 °C, and the supernatant was extracted and mixed with chloroform and 4 M sodium hydroxide solution at a volume ratio of 1:1:0.015. The mixtures were incubated at 40 °C for 30 min; supernatants were obtained by centrifuging at 10,000× g for 15 min and were used to measure the content of phenolic (phenol and p-cresol) and indole-related (indole-3-acetic acid [IAA], indole, and skatole) compounds via the internal standard method using an Agilent 1200 Series HPLC instrument (Agilent), as described previously by Yu et al. [17].

2.10. Statistical Analysis

Experimental data were statistically analyzed using independent samples t tests in SPSS 22.0 statistical software (IBM, Armonk, NY, USA). Results are expressed as mean ± standard deviation (SD), with p < 0.05 indicating significant differences, and p < 0.01 indicating very significant differences. Figures showing the results for malodorous compounds in feces were generated using GraphPad Prism V 8.0.

3. Results

3.1. Growth Performance

As shown in Table 2, compared with the NP group, in phase Ⅰ (days 1–28), final body weight, ADG, ADFI, and feed-to-gain ratio in the LP group showed no differences (p > 0.05); in phase Ⅱ (days 29–55), ADG was increased by 8.57% (p < 0.05); over the whole feeding experiment, none of the indices of growth performance were significantly different (p > 0.05).

3.2. Nutrient Digestibility

As shown in Table 3, compared with the NP group, the digestibility of nutrients involving dry matter, CP, Ca, and P in the LP group was increased by 1.04% (p < 0.01), 4.22% (p < 0.01), 18.55% (p < 0.01), and 8.61% (p < 0.05), respectively. The difference in the EE digestibility was not significant (p > 0.05) between the two groups.

3.3. Effects of LP Diet on Serum Biochemical Indices in Late-Fattening Barrows

As shown in Table 4, compared with the NP group, serum BUN content in the LP group was reduced by 21.90% (p < 0.01), while the TCHO content was reduced by 29.82% (p < 0.05), and the NEFA content was increased by 58.33% (p < 0.01). There were no significant differences in the content of TP, GLU, or TG (p > 0.05) between the two groups.

3.4. Carcass Traits and Meat Quality

As shown in Table 5, compared with the NP group, carcass traits including carcass weight, dressing percentage, average backfat thickness, and lean meat rate in the LP group showed no significant differences (p > 0.05). Similarly, none of the indices of meat quality, including pH24h value, meat color (L*, a*, and b*), shear force, drip loss, cooking loss, and milling loss, were significantly different (p > 0.05). These results suggest that the LP diet exerted no negative effects on pork quality.

3.5. Fecal Microbiota

3.5.1. Analysis of OTUs, α-Diversity Indices, and Observed Microbial Species

The total number of OTUs in the NP and LP groups was 7444 and 8133, respectively. The number of common OTUs was 1036, and the number of unique OTUs in the NP and LP groups was 178 and 101, respectively. As shown in Table 6, there were no significant differences in any of the α-diversity indices and observed species between the two groups (p > 0.05).

3.5.2. Analysis of Differential Microbiota Composition

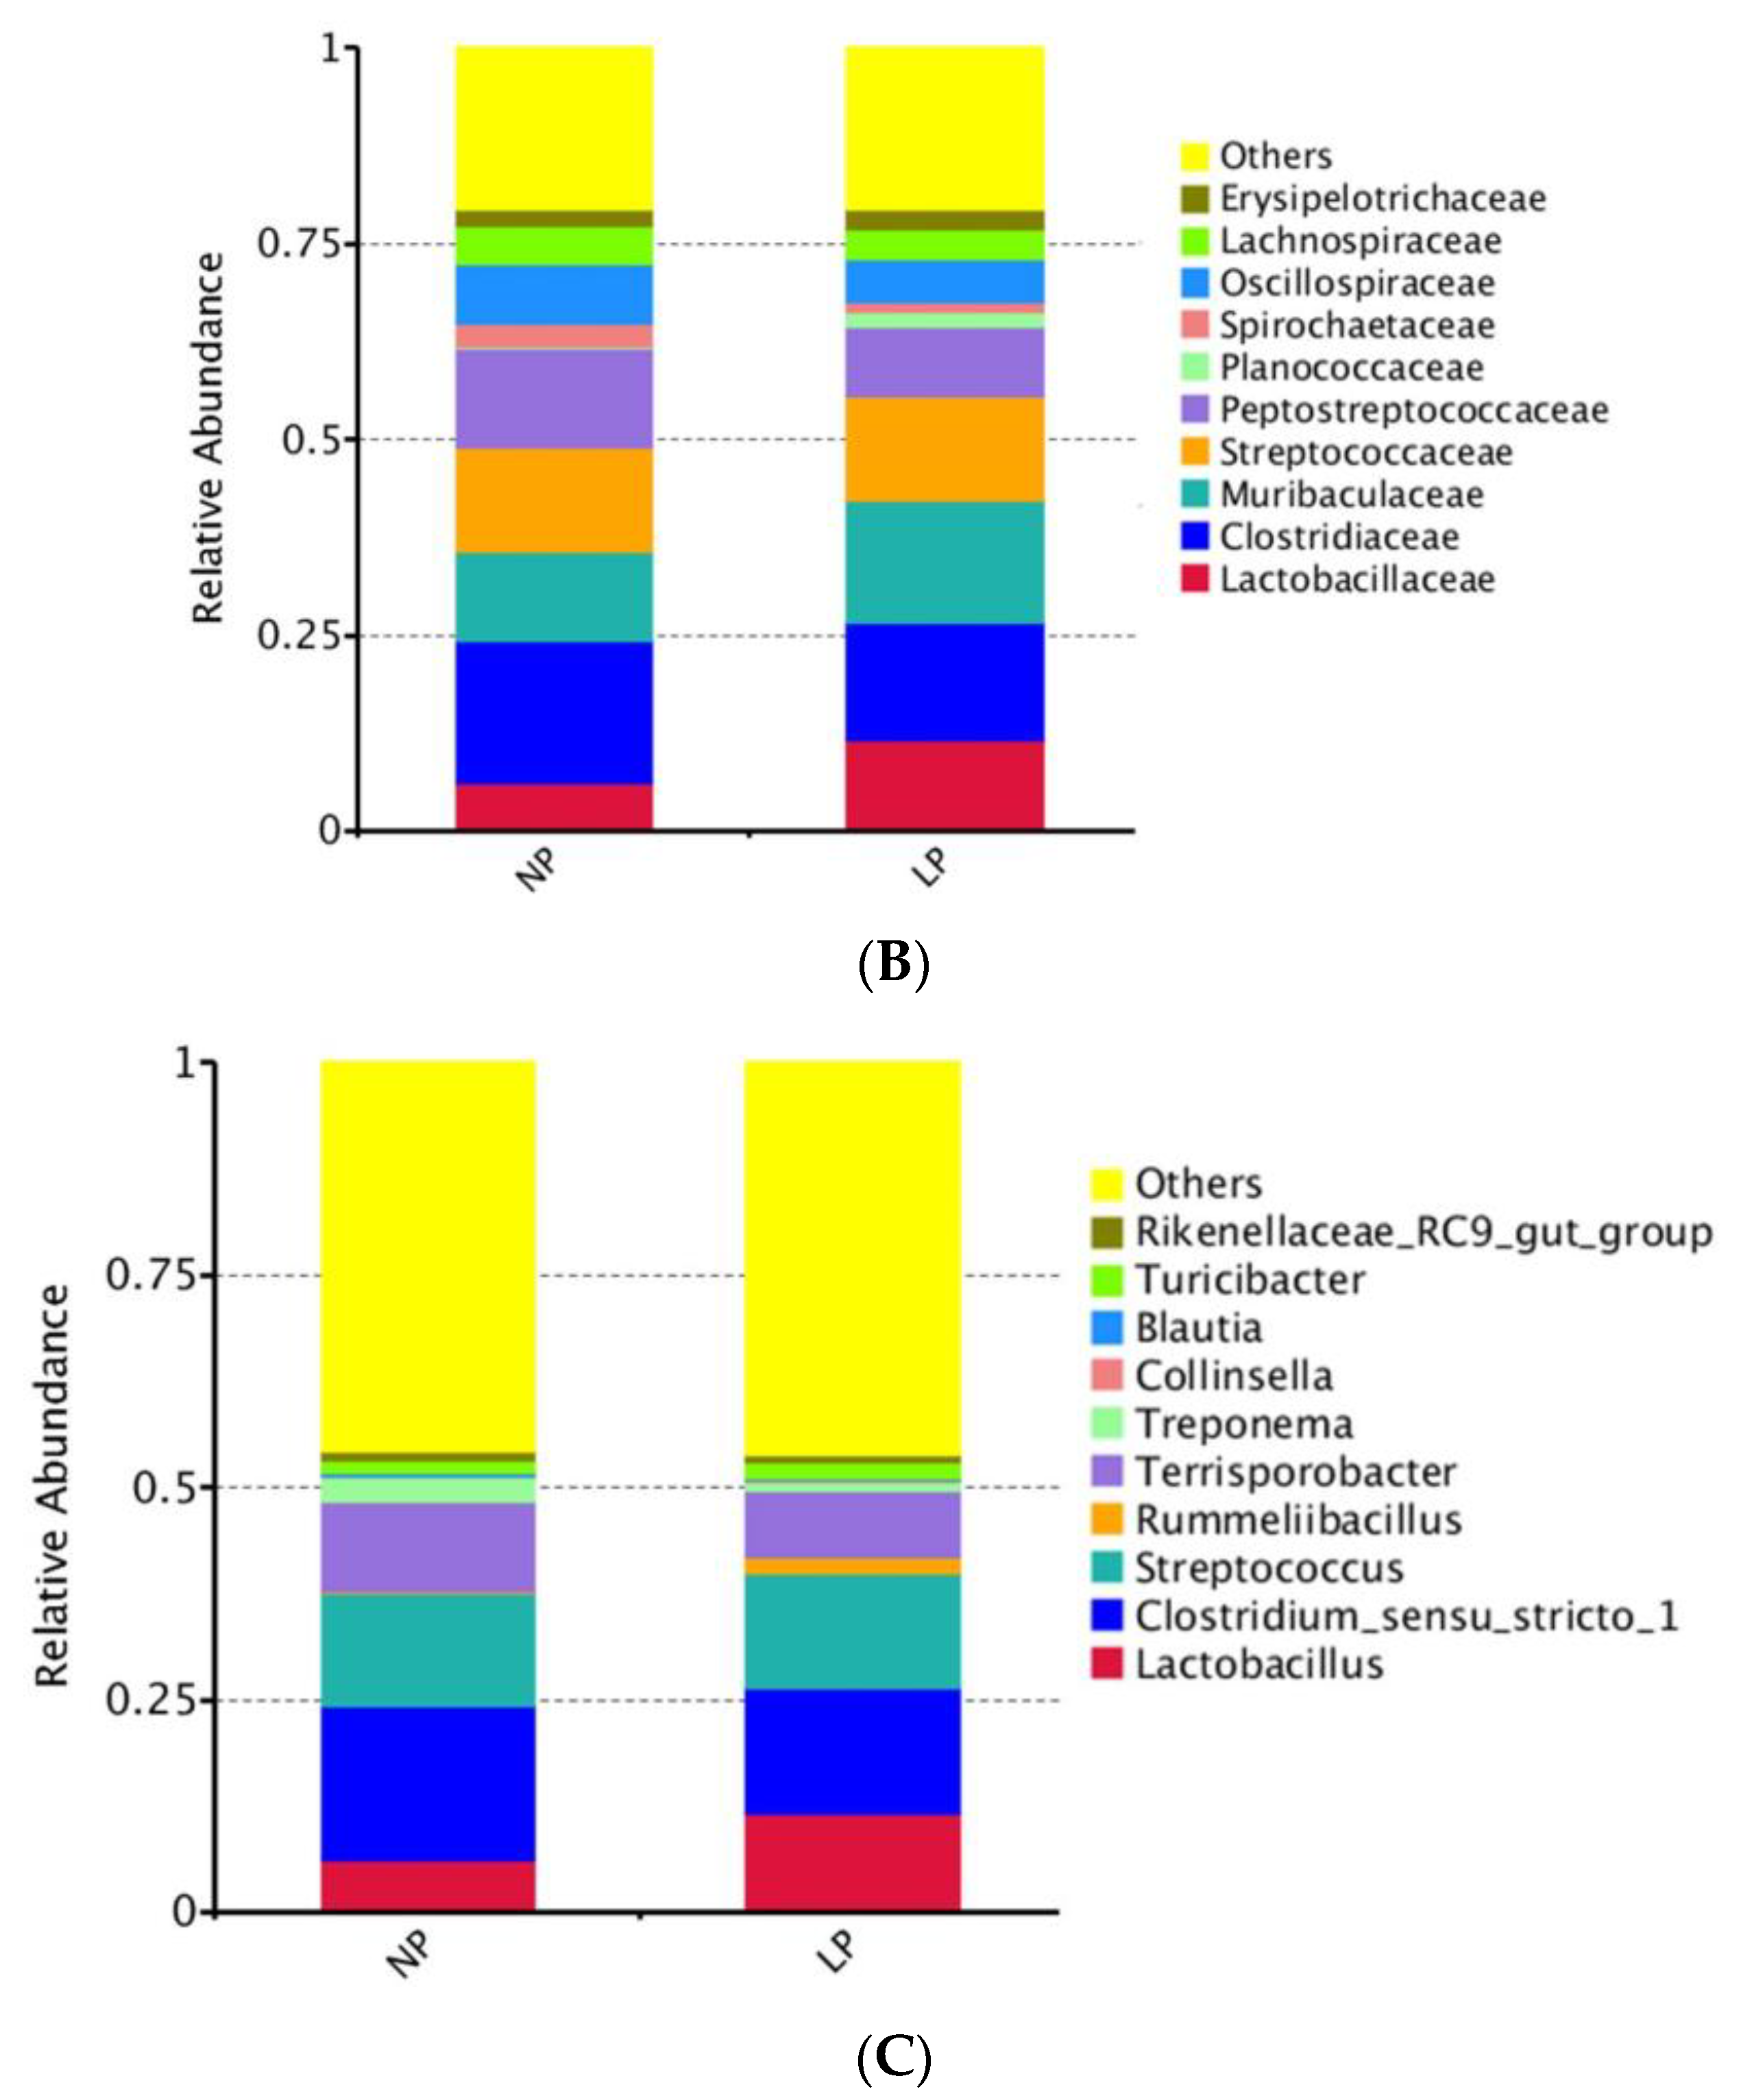
In order to investigate the effect of LP diet on the fecal microbial structure in late-fattening barrows, the top 10 most abundant communities were selected to analyze the differences between the NP and LP groups at the level of phylum, family, and genus.
At the phylum level (Figure 1A and Table S1), the relative abundance of Firmicutes was >75%, and the relative abundance of Bacteroidota was 15–20%, and the two communities together accounted for > 90% of the total communities. The relative abundances of all the top 10 communities showed no differences between the NP and LP groups (p > 0.05).
At the family level (Figure 1B and Table S2), the relative abundances of Clostridiaceae, Streptococcaceae, Peptostreptococcaceae, and Muribaculaceae were each >10%, accounting for >50% of the total communities. Compared with the NP group, the relative abundance of Lactobacillaceae in the LP group was significantly increased (p < 0.05), while the relative abundances of Streptococcus digesticaceae, Oscillospiraceae, and Lachnospiraceae were significantly reduced (p < 0.05). The abundances of other families exhibited no significant differences between the NP and LP groups (p > 0.05).
At the genus level (Figure 1C and Table S3), the relative abundance of six genera (Clostridium_sensu_stricto_1, Streptococcus, Terrisporobacter, Lactobacillus, Treponema, and Turicibacter) was >1%, accounting for ~50% of the total communities. Compared with the NP group, the relative abundance of Lactobacillus in the LP group was significantly increased by 90.20% (p < 0.05). The relative abundances of other genera exhibited no differences between the NP and LP groups (p > 0.05).

3.6. Fecal Malodorous Compounds

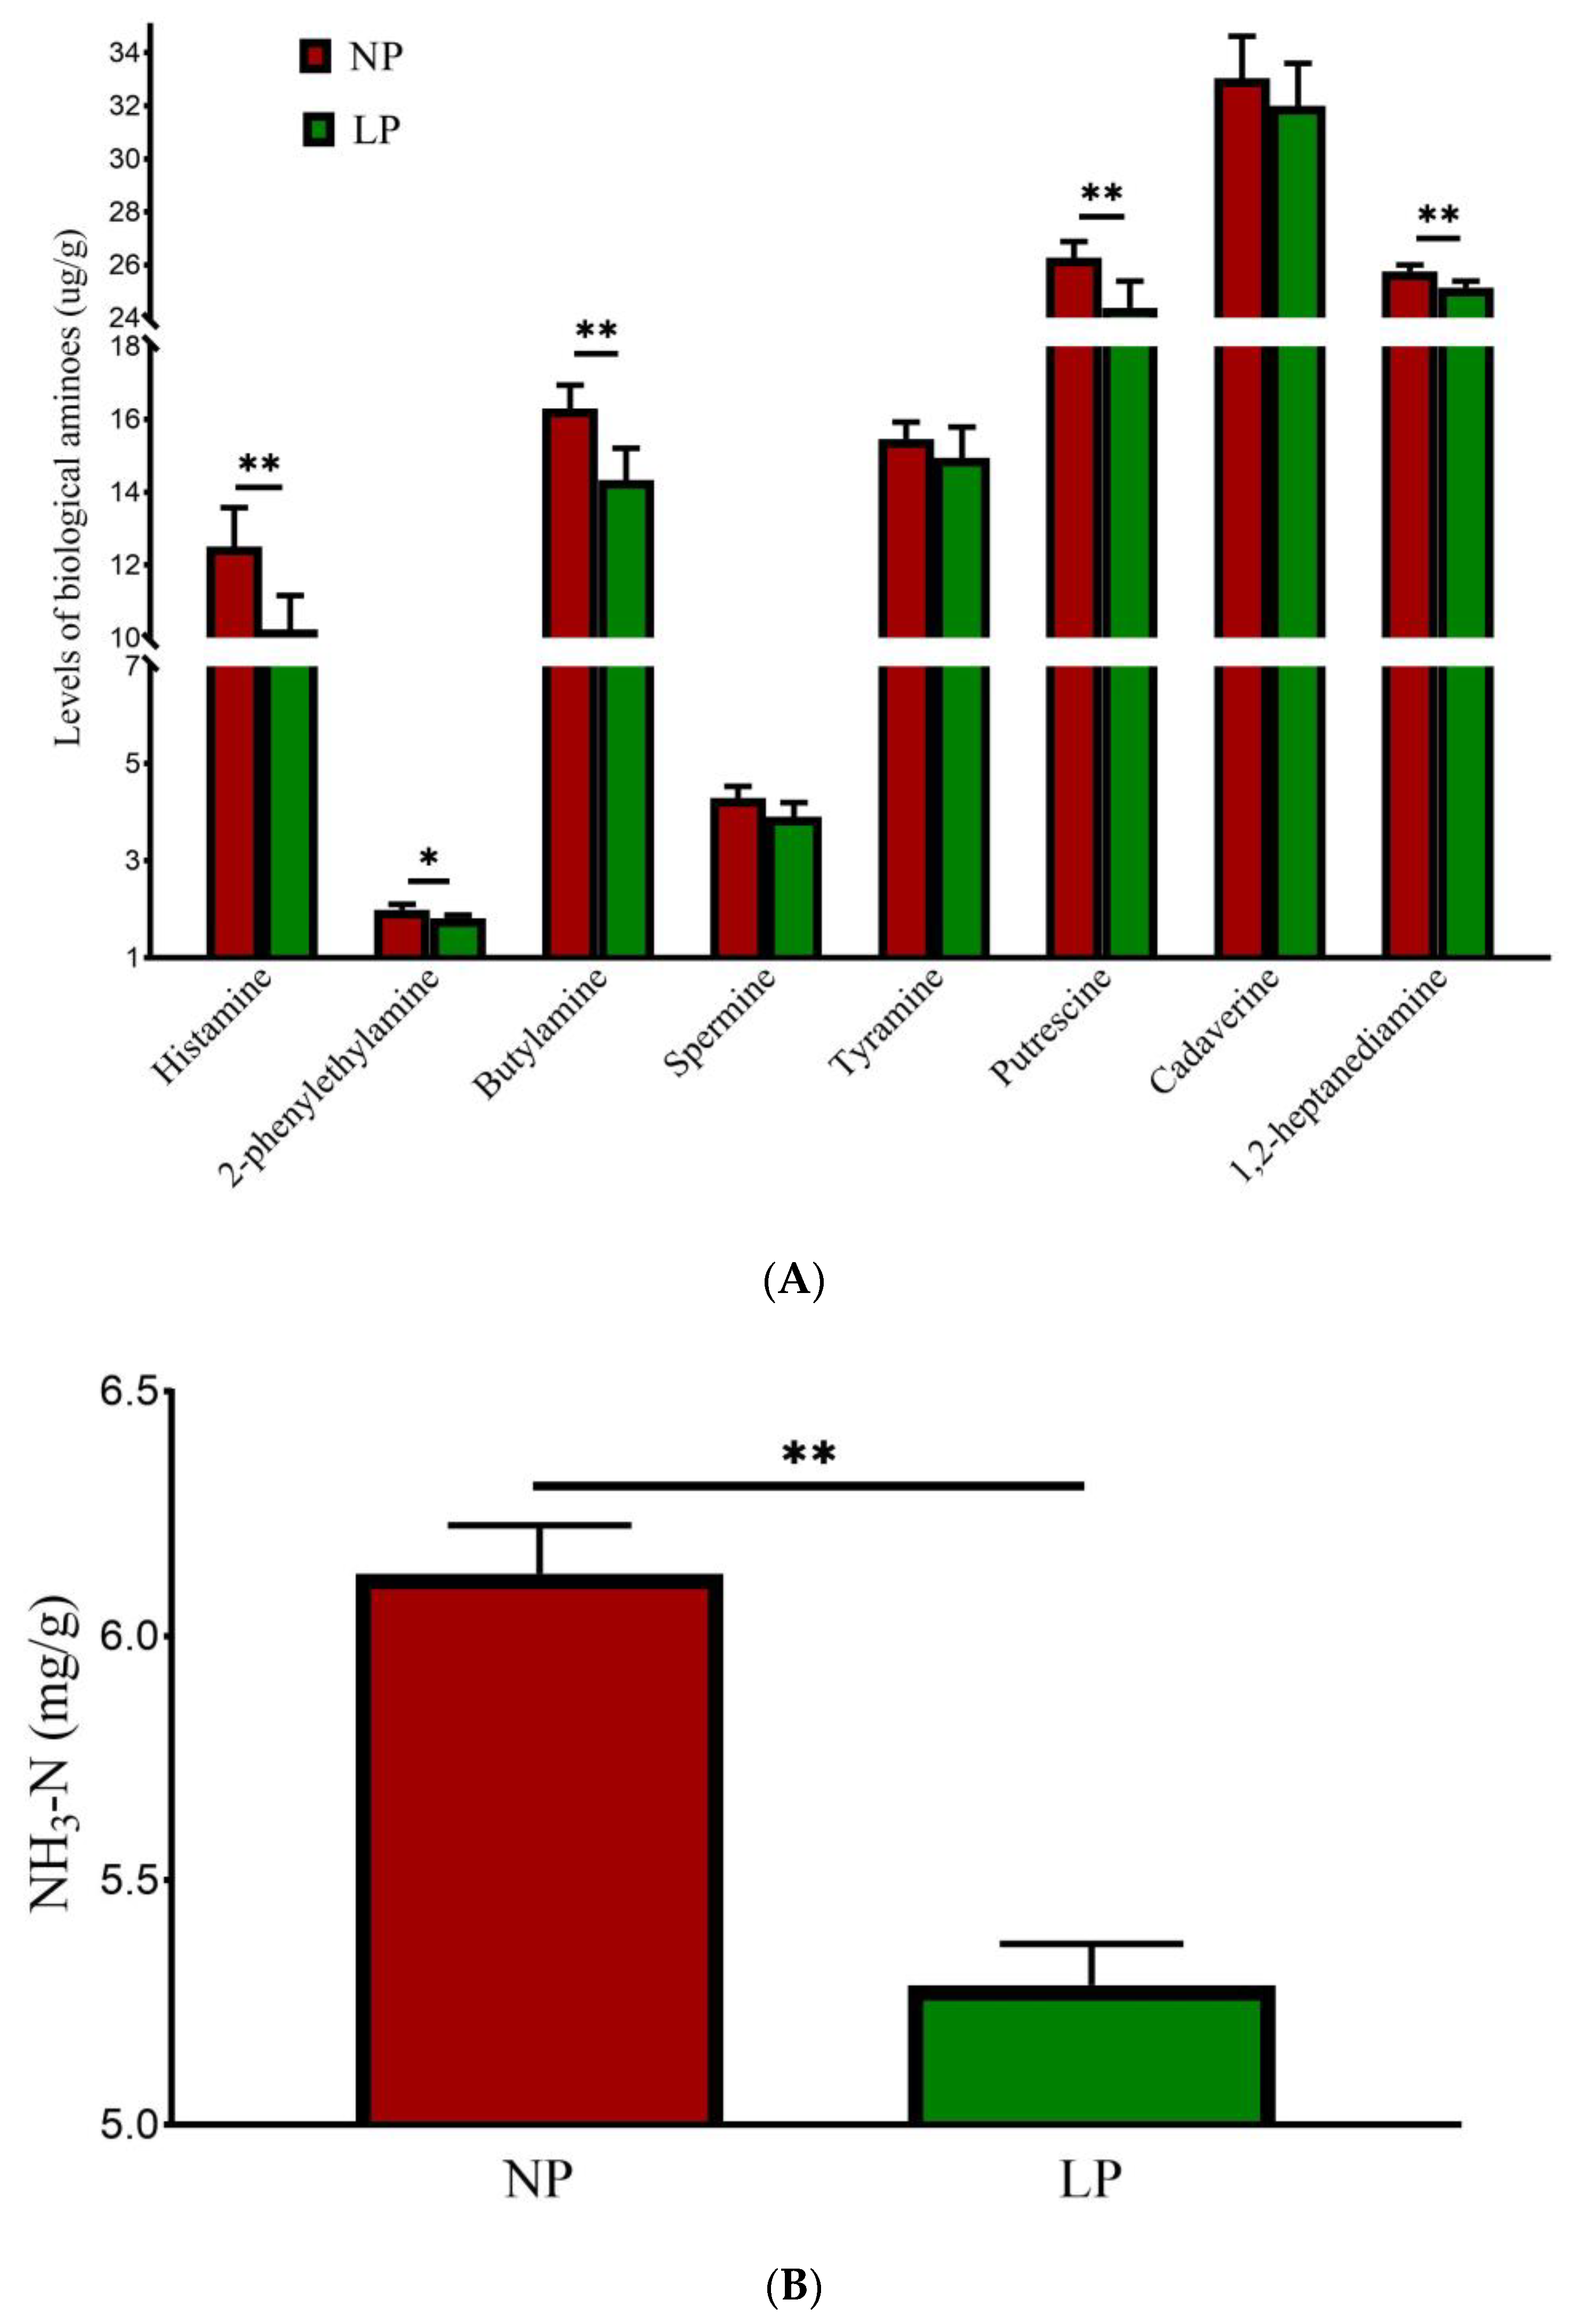
The results for fecal biological amines are shown in Figure 2A. Contents of histamine, butylamine, putrescine, and 1,2-heptaenediamine were different between the NP and LP groups (p < 0.01); they were decreased by 18.23%, 11.97%, 7.23%, and 2.37%, respectively. Compared with the NP group, 2-phenethylamine was decreased by 8.54% (p < 0.05) in the LP group. There were no significant differences in the contents of spermine, tyramine, or cadaverine between the two groups (p > 0.05).
The results for NH3-N are shown in Figure 2B. Compared with the NP group, the content of NH3-N in the LP group was reduced by 13.70% (p < 0.01).
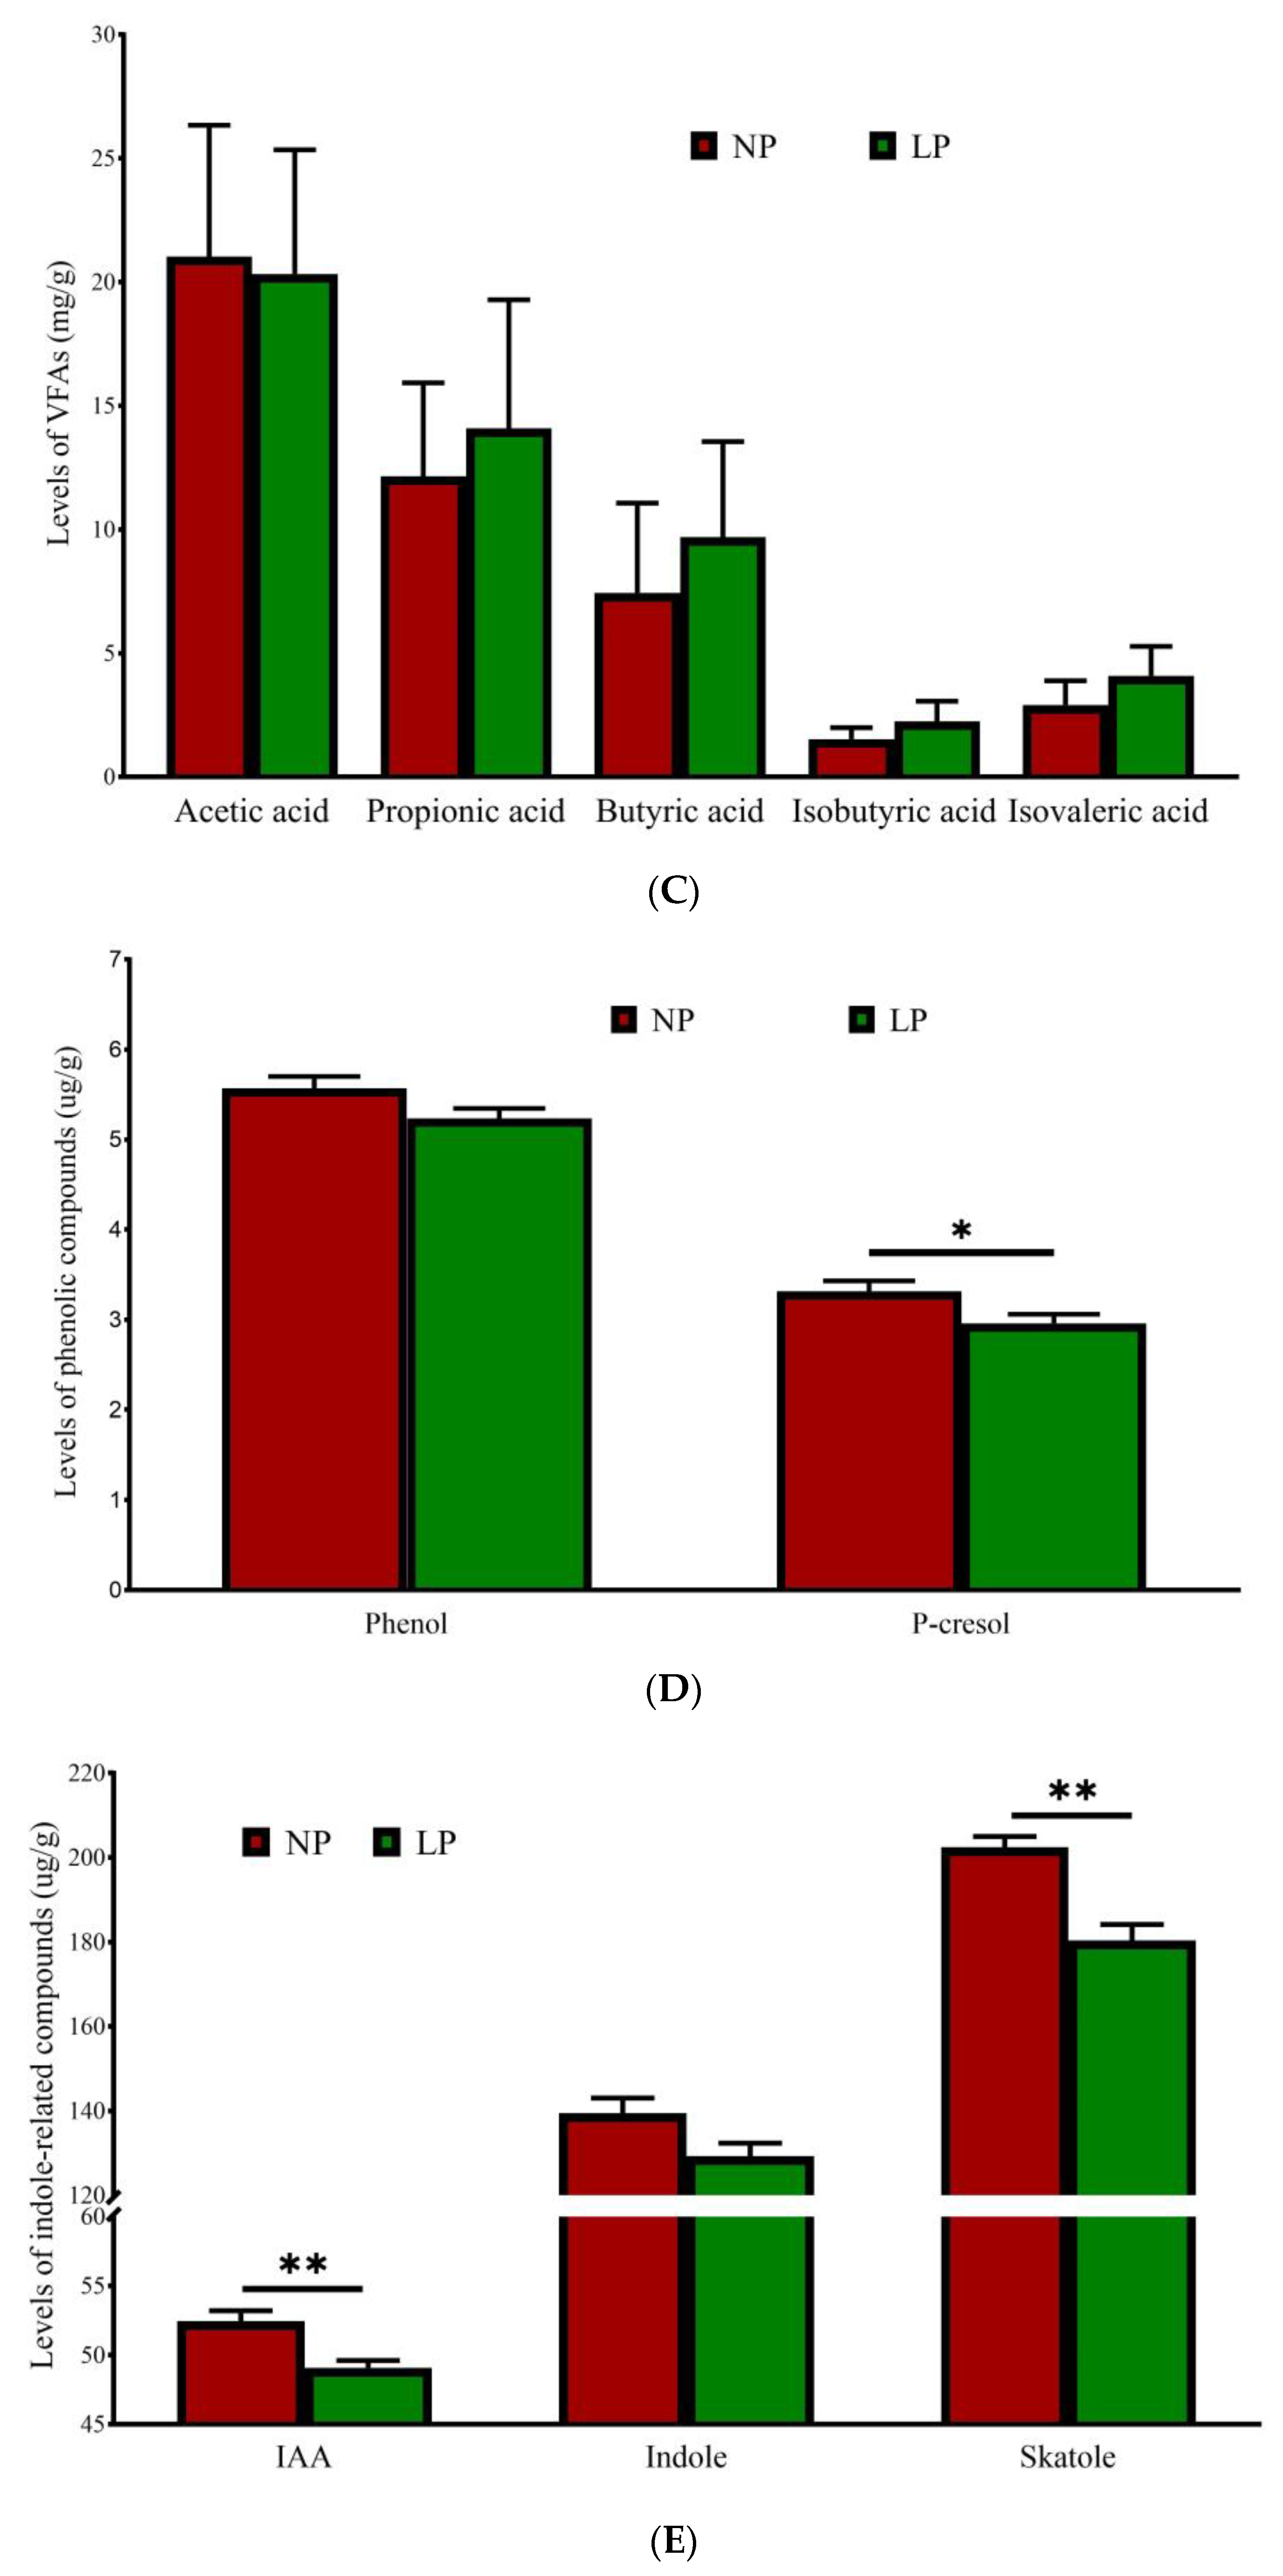
The results for VFAs are shown in Figure 2C. The contents of all VFAs containing acetic acid, propionic acid, butyric acid, isobutyric acid, valeric acid, and isovaleric acid did not differ significantly between the two groups (p > 0.05).
The results for phenolic compounds are shown in Figure 2D. Compared with the NP group, the content of p-cresol in the LP group was reduced by 10.84% (p < 0.01). The content of phenol did not differ significantly between the two groups (p > 0.05).
The results for indole-related compounds are shown in Figure 2E. Compared with the NP group, contents of IAA and skatole in the LP group were reduced by 6.42% (p < 0.01) and 10.89% (p < 0.01), respectively. The content of indole did not differ significantly between the two groups (p > 0.05).

4. Discussion

Growth performance is a crucial economic indicator to evaluate whether dietary CP levels can meet the demands of pig production. Previous studies have demonstrated that reducing dietary CP from 14% to 12% improved ADG and feed-to-gain ratio, while a further reduction to below 11% CP had a negative impact on growth performance of fattening pigs [18,19]. For optimal growth performance, dietary CP should range between 12.6–12.7%, according to a secondary model [19], and at least 11.6%, based on a meta-analysis [20]. Feeding diets with <10% CP impaired the growth and feed effectiveness of fattening pigs [21,22]. The present study showed that 10.5% dietary CP, based on NE values, had no adverse effects on the growth performance of barrows weighing > 105 kg, but instead enhanced weight gain.
Existing reports on the apparent nutrient digestibility of dietary protein have mainly focused on the stages of weaned piglets and growing pigs, with no definite conclusions. Fang et al. [23] observed that CP digestibility increased in weaned piglets as dietary CP content declined, but Niyonsaba et al. [24] reported that it decreased in growing pigs under similar research conditions. However, no obvious changes in CP digestibility and EE were observed in piglets and growing pigs fed diets with different CP levels [25,26]. Digestibility of Ca and P in growing pigs decreased linearly due to a reduction in dietary protein content [27]. In the present study, digestibility of dry matter, CP, Ca, and total P was improved with decreasing dietary protein content. These inconsistent results may be attributed to differences in the growth phase of experimental pigs, the setting of dietary protein levels, and the degree of protein reduction.
BUN is the final product of amino acid metabolism, which can reflect protein utilization and serve as an effective indicator for predicting urinary nitrogen excretion [28]. Reducing dietary CP level by 1.5% decreased N emission by 33.8% in the urine of growing pigs [29]. Research conducted by Duarte et al. [8] showed that decreasing dietary protein significantly improved nitrogen utilization and decreased serum BUN content. Our results also showed that feeding late-fattening barrows a lower dietary CP level altered serum TCHO and NEFA levels, suggesting that this nutritional strategy may stimulate lipid metabolism. It also indicated that an LP diet may be beneficial for improving fatty acids composition in pork.
Studies on the influences of dietary CP levels on the carcass traits of pigs have mainly focused on backfat thickness and lean meat rate. Decreasing dietary CP was reported to increase back fat thickness and reduce meat production [30,31]. However, it was also demonstrated that lower dietary CP can improve pork quality by decreasing shear force, strengthening water-holding capacity, increasing the loin eye area and marbling score, enhancing IMF deposition, and improving the composition of fatty acids in the longissimus dorsi [32,33,34,35]. The IMF content may be increased by upregulating lipogenic genes and downregulating lipolytic genes, and meat quality may be improved by regulating the antioxidant capacity of the body [36]. None of these effects were observed in the present study. This may be attributed to differences in the energy level, amino acid content, and energy-to-nitrogen ratio of the experimental diets used in this study compared with those employed in other studies.
Changes in dietary ingredients involving protein can strongly affect the composition and function of the intestinal microbial community [37]. However, existing microbiota-related results based on 16S rRNA sequencing are complex, and it is difficult to repeat previous findings. For example, lowering dietary CP was observed to change intestinal microbiota α-diversity in different ways, or it had no influence, in some cases [8,35,38]. Significant changes in Firmicutes, Bacteroidetes, Actinobacteria, Proteobacteria, Euryarchaeota, Verrucomicrobia, and others were observed [39,40]. Our study found that the abundance of fecal Lactobacillus, known to be beneficial to the gut community, increased with a lower dietary protein supply in barrows. This suggested that an LP diet was likely to improve intestinal microbiota health of animals, but the results require further experimental verification.
Emission of malodorous substances from animal manure is an ongoing issue for pig production. Odorants in animal feces are produced by the intestinal microbiota through anaerobic fermentation of unutilized proteins [41]. Major fecal malodorous compounds include NH3-N, biogenic amines, phenols, indoles, and VFAs [42]. Studies have demonstrated that concentrations of NH3-N and biogenic amines in the feces and hindgut were decreased by reducing dietary CP levels in pigs [43,44,45]. Reduced odorous compounds, such as skatole and p-cresol, in pig manure produced from pigs fed an LP diet may be associated with changes in bacterial communities, especially those related to protein metabolism [46,47]. In the present study, the increased Lactobacillus community in feces is likely to optimize the utilization of dietary protein by improving the digestive environment, promoting absorption efficiency, regulating metabolism, and further reducing fecal malodorous compound emissions.

5. Conclusions

The results suggest that an LP diet with a CP content of 12.5% (75–107 kg) and 10.5% (107–138 kg), formulated based on NE values of 10.36 MJ/kg and supplemented with the six EAAs (Lys, Met, Thr, Trp, Val, and Ile), may enhance nutrient utilization and regulate intestinal microbiota composition, thereby improving growth performance and reducing fecal malodorous compounds in late-fattening barrows.

Supplementary Materials

The following supporting information can be downloaded at: https://www.mdpi.com/article/10.3390/ani15162465/s1, Table S1: The abundance of fecal microbiota at phylum level; Table S2: The abundance of fecal microbiota at family level; Table S3: The abundance of fecal microbiota at genus level.

Author Contributions

X.T.: conceptualization, data curation, investigation, methodology, software, validation, visualization, writing—original draft. J.W.: investigation. S.L.: software. Q.M.: investigation and data curation. X.M.: investigation. Y.L.: funding acquisition. Z.X.: supervision. B.D.: conceptualization, formal analysis, funding acquisition, project administration, resources, supervision, visualization, and writing—review and editing. All authors have read and agreed to the published version of the manuscript.

Funding

This study was supported by the Key Research and Development Program of Zhejiang Province (2024C02004) and the China Agriculture Research System (CARS-35). The funders had no role in study collection, data collection and analysis, decision to publish, or preparation of the manuscript.

Institutional Review Board Statement

The animal study protocol was approved by the Zhejiang Academy of Agricultural Sciences Experimental Animal Welfare and Ethics Committee (25ZALAS23, 14 November 2023).

Informed Consent Statement

Not applicable.

Data Availability Statement

The original contributions presented in this study are included in the article/Supplementary Materials. Further inquiries can be directed to the corresponding author(s).

Acknowledgments

We would like to thank Hangzhou Zhengxing Animal Husbandry Co., Ltd. for their support during the animal feeding experiment. Additionally, we acknowledge the efforts of everyone who participated in the collection of samples and data. The authors did not use any artificial intelligence-assisted technologies in the writing process.

Conflicts of Interest

The authors declare no conflicts of interest.

References

  1. Wang, Y.; Zhou, J.; Wang, G.; Cai, S.; Zeng, X.; Qiao, S. Advances in low-protein diets for swine. J. Anim. Sci. Biotechnol. 2018, 9, 60. [Google Scholar] [CrossRef] [PubMed]
  2. van Heugten, E. Growing-Finishing Swine Nutrition Recommendations and Feeding Management. Pork Information Gateway. PIG 07-01-09. 2010. Available online: https://porkgateway.org/resource/growing-finishing-swine-nutrient-recommendations-and-feeding-management (accessed on 7 July 2025).
  3. National Research Council. Nutrient Requirements of Swine, 11th ed.; National Academies Press: Washington, DC, USA, 2012. [Google Scholar]
  4. Qin, C.; Huang, P.; Qiu, K.; Sun, W.; Xu, L.; Zhang, X.; Yin, J. Influences of dietary protein sources and crude protein levels on intracellular free amino acid profile in the longissimus dorsi muscle of finishing gilts. J. Anim. Sci. Biotechnol. 2015, 6, 52. [Google Scholar] [CrossRef]
  5. Zhou, X.; Liu, Y.; Zhang, L.; Kong, X.; Li, F. Serine-to-glycine ratios in low-protein diets regulate intramuscular fat by affecting lipid metabolism and myofiber type transition in the skeletal muscle of growing-finishing pigs. Anim. Nutr. 2021, 7, 384–392. [Google Scholar] [CrossRef]
  6. National Research Council. Nutrient Requirements of Swine, 10th ed.; National Academies Press: Washington, DC, USA, 1998. [Google Scholar]
  7. Jiang, S.; Quan, W.; Luo, J.; Lou, A.; Zhou, X.; Li, F.; Shen, Q.W. Low-protein diets supplemented with glycine improves pig growth performance and meat quality: An untargeted metabolomic analysis. Front. Vet. Sci. 2023, 10, 1170573. [Google Scholar] [CrossRef] [PubMed]
  8. Duarte, M.E.; Parnsen, W.; Zhang, S.; Abreu, M.L.T.; Kim, S.W. Low crude protein formulation with supplemental amino acids for its impacts on intestinal health and growth performance of growing-finishing pigs. J. Anim. Sci. Biotechnol. 2024, 15, 55. [Google Scholar] [CrossRef] [PubMed]
  9. Chen, H.; Yi, X.; Zhang, G.; Lu, N.; Chu, L.; Thacker, P.A.; Qiao, S. Studies on reducing nitrogen excretion: I. Net energy requirement of finishing pigs maximizing performance and carcass quality fed low crude protein diets supplemented with crystalline amino acids. J. Anim. Sci. Biotechnol. 2011, 2, 84–93. [Google Scholar]
  10. Le Bellego, L.; Noblet, J. Performance and utilization of dietary energy and amino acids in piglets fed low protein diets. Livest. Prod. Sci. 2002, 76, 45–58. [Google Scholar] [CrossRef]
  11. Le Bellego, L.; van Milgen, J.; Dubois, S.; Noblet, J. Energy utilization of low-protein diets in growing pigs. J. Anim. Sci. 2001, 79, 1259–1271. [Google Scholar] [CrossRef]
  12. AOAC. Official Methods of Analysis of AOAC International, 18th ed.; AOAC International: Gaithersburg, MD, USA, 2007. [Google Scholar]
  13. McCarthy, J.F.; Aherene, F.X.; Okai, D.B. Use of HCl insoluble ash as an index material for determining apparent digestibility with pigs. Can. J. Anim. Sci. 1974, 54, 107–109. [Google Scholar] [CrossRef]
  14. Diao, H.; Zheng, P.; Yu, B.; He, J.; Mao, X.B.; Yu, J.; Chen, D.W. Effects of dietary supplementation with benzoic acid on intestinal morphological structure and microflora in weaned piglets. Livest. Sci. 2014, 167, 249–256. [Google Scholar] [CrossRef]
  15. Yang, Y.X.; Mu, C.L.; Zhang, J.F.; Zhu, W.Y. Determination of biogenic amines in digesta by high performance liquid chromatography with precolumn dansylation. Anal. Lett. 2014, 47, 1290–1298. [Google Scholar] [CrossRef]
  16. Wang, X.F.; Mao, S.Y.; Liu, J.H.; Zhang, L.; Cheng, Y.; Jin, W.; Zhu, W. Effect of the gynosaponin on methane production and microbe numbers in a fungus-methanogen co-culture. J. Anim. Feed Sci. 2011, 20, 272–284. [Google Scholar] [CrossRef]
  17. Yu, M.; Li, Z.; Chen, W.; Rong, T.; Ma, X. Hermetia illucens larvae as a potential dietary protein source altered the microbiota and modulated mucosal immune status in the colon of finishing pigs. J. Anim. Sci. Biotechnol. 2019, 10, 50. [Google Scholar] [CrossRef]
  18. Yang, Z.; Urriola, E.P.; Johnston, J.L.; Shurson, G.C. A systems approach to evaluate nitrogen utilization efficiency and environmental impacts of swine growing-finishing feeding programs in U.S. pork production systems. J. Anim. Sci. 2023, 101, skad188. [Google Scholar] [CrossRef]
  19. Song, W.; Wu, Z.; Li, W.; Li, Y. Multiple amino acid supplementations to reduce dietary protein for pigs during early and late finisher periods under commercial conditions. J. Sci. Food Agric. 2023, 103, 3205–3209. [Google Scholar] [CrossRef] [PubMed]
  20. Rocha, G.C.; Duarte, M.E.; Kim, S.W. Advances, implications, and limitations of low-crude-protein diets in pig production. Animals 2022, 12, 3478. [Google Scholar] [CrossRef]
  21. Soto, J.A.; Tokach, M.D.; Dritz, S.S.; Woodworth, J.C.; Derouchey, J.M.; Goodband, B.D.; Wu, F. Optimal dietary standardized ileal digestible lysine and crude protein concentration for growth and carcass performance in finishing pigs weighing greater than 100 kg. J. Anim. Sci. 2019, 97, 1701–1711. [Google Scholar] [CrossRef]
  22. Soto, J.A.; Tokach, M.D.; Dritz, S.S.; Woodworth, J.C.; Derouchey, J.M.; Goodband, B.D. Dietary supplementation of choline and potassium in low crude protein diets on growth and carcass performance of finishing pigs. J. Anim. Sci. 2018, 96 (Suppl. S2), 126. [Google Scholar] [CrossRef]
  23. Fang, L.H.; Jin, Y.H.; Do, S.H.; Hong, J.S.; Kim, B.O.; Han, T.H.; Kim, Y.Y. Effects of dietary energy and crude protein levels on growth performance, blood profiles, and nutrient digestibility in weaning pigs. Asian Austral. J. Anim. 2019, 32, 556–563. [Google Scholar] [CrossRef]
  24. Niyonsaba, N.; Jin, X.J.; Kim, Y.K. Effect of reducing dietary crude protein level on growth performance, blood profiles, nutrient digestibility, carcass traits, and odor emissions in growing-finishing pigs. Anim. Biosci. 2023, 36, 1584–1595. [Google Scholar] [CrossRef]
  25. Munezero, O.; Kim, I.H. Effects of protease enzyme supplementation in weanling pigs’ diet with different crude protein levels on growth performance and nutrient digestibility. J. Anim. Sci. Technol. 2022, 64, 854–862. [Google Scholar] [CrossRef]
  26. Han, Y.G.; Lee, G.I.; Do, S.H.; Jang, J.C.; Kim, Y.Y. The effect of reduced crude protein on growth performance, nutrient digestibility, and meat quality in weaning to finishing pigs. Animals 2023, 13, 1938. [Google Scholar] [CrossRef]
  27. Lala, A.O.; Oso, A.O.; Osafo, E.L.K.; Houdijk, J.G.M.; Eyarefe, D.O. Effect of high concentration of phytase supplementation on energy and nutrient digestibility of growing pigs fed with reduced dietary crude protein balanced with limiting amino acids. Livest. Sci. 2020, 240, 104143. [Google Scholar] [CrossRef]
  28. Kohn, R.A.; Dinneen, M.M.; Russek-Cohen, E. Using blood urea nitrogen to predict nitrogen excretion and efficiency of nitrogen utilization in cattle, sheep, goats, horses, pigs, and rats. J. Anim. Sci. 2005, 83, 879–889. [Google Scholar] [CrossRef] [PubMed]
  29. Niyazov, N.S.A.; Cherepanov, G.G.; Ostrenko, K.S. Use of low-protein diets for growing pigs to reduce fecal nitrogen excretion. Ukr. J. Ecol. 2020, 10, 313–316. [Google Scholar] [CrossRef]
  30. Zhu, C.; Yang, J.; Wu, Q.; Chen, J.; Yang, X.; Wang, L.; Jiang, Z. Low protein diet improves meat quality and modulates the composition of gut microbiota in finishing pigs. Front. Vet. Sci. 2022, 9, 603. [Google Scholar] [CrossRef]
  31. Molist, F.; Pijlman, J.; van der Aar, P.J.; Rover, M.; Ensink, J.; Corrent, E. Effect of low crude protein diets on growth performance and carcass characteristics of grower-finisher pigs. J. Anim. Sci. 2016, 94, 226–229. [Google Scholar] [CrossRef]
  32. Zhang, L.; Li, F.; Guo, Q.; Duan, Y.; Wang, W.; Yang, Y.; Yin, Y.; Gong, S.; Han, M.; Yin, Y. Balanced branched-chain amino acids modulate meat quality by adjusting muscle fiber type conversion and intramuscular fat deposition in finishing pigs. J. Sci. Food Agric. 2022, 102, 3796–3807. [Google Scholar] [CrossRef]
  33. Wang, D.; Chen, G.; Chai, M.; Shi, C.; Geng, Y.; Che, Y.; Li, Y.; Liu, S.; Gao, Y.; Hou, H. Effects of dietary protein levels on production performance, meat quality and flavor of fattening pigs. Front. Nutr. 2022, 9, 910519. [Google Scholar] [CrossRef]
  34. Liu, S.H.; Xie, J.Y.; Fan, Z.Y.; Ma, X.K.; Yin, Y.L. Effects of low protein diet with a balanced amino acid pattern on growth performance, meat quality and cecal microflora of finishing pigs. J. Sci. Food Agric. 2023, 103, 957–967. [Google Scholar] [CrossRef]
  35. Wang, D.; Chen, G.; Li, W.; Chai, M.; Zhang, H.; Su, Y. Effects of low protein diet on production performance and intestinal microbial composition in pigs. Vet. Sci. 2023, 10, 655. [Google Scholar] [CrossRef]
  36. Wang, J.; Zhao, S.M.; Song, X.L.; Pan, H.B.; Li, W.Z.; Zhang, Y.Y.; Gao, S.Z.; Chen, D.W. Low protein diet up-regulate intramuscular lipogenic gene expression and down-regulate lipolytic gene expression in growth-finishing pigs. Livest. Sci. 2012, 148, 119–128. [Google Scholar] [CrossRef]
  37. Ross, F.C.; Patangia, D.; Grimaud, G.; Lavelle, A.; Dempsey, E.M.; Paul, R.R.; Stanton, C. The interplay between diet and the gut microbiome: Implications for health and disease. Nat. Rev. Microbiol. 2024, 22, 671–686. [Google Scholar] [CrossRef] [PubMed]
  38. Zhao, Y.; Tian, G.; Chen, D.; Zheng, P.; Yu, J.; He, J.; Mao, X.; Huang, Z.; Luo, Y.; Yu, B. Dietary protein levels and amino acid supplementation patterns alter the composition and functions of colonic microbiota in pigs. Anim. Nutr. 2020, 6, 143–151. [Google Scholar] [CrossRef]
  39. Wang, Y.; Han, S.; Zhou, J.; Li, P.; Wang, G.; Yu, H.; Cai, S.; Zeng, X.; Johnston, L.J.; Levesque, C.L.; et al. Effects of dietary crude protein level and N-carbamylglutamate supplementation on nutrient digestibility and digestive enzyme activity of jejunum in growing pigs. J. Anim. Sci. 2020, 98, skaa088. [Google Scholar] [CrossRef] [PubMed]
  40. Lan, T.Y.; Cai, M.Y.; Wang, S.S.; Lu, Y.Y.; Tang, Z.R.; Tang, Q.S.; Gao, J.C.; Xu, Y.T.; Peng, X.; Sun, Z.H. Effects of adding niacinamide to diets with normal and low protein levels on the immunity, antioxidant, and intestinal microbiota in growing-finishing pigs. J. Nutr. Biochem. 2025, 136, 109809. [Google Scholar] [CrossRef] [PubMed]
  41. Webb, J.; Broomfield, M.; Jones, S.; Donovan, B. Ammonia and odour emissions from UK pig farms and nitrogen leaching from outdoor pig production. a review. Sci. Total Environ. 2014, 470, 865–875. [Google Scholar] [CrossRef] [PubMed]
  42. Fan, P.; Li, L.; Rezaei, A.; Eslamfam, S.; Che, D.; Ma, X. Metabolites of dietary protein and peptides by intestinal microbes and their impacts on gut. Curr. Protein Pept. Sci. 2015, 16, 646–654. [Google Scholar] [CrossRef] [PubMed]
  43. Yu, D.; Zhu, W.; Hang, S. Effects of low-protein diet on the intestinal morphology, digestive enzyme activity, blood urea nitrogen, and gut microbiota and metabolites in weaned pigs. Arch. Anim. Nutr. 2019, 73, 287–305. [Google Scholar] [CrossRef]
  44. Lee, J.Y.; Htoo, J.K.; Kluenemann, M.; González-Vega, J.C.; Nyachoti, C.M. Effects of dietary protein content and crystalline amino acid supplementation patterns in low protein diets on intestinal bacteria and their metabolites in weaned pigs raised under different sanitary conditions. J. Anim. Sci. 2023, 101, skad252. [Google Scholar] [CrossRef]
  45. Lee, J.Y.; González-Vega, J.C.; Htoo, J.K.; Nyachoti, C.M. Effects of dietary crude protein content and resistant starch supplementation on growth performance, intestinal histomorphology and microbial metabolites in weaned pigs. Arch. Anim. Nutr. 2024, 78, 191–206. [Google Scholar] [CrossRef] [PubMed]
  46. Cho, S.; Hwang, O.; Park, S. Effect of dietary protein levels on composition of odorous compounds and bacterial ecology in pig manure. Asian. Austral. J. Anim. 2015, 28, 1362–1370. [Google Scholar]
  47. Zhang, C.; Yu, M.; Yang, Y.; Mu, C.; Su, Y.; Zhu, W. Effect of early antibiotic administration on cecal bacterial communities and their metabolic profiles in pigs fed diets with different protein levels. Anaerobe 2016, 42, 188–196. [Google Scholar] [CrossRef] [PubMed]
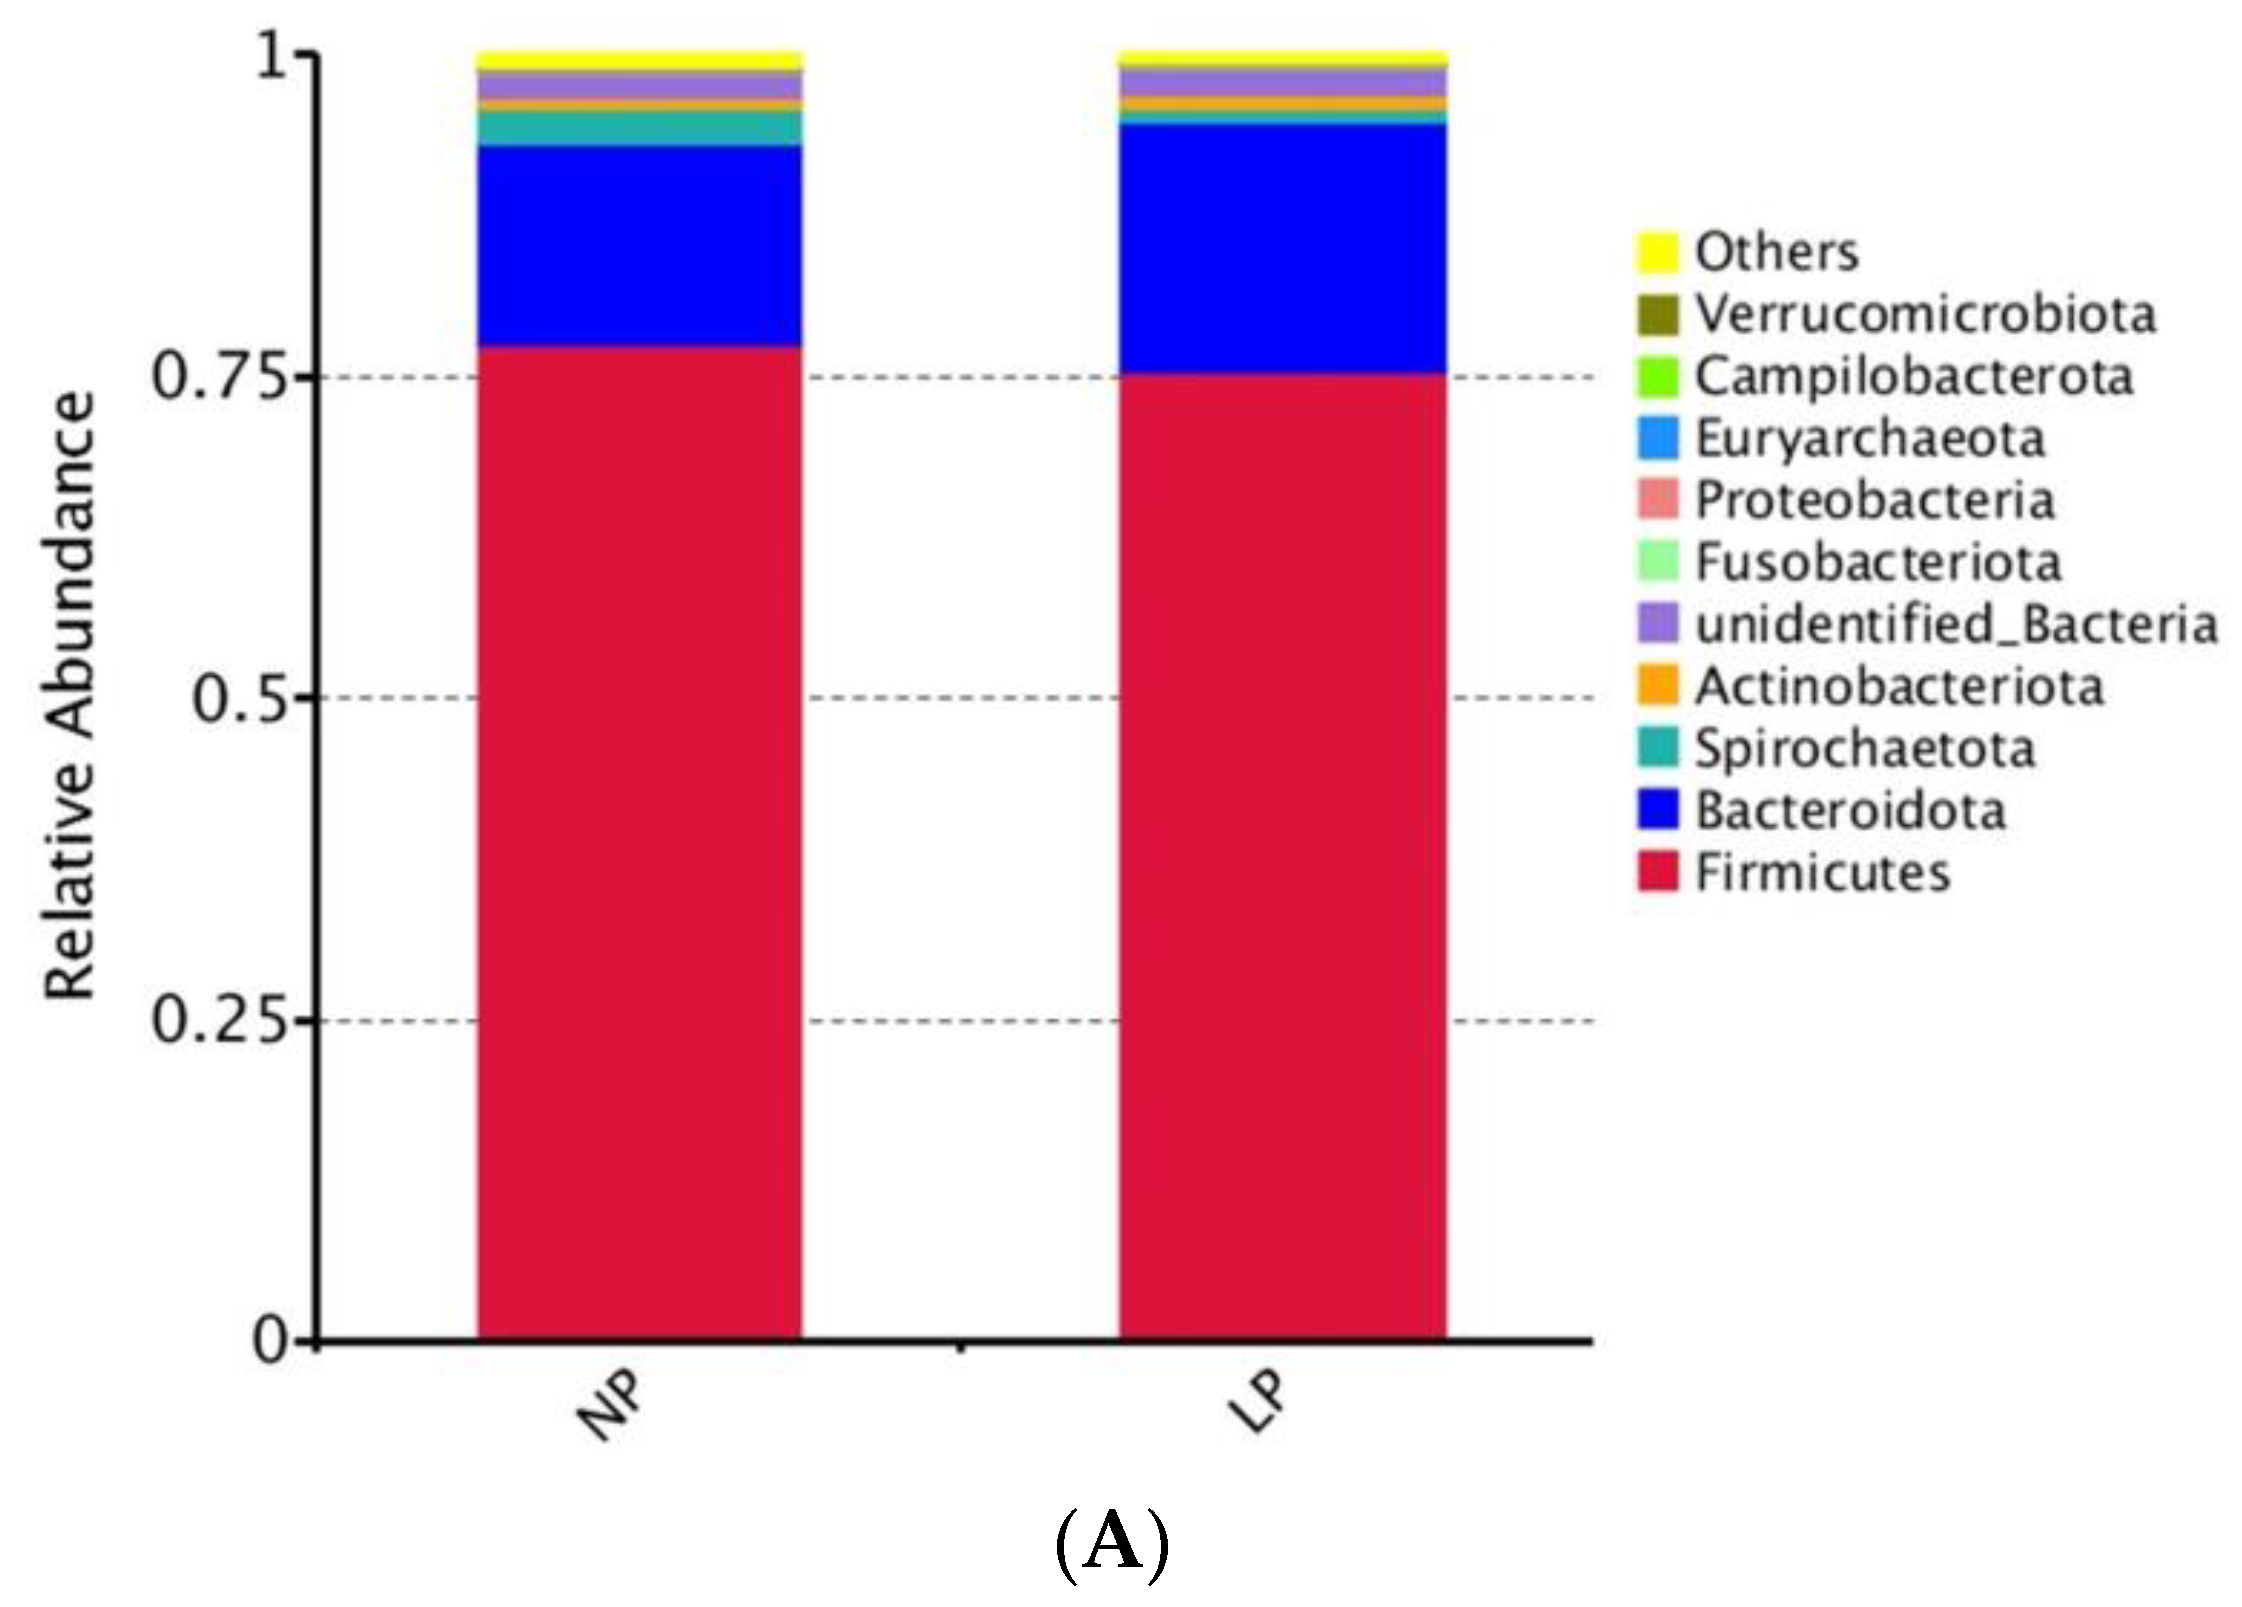
Figure 1. Effect of LP diet on the relative abundance of fecal microbiota composition at phylum (A), family (B), and genus (C) levels in late-fattening barrows.
Animals 15 02465 g001aAnimals 15 02465 g001b
Figure 2. Effect of LP diet on fecal malodorous compounds in late-fattening barrows. (A) Biological amines. (B) NH3-N. (C) Volatile fatty acids. (D) Phenolic compounds. (E) Indole-related compounds. * for p < 0.05, ** for p < 0.01.
Animals 15 02465 g002aAnimals 15 02465 g002b
Table 1. Composition and nutrient levels of experimental diets (as-fed basis).
ItemPhase ⅠPhase Ⅱ
NPLPNPLP
Ingredients
Corn, %71.8078.5074.0081.50
Soybean meal, %13.355.4010.903.10
Wheat middling, %4.004.004.004.00
Rapeseed meal, %2.002.002.002.00
Extruded corn, % 3.953.743.792.92
Soybean oil, %1.971.871.891.46
Zeolite, %1.712.742.242.92
Limestone, %0.900.900.900.90
CaHPO4, %0.500.500.500.50
Salt, %0.400.400.400.40
L-Lys·HCl, %0.290.520.210.43
L-Thr, %0.080.180.050.15
L-Trp, %0.010.050.010.04
DL-Met, %0.010.070.000.03
L-Val, %0.000.000.000.06
L-Ile, %0.000.000.000.05
Premix 1,2, %1.001.001.001.00
Total, % 100.00100.00100.00100.00
Nutrient levels 3
NE, MJ/kg10.3610.3610.3610.36
CP, %13.8611.4212.6810.46
Calcium, %0.720.690.740.68
Total phosphorus, %0.620.590.580.54
Standardized ileal digestible (SID) amino acid
SID Lys, %0.730.730.610.61
SID Met, %0.210.240.190.19
SID Cys, %0.220.180.210.17
SID Thr, %0.460.460.400.40
SID Trp, %0.130.130.110.11
SID Val, %0.490.480.460.41
SID Ile, %0.430.390.400.33
1 The premix provided the following per kg of feed (days 1–28): Fe (as ferrous sulfate), 62 mg; Cu (as copper sulfate), 6 mg; Zn (as oxide zinc), 24 mg; Mn (as manganese sulfate), 14 mg; Se (as sodium selenite), 0.06 mg; I (as potassium iodide), 0.15 mg; VA 8000 IU, VD3 1000 IU, VE 25 IU, VK3, 2.5 mg; VB1, 1.19 mg; VB2, 3.8 mg; VB6, 3.1 mg; VB12, 32 μg; nicotinic acid, 32 mg; pantothenic acid, 25 mg; biotin, 185 μg; folic acid, 1.5 mg. 2 The premix provided the following per kg of feed (days 29–55): Fe (as ferrous sulfate), 57 mg; Cu (as copper sulfate), 5 mg; Zn (as oxide zinc), 23 mg; Mn (as manganese sulfate), 13 mg; Se (as sodium selenite), 0.06 mg; I (as potassium iodide), 0.15 mg; VA, 6500 IU; VD3, 800 IU; VE, 85 IU; VK3, 2 mg; VB1, 0.98 mg; VB2, 3.2 mg; VB6, 2.5 mg; VB12, 26 μg; nicotinic acid, 26 mg; pantothenic acid, 20 mg; biotin, 156 μg; folic acid, 1.2 mg. 3 CP, calcium, and total phosphorus were measured values; the others were calculated values.
Table 2. Effect of LP diet on growth performance in late-fattening barrows.
ItemGroup p-Value
NPLP
Initial body weight, kg76.23 ± 6.8176.38 ± 6.460.935
Phase Ⅰ (days 1–28)
Final body weight, kg107.3 ± 8.85107.8 ± 9.190.834
ADG, kg/d1.15 ± 0.161.16 ± 0.180.820
ADFI, kg/d3.85 ± 0.313.97 ± 0.470.762
Feed-to-gain ratio3.37 ± 0.333.40 ± 0.270.869
Phase Ⅱ (days 29–55)
Final body weight, kg135.5 ± 10.31138.6 ± 11.100.312
ADG, kg/d1.05 ± 0.121.14 ± 0.180.036
ADFI, kg/d4.01 ± 0.234.14 ± 0.240.437
Feed-to-gain ratio3.83 ± 0.153.64 ± 0.320.260
Whole period
ADG, kg/d1.10 ± 0.111.15 ± 0.150.150
ADFI, kg/d3.93 ± 0.244.05 ± 0.340.549
Feed-to-gain ratio3.58 ± 0.213.51 ± 0.230.626
Table 3. Effect of LP diet on nutrient digestibility in late-fattening barrows.
ItemsGroupp-Value
NPLP
Dry matter, %94.15 ± 0.3695.13 ± 0.420.004
CP, %80.83 ± 0.7984.24 ± 0.570.000
EE, %74.96 ± 4.3178.43 ± 2.630.163
Ca, %54.24 ± 2.8164.30 ± 3.400.001
P, %47.98 ± 2.8252.11 ± 2.160.032
Table 4. Effect of LP diet on serum biochemical indices in late-fattening barrows.
ItemGroupp-Value
NPLP
TP, g/L61.23 ± 4.3462.34 ± 2.920.535
BUN, mmol/L8.54 ± 1.126.67 ± 1.100.001
GLU, mmol/L3.31 ± 0.653.52 ± 0.490.425
TG, mmol/L0.48 ± 0.100.51 ± 0.060.393
TCHO, mmol/L1.71 ± 0.141.20 ± 0.310.022
NEFA, mmol/L0.12 ± 0.030.19 ± 0.030.000
Table 5. Effect of LP diet on carcass traits and meat quality in late-fattening barrows.
ItemGroupp-Value
NPLP
Dressing percentage, %81.91 ± 1.3582.44 ± 1.150.370
Average back fat, cm3.63 ± 0.543.66 ± 0.480.910
Lean meat rate, %58.33 ± 0.3358.44 ± 0.490.597
pH24h value5.59 ± 0.165.67 ± 0.120.359
Meat color L* value55.03 ± 3.9955.34 ± 2.480.877
Meat color a* value17.19 ± 0.9417.45 ± 0.690.606
Meat color b* value4.79 ± 0.344.46 ± 0.590.334
Shear force, N36.10 ± 4.8938.57 ± 4.930.477
Drip loss, % 4.35 ± 1.125.24 ± 1.670.371
Cooking loss, %16.51 ± 3.9614.54 ± 1.810.278
Milling loss, %38.22 ± 4.6138.93 ± 3.460.774
Intramuscular fat, %1.71 ± 0.752.30 ± 0.860.285
Table 6. Effect of LP diet on fecal microbiota α-diversity in late-fattening barrows.
ItemGroupp-Value
NPLP
Shannon5.66 ± 0.225.42 ± 0.170.058
Simpson0.93 ± 0.020.92 ± 0.010.751
Chao1734.49 ± 25.12745.08 ± 29.070.480
ACE743.63 ± 28.64739.54 ± 32.020.800
Observed species688.71 ± 28.08679.78 ± 32.150.570
Disclaimer/Publisher’s Note: The statements, opinions and data contained in all publications are solely those of the individual author(s) and contributor(s) and not of MDPI and/or the editor(s). MDPI and/or the editor(s) disclaim responsibility for any injury to people or property resulting from any ideas, methods, instructions or products referred to in the content.