Spatiotemporal Risk Assessment of H5 Avian Influenza in China: An Interpretable Machine Learning Approach to Uncover Multi-Scale Drivers
Simple Summary
Abstract
1. Introduction
- To employ a powerful gradient boosting algorithm (XGBoost) [13] to capture complex, nonlinear driver responses and elucidate the hierarchical structure of risk, distinguishing between foundational macro-scale contexts and transient micro-scale triggers;
- To leverage the SHAP (SHapley Additive exPlanations) framework to explicitly quantify the magnitude and form of both nonlinear relationships and synergistic interactions among key drivers;
- To synthesize these complex model insights into a practical, high-resolution national risk map to inform targeted interventions.
2. Materials and Methods
2.1. Avian Influenza Outbreak Data
2.2. Environmental and Ecological Predictors
2.2.1. Meteorological Data
2.2.2. Poultry Density Data
2.2.3. Köppen–Geiger Climate Classification Data
2.2.4. Important Bird and Biodiversity Area (IBA) Data
- A binary variable was created to indicate whether an outbreak occurred directly within an IBA polygon;
- For outbreaks located outside these zones, the Euclidean distance (in kilometers) to the boundary of the nearest IBA was calculated.
2.3. Feature Engineering and Selection
2.4. Interpretable Machine Learning Model
2.5. Model Validation and Diagnostics
3. Results
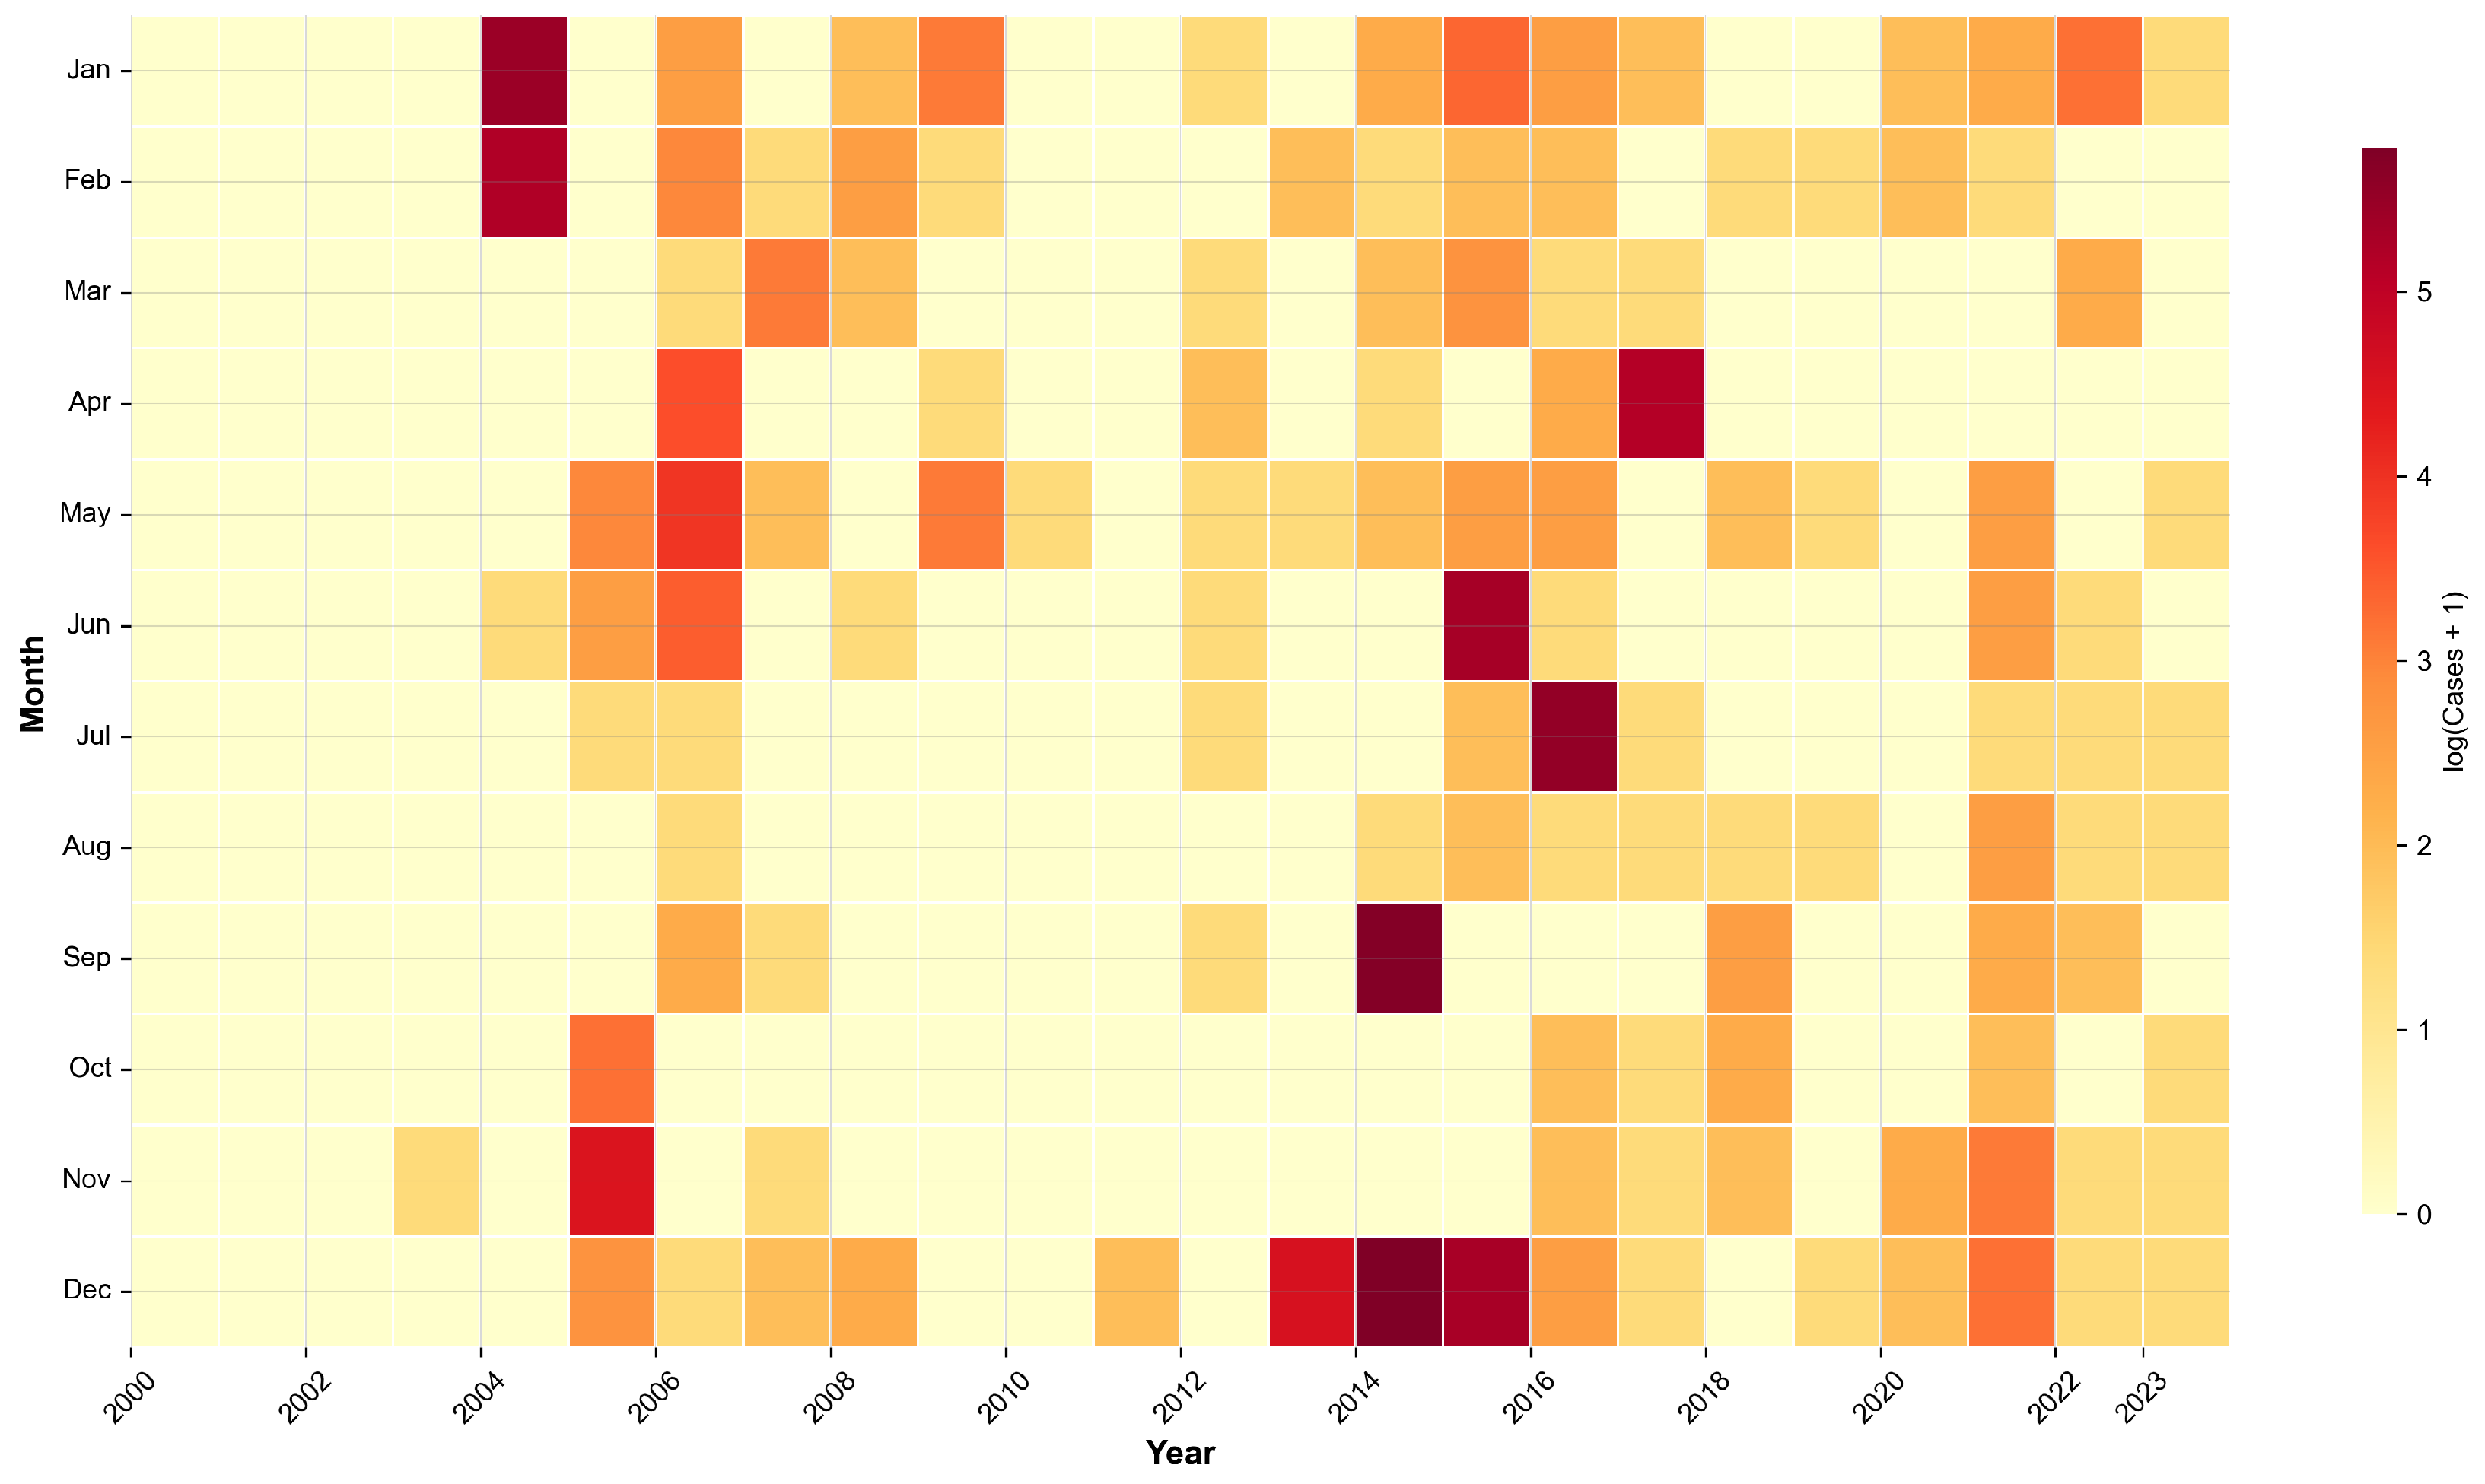
3.1. Descriptive Analysis: Spatiotemporal Overview of Outbreaks
3.2. Predictive Performance
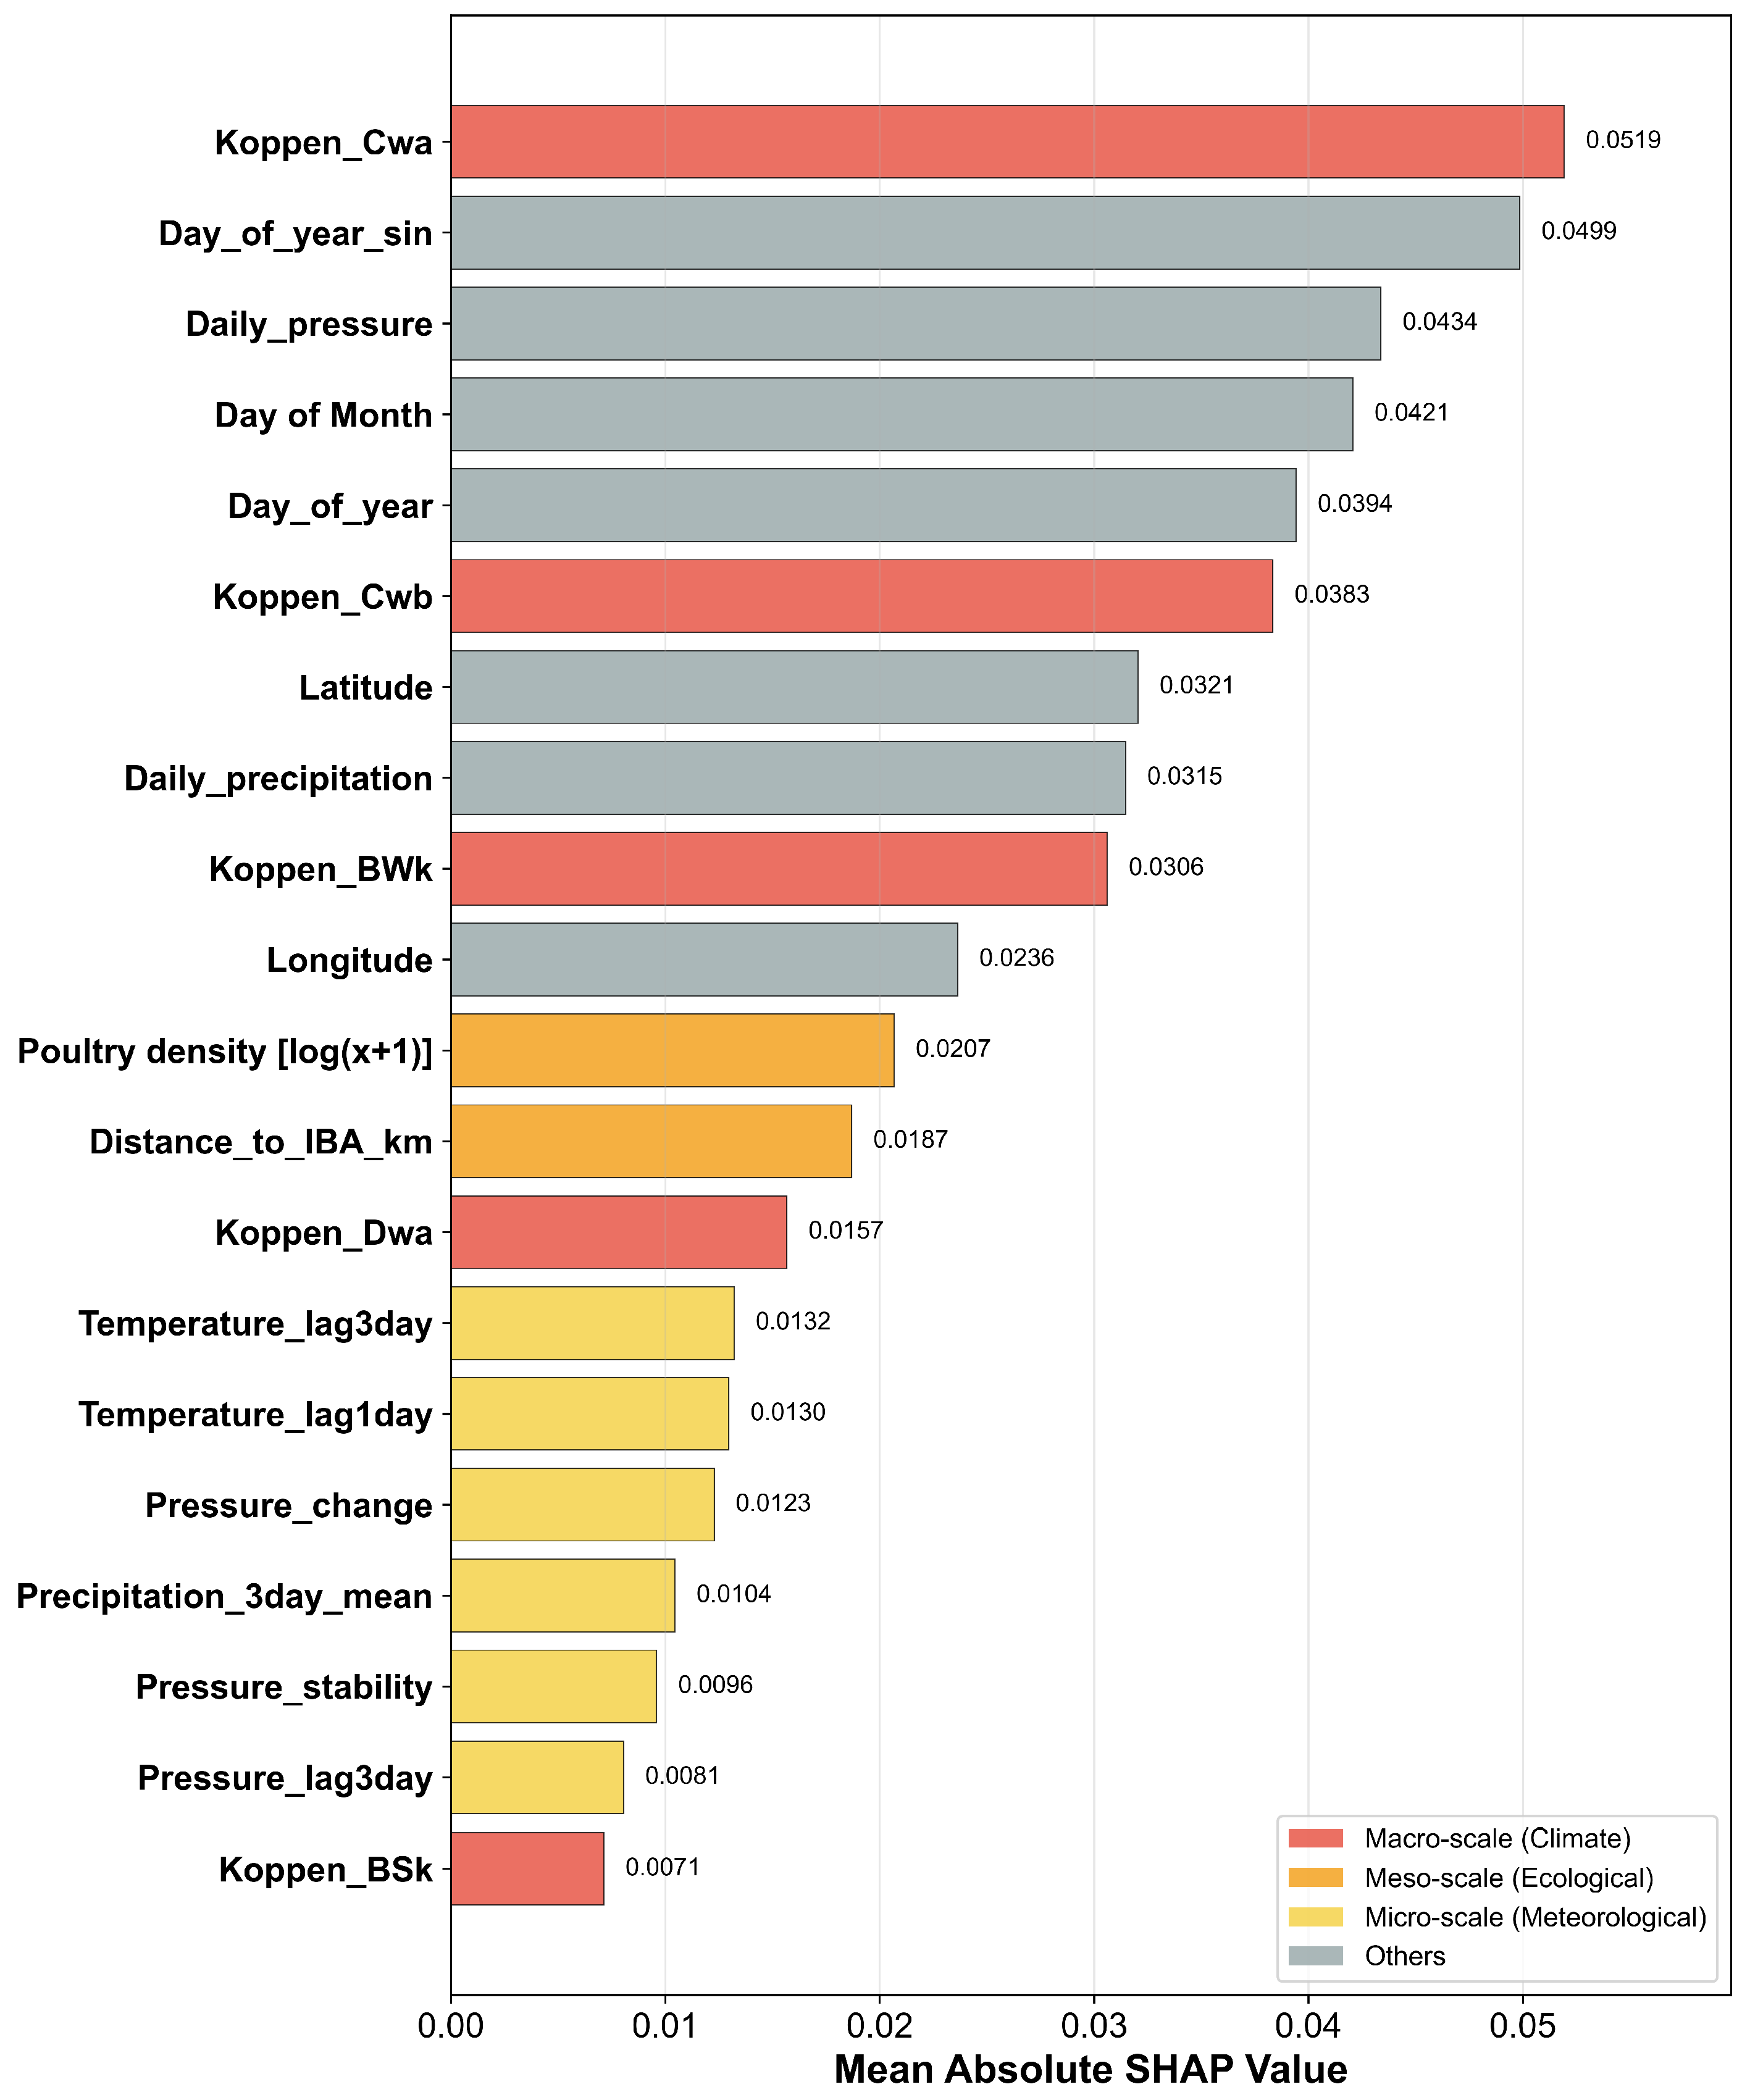
3.3. Identification of Key Drivers of Avian Influenza Risk
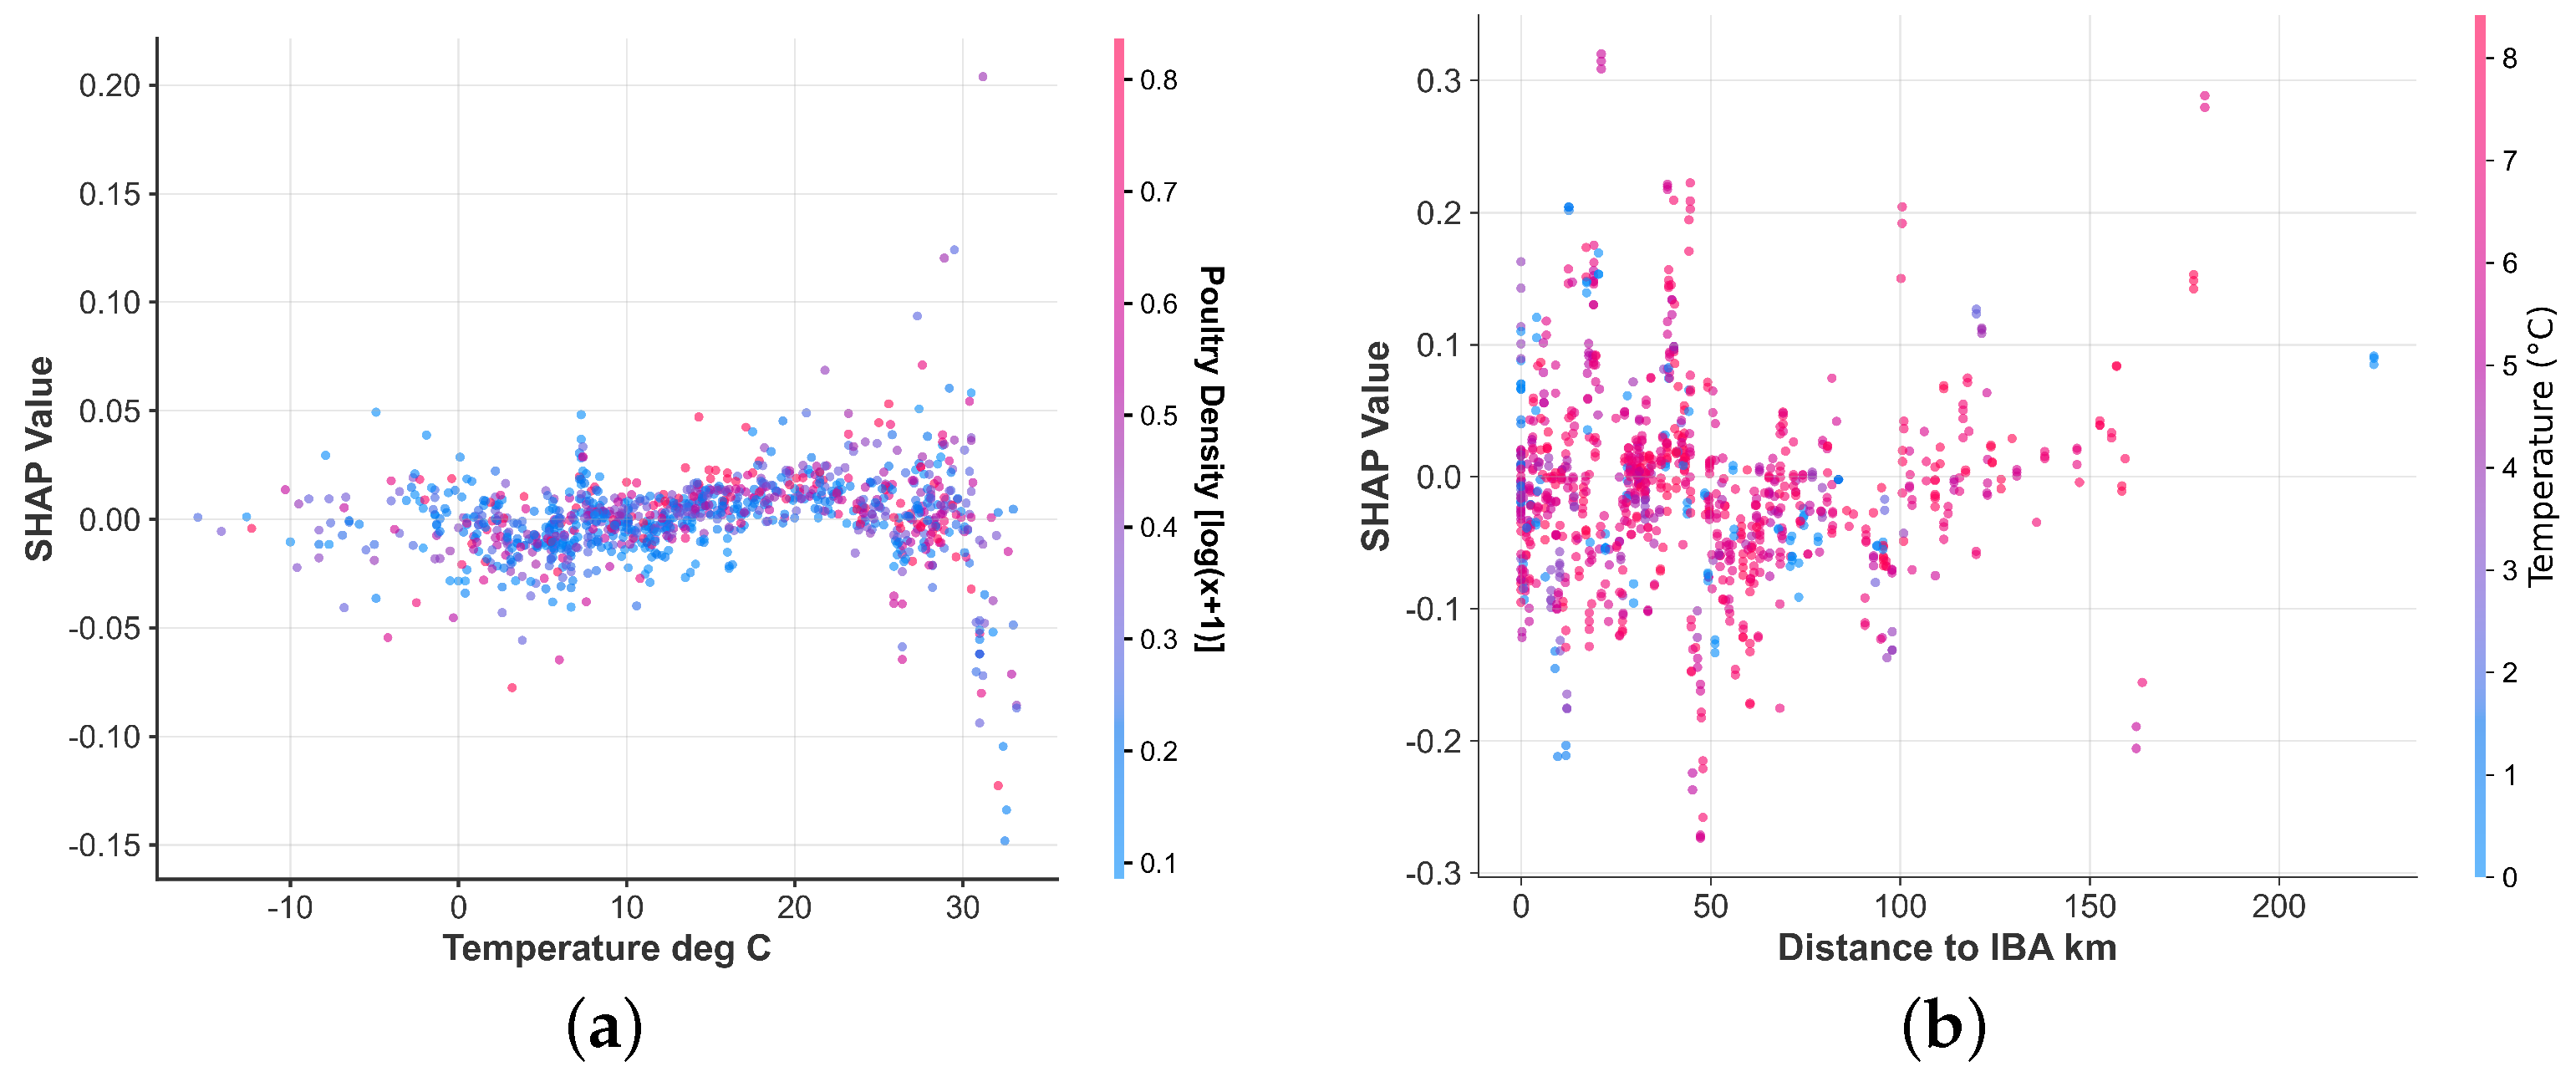
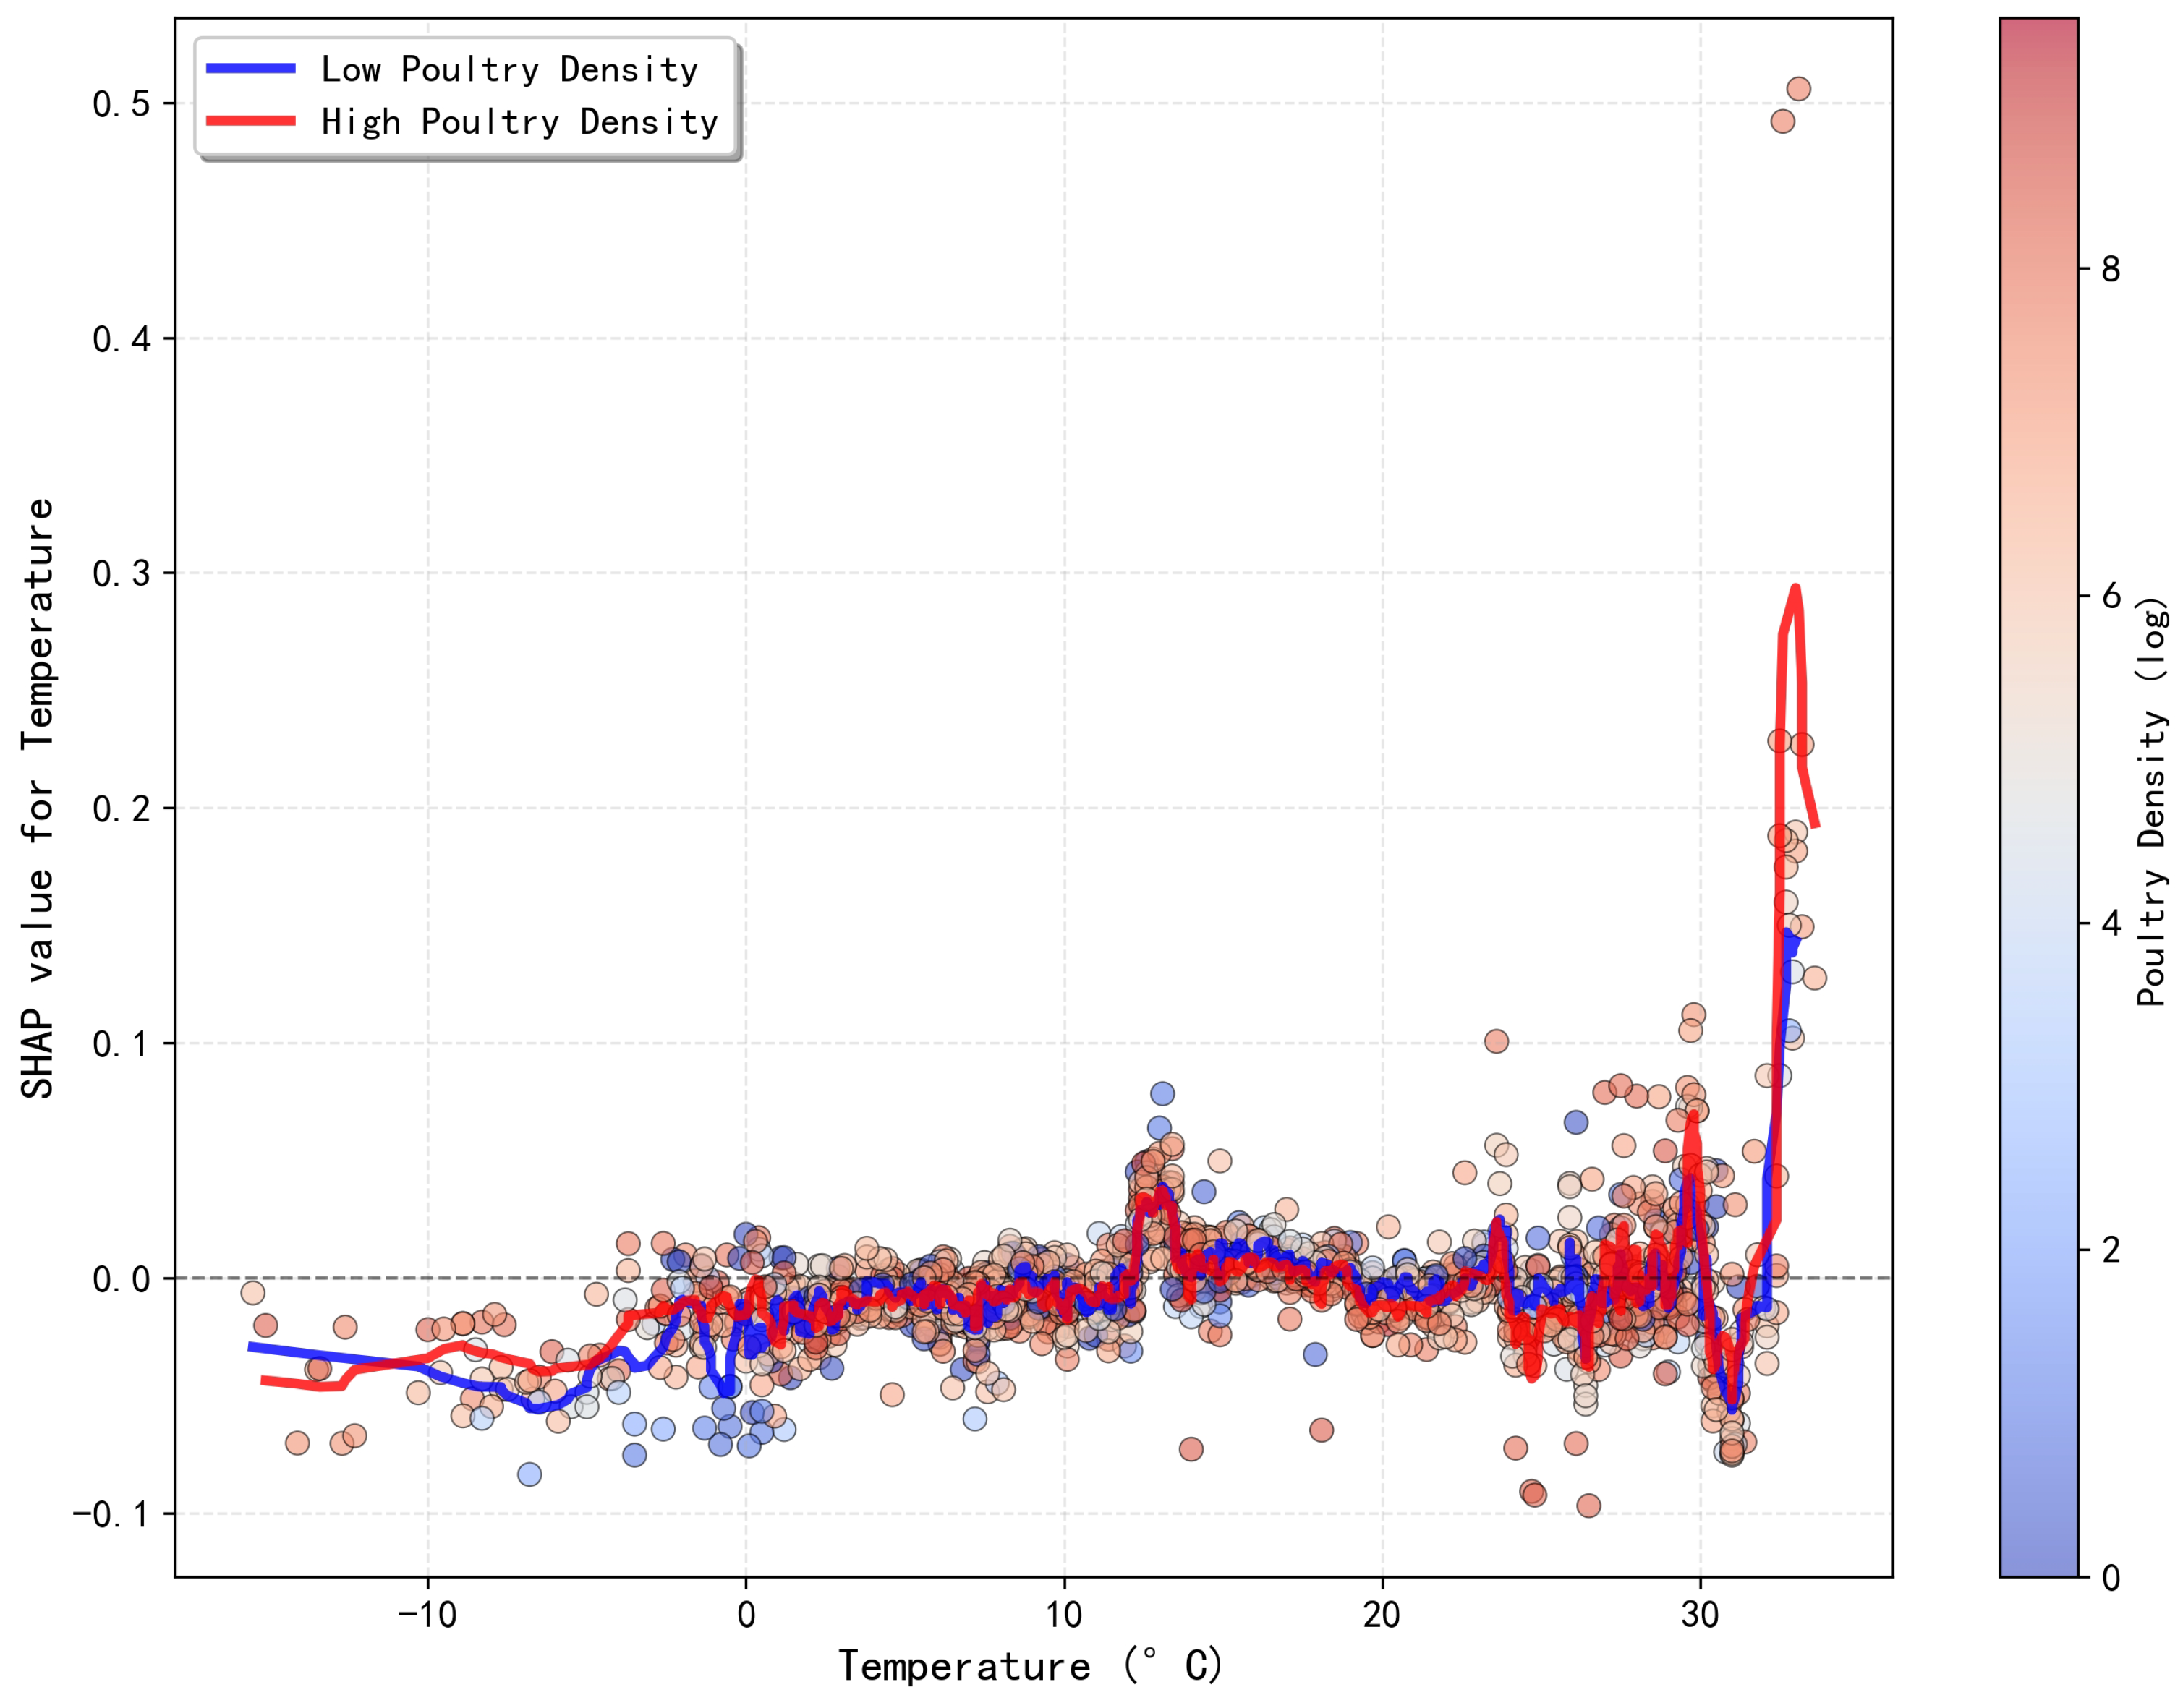
3.4. Nonlinear Effects and Risk Windows of Key Drivers
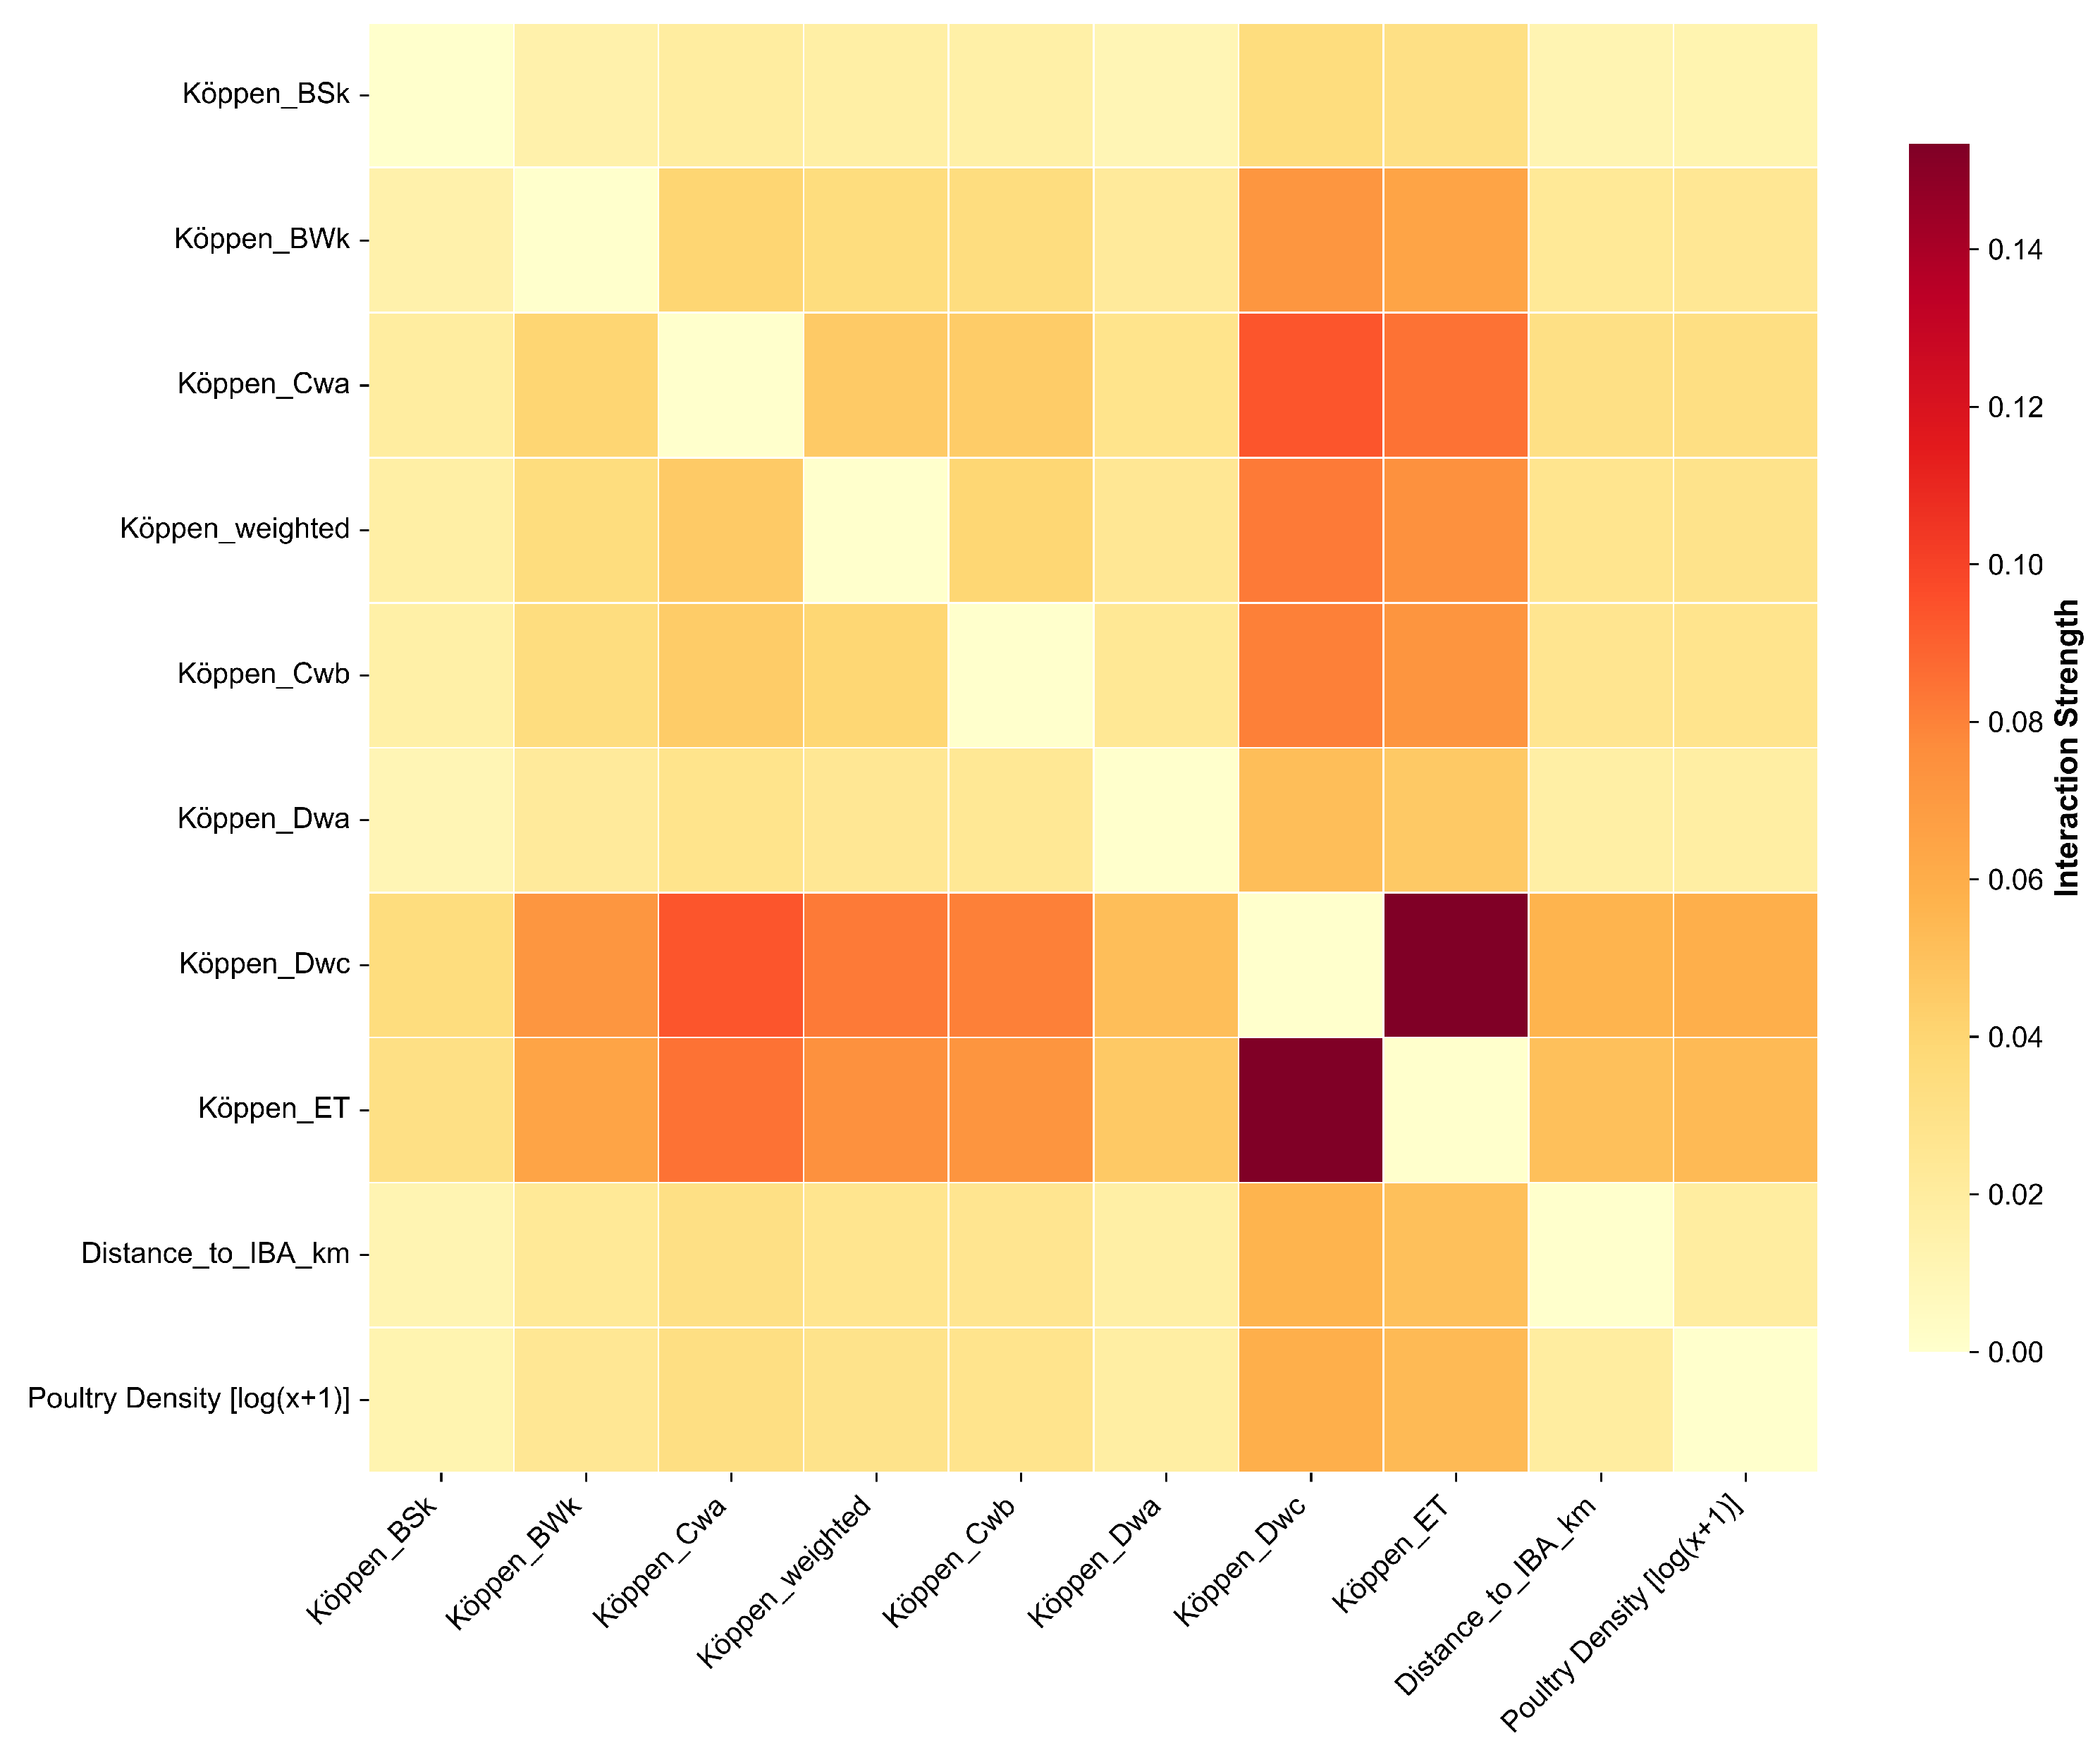
3.5. Synergistic Effects Among Key Drivers
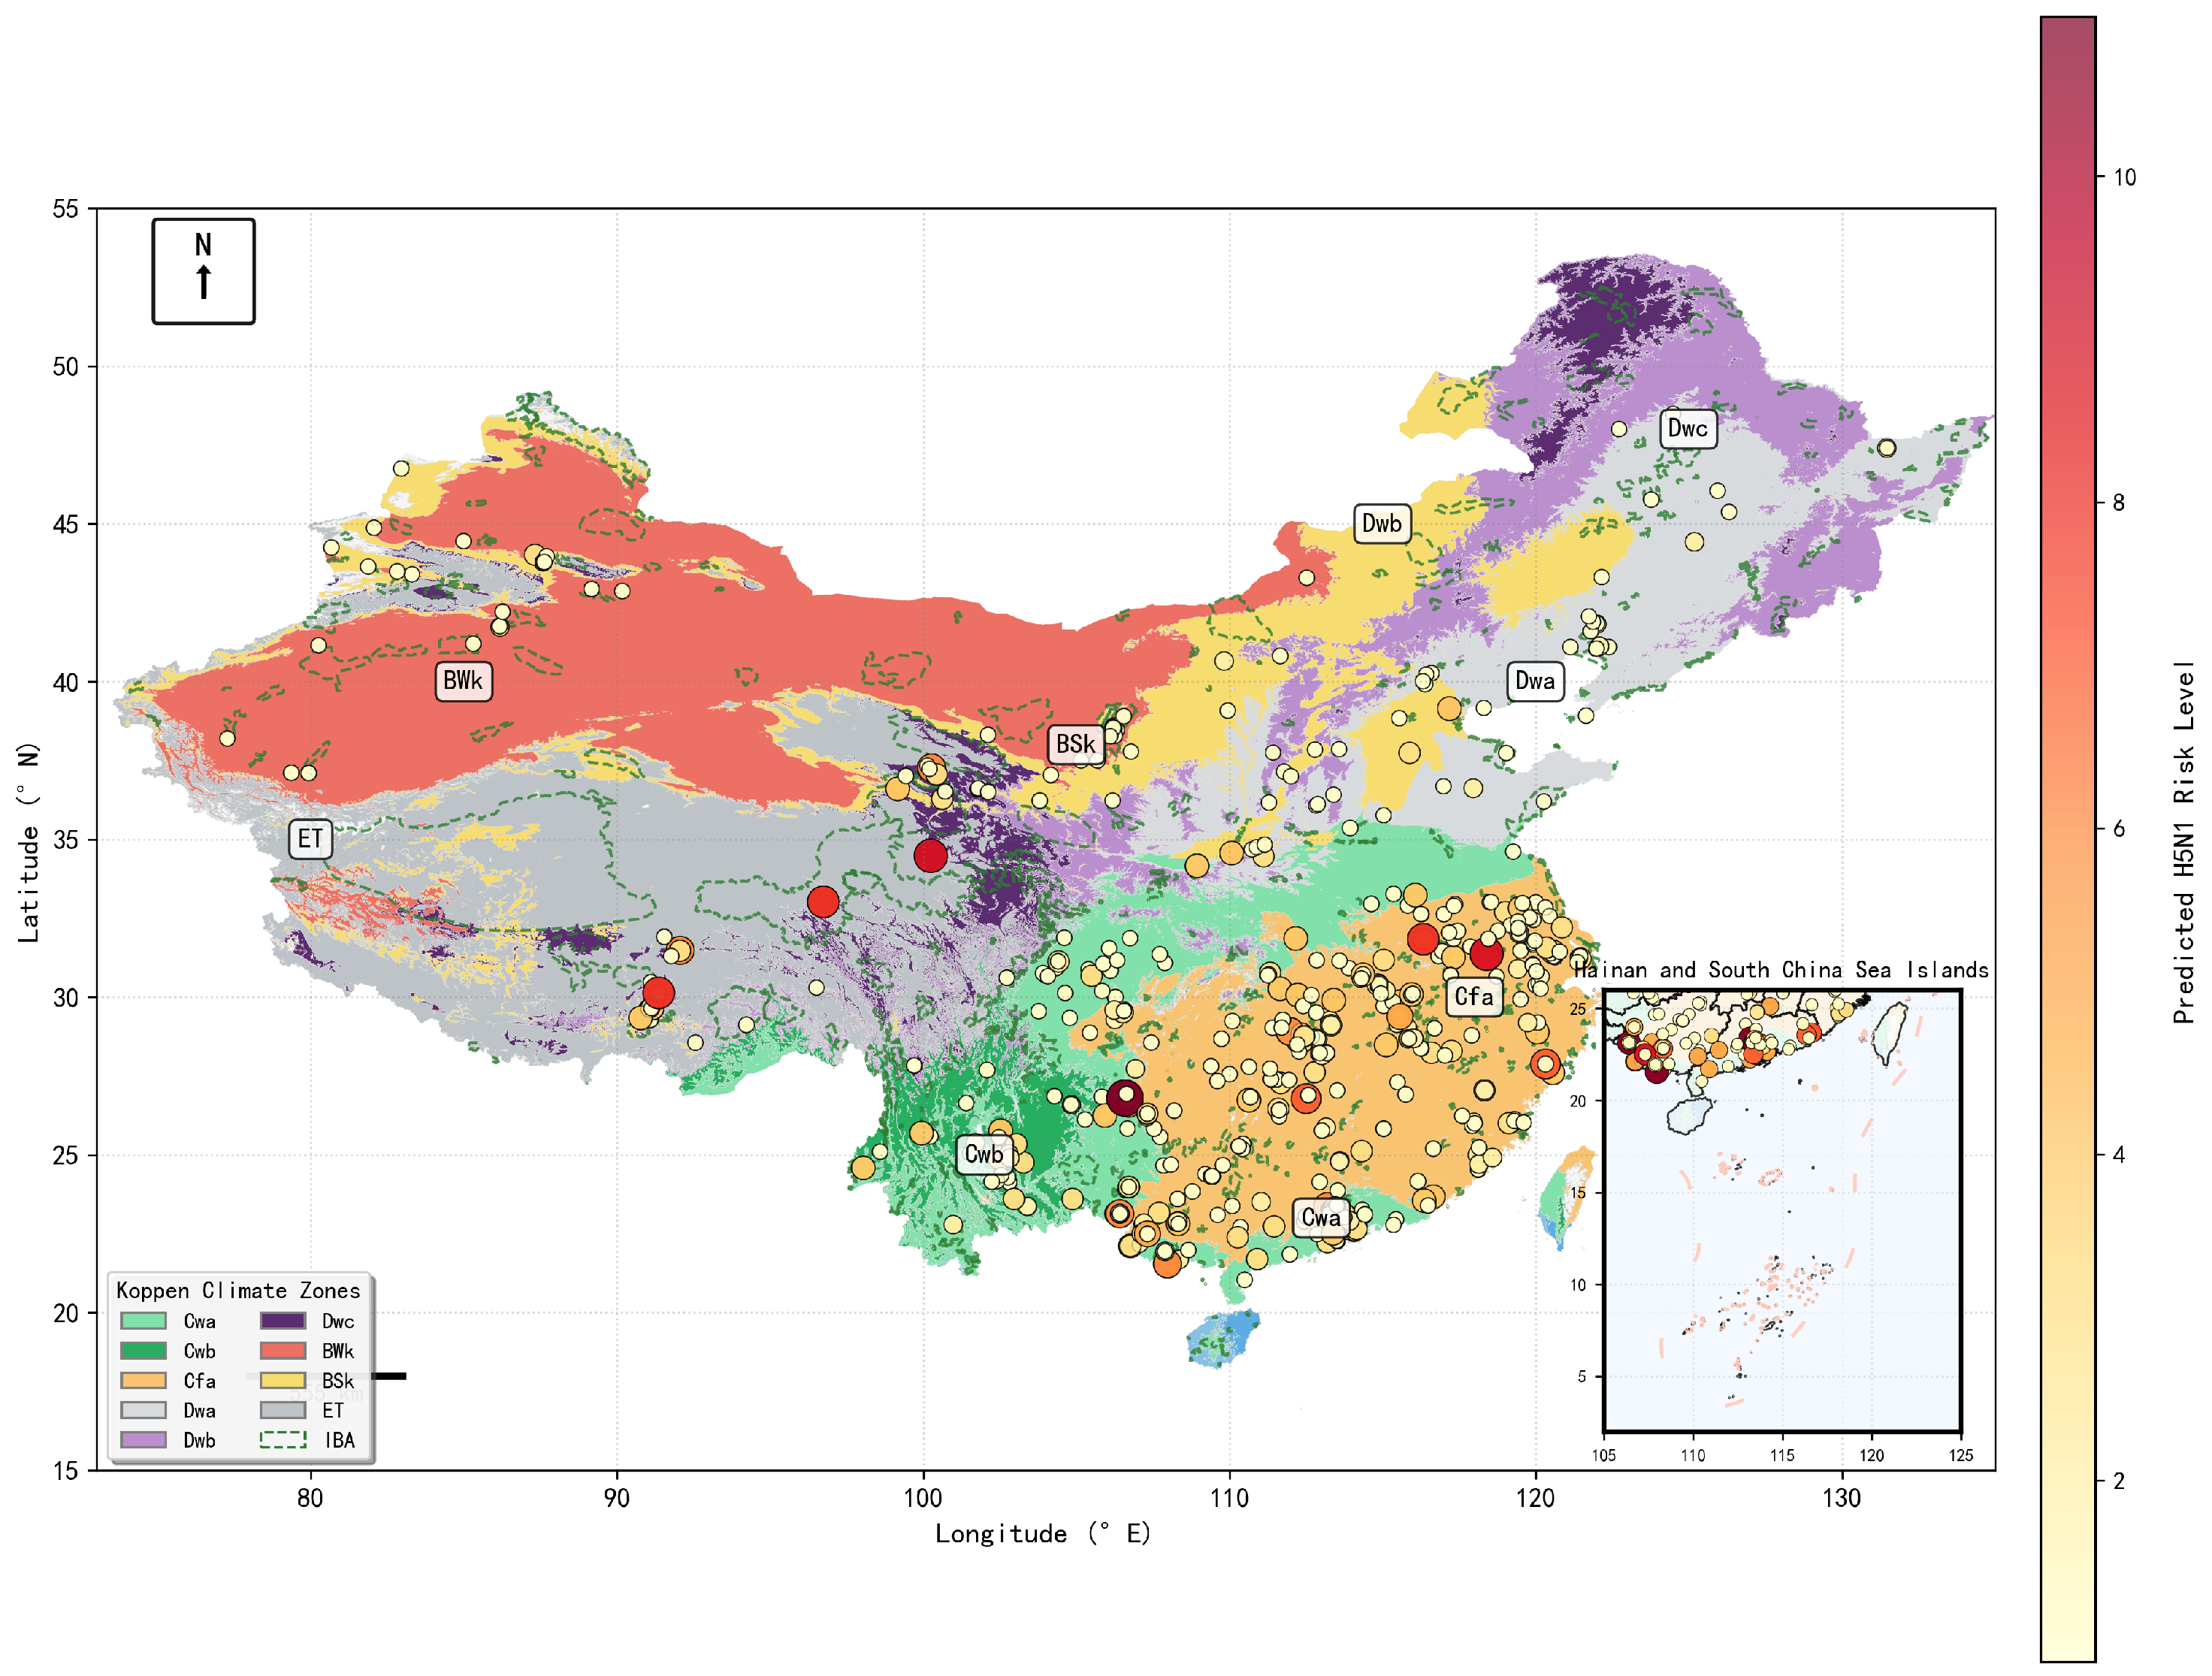
3.6. High-Resolution Spatiotemporal Risk Mapping
4. Discussion
4.1. Advantages of the Study
4.2. Limitations
4.3. Future Perspectives
5. Conclusions
Author Contributions
Funding
Institutional Review Board Statement
Informed Consent Statement
Data Availability Statement
Acknowledgments
Conflicts of Interest
Abbreviations
| AI | Avian Influenza |
| HPAI | Highly Pathogenic Avian Influenza |
| FAO | Food and Agriculture Organization |
| EMPRES-i | Global Animal Disease Information System |
| CMA | China Meteorological Administration |
| GLW | Gridded Livestock of the World |
| IBA | Important Bird and Biodiversity Area |
| XGBoost | Extreme Gradient Boosting |
| SHAP | SHapley Additive exPlanations |
| CV | Cross-Validation |
| RMSE | Root Mean Square Error |
| MAE | Mean Absolute Error |
| VIF | Variance Inflation Factor |
Appendix A. Model Hyperparameters
| Hyperparameter | Final Value |
|---|---|
| n_estimators | 750 |
| max_depth | 4 |
| learning_rate | 0.0875 |
| min_child_weight | 2 |
| subsample | 0.9106 |
| colsample_bytree | 0.8703 |
| reg_alpha | 0.2717 |
| reg_lambda | 0.7399 |
| gamma | 0.0034 |
| scale_pos_weight | 0.975 |
| max_delta_step | 0 |
| objective | ‘count:poisson’ |
| random_state | 42 |
| n_jobs | 1 |
References
- Wu, A.Q.; Li, K.L.; Song, Z.Y.; Lou, X.; Hu, P.; Yang, W.; Wang, R.F. Deep Learning for Sustainable Aquaculture: Opportunities and Challenges. Sustainability 2025, 17, 5084. [Google Scholar] [CrossRef]
- Yang, Z.X.; Li, Y.; Wang, R.F.; Hu, P.; Su, W.H. Deep Learning in Multimodal Fusion for Sustainable Plant Care: A Comprehensive Review. Sustainability 2025, 17, 5255. [Google Scholar] [CrossRef]
- Geier, D.A.; Kern, J.K.; Geier, M.R. A Longitudinal Ecological Study of Seasonal Influenza Deaths in Relation to Climate Conditions in the United States from 1999 through 2011. Infect. Ecol. Epidemiol. 2018, 8, 1474708. [Google Scholar] [CrossRef] [PubMed]
- Su, W.; Liu, T.; Geng, X.; Yang, G. Seasonal Pattern of Influenza and the Association with Meteorological Factors Based on Wavelet Analysis in Jinan City, Eastern China, 2013–2016. PeerJ 2020, 8, e8626. [Google Scholar] [CrossRef] [PubMed]
- Yang, Z.Y.; Xia, W.K.; Chu, H.Q.; Su, W.H.; Wang, R.F.; Wang, H. A comprehensive review of deep learning applications in cotton industry: From field monitoring to smart processing. Plants 2025, 14, 1481. [Google Scholar] [CrossRef]
- Wang, R.F.; Su, W.H. The application of deep learning in the whole potato production Chain: A Comprehensive review. Agriculture 2024, 14, 1225. [Google Scholar] [CrossRef]
- Wang, Z.; Zhang, H.W.; Dai, Y.Q.; Cui, K.; Wang, H.; Chee, P.W.; Wang, R.F. Resource-Efficient Cotton Network: A Lightweight Deep Learning Framework for Cotton Disease and Pest Classification. Plants 2025, 14, 2082. [Google Scholar] [CrossRef]
- Choi, Y.W.; Tuel, A.; Eltahir, E.A.B. On the Environmental Determinants of COVID-19 Seasonality. Geohealth 2021, 5, e2021GH000413. [Google Scholar] [CrossRef]
- Gass, J.D.; Hill, N.J.; Damodaran, L.; Naumova, E.N.; Nutter, F.B.; Runstadler, J.A. Ecogeographic Drivers of the Spatial Spread of Highly Pathogenic Avian Influenza Outbreaks in Europe and the United States, 2016-Early 2022. Int. J. Environ. Res. Public Health 2023, 20, 6030. [Google Scholar] [CrossRef]
- The Lancet Infectious Diseases. What is the Pandemic Potential of Avian Influenza A(H5N1)? Lancet Infect. Dis. 2024, 24, 437. [Google Scholar] [CrossRef]
- Zhu, H.; Qi, F.; Wang, X.; Zhang, Y.; Chen, F.; Cai, Z.; Chen, Y.; Chen, K.; Chen, H.; Xie, Z.; et al. Study of the Driving Factors of the Abnormal Influenza A (H3N2) Epidemic in 2022 and Early Predictions in Xiamen, China. BMC Infect. Dis. 2024, 24, 1093. [Google Scholar] [CrossRef]
- Martin, V.; Pfeiffer, D.U.; Zhou, X.; Xiao, X.; Prosser, D.J.; Guo, F.; Gilbert, M. Spatial Distribution and Risk Factors of Highly Pathogenic Avian Influenza (HPAI) H5N1 in China. PLoS Pathog. 2011, 7, e1001308. [Google Scholar] [CrossRef] [PubMed]
- Chen, T.; Guestrin, C. XGBoost: A Scalable Tree Boosting System. In Proceedings of the 22nd ACM SIGKDD International Conference on Knowledge Discovery and Data Mining, San Francisco, CA, USA, 13–17 August 2016; pp. 785–794. [Google Scholar] [CrossRef]
- World Organisation for Animal Health (WOAH). Chapter 3.3.4: Avian influenza (including infection with high pathogenicity avian influenza viruses). In Manual of Diagnostic Tests and Vaccines for Terrestrial Animals; World Organisation for Animal Health (WOAH, Founded as OIE): Paris, France, 2021. [Google Scholar]
- World Organisation for Animal Health (WOAH). Terrestrial Animal Health Code, 28th ed.; World Organisation for Animal Health (WOAH, Founded as OIE): Paris, France, 2019. [Google Scholar]
- Cui, K.; Tang, W.; Zhu, R.; Wang, M.; Larsen, G.D.; Pauca, V.P.; Alqahtani, S.; Yang, F.; Segurado, D.; Fine, P.; et al. Efficient Localization and Spatial Distribution Modeling of Canopy Palms Using UAV Imagery. IEEE Trans. Geosci. Remote Sens. 2025, 63, 4413815. [Google Scholar] [CrossRef]
- Di, X.; Cui, K.; Wang, R.F. Toward Efficient UAV-Based Small Object Detection: A Lightweight Network with Enhanced Feature Fusion. Remote Sens. 2025, 17, 2235. [Google Scholar] [CrossRef]
- National Meteorological Information Center (NMIC). Evaluation Report for China National-Level Ground Meteorological Station Basic Meteorological Elements Daily Value Dataset (V3.0); Technical Report; China Meteorological Administration: Beijing, China, 2012. (In Chinese) [Google Scholar]
- Gilbert, M.; Nicolas, G.; Cinardi, G.; Vanwambeke, S.; Boeckel, T.P.V.; Wint, G.R.W.; Robinson, T.P. Global distribution data for cattle, buffaloes, horses, sheep, goats, pigs, chickens and ducks in 2010. Sci. Data 2018, 5, 180227. [Google Scholar] [CrossRef]
- Nicolas, G.; Robinson, T.P.; Wint, G.R.W.; Conchedda, G.; Cinardi, G.; Gilbert, M. Using Random Forest to Improve the Downscaling of Global Livestock Census Data. PLoS ONE 2016, 11, e0150424. [Google Scholar] [CrossRef]
- Si, X.; Wang, L.; Mengersen, K.; Hu, W. Epidemiological Features of Seasonal Influenza Transmission among 11 Climate Zones in Chinese Mainland. Infect. Dis. Poverty 2024, 13, 4. [Google Scholar] [CrossRef]
- Gasparrini, A.; Armstrong, B.; Kenward, M.G. Distributed Lag Non-linear Models. Stat. Med. 2010, 29, 2224–2234. [Google Scholar] [CrossRef]
- Gilbert, M.; Pfeiffer, D.U. Risk factor modelling of the spatio-temporal patterns of highly pathogenic avian influenza (HPAIV) H5N1: A review. Spatio-Temporal Epidemiol. 2012, 3, 173–183. [Google Scholar] [CrossRef]
- Prosser, D.J.; Teitelbaum, C.S.; Yin, S.; Hill, N.J.; Xiao, X. Climate Change Impacts on Bird Migration and Highly Pathogenic Avian Influenza. Nat. Microbiol. 2023, 8, 2223–2225. [Google Scholar] [CrossRef]
- Humphreys, J.M.; Ramey, A.M.; Douglas, D.C.; Mullinax, J.M.; Soos, C.; Link, P.; Walther, P.; Prosser, D.J. Waterfowl Occurrence and Residence Time as Indicators of H5 and H7 Avian Influenza in North American Poultry. Sci. Rep. 2020, 10, 2592. [Google Scholar] [CrossRef]
- Lowen, A.C.; Steel, J. Roles of Humidity and Temperature in Shaping Influenza Seasonality. J. Virol. 2014, 88, 7692–7695. [Google Scholar] [CrossRef]
- Huo, Y.; Wang, R.F.; Zhao, C.T.; Hu, P.; Wang, H. Research on Obtaining Pepper Phenotypic Parameters Based on Improved YOLOX Algorithm. AgriEngineering 2025, 7, 209. [Google Scholar] [CrossRef]
- Wang, R.F.; Tu, Y.H.; Li, X.C.; Chen, Z.Q.; Zhao, C.T.; Yang, C.; Su, W.H. An Intelligent Robot Based on Optimized YOLOv11l for Weed Control in Lettuce. In Proceedings of the 2025 ASABE Annual International Meeting, Toronto, ON, Canada, 13–16 July 2025; p. 1. [Google Scholar]
- Lundberg, S.M.; Lee, S.I. A Unified Approach to Interpreting Model Predictions. In Advances in Neural Information Processing Systems 30; Guyon, I., von Luxburg, U., Bengio, S., Wallach, H., Fergus, R., Vishwanathan, S., Garnett, R., Eds.; Curran Associates, Inc.: Red Hook, NY, USA, 2017; pp. 4765–4774. [Google Scholar]
- Kutner, M.H.; Nachtsheim, C.J.; Neter, J.; Li, W. Applied Linear Statistical Models, 5th ed.; McGraw-Hill/Irwin: Boston, MA, USA, 2005. [Google Scholar]
- Moran, P.A.P. Notes on Continuous Stochastic Phenomena. Biometrika 1950, 37, 17–23. [Google Scholar] [CrossRef]
- Li, J.; Rao, Y.; Sun, Q.; Wu, X.; Jin, J.; Bi, Y.; Chen, J.; Lei, F.; Liu, Q.; Duan, Z.; et al. Identification of Climate Factors Related to Human Infection with Avian Influenza A H7N9 and H5N1 Viruses in China. Sci. Rep. 2015, 5, 18094. [Google Scholar] [CrossRef] [PubMed]
- Luo, H.; Cui, Y.; Yu, W.; Li, G.; Zhao, Q.; Geng, M.; Wang, H.; Ma, W. The Impact of Urbanization in China on Influenza Incidence across Neighboring Cities. J. Infect. 2025, 90, 106370. [Google Scholar] [CrossRef] [PubMed]
- Yuan, H.; Kramer, S.C.; Lau, E.H.Y.; Cowling, B.J.; Yang, W. Modeling Influenza Seasonality in the Tropics and Subtropics. PLoS Comput. Biol. 2021, 17, e1009050. [Google Scholar] [CrossRef] [PubMed]
- Flahault, A.; de Castaneda, R.R.; Bolon, I. Climate Change and Infectious Diseases. Public Health Rev. 2016, 37, 21. [Google Scholar] [CrossRef]
- Yin, J.; Liu, T.; Tang, F.; Chen, D.; Sun, L.; Song, S.; Zhang, S.; Wu, J.; Li, Z.; Xing, W.; et al. Effects of Ambient Temperature on Influenza-like Illness: A Multicity Analysis in Shandong Province, China, 2014–2017. Front. Public Health 2022, 10, 1095436. [Google Scholar] [CrossRef]
- Deyle, E.R.; Maher, M.C.; Hernandez, R.D.; Basu, S.; Sugihara, G. Global Environmental Drivers of Influenza. Proc. Natl. Acad. Sci. USA 2016, 113, 13081–13086. [Google Scholar] [CrossRef]
- Mahmud, A.S.; Martinez, P.P.; Baker, R.E. The Impact of Current and Future Climates on Spatiotemporal Dynamics of Influenza in a Tropical Setting. PNAS Nexus 2023, 2, pgad307. [Google Scholar] [CrossRef]
- Colijn, C.; Soebiyanto, R.P.; Clara, W.; Jara, J.; Castillo, L.; Sorto, O.R.; Marinero, S.; de Antinori, M.E.B.; McCracken, J.P.; Widdowson, M.A.; et al. The Role of Temperature and Humidity on Seasonal Influenza in Tropical Areas: Guatemala, El Salvador and Panama, 2008–2013. PLoS ONE 2014, 9, e100659. [Google Scholar] [CrossRef]
- Elsobky, Y.; El Afandi, G.; Abdalla, E.; Byomi, A.; Reddy, G. Possible Ramifications of Climate Variability on HPAI-H5N1 Outbreak Occurrence: Case Study from the Menoufia, Egypt. PLoS ONE 2020, 15, e0240442. [Google Scholar] [CrossRef]
- Wang, Z.; Wang, R.; Wang, M.; Lai, T.; Zhang, M. Self-supervised transformer-based pre-training method with General Plant Infection dataset. In Proceedings of the Chinese Conference on Pattern Recognition and Computer Vision (PRCV), Urumqi, China, 18–20 October 2024; pp. 189–202. [Google Scholar]
- Wang, R.F.; Qu, H.R.; Su, W.H. From Sensors to Insights: Technological Trends in Image-Based High-Throughput Plant Phenotyping. Smart Agric. Technol. 2025, 12, 101257. [Google Scholar] [CrossRef]
- Yan, Z.L.; Liu, W.H.; Long, Y.X.; Ming, B.W.; Yang, Z.; Qin, P.Z.; Ou, C.Q.; Li, L. Effects of Meteorological Factors on Influenza Transmissibility by Virus Type/Subtype. BMC Public Health 2024, 24, 494. [Google Scholar] [CrossRef]
- Wagatsuma, K. Effect of Short-term Ambient Temperature Exposure on Influenza A and B Incidence: A Time-series Analysis of Daily Surveillance Data in Kawasaki City, Japan. IJID Reg. 2024, 13, 100479. [Google Scholar] [CrossRef]
- Morin, C.W.; Stoner-Duncan, B.; Winker, K.; Scotch, M.; Hess, J.J.; Meschke, J.S.; Ebi, K.L.; Rabinowitz, P.M. Avian Influenza Virus Ecology and Evolution through a Climatic Lens. Environ. Int. 2018, 119, 241–249. [Google Scholar] [CrossRef]
- Lindner-Cendrowska, K.; Bröde, P. Impact of Biometeorological Conditions and Air Pollution on Influenza-like Illnesses Incidence in Warsaw. Int. J. Biometeorol. 2021, 65, 929–944. [Google Scholar] [CrossRef]
- Soebiyanto, R.P.; Adimi, F.; Kiang, R.K. Modeling and Predicting Seasonal Influenza Transmission in Warm Regions Using Climatological Parameters. PLoS ONE 2010, 5, e9450. [Google Scholar] [CrossRef]


| Scale | Category and Variables | Justification and Supporting References |
|---|---|---|
| Macro-scale | Geographic and Climatic Contexts (e.g., latitude, longitude, Köppen class) | Represents stable, large-scale environmental conditions that define baseline AI risk. The Köppen–Geiger classification summarizes long-term climate regimes governing viral persistence [21,23]. |
| Meso-scale | Host and Wild Bird Interface (e.g., poultry density, dist. to IBA) | Captures key ecological factors at a regional level. Poultry density is a fundamental determinant of disease amplification, while proximity to IBAs proxies for viral spillover risk from wild birds [23,24,25]. |
| Micro-scale | Meteorological Triggers (e.g., lagged temp., pressure change) | Represents transient weather conditions that can trigger outbreaks. Temperature and other factors influence the environmental survival and stability of the influenza virus [23,26]. |
| Temporal | Seasonality Controls (e.g., sine/cosine of day of year) | Models the well-documented seasonality of avian influenza. These cyclical features allow the model to learn patterns of risk peaking in cooler months in a continuous manner [4]. |
| Model | Mean R2 (±SD) | Mean RMSE (±SD) | Mean MAE (±SD) |
|---|---|---|---|
| XGBoost (this study) | 0.776 (±0.039) | 0.604 (±0.065) | 0.306 (±0.060) |
| PanelOLS (fixed effects) | 0.458 (±0.052) | 0.881 (±0.095) | 0.573 (±0.048) |
| Gaussian GLM | 0.257 (±0.061) | 0.995 (±0.112) | 0.634 (±0.055) |
| Variable | N | Mean | Std. Dev. | Median | Min | Max | Q25 | Q75 |
|---|---|---|---|---|---|---|---|---|
| Cases | 1800 | 5.4 | 10.2 | 1 | 1 | 108 | 1 | 2 |
| Mean temperature (°C) | 1800 | 7.5 | 10.1 | 14.57 | −14.5 | 34.73 | −0.3 | 15.6 |
| Atmospheric pressure () | 1800 | 955.74 | 95.17 | 997.75 | 572.95 | 1038.9 | 922.27 | 1012.55 |
| Precipitation () | 1800 | 2.33 | 9.12 | 0 | 0 | 145.8 | 0 | 0.1 |
| Lagged temperature (°C) | 1800 | 14.71 | 10.25 | 14 | −15.5 | 33.6 | 6.97 | 24.2 |
| Lagged pressure () | 1800 | 952.02 | 109.96 | 998.9 | 0 | 1038.8 | 922.15 | 1011.5 |
| Lagged precipitation () | 1800 | 5.57 | 109.22 | 0 | 0 | 3272 | 0 | 0.2 |
| Poultry density (log-transformed) | 1800 | 5.95 | 2.28 | 6.55 | 0 | 9.53 | 5.32 | 7.45 |
| Distance to IBA () | 1800 | 44.8 | 37.4 | 41.2 | 0 | 225 | 16.9 | 85.3 |
| Within IBA (binary) | 1800 | 0.053 | 0.225 | 0 | 0 | 1 | 0 | 0 |
| Longitude (°E) | 1800 | 110.05 | 8.98 | 112.22 | 77.27 | 131.47 | 106.41 | 115.97 |
| Latitude (°N) | 1800 | 30 | 6 | 29 | 21 | 48 | 25 | 32 |
| Month (sin-transformed) | 1800 | −0.005 | 0.615 | 0 | −1 | 1 | −0.5 | 0.5 |
| Month (cos-transformed) | 1800 | 0.202 | 0.763 | 0.5 | −1 | 1 | −0.5 | 0.866 |
| Day of year (sin-transformed) | 1800 | −0.041 | 0.604 | 0 | −1 | 1 | −0.538 | 0.448 |
| Day of year (cos-transformed) | 1800 | 0.208 | 0.768 | 0.556 | −1 | 1 | −0.374 | 0.962 |
| Köppen 14.0 (binary) | 1800 | 0.475 | 0.5 | 0 | 0 | 1 | 0 | 1 |
| Köppen 11.0 (binary) | 1800 | 0.255 | 0.436 | 0 | 0 | 1 | 0 | 1 |
| Köppen 7.0 (binary) | 1800 | 0.07 | 0.255 | 0 | 0 | 1 | 0 | 0 |
| Metric | Mean | Std. Dev. |
|---|---|---|
| 0.776 | 0.039 | |
| RMSE | 0.61 | 0.07 |
| MAE | 0.318 | 0.009 |
Disclaimer/Publisher’s Note: The statements, opinions and data contained in all publications are solely those of the individual author(s) and contributor(s) and not of MDPI and/or the editor(s). MDPI and/or the editor(s) disclaim responsibility for any injury to people or property resulting from any ideas, methods, instructions or products referred to in the content. |
© 2025 by the authors. Licensee MDPI, Basel, Switzerland. This article is an open access article distributed under the terms and conditions of the Creative Commons Attribution (CC BY) license (https://creativecommons.org/licenses/by/4.0/).
Share and Cite
Wang, X.; Xu, Y.; Xi, X. Spatiotemporal Risk Assessment of H5 Avian Influenza in China: An Interpretable Machine Learning Approach to Uncover Multi-Scale Drivers. Animals 2025, 15, 2447. https://doi.org/10.3390/ani15162447
Wang X, Xu Y, Xi X. Spatiotemporal Risk Assessment of H5 Avian Influenza in China: An Interpretable Machine Learning Approach to Uncover Multi-Scale Drivers. Animals. 2025; 15(16):2447. https://doi.org/10.3390/ani15162447
Chicago/Turabian StyleWang, Xinyi, Yihui Xu, and Xi Xi. 2025. "Spatiotemporal Risk Assessment of H5 Avian Influenza in China: An Interpretable Machine Learning Approach to Uncover Multi-Scale Drivers" Animals 15, no. 16: 2447. https://doi.org/10.3390/ani15162447
APA StyleWang, X., Xu, Y., & Xi, X. (2025). Spatiotemporal Risk Assessment of H5 Avian Influenza in China: An Interpretable Machine Learning Approach to Uncover Multi-Scale Drivers. Animals, 15(16), 2447. https://doi.org/10.3390/ani15162447


