1. Introduction
Concern for possible threats to horse welfare due to tightened nosebands has been expressed over several years [
1,
2,
3,
4,
5]. Riders may be motivated to tighten nosebands because rein tension data suggest that doing so increases responsiveness to the aversive pressures from the bit [
6]. Most horse training techniques use rider-applied pressure to evoke a specific response (negative reinforcement), but effective training requires the release of such pressure once the horse gives the correct response [
7]. In contrast, pressures exerted by a tight noseband persist throughout ridden work and cannot be removed by performance of a correct or desired response.
The use of tight nosebands has been prevalent in the disciplines of dressage and eventing [
3], although growing awareness of this issue may be resulting in changing trends, with fewer tight nosebands found in more recent studies [
8,
9]. Recent exposés of changes in the colour of tongues in elite dressage horses [
10,
11] may have added to interest in the interactions between gear and ridden horse welfare.
While anecdotal evidence suggests that occasional periosteal damage and bony deformation at the location of noseband position [
12] and laceration of the mucosa where the noseband passes over the second premolar tooth possibly pressing sensitive soft tissue against sharp tooth edges occur [
13], insufficient evidence exists to identify the exact mechanism and aetiological factors that contribute to this outcome.
Tight nosebands have been shown to lead to a possible reduction in vascular perfusion of skin in the region of the noseband [
5]. Radiographic studies of cavalry horses (n = 144) have revealed the presence of bony changes at the level of the noseband in approximately 33% of horses, with evidence of bone thinning and bone deposition on the nasal bones and mandibular rami at the normal location of the noseband [
14]. Pressure exerted on tissue can result in tissue deformation and tissue damage [
15,
16]. Hair loss under the noseband has been reported as the most common noseband-related complication noticed by owners, riders, and trainers [
17].
While it has been proposed that more behavioural and physiological studies with nosebands tightened at different levels would have merit [
18], several such studies have been published showing physiological stress responses to restrictive nosebands including increased heart rate, reduced heart rate variability [
2], and an increase in eye temperature, as measured by infrared thermography [
2,
19]. In Fenner et al.’s study [
2], tight nosebands restricted oral behaviours (licking, yawning, chewing, and swallowing) that showed a post-inhibitory rebound once the noseband was loosened. This implies that such behaviours are internally motivated and that denying them is distressing. In their study of 3143 horses, Uldahl et al. found that a looser noseband was associated with fewer lesions at the lip commissures, with increasing space under the noseband from <2 to 2–3 cm or from 2–3 to >3 cm, lowering incidence of lesions by 34% (odds ratio, 0.66; 95% confidence interval, 0.51–0.86;
p = 0.002) [
20]. It is important to note that the populations of horses studied and the methods applied vary across the different studies [
2,
18,
19].
Tight nosebands have been used to induce a stress response (as inferred by increased cortisol concentrations) experimentally, during which an increase in stress-related behavioural responses was also recorded [
21]. That said, one study of horses (n = 8) that had their nosebands tightened for 20 s before being offered a treat reported no effect of noseband tightening on eye temperature or blink rate [
22]. It is unclear why such a brief period of study was selected or how the horses’ motivation to accept a treat and chew while jaw movement was restricted by noseband tightening was standardised or, for that matter, manipulated.
Analysis of the anatomy of the head of the horse, at the usual position of a cavesson noseband, revealed the left and right nasal bones and the mandibular rami to be the locations most susceptible to high levels of pressure from a tightened noseband [
1]. In practice, the working guideline based on tradition, rather than empirical data, is that one must be able to fit two fingers between the noseband and the frontal nasal plane [
23,
24]. The mean height of the midpoint of the intermediate phalanx of the digitus medius is 1.59 ± 0.05 cm [
10]. The mean width of the midpoint of the intermediate phalanx of the digitus secundus and digitus medius side by side is 3.87 ± 0.09 cm [
10]. These details are provided to explain why the current article refers to the area under the noseband in terms of fingers (noting that the cross-sectional area of two adult fingers was 3.87 cm × 1.59 cm = 6.1533 cm
2 [
10]).
Tight nosebands have been shown to impose high forces (of up to 95 N) and peak pressures of more than 1000 mm Hg (133.32 kPa) on supporting tissues [
1,
25,
26]. While varying technology, methodology, and statistical analyses are used in different studies, the common finding of such high pressures on sub-noseband tissues warrants further detailed empirical investigation.
A stated goal of the FEI Code of Conduct for the welfare of the horse states that “At any level of competition, a noseband may never be so tightly fixed that it causes harm to the horse”. FEI tack stewards were historically advised to check noseband tightness by introducing an index finger between the horse’s cheek and the noseband. However, the contour of the face at the cheek is such that noseband pressures at this location are only approximately one-third of those measured at the frontal nasal plane, even for the tightest noseband fitting [
26]. This allows for the easy introduction of a finger/fingers at that location, rendering that measurement unrepresentative of the actual pressures exerted on sub-noseband tissues at other critical areas on the head, particularly at the left and right nasal bones and mandibular rami.
As a result of ongoing widespread concerns about tight nosebands and the need to regulate noseband tightness, equestrian federations in Denmark, Sweden, New Zealand, Switzerland, and the Netherlands have introduced regulations regarding noseband tightness. While all the above countries specify that the tightness level should be measured at the frontal nasal bone, there are differences in the methods of measurement used. To date, the taper gauge approach has not been checked with the use of a digital tightness gauge beneath the noseband. Recently, the FEI has announced a requirement to measure noseband tightness on the dorsum of the nose and the introduction of a “pull-through” gauge that appears to equate to a maximum tightness of approximately 1.5 fingers [
27]. This requirement came into force in 2025.
The magnitude of force directed by a noseband downward onto underlying tissue will depend on the local morphology and compliance of structures underlying the noseband and the degree of tightness with which the noseband is fastened, as shown by the Law of Laplace below [
28].
Anatomical areas most susceptible to forces exerted by overly tight nosebands have been identified using curvature models of an equine nose and verified experimentally [
1,
25,
26]. Areas with a high degree of curvature are subject to higher compressive forces than areas of lower curvature. Locations of high curvature include the left and right nasal bones, the left and right mandibular rami, and the lateral vestibular or cheek region covering the premolar teeth. The hammocking effect concentrates the noseband force onto the “peaks” of the bony prominences. These areas are particularly subject to noseband-induced normal forces due to their rigidity. Similarly, the application of concentrated forces onto relatively small areas, such as the “peaks” of the bony prominences, implies that the force per unit area, i.e., the pressure at these locations, will also be elevated. While mapping of the distribution of nociceptors around the face of the horse has yet to be performed, data regarding the high prevalence of nociceptors in the periosteum exist [
29], suggesting that the periosteum of the nasal bones and mandibular rami are susceptible to sustained pressure levels, which may elicit pain. While the hammocking effect concentrates the noseband force onto the peaks of the bony prominences, with tissue damage most likely to occur at these locations, sustained pressure is also exerted, albeit with lower levels of force, against tissues and structures of lower convexity (smaller radius of curvature) [
1].
We sought to explore the relationships between pressure on the nasal bones and “number of fingers” on the ISES Taper Gauge and between pressure on the nasal bones and noseband tension. Despite the limitations of the current pilot study, the latter objective, if validated, would allow future researchers to infer pressure from tension data. This is helpful because noseband tension (or tightness level) is easier for horse owners/riders to measure (such as by inserting fingers under the noseband or using a tightness measuring gauge) than sub-noseband pressure (which requires access to pressure-measuring technology). The current study may be considered one approach to understanding how pressure beneath the noseband can be inferred from tension data. Eventually, if the use of restrictive nosebands persists, further research may help clarify the roles of the contact area of the noseband, the compliance of the noseband’s core, and the area, thickness, and physical properties of the padding when estimating the pain or discomfort these devices can impose on horses.
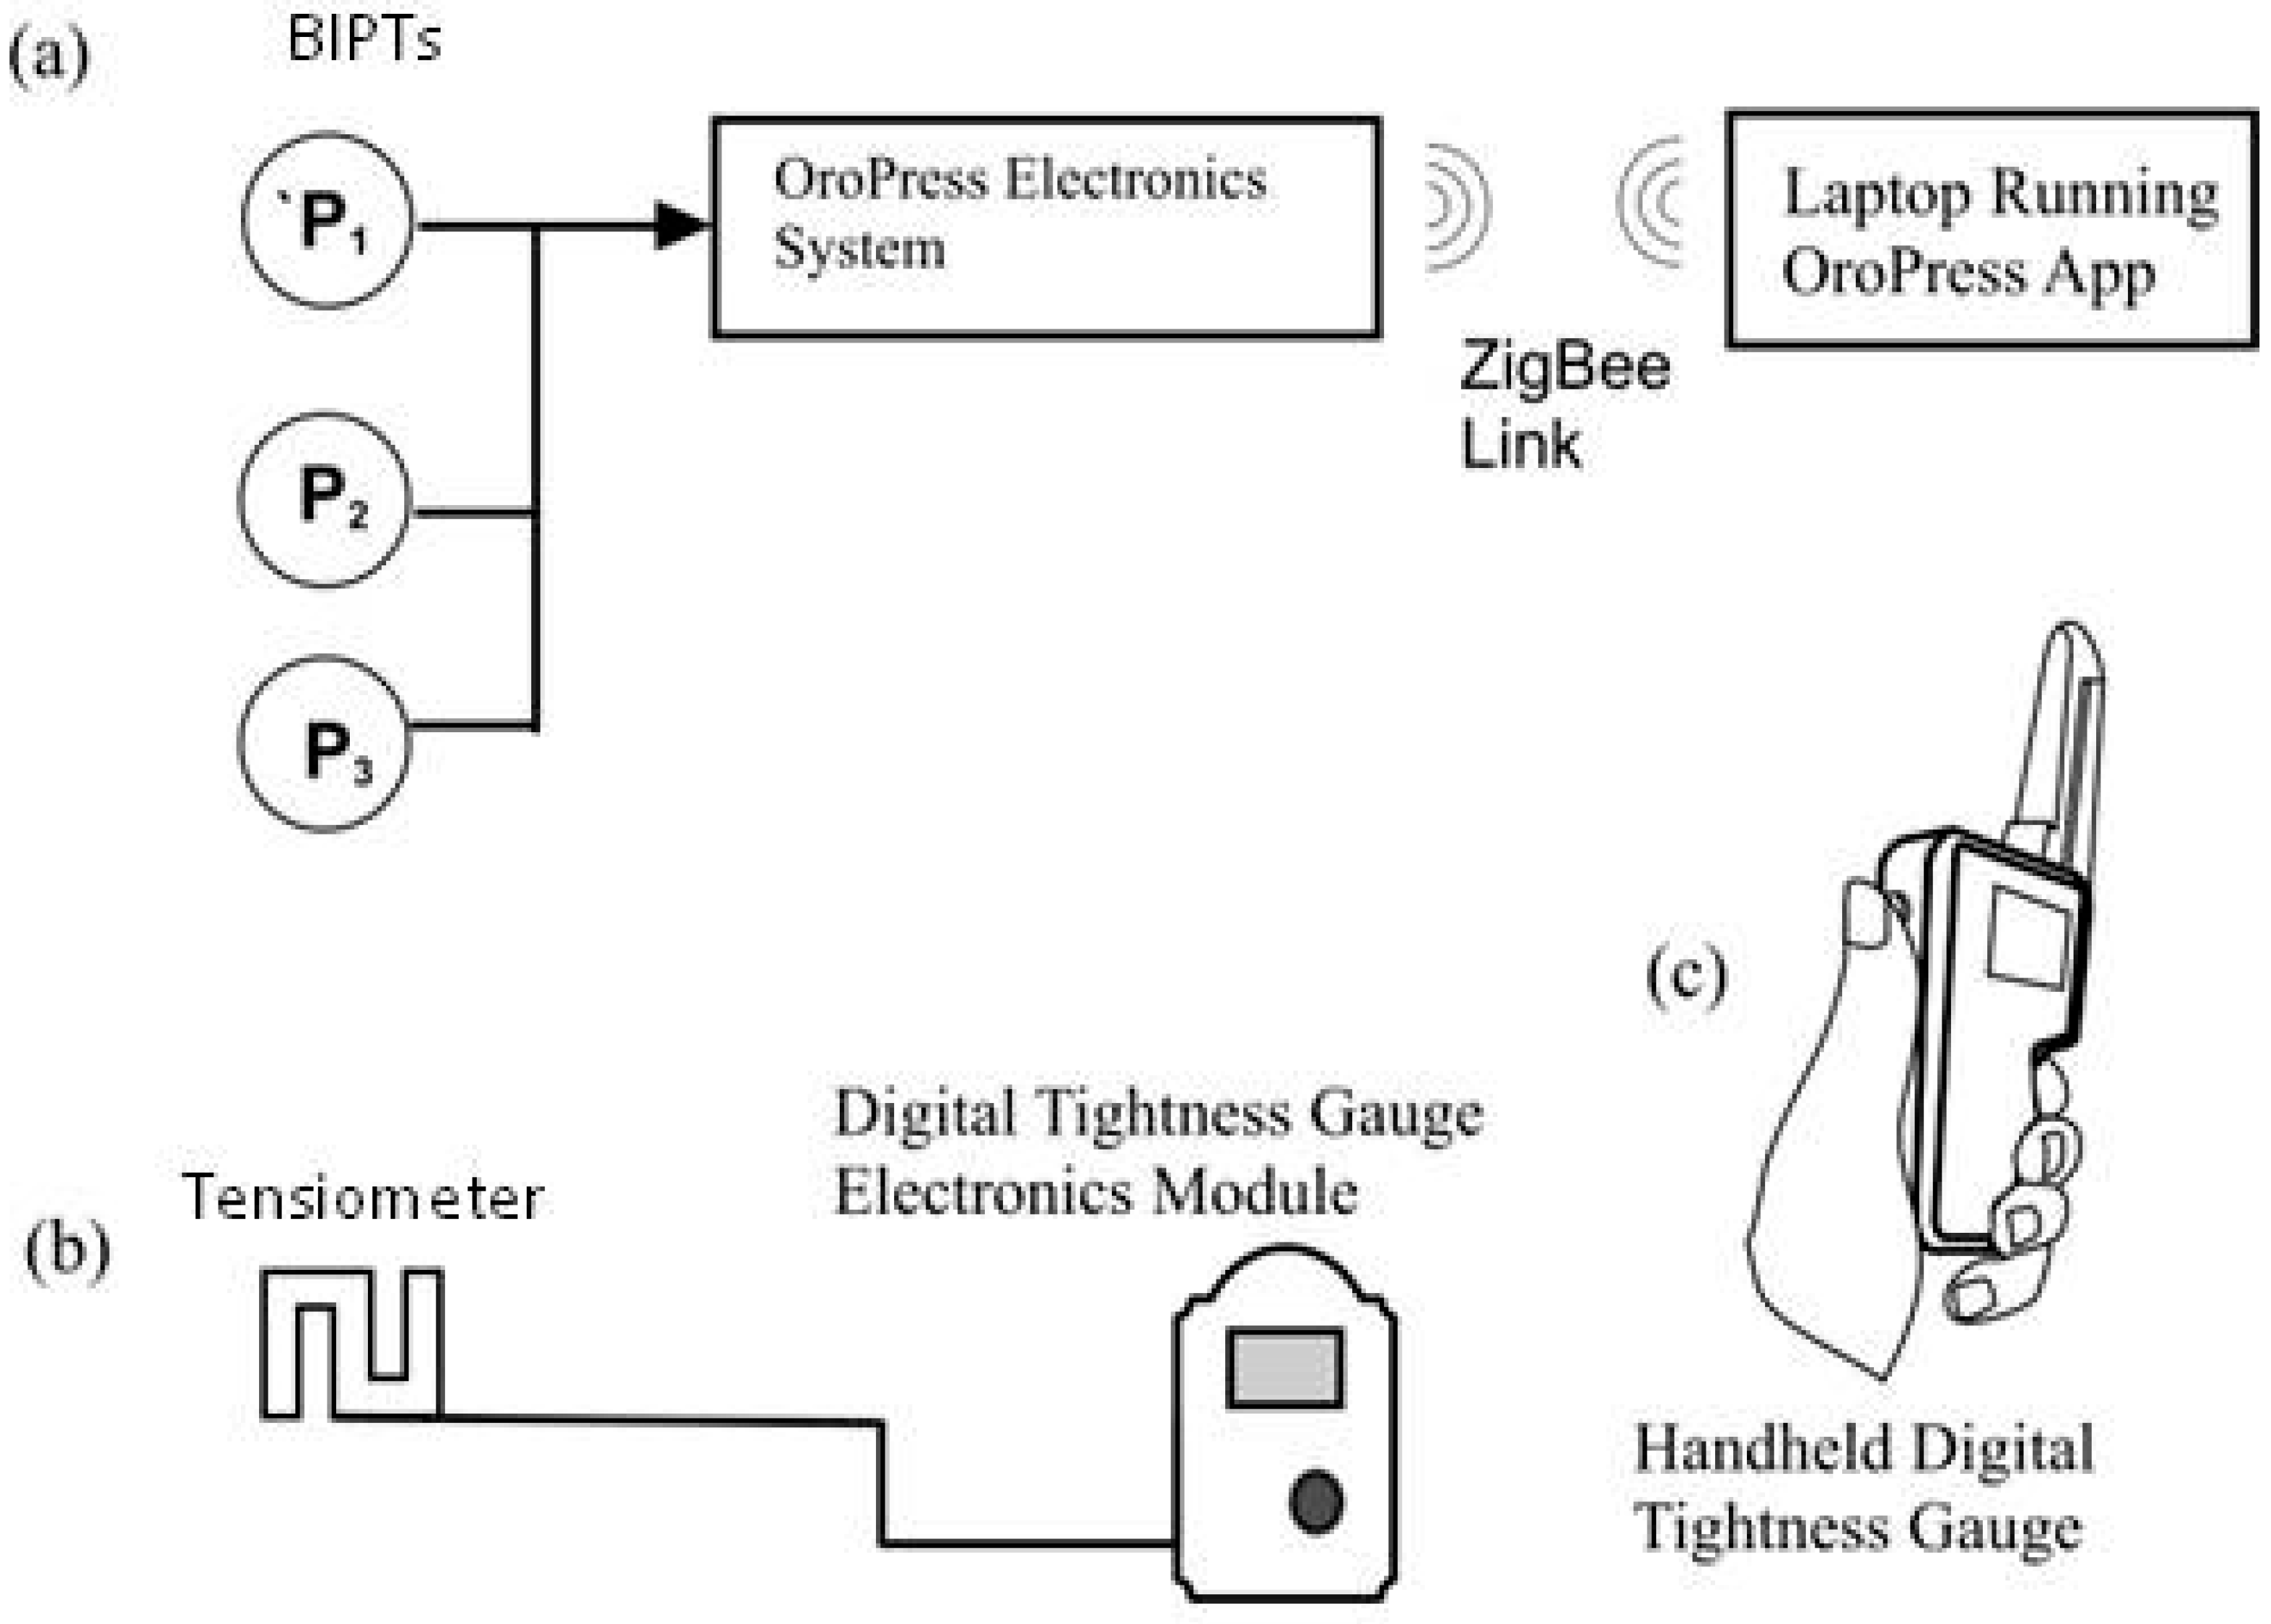
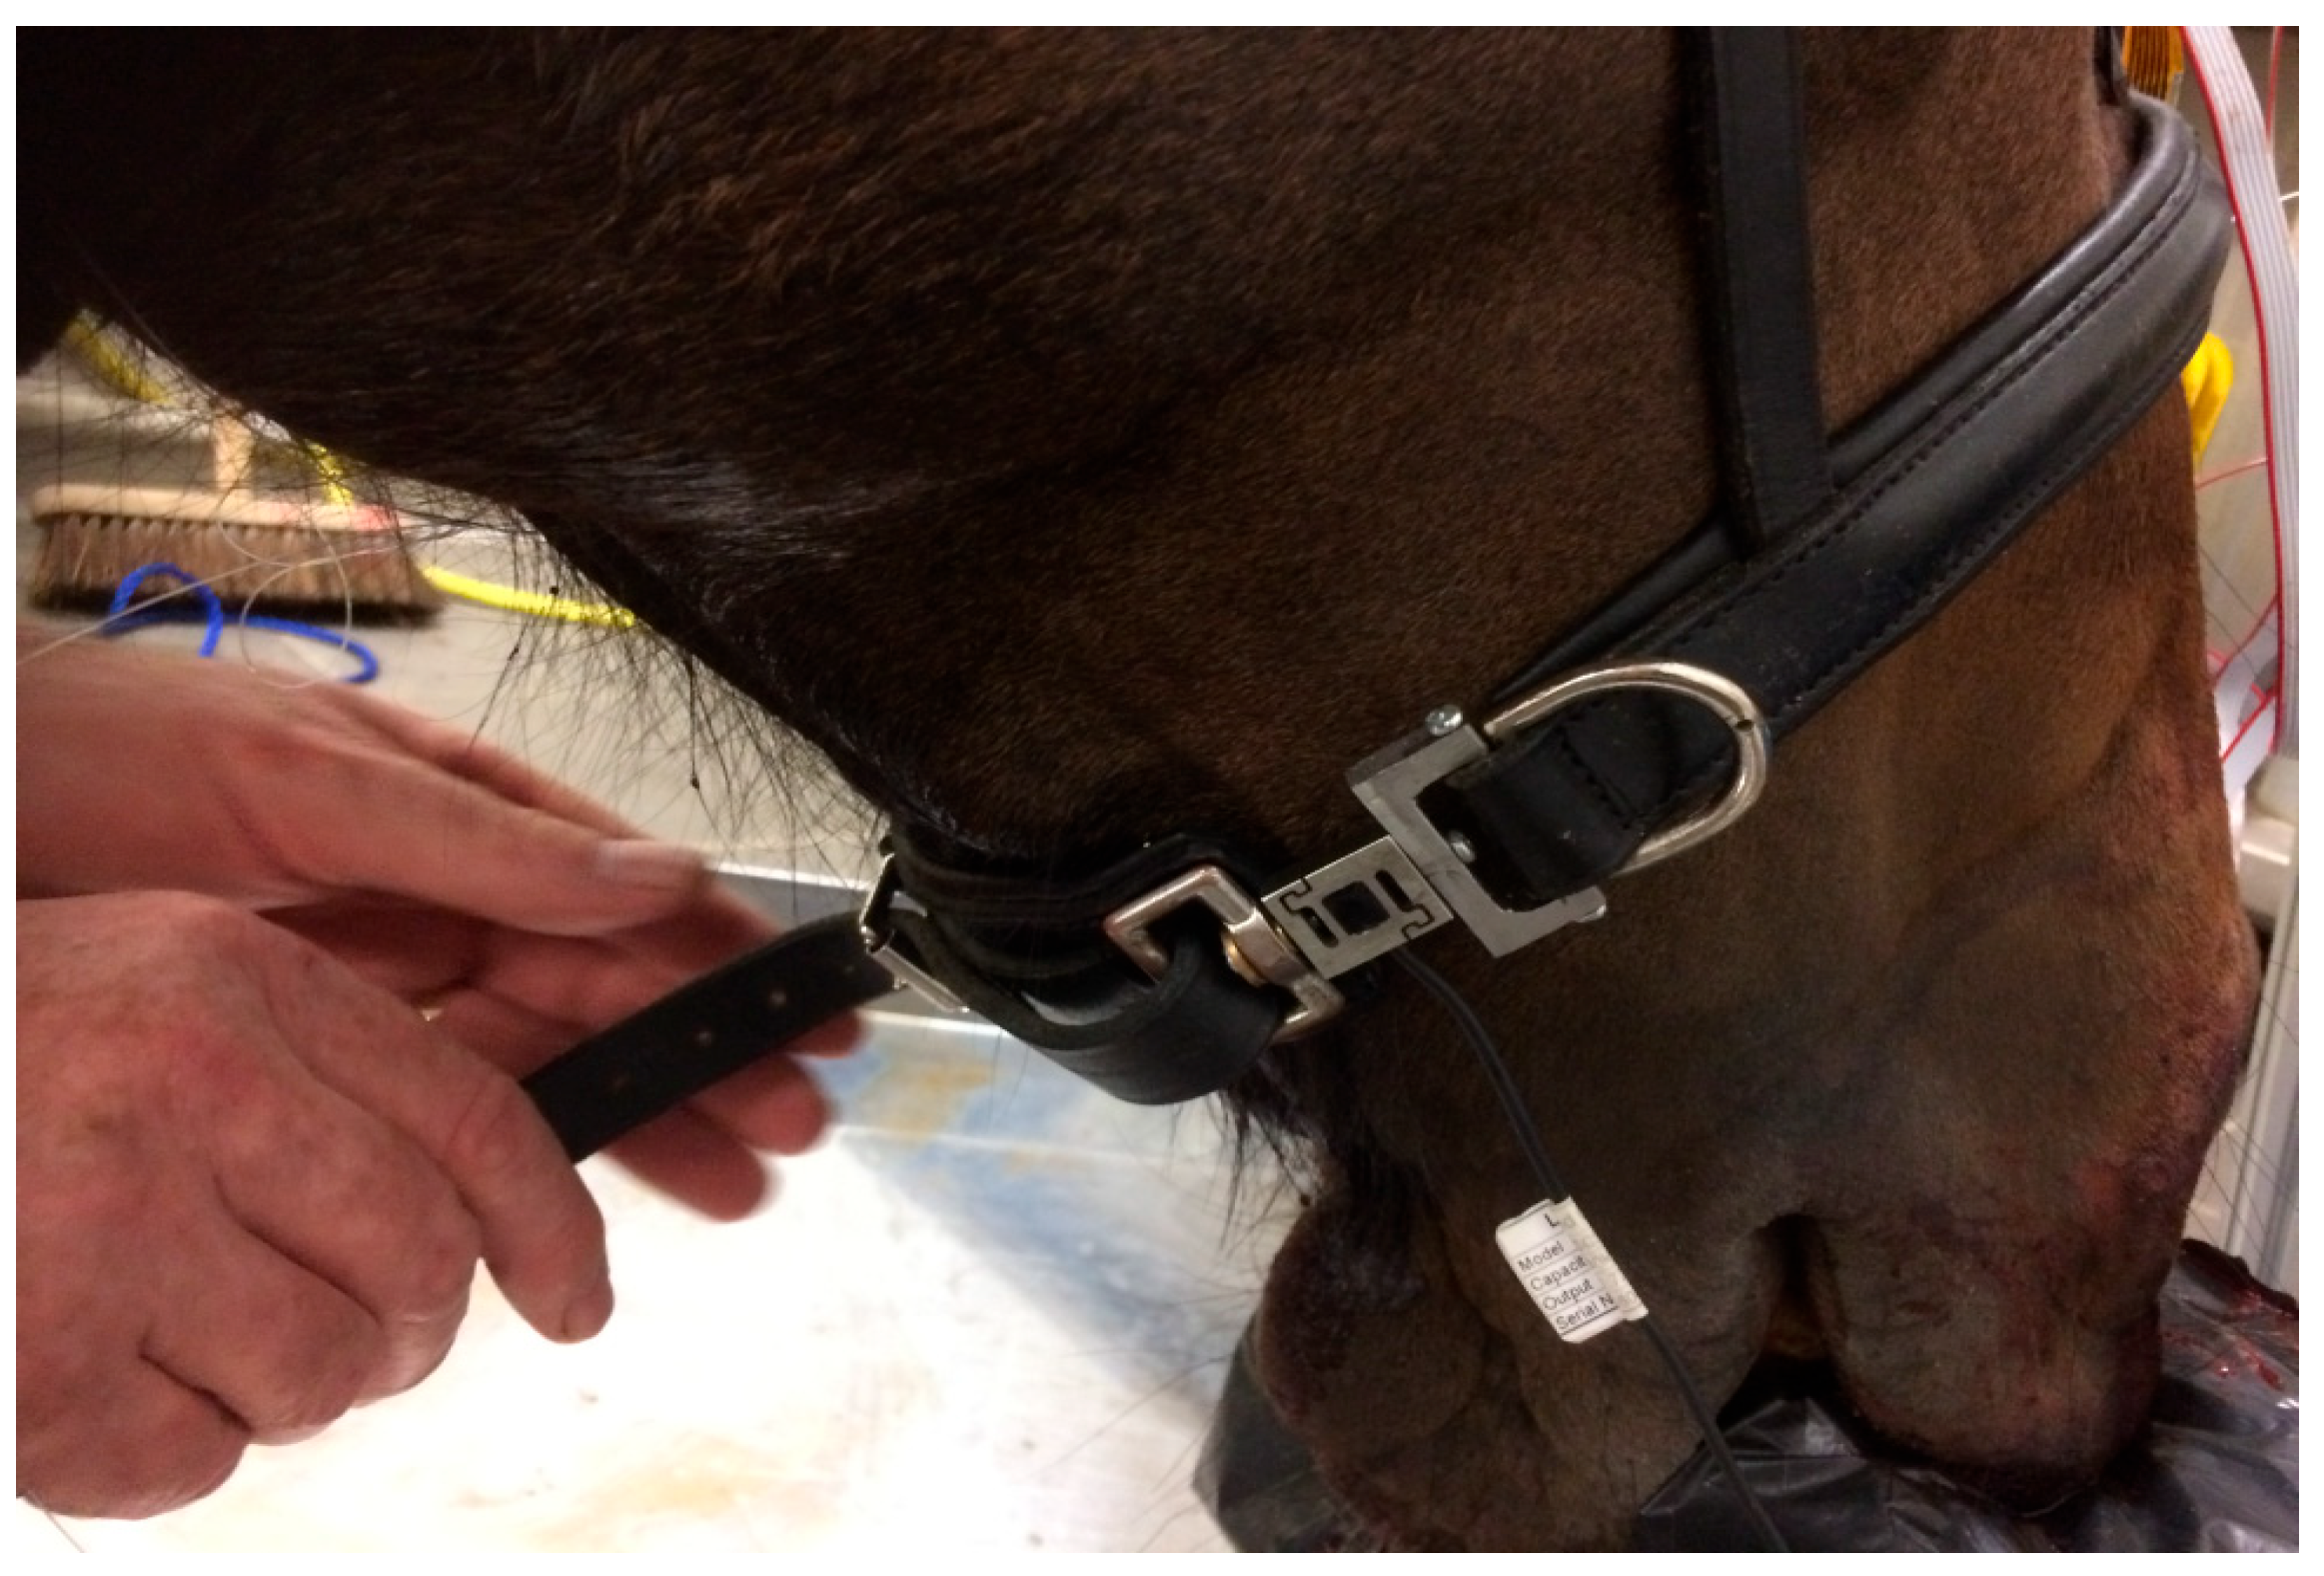
The goals of the current cadaver study were 1. to measure the levels of pressure exerted by an incrementally tightened noseband on the nasal bone, at the frontal nasal plane and at the location of the second premolar tooth; 2. to measure objectively noseband tension, as the noseband was progressively tightened from loose to the tightest possible fitting; and 3. to investigate the impact on noseband tension of inserting a digital tightness-measuring gauge beneath the noseband.
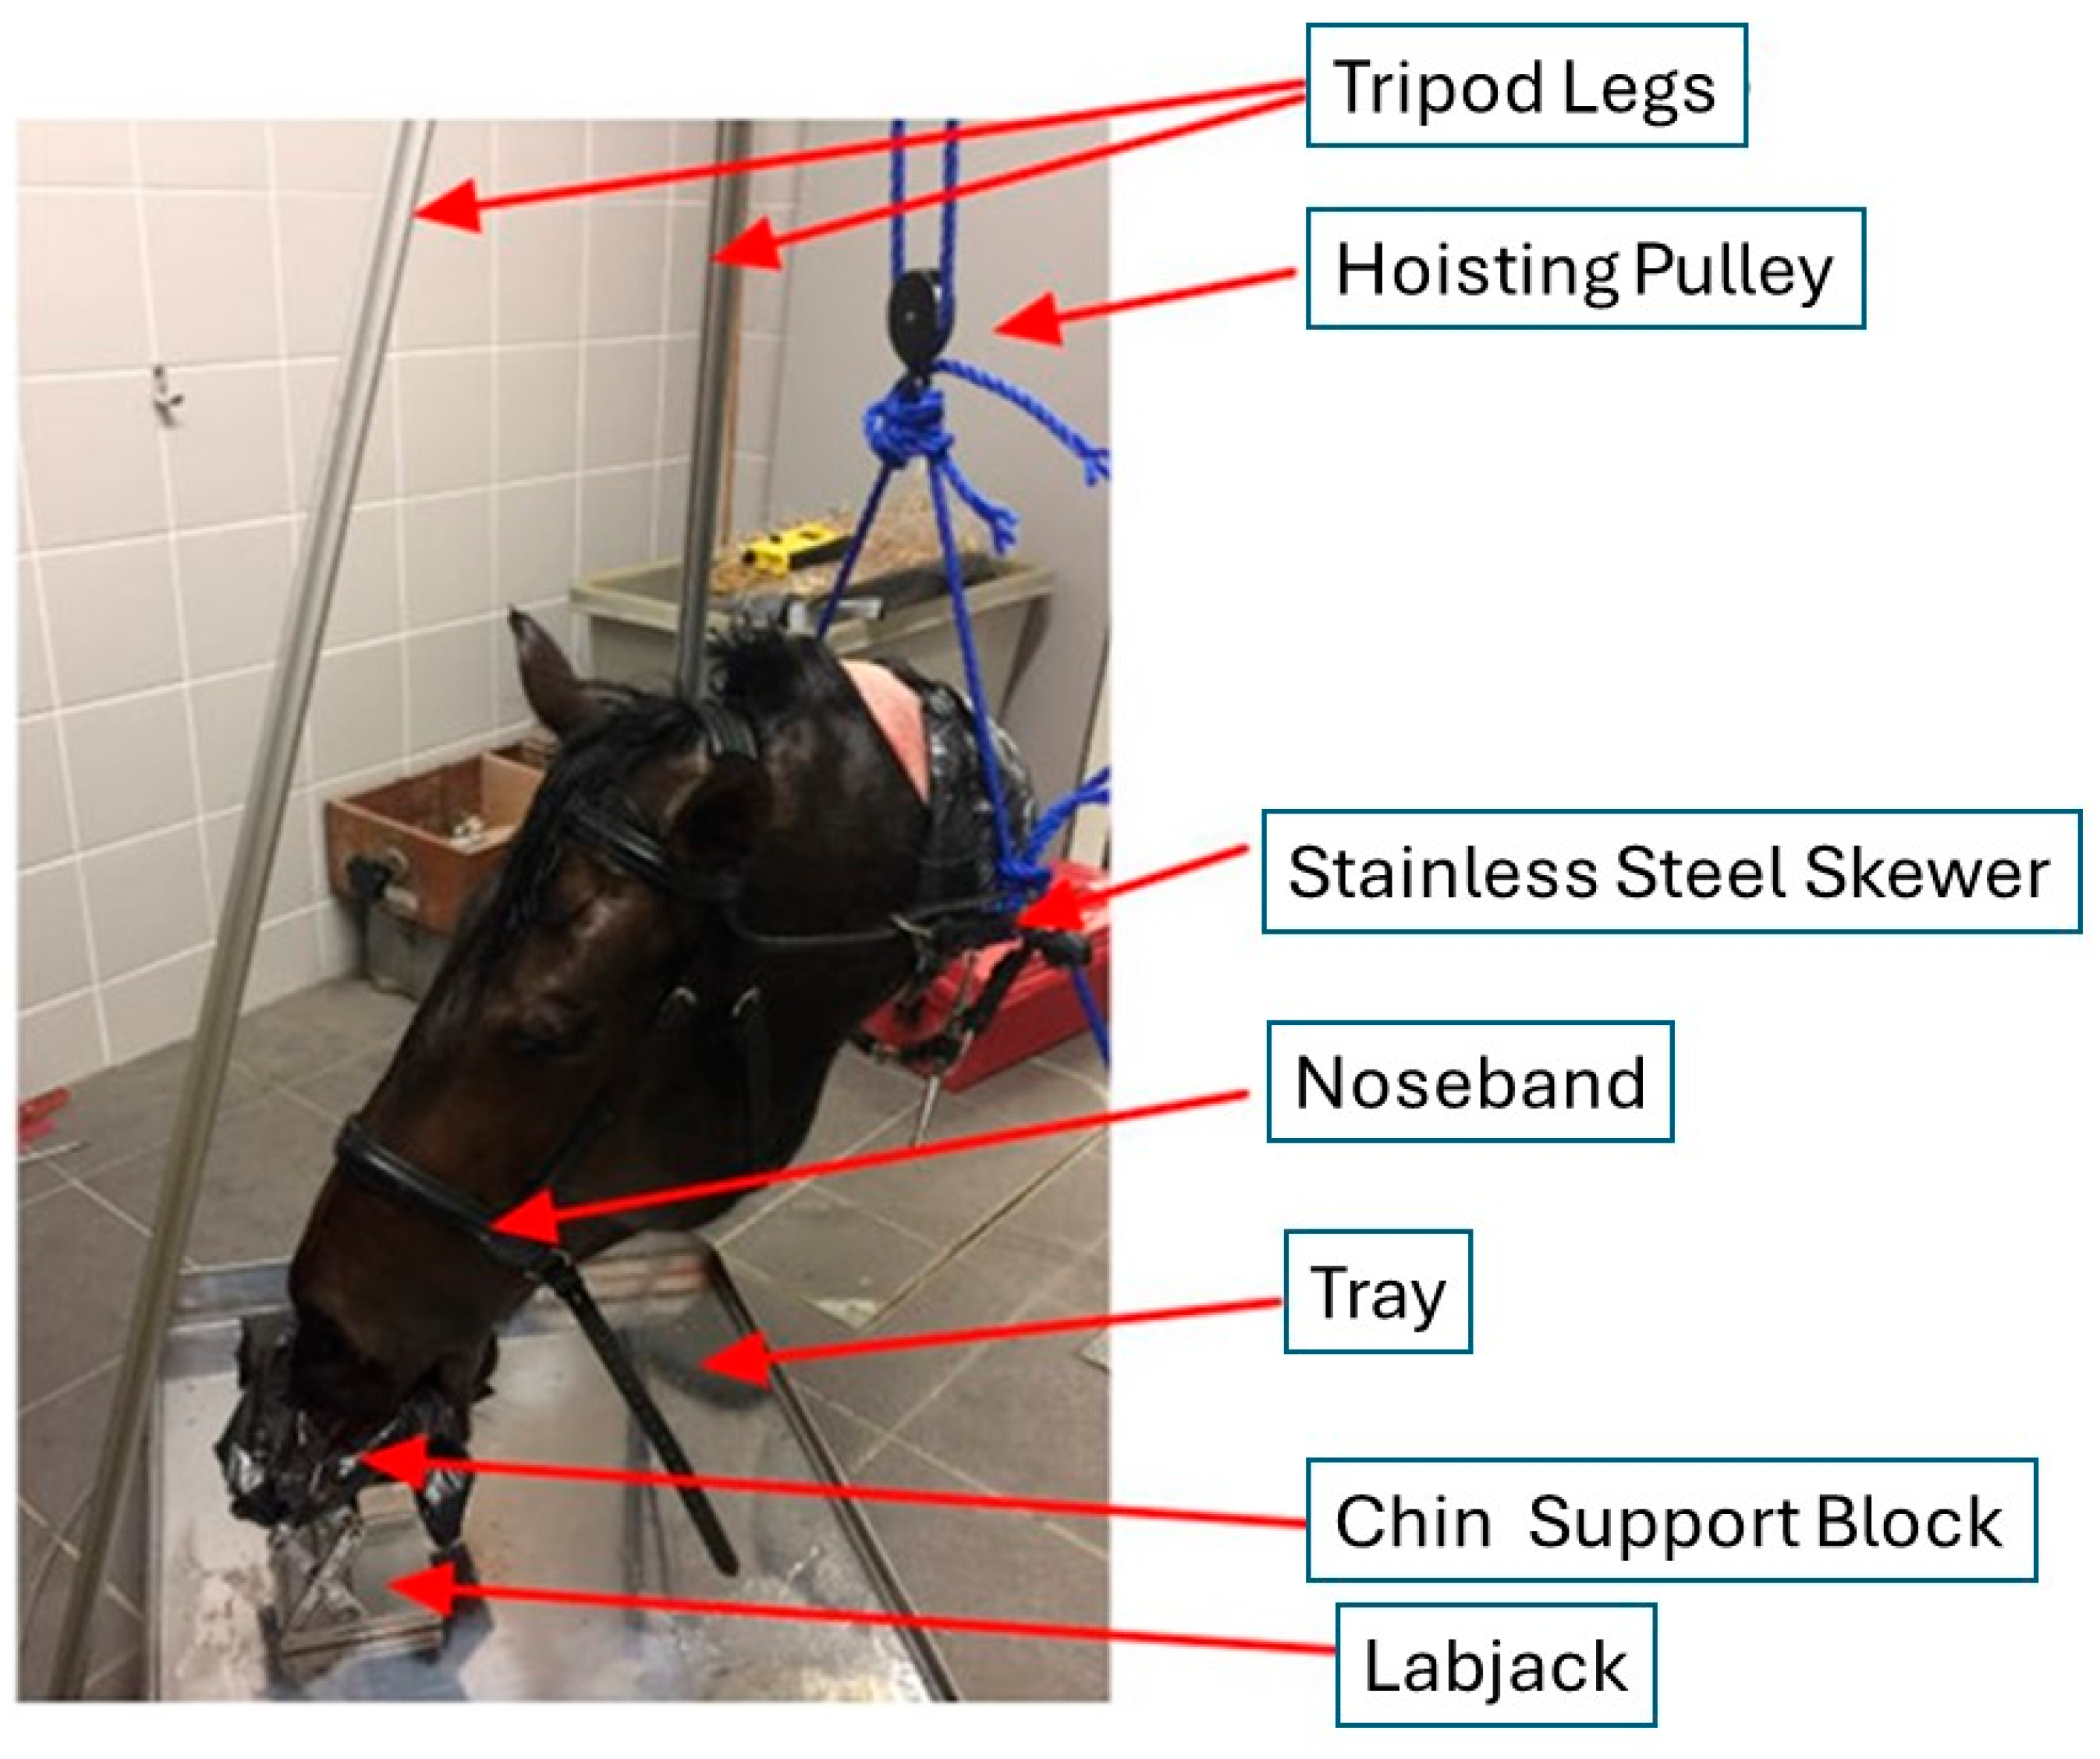
The use of a cadaver was chosen because of the ethical unacceptability of tightening the noseband to zero fingers’ space on a sentient living animal. A cadaver was also chosen because it represents the passive situation, i.e., in the absence of living soft tissues under systolic pressures. It is possible that pressures and tensions would be higher in a live horse and higher still when the horse is ridden in a contact.
The rationale that underpins this expectation is based on the knowledge that there is no space in the buccal cavity that has evolved to accommodate a bit or bits. As such, the bit represents a foreign body. The tongue is a muscle, and, in a live horse, it is active in the presence of a bit. The bitted horse attempts to seek comfort by morphing the tongue’s shape and, where possible, opening the mouth and, when denied this behaviour, by simply attempting to open the mouth. These outcomes were noted by Clayton and Manfredi, whose fluoroscopic study revealed that, when bitted, horses spent “less time quiet [than when not bitted] and more time mouthing the bit, retracting the tongue and bulging the tongue over the bit when tension was applied” [
30]. Noseband adjustment in a dead horse can act as a baseline before the addition of rein tension in live horses. This is logical since reins are designed to make bit pressure relatively more aversive to incentivise the horse to respond to the rider. Once bit pressure is increased, so is the horse’s need for comfort behaviours. A live, active tongue cannot decrease noseband pressures and tensions, nor can rein tension. Based on this logic, our expectation is that these metrics would not fall but would instead rise when live horses are exposed to any rein contact.
4. Discussion
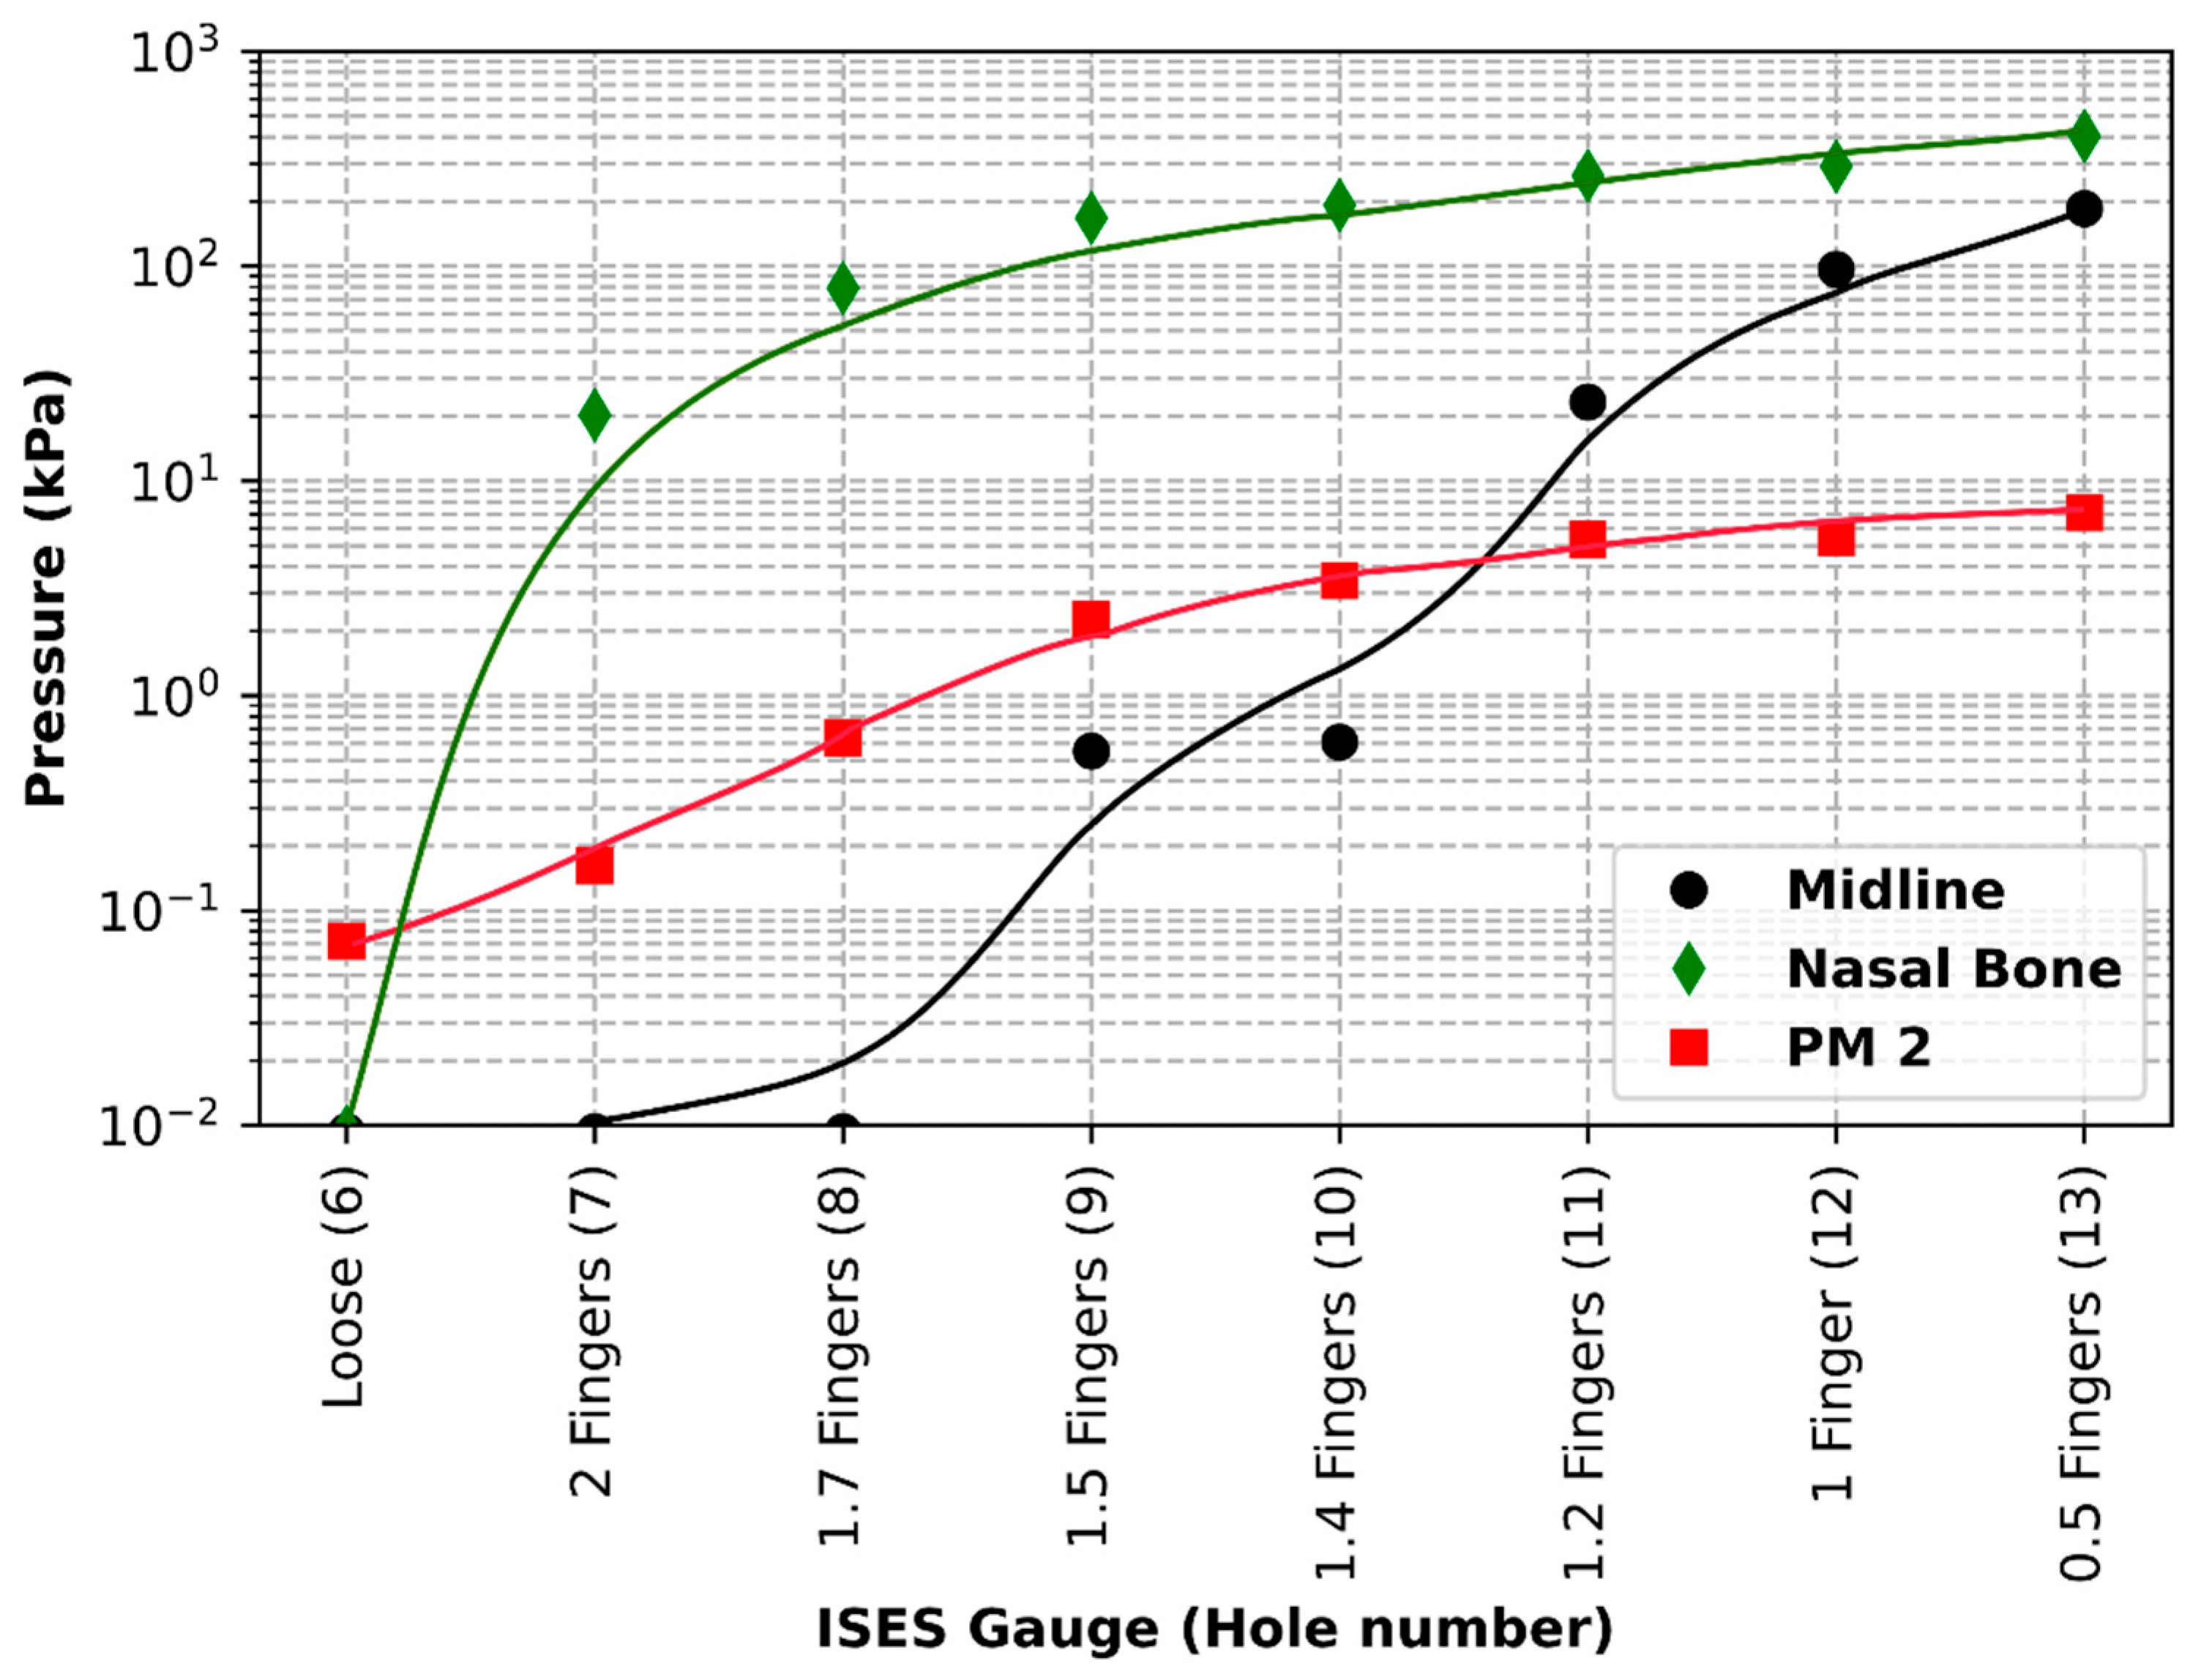
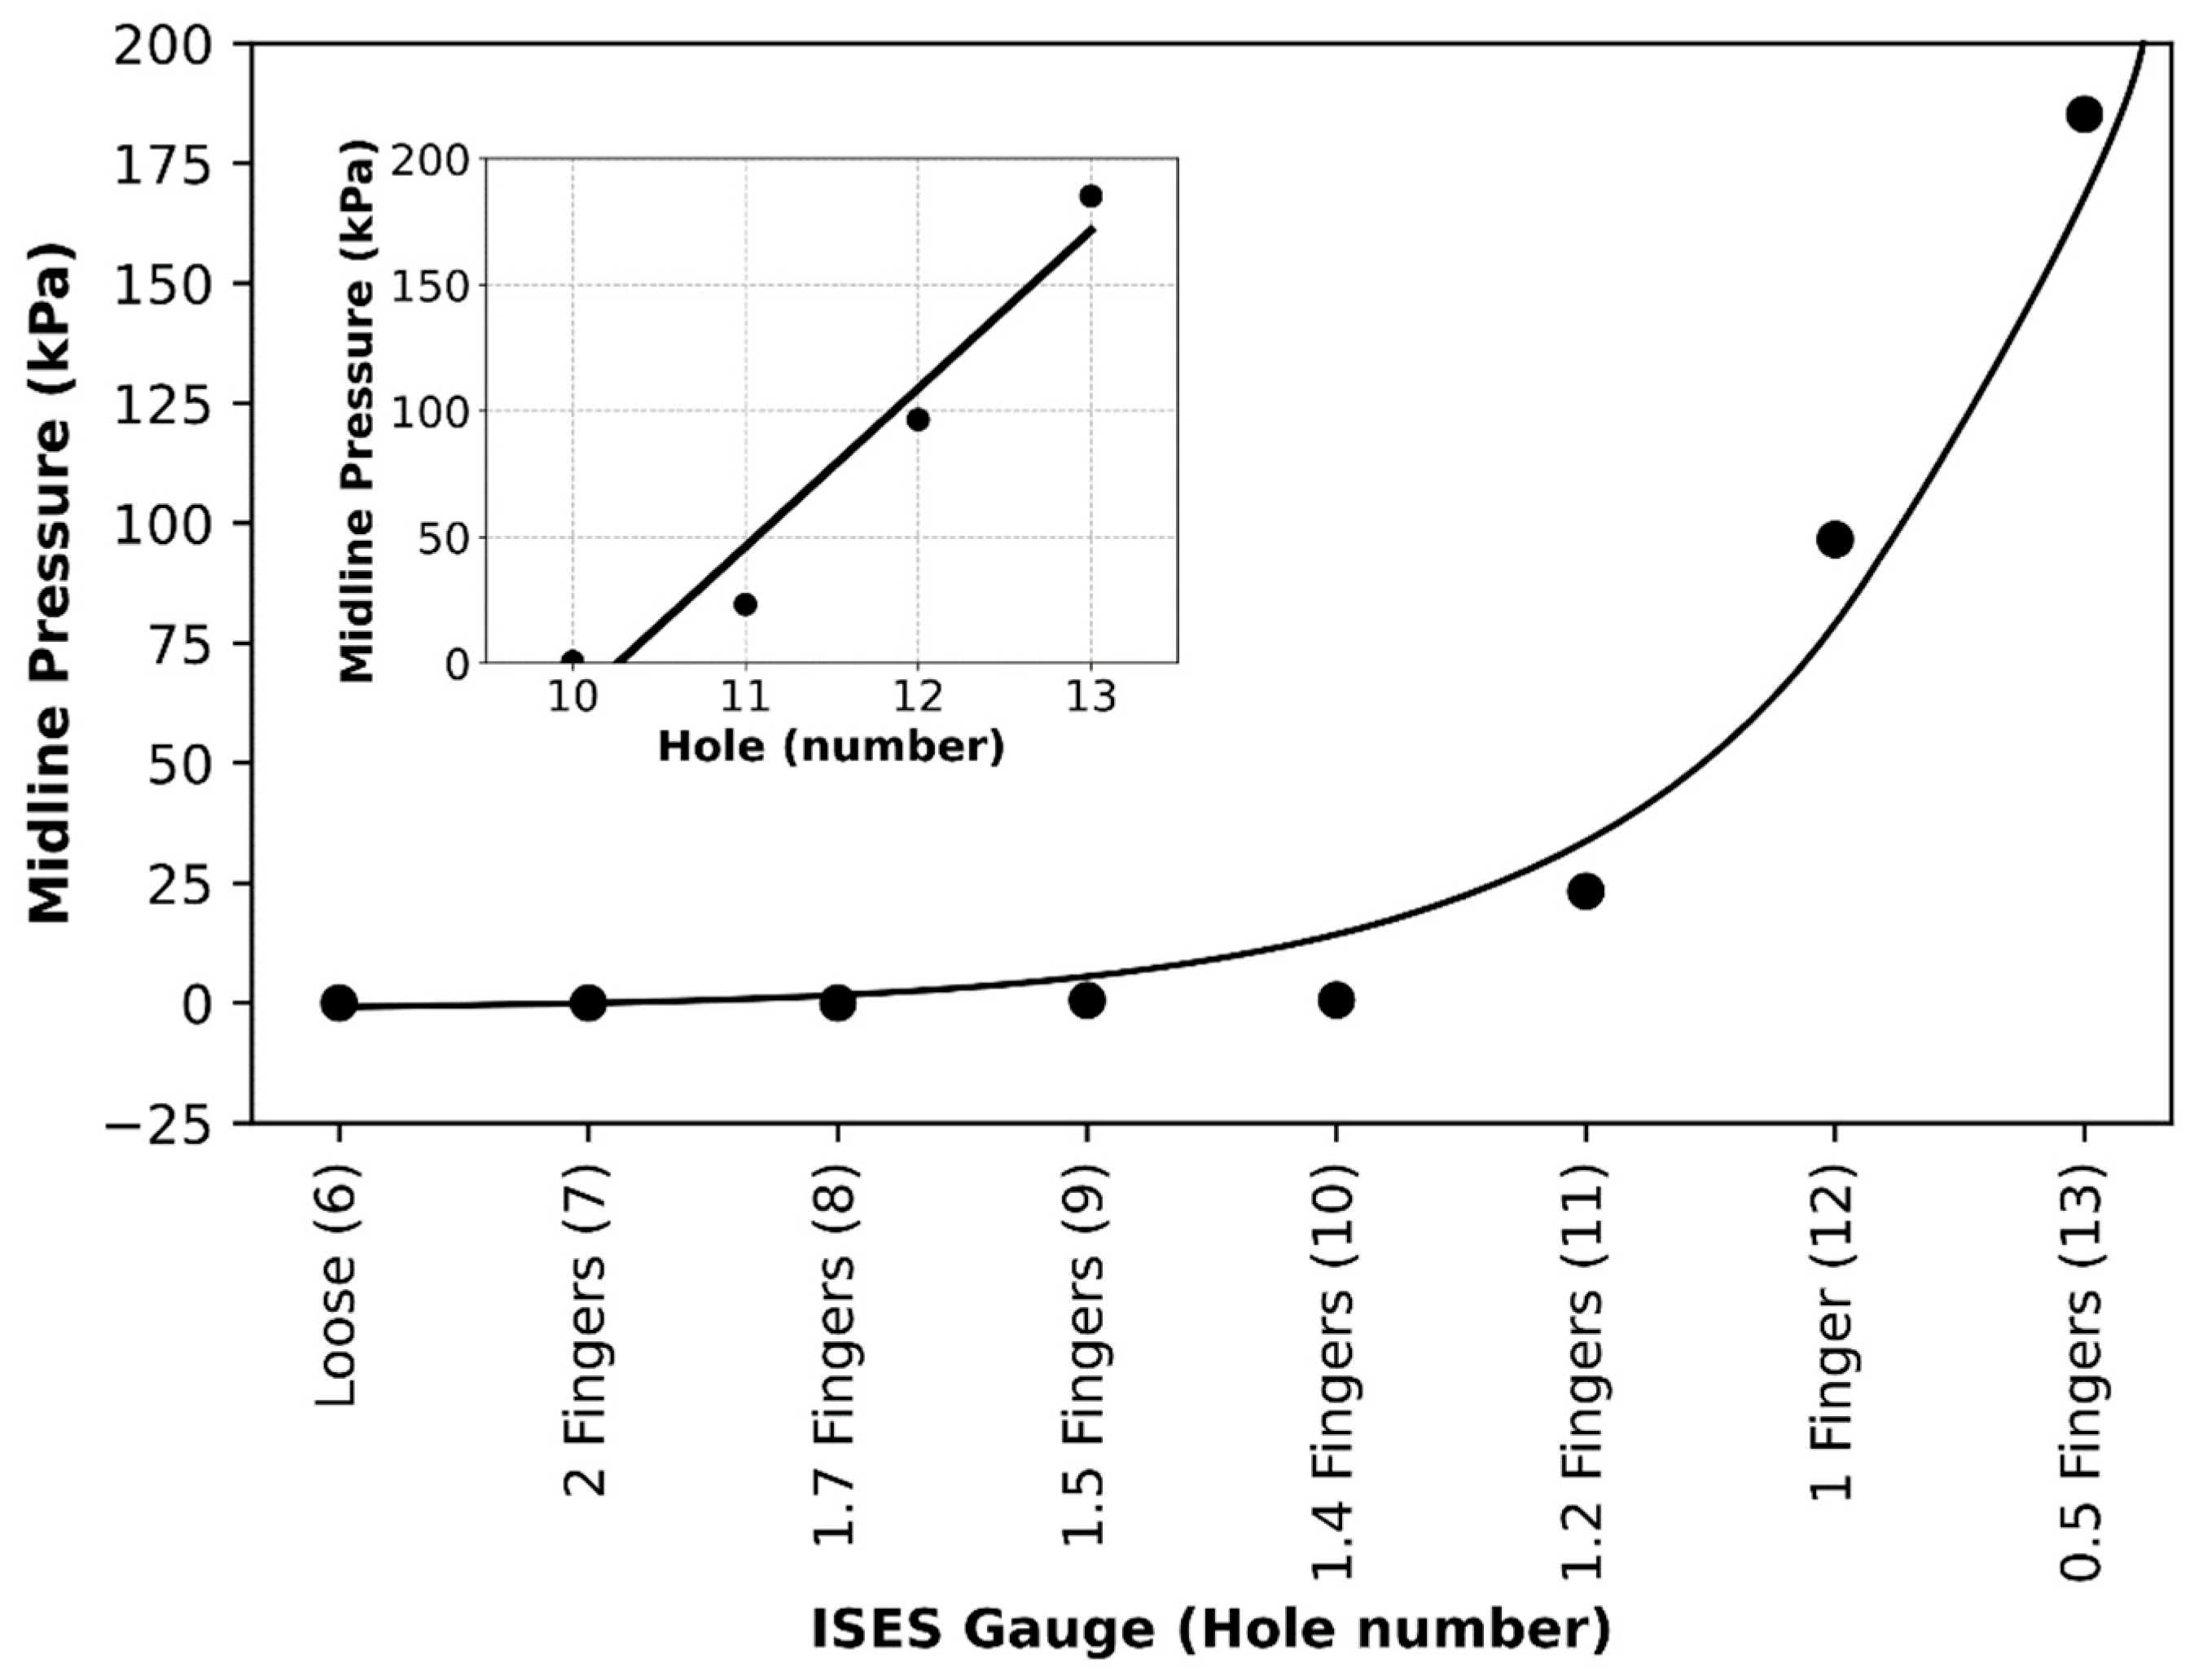
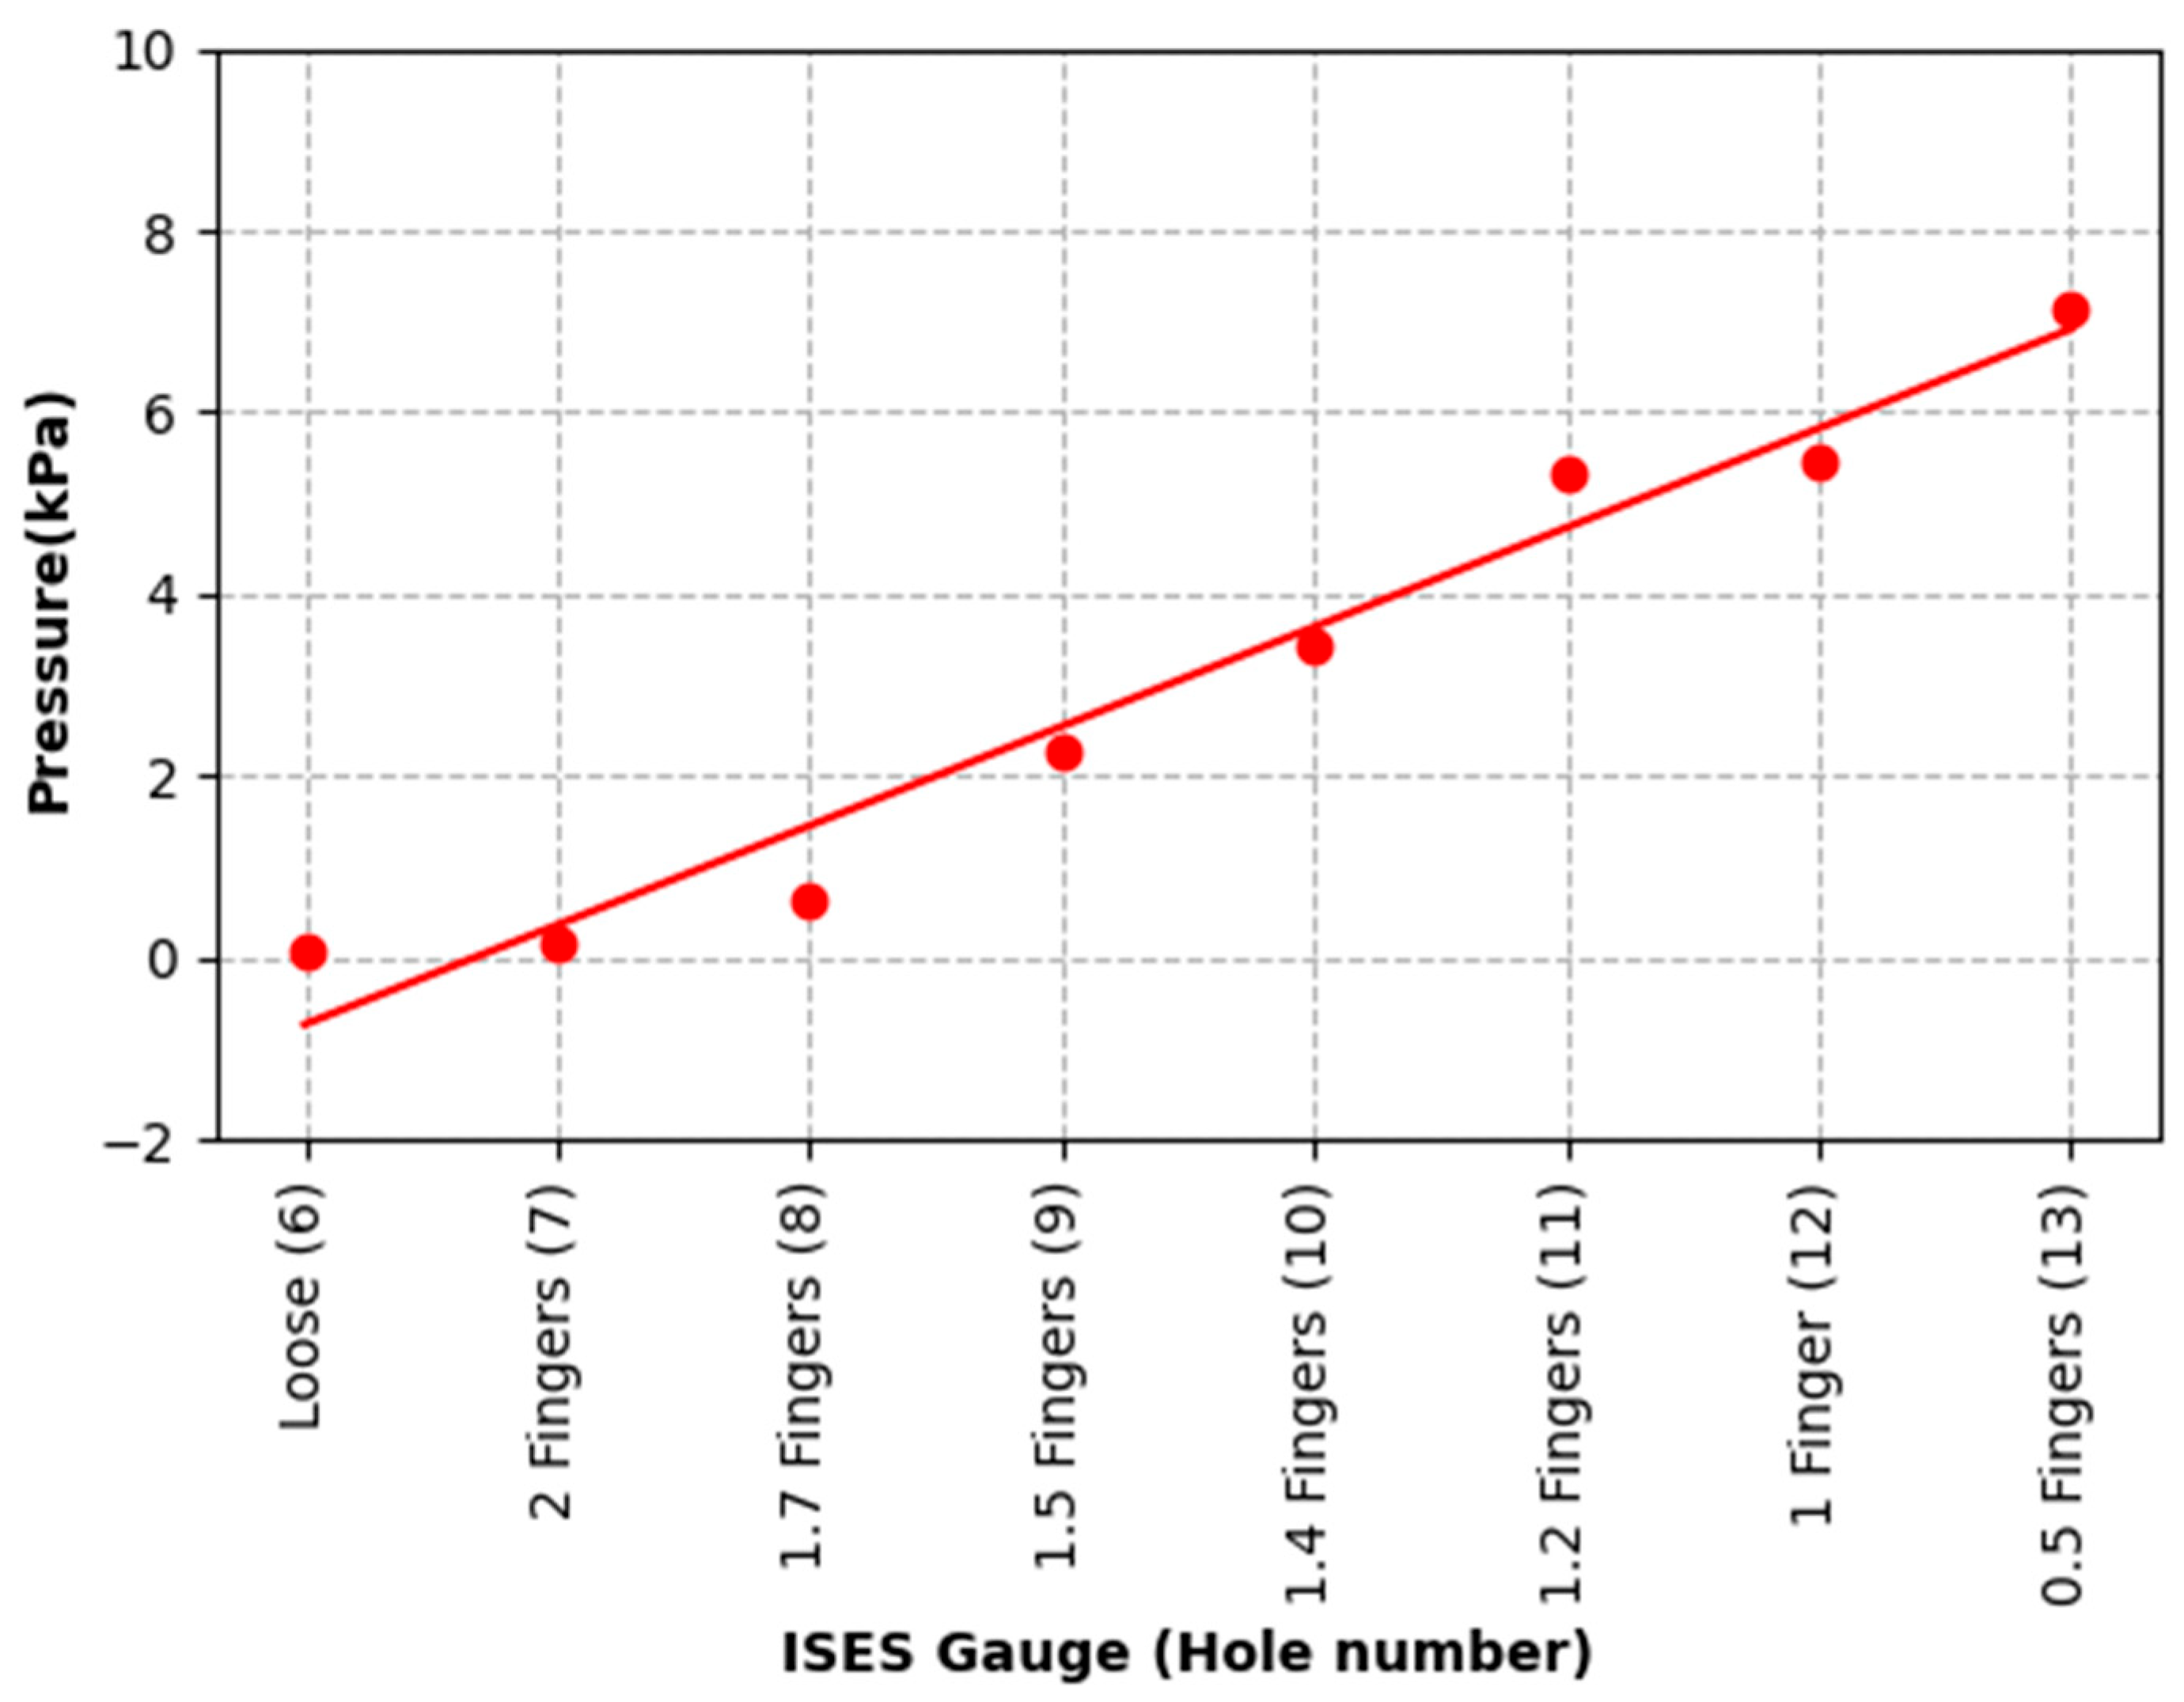
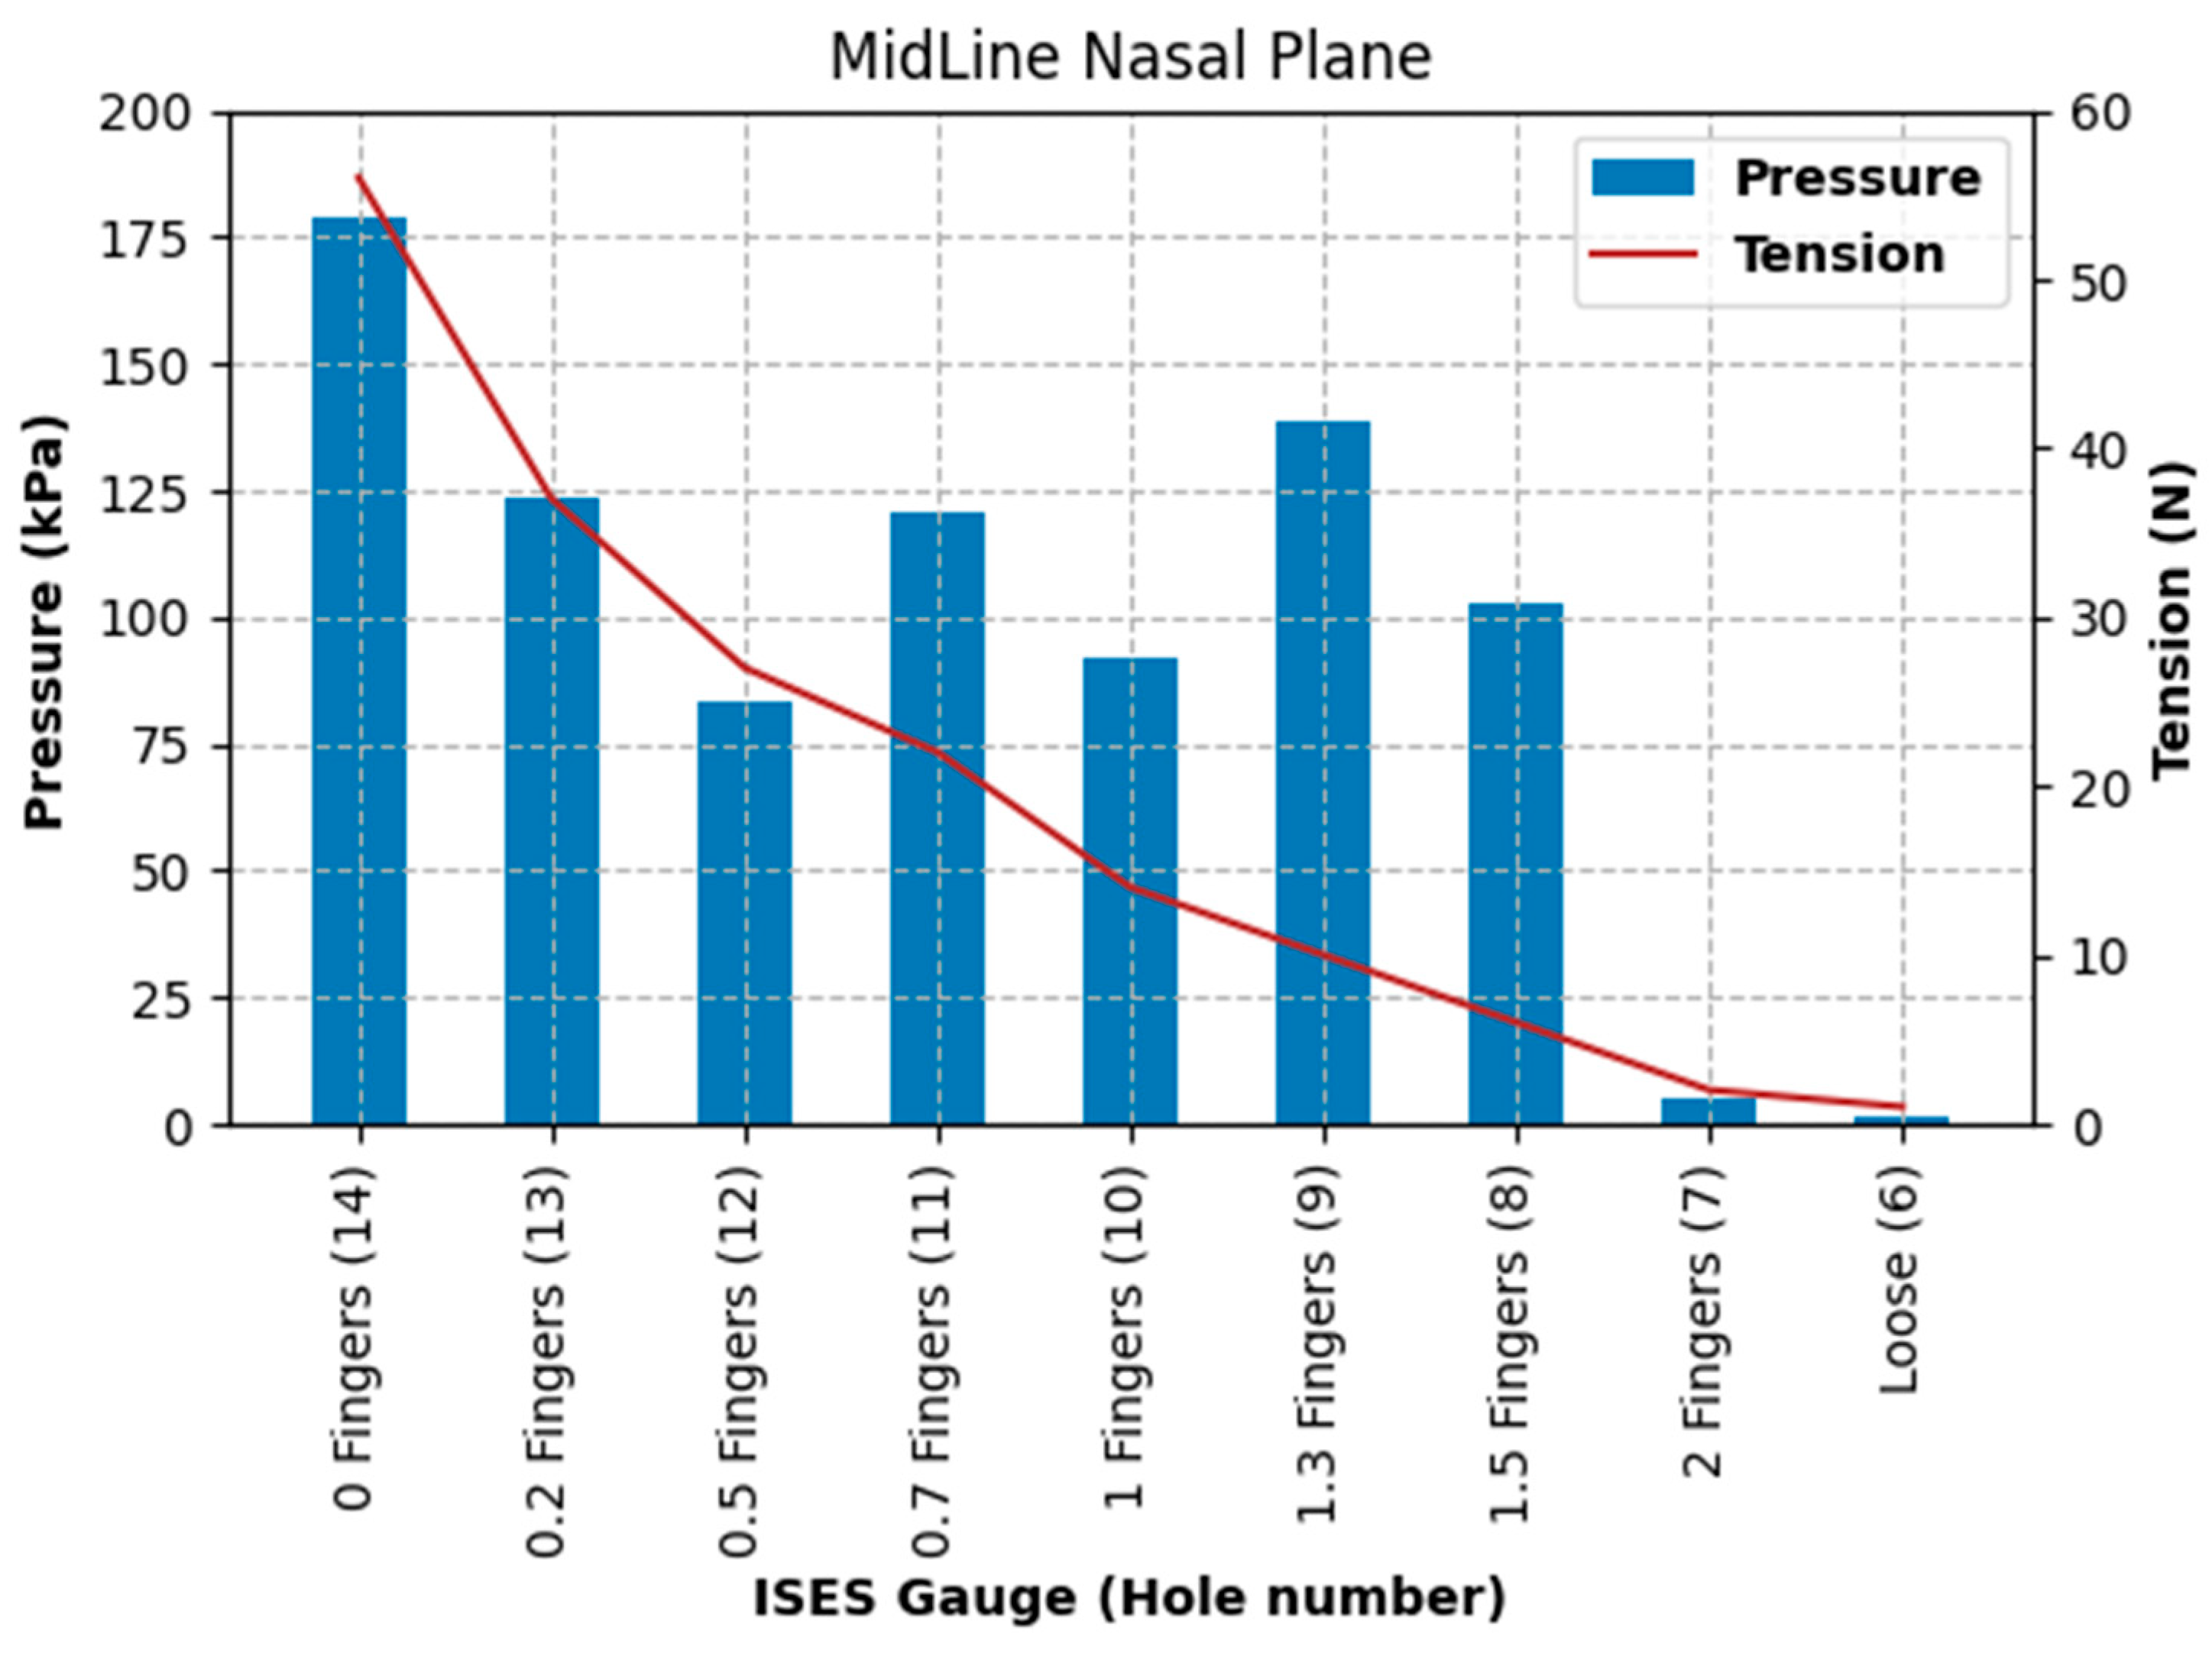
The purpose of the current study was to identify pressures, tensions, and data collection considerations across a range of noseband tightness settings. The first goal was to measure sub-noseband pressures at the frontal nasal plane, the left nasal bone, and at the second premolar tooth across the range of noseband tightness levels commonly used prior to the introduction of the FEI Measuring Device for Control of Noseband Tightness. The results of Test 1 revealed that pressure recorded at the frontal nasal plane, the location at which noseband tightness has traditionally been assessed, increased rapidly after the noseband was fastened tighter than Hole 10. This noseband tightness setting corresponds approximately with 1.4 fingers, as measured by the ISES Noseband Taper Gauge. An exponential increase in pressure occurs from that point (Hole 10) onward, as the noseband is tightened progressively to the tightest fitting, reaching 185 kPa. The initial slow increase in pressure up to that tipping point may arise as a result of shunting, i.e., preferential loading onto the prominent nasal bones on either side, until deformation of tissues effectively reduces their prominence such that the noseband starts to load the sensor at the midline position.
In a study of pressures beneath four different noseband types (cavesson, Swedish, flash, and drop), MacKechnie-Guire et al. (2024) also recorded steady increases (at the trot) in pressures when the noseband was tightened from two fingers of tightness to zero fingers of tightness [
18]. The highest pressures recorded at the zero fingers’ tightness level in that study were much lower (12.1 kPa median maximal pressure under the Swedish noseband) than those found in the current study (383.3 kPa). Two factors may help to explain this disparity in values. In that study, where an array of 64 pressure sensors was used in a pressure mat (covering an area of 160 × 40 mm square extending to the side of the face, well beyond the bony prominences of left and right nasal bones), pressures were measured at 64 different points along this facial area spanning across both nasal bones, the concave area between the nasal bones and the lateral aspect of the face beyond the nasal bones. Pressures at the central midline and lateral to the nasal bones are lower due to the topography of the face at those locations (concave or flat at some points). Values from all sensors were summed, but the pressures reported do not isolate specifically the values at the location of interest in the current study, i.e., at the nasal bone or the mandibular rami. As has been identified previously [
1,
25], the lateral edges of the nasal bones (with their characteristic curvature) are the two points on the dorsal aspect of the face most likely to be subjected to the highest levels of pressure. The current study aimed to quantify those pressures.
Some identification of the patterns of pressure distribution exerted across the front of the face has been carried out [
25,
35]. While summing and averaging of values measured across the dorsal aspect of the face are of value and interest for comparative purposes (comparing different nosebands, pressures exerted during different activities), they do not identify the actual pressures at specific points of interest, as the data from areas of high and low radii of curvature are pooled. It would be interesting to investigate whether the data collected by sensors located at the left and right nasal bones by McKechnie-Guire et al. [
18] would present similar pressure levels to those found in the current study.
In addition, in that study [
18], the zero fingers’ tightness level used was defined as “the inability to admit the taper gauge beneath the noseband and no compression of the soft tissues”. To facilitate this, holes were punched at 0.5 cm intervals in the nosebands used in that study to allow for greater precision regarding different tightness levels. The inter-hole distance in the noseband used in the current study meant that the only option when going tighter than 0.5 fingers was to tighten the noseband by 1.5 cm, and this may have led to there being a greater difference in tension (and therefore pressure) between 0.5 fingers and zero fingers in the current study compared with that study. It is likely that this will have resulted in a difference between the definition of “zero fingers” in both studies (with “zero fingers” in the current study being tighter).
Data from the current study show exponential increases in sub-noseband pressures at settings tighter than 1.4 fingers’ space under the noseband, and this may also help to explain the substantially higher pressures recorded at the tightest noseband setting, as any increase in noseband tightness will have resulted in an exponential rather than linear increase in pressures.
In the current study, the substantial difference between pressures recorded at the midline frontal nasal plane location and the left nasal bone reflects the topography and profile of those locations, with a slight concavity frequently being present between left and right nasal bones that allows for some hammocking at this point. However, it is possible that, as the noseband is tightened, once the soft tissues have been fully compressed, the nasal bones themselves (and indeed other structures, such as the mandible) deform under the noseband’s applied load. This should result in an increased load to the midline pressure sensor, which is itself conformable but does have a finite height and so will, to a certain extent, fill the hollow (negative curvature region) between the nasal bones. The large pressure increases per hole seen for the midline beyond the hammocking region and the nasal bone would support this view.
The higher pressure found at the left nasal bone (which has a high radius of curvature) in comparison to the pressure at the frontal nasal plane is supported by the law of Laplace [
28], where the same tensional force in the noseband is producing different levels of force against the underlying tissues, depending on the radius of curvature at that location (nasal bone vs. frontal nasal plane). The clear relationship shown between noseband tension and sub-noseband pressure, as predicted by the Law of Laplace, should allow regulatory authorities/riders to estimate sub-noseband pressures by measuring noseband tension, whether manually or using a specifically designed instrument.
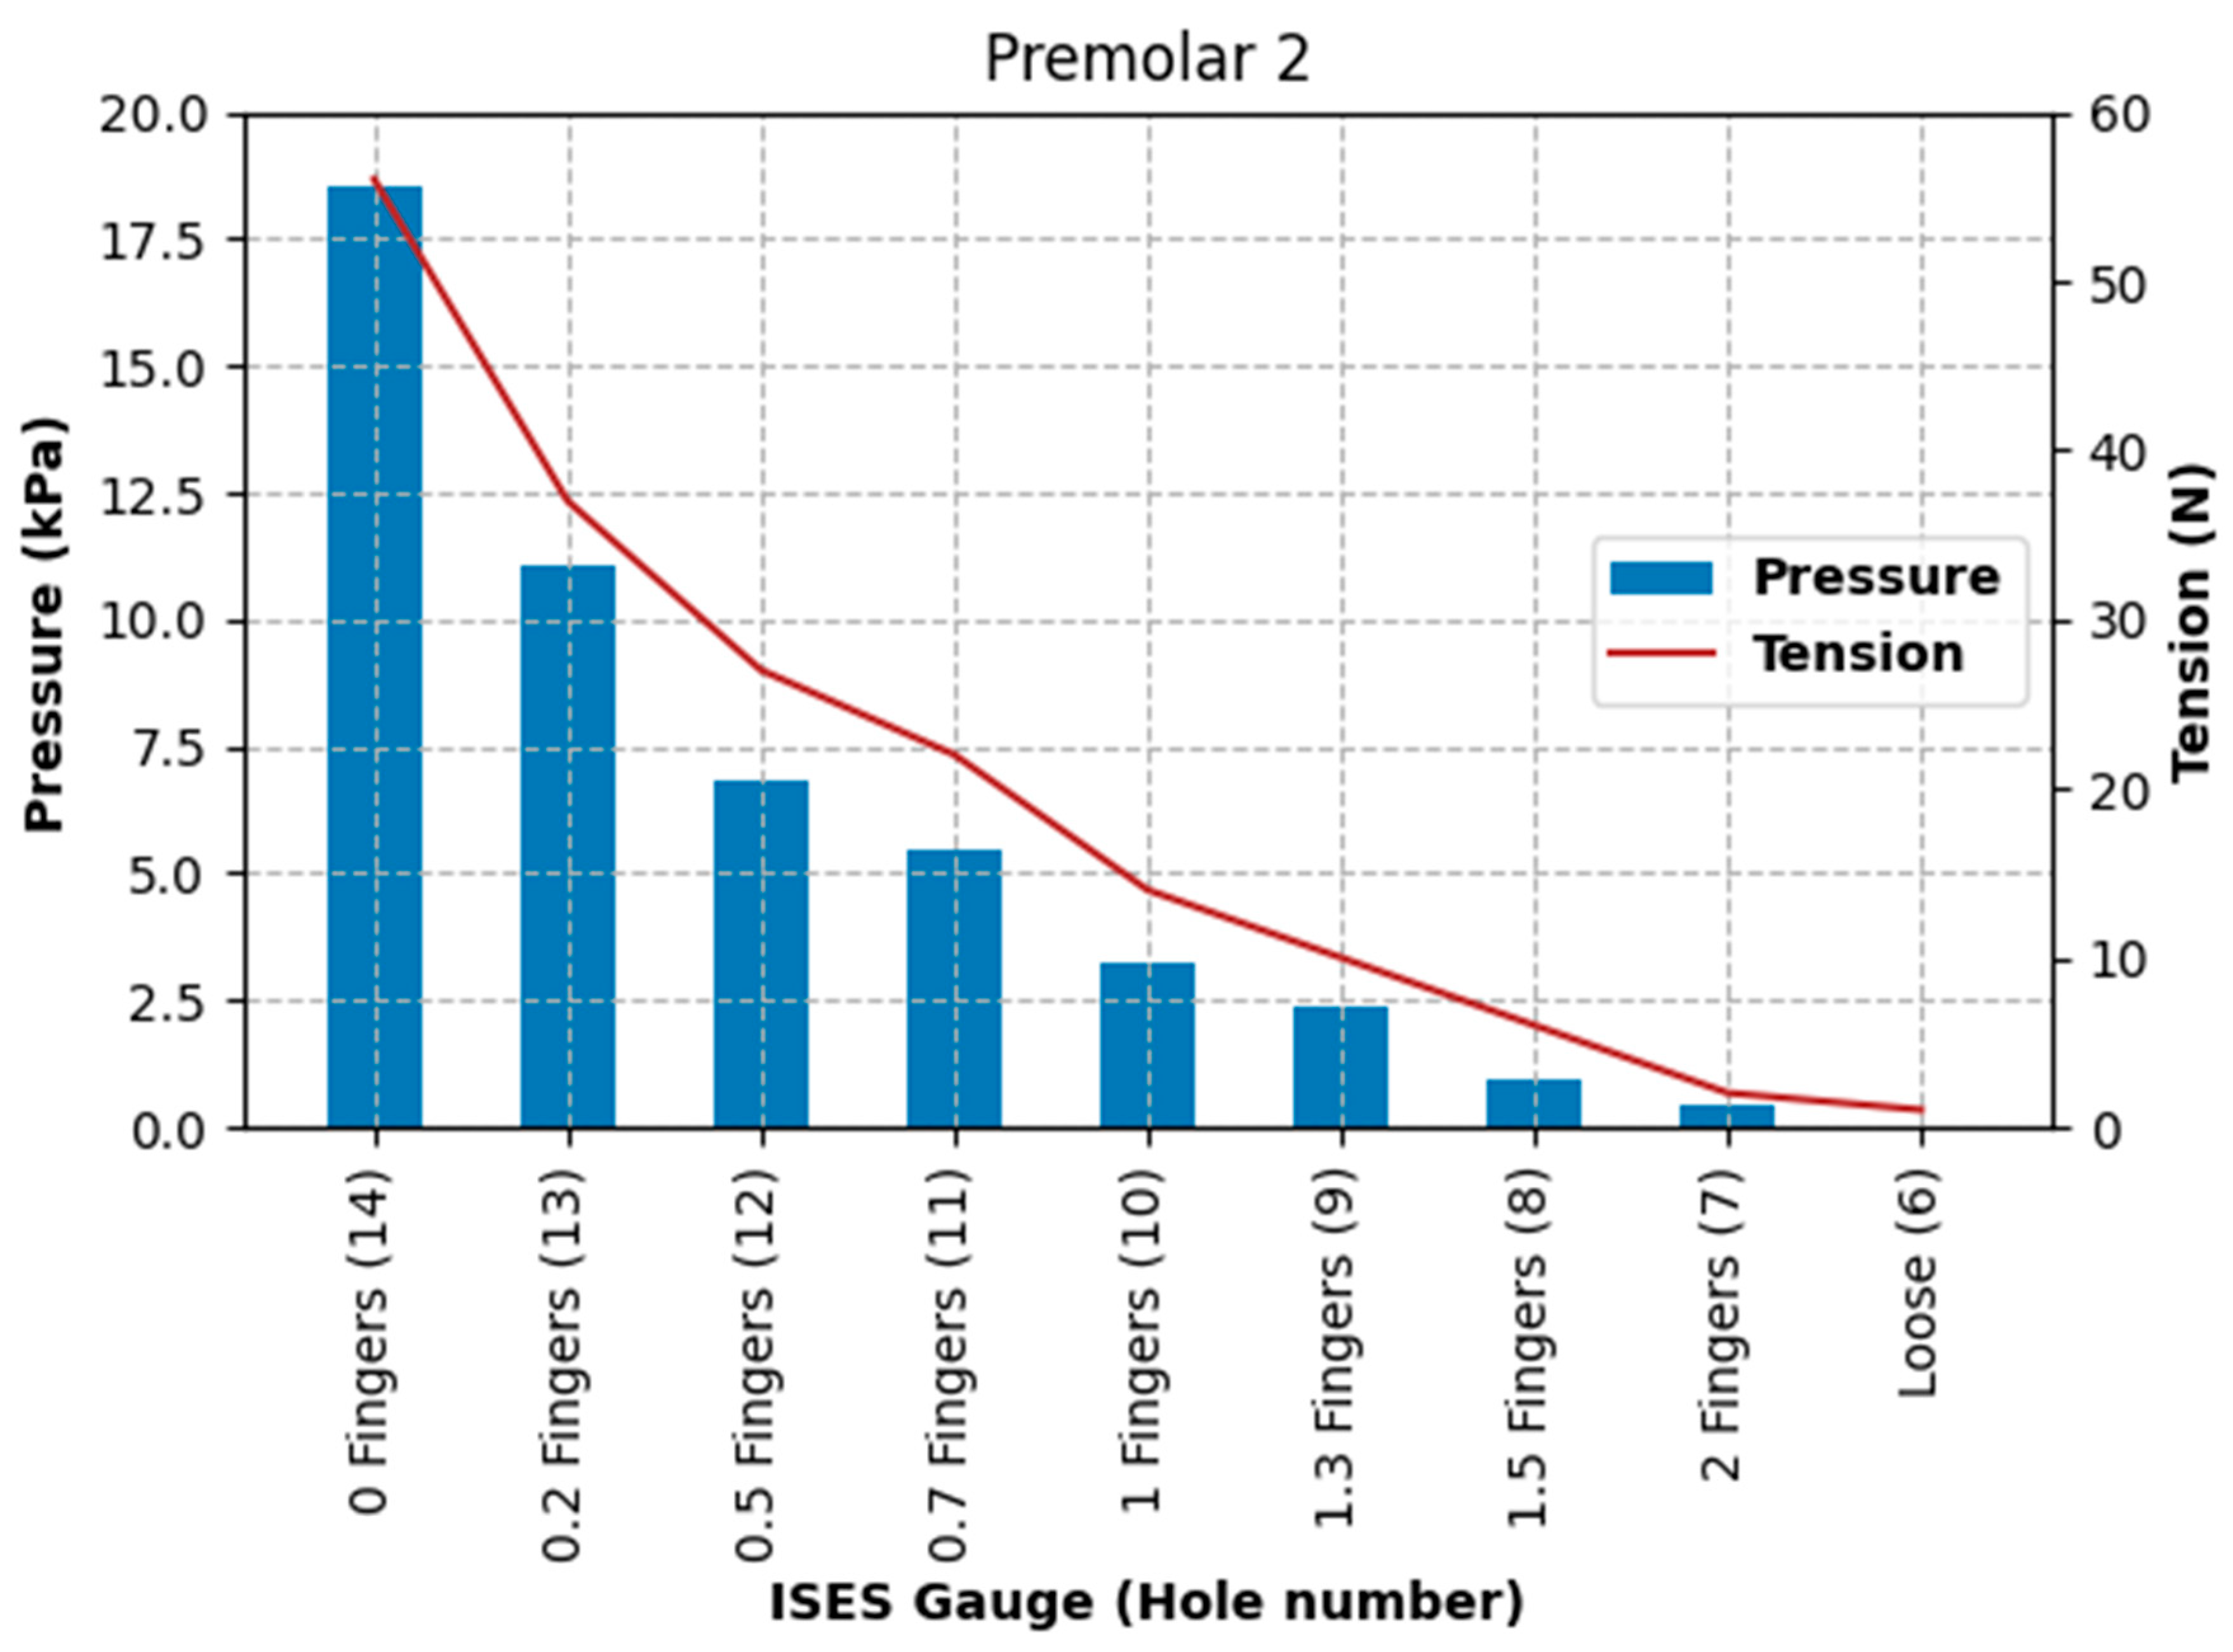
The increase in pressures recorded at the left nasal bone and the second premolar tooth location appears to show a strong correlation; the rate of increase in pressures differs greatly, with an exponential increase in pressure recorded at the left nasal bone, and there is nearly a two orders of magnitude difference in pressure. Maximum pressures at the location of the second premolar tooth were relatively low (71.3 kPa), even at maximal noseband tightness. These relatively low pressures may have been due to lateral movement of the sensor during tightening of the noseband (and consequent shifting of tissues) off the surface of the second premolar tooth. A live horse would be expected to exceed the current pressures at this site as it chews spontaneously during ridden work and, therefore, moves its dental arcade laterally against buccal mucosa that is immobilised by the internal face of the noseband. To confirm, the current cadaver data represent the best-case scenario.
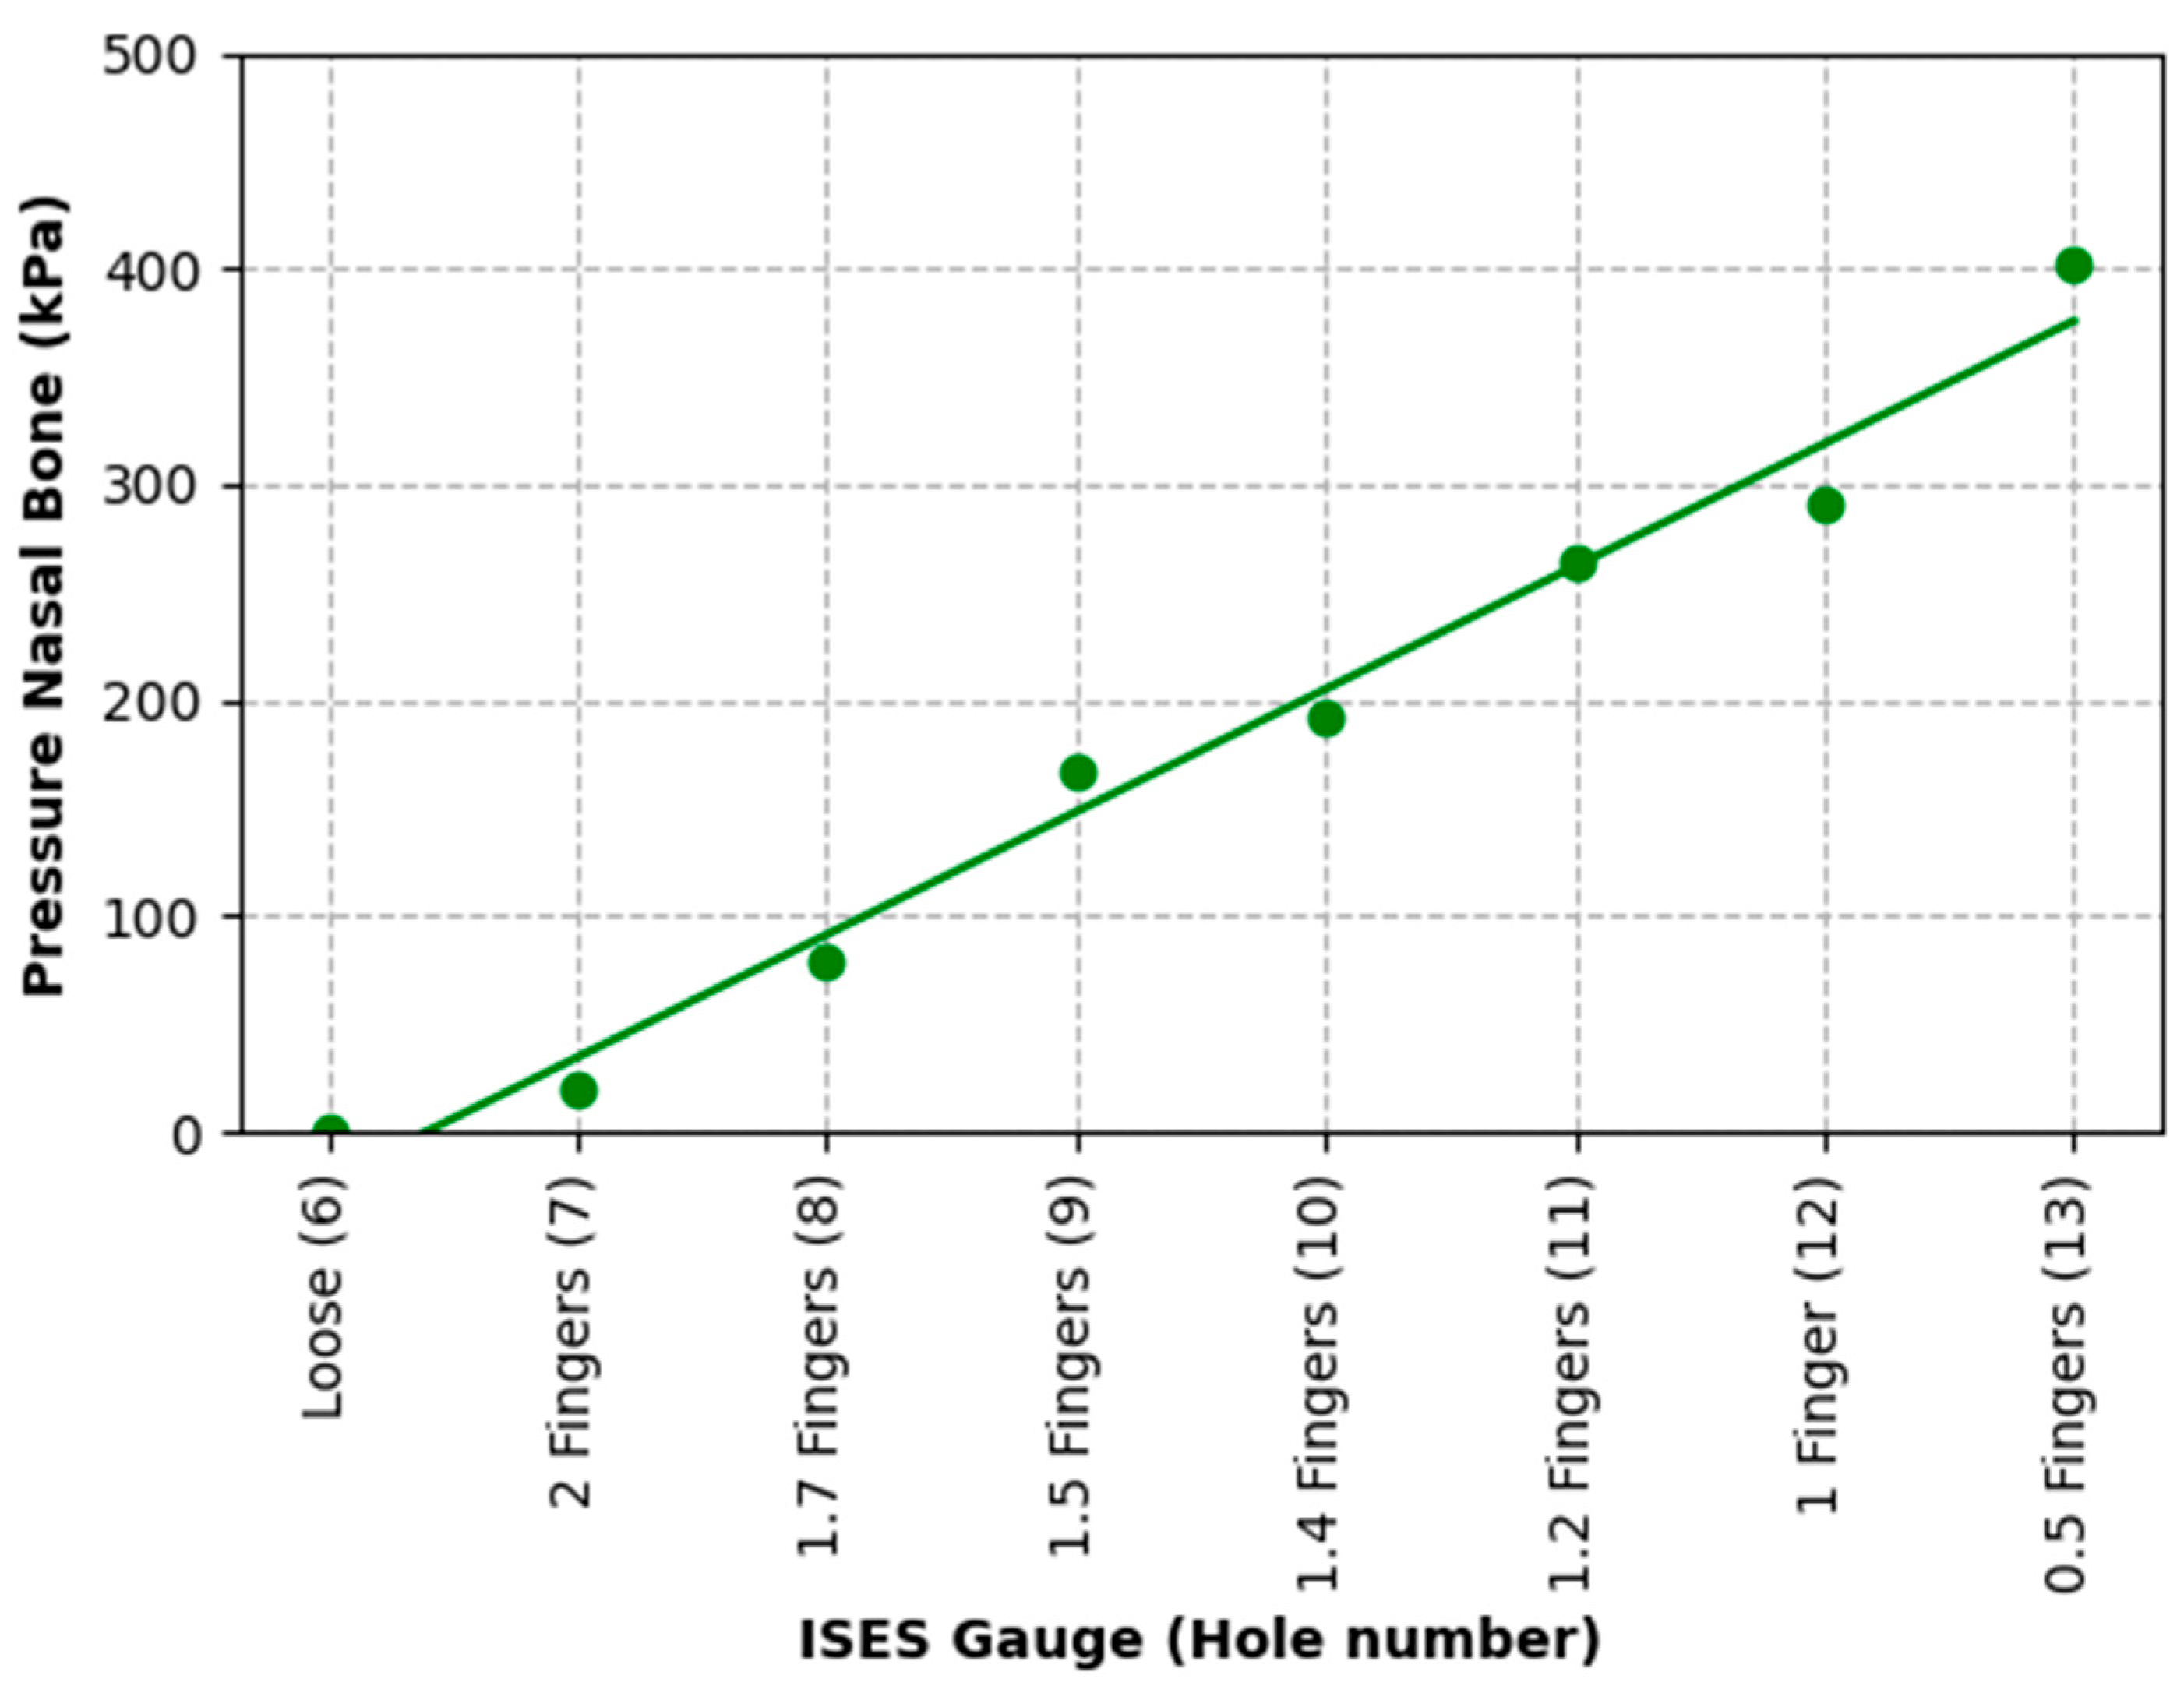
The highest pressure recorded at the left nasal bone, of 403 kPa, significantly exceeds pressure levels known to cause tissue damage and pain in both humans and animals [
15,
16,
35]. MacKechnie-Guire et al. (2024) found that pressures at the mandibular rami are significantly higher than at the nasal bones, in many cases 3–4 times higher, raising alarm about the previously unmeasured pressures at this location and the need for regulation [
18]. Due to limitations of the technology used in the current study, pressures at the mandibular rami were not measured.
Unlike pressures recorded as transient and pulsatile in other studies [
1,
25], pressures exerted at the nasal bones and mandibular rami are likely to be sustained at that location if nosebands are tight. Lateral excursions of the mandible would tend to produce a rotational force in the noseband relative to the horse’s nose. Such rotational forces will introduce shearing effects in tissue contacted by the noseband.
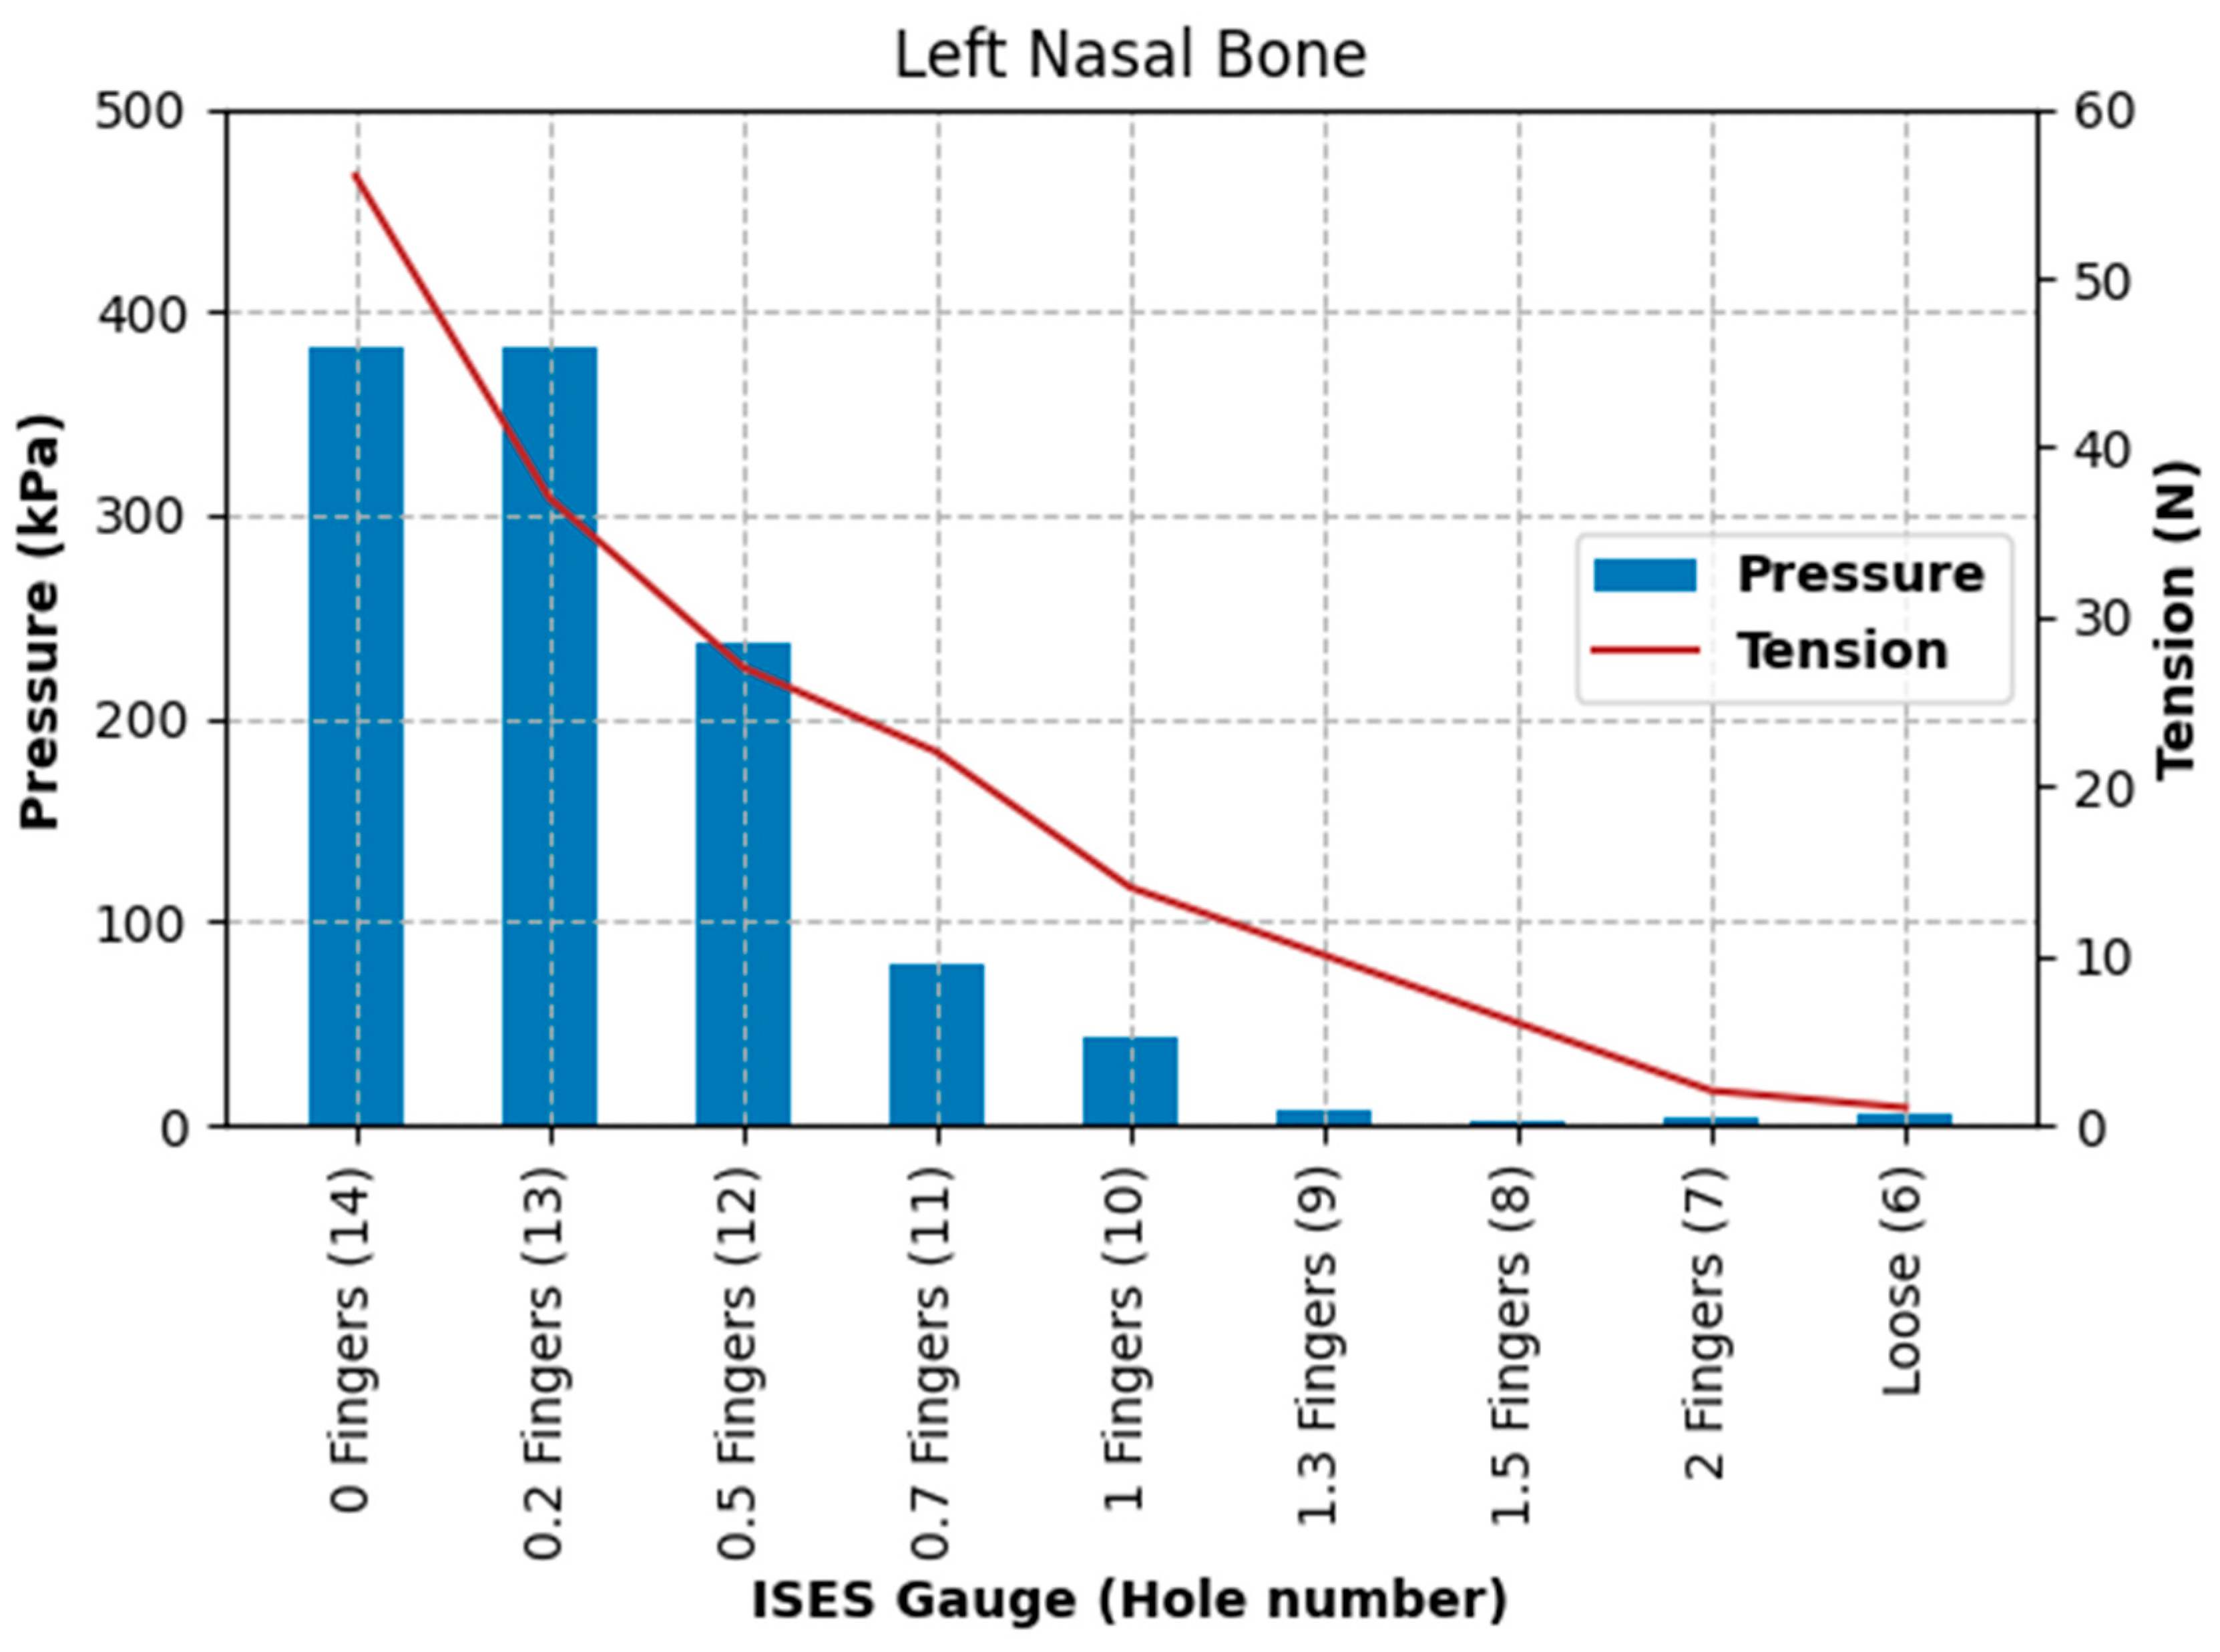
The results of Test 2 revealed that pressures for the left nasal bone again increased exponentially, after approximately 1.5 fingers (ISES Noseband Taper Gauge) of noseband tightness, reaching 383.30 kPa at the tightest noseband fitting. The exponential rise in pressure at approximately 1.4 fingers of noseband tightness demonstrates that, as compliance of the tissue is saturated and the noseband is effectively tightening against bone, pressure levels rise steeply. Occasional reductions in pressure can be seen (
Table 3) at both the frontal nasal plane and left nasal bone at increasing levels of noseband tightness. These are most likely due to lateral movement of skin as the noseband was being tightened, resulting in movement of the sensor off the left nasal bone and possibly puckering skin at the frontal nasal plane in such a way as to angle the sensor and reduce the pressure applied to the pressure-measuring surface.
The second premolar tooth pressure data are again relatively low (185 kPa), reflecting the prospect of either cushioning of the sensor by the cheek tissue or movement of the sensor off the point of interest during tightening of the noseband. It should also be considered that the buccal mucosa is more easily damaged than skin and that stretched tissue will be thinner and, therefore, will be less resistant to pressure than unstretched tissue.
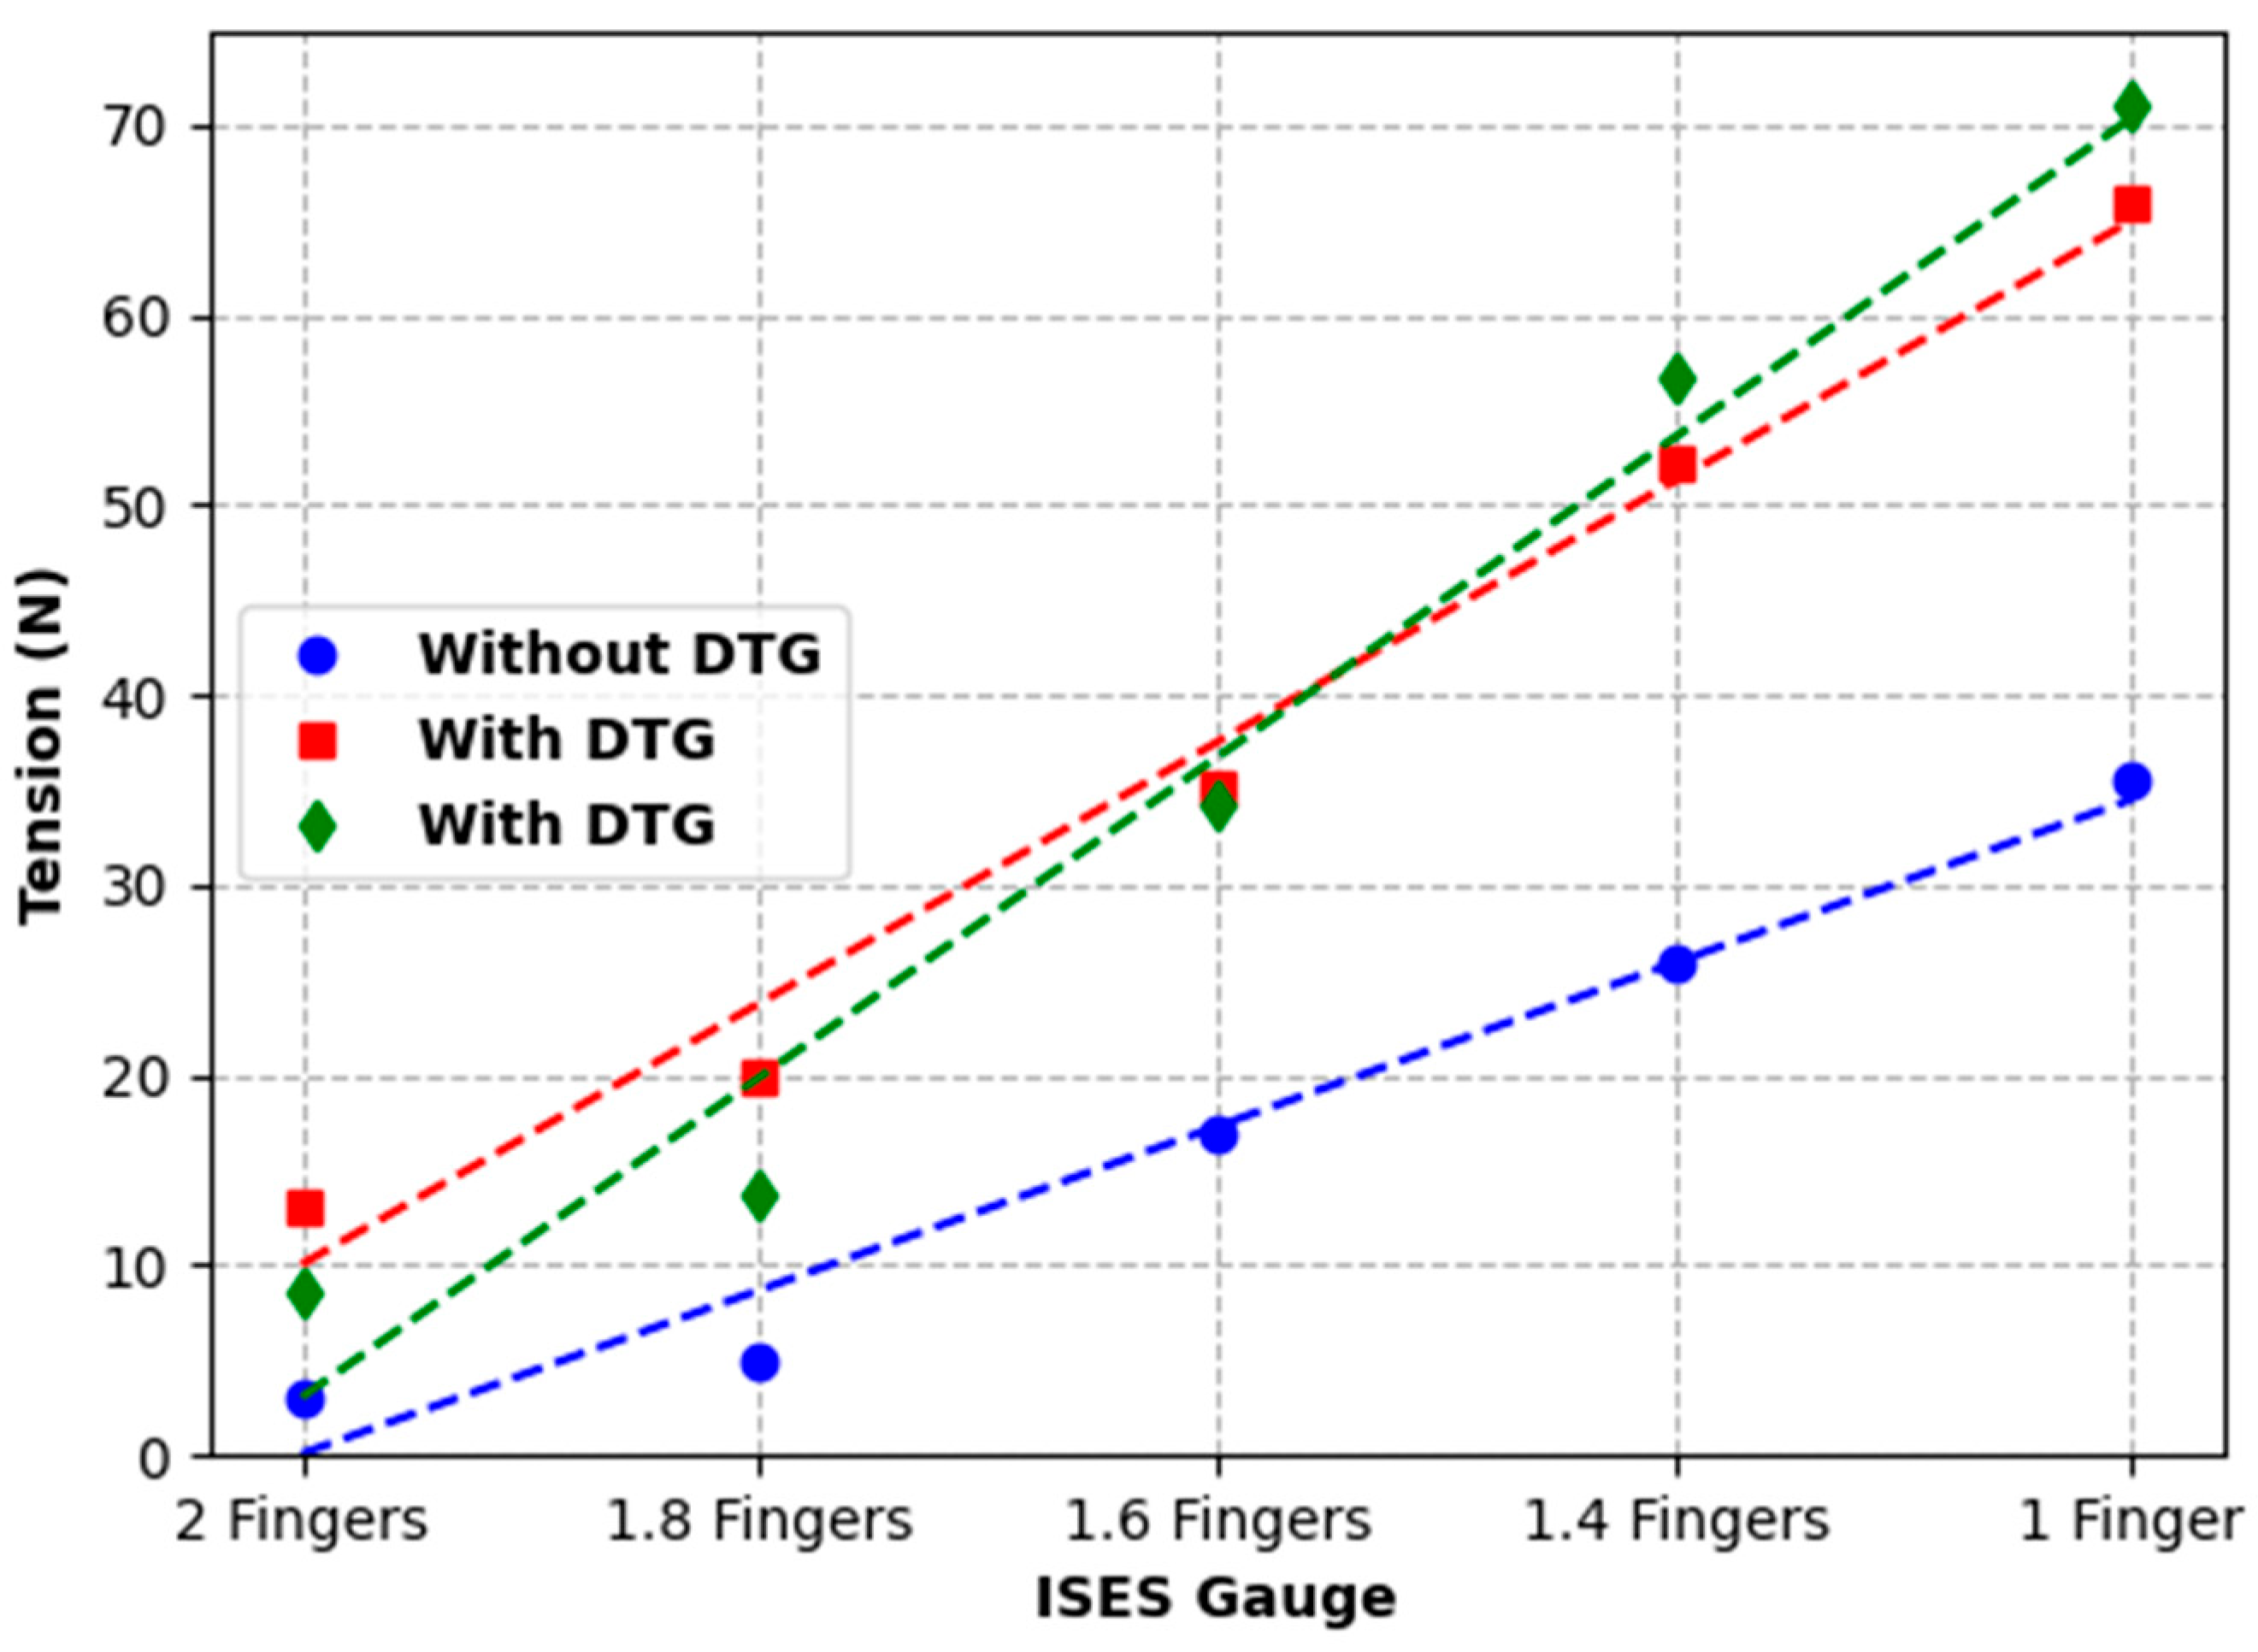
The findings of substantial increases in pressure and tension for each 0.5 finger increase in noseband tightness (
Figure 13,
Figure 14 and
Figure 15) reflect other research findings in a study that involved eight live horses [
18]. In that study, four types of nosebands were compared across five tightness levels, including post hoc tests for noseband type and noseband tightness. It failed to find a significant difference between 2.0 and 1.5 fingers, possibly due to the pooling of data from a variety of noseband designs. A potentially unforeseen consequence of that study is that the FEI has adopted a gauge with only 1.5 fingers’ space [
27].
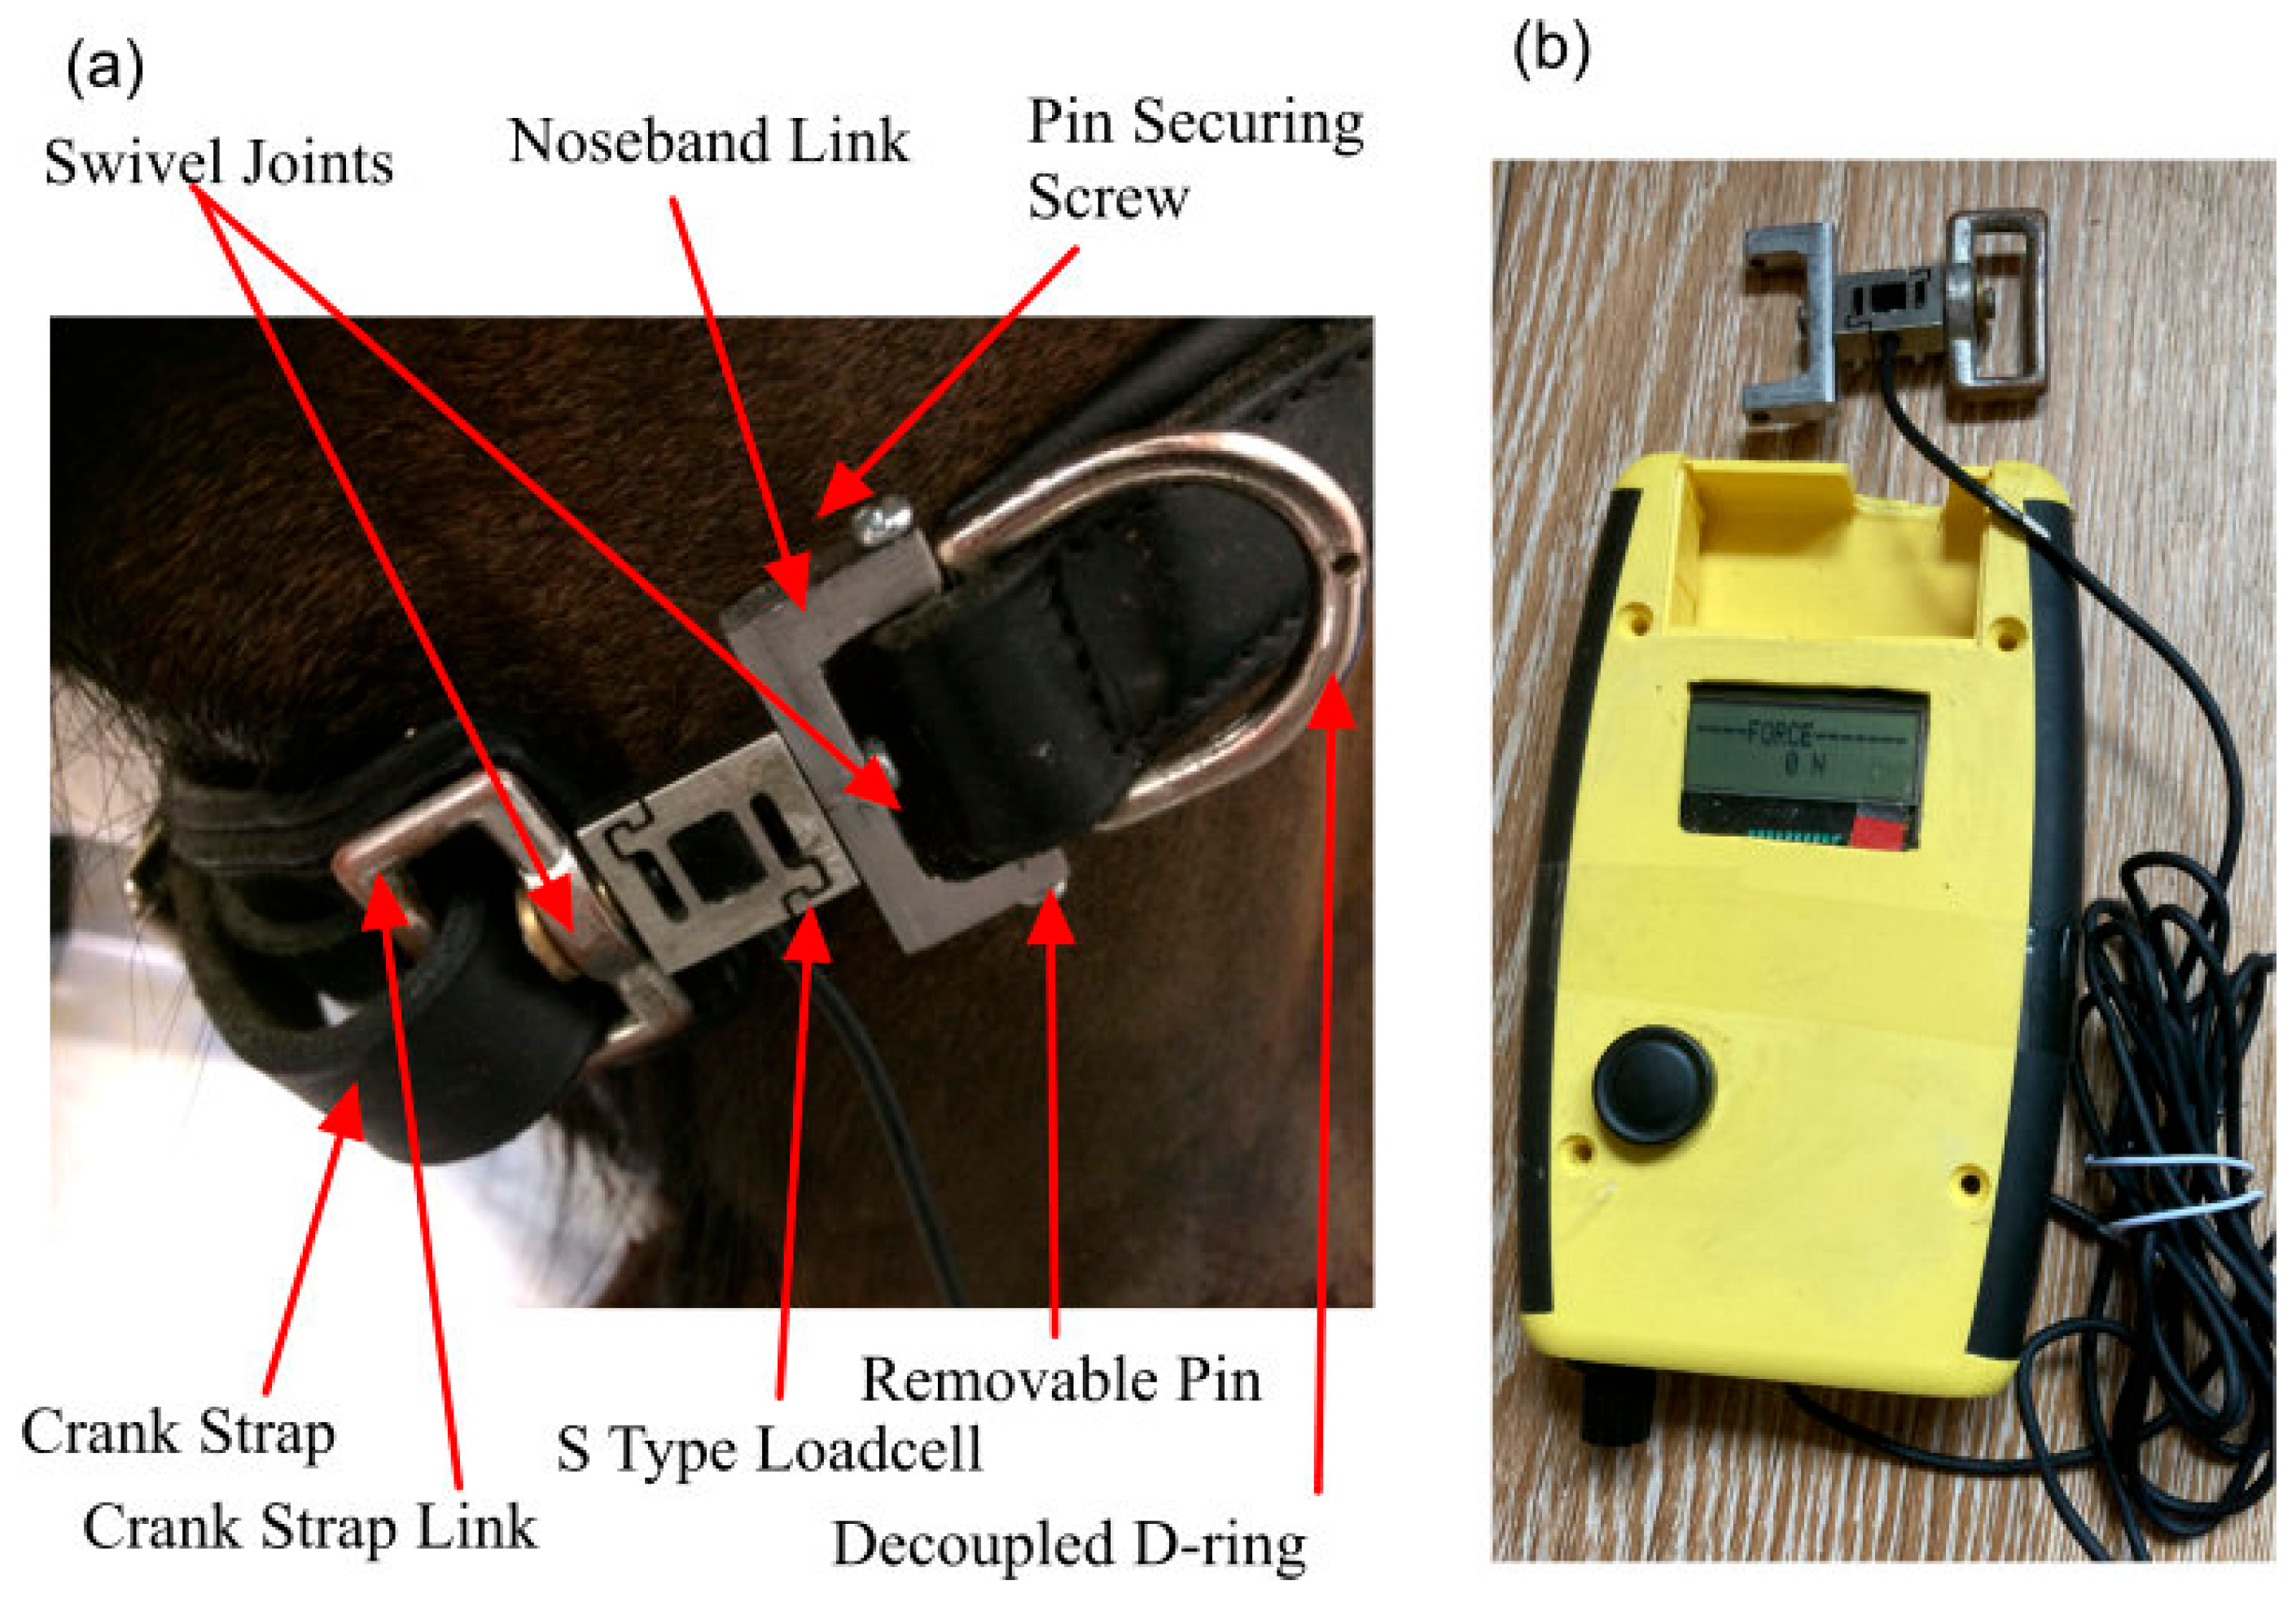
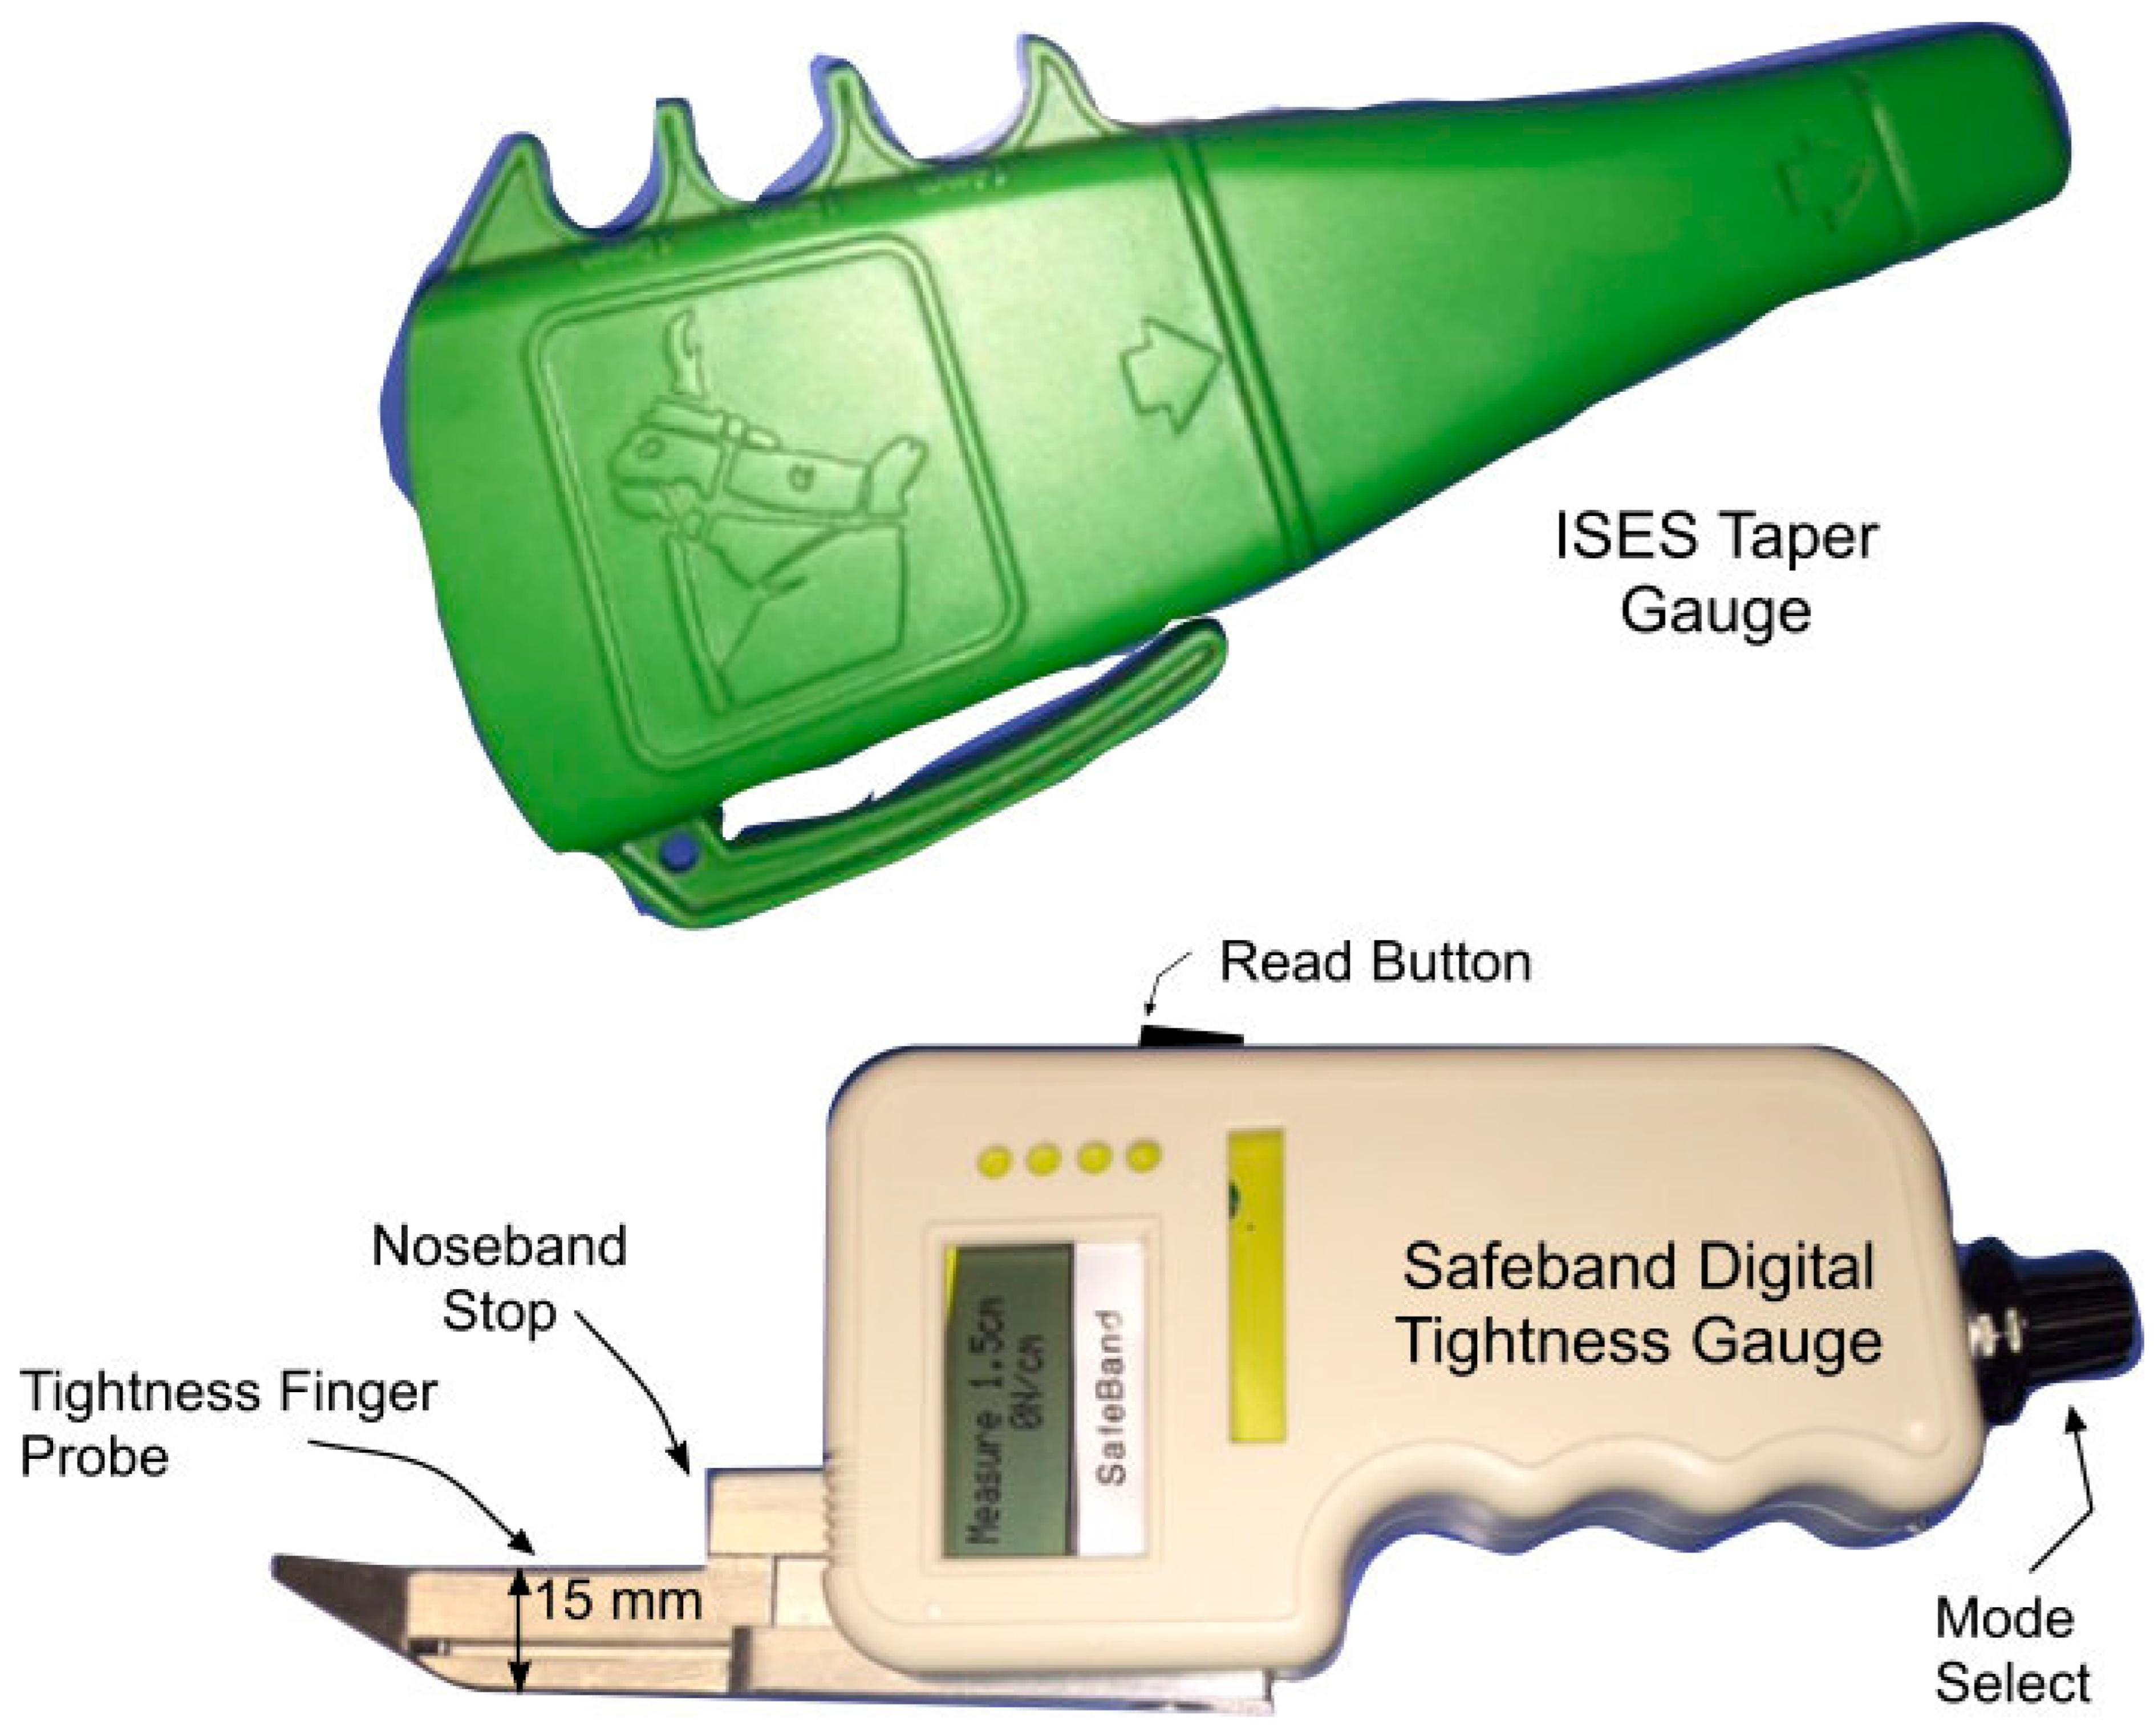
While the introduction of the Digital Tightness Gauge used in Test 3 artificially increased noseband tension, as measured by the strain gauge incorporated into the noseband, the impact on noseband tightness was uniform and so could be easily compensated/corrected. The output, measured in N, correlated with increasing noseband tension and may provide an objective measure of noseband tightness. Alternatively, for very tight nosebands, a Digital Tightness Gauge probe finger with a lower profile corresponding to half a finger could be used, but clearly it would be better if such tight nosebands did not occur.
It has been suggested that the use of very tight nosebands is comparable to the use of tourniquets on humans and animals [
26]. Sustained pressure on living tissue is a concern in the use of tourniquets, where the duration of application and the level of pressure influence the likelihood and extent of tissue damage [
15]. During surgery, tourniquets are routinely used to restrict blood flow to extremities [
36,
37], leading to recommendations regarding the optimal tensions and durations of use to optimise outcomes [
16]. Adverse effects associated with the use of such tourniquets include nerve and soft tissue damage and pain, both during and following tourniquet use [
15,
36,
37,
38,
39]. Neuron damage, muscle disabilities, and pain have been associated with sustained tourniquet pressures (6.6–46.7 kPa for 2 h), but briefer tourniquet application may also result in tissue damage [
40,
41]. While patients undergoing surgery are usually under general anaesthesia, an investigation into tourniquet-induced pain, subjecting 11 conscious healthy adult volunteers to tourniquet pressures of 39 and 53 kPa at the thigh [
42], resulted in half of the interventions being terminated due to intolerable pain at the site of the tourniquet. Levy et al. recommend the lowest possible tourniquet pressure to maintain arterial closure in upper limb surgery, typically 13 kPa above systolic blood pressure [
43]. Sarfani et al. support this recommendation, recommending an upper limit of 33 kPa during wrist surgery [
44]. The use of tourniquets is generally a one-off event, unlike the use of nosebands, applied throughout daily or regular exercise and training, often for prolonged periods of time. Nosebands are typically tightened for the duration of exercise, which may last between 30 and 60 min and is likely to exceed the duration of tourniquets tightened to 32 kPa; for 20 min, they are used to elicit pain in horses experimentally [
45].
While several in vivo studies measuring sub-noseband pressure levels on horses report cyclical changes in pressures recorded [
18,
25], if the lowest levels of pressure (i.e., the troughs) are sufficiently high to impair blood supply, via the vasa nervorum and vasa vasorum, small blood vessels that supply nutrients and oxygen to blood vessels and nerves of the underlying tissues and structures, and also the networks of capillaries supplying the periosteum, a tourniquet-type effect is possible, as this level of pressure will be sustained throughout exercise. The impact of recurring pressure peaks of the magnitudes reported in several studies [
18,
25] has not yet been studied. In noseband usage, while the contours of the face and location of major blood vessels prevent complete vascular restriction from occurring, localised pain due to direct pressure during usage at tightness levels resulting in this magnitude of pressure exertion at specific locations is highly likely. Although no data are currently available, there is concern that, indirectly, tight nosebands can compress the tongue and may lead to ischaemia, especially in the case of double bridles since two bits occupy more volume within the mouth than a single bit. Tight nosebands may mask pain, discomfort, and training methods that do not align with learning theory.
A small percentage of riding horses show deformation at the location of the noseband, accompanied, in some instances but not all, by loss of hair or changes in hair pigmentation. Arguably, such changes to the haircoat may just as easily arise from loose gear that rubs the integument. Retrospective analysis of radiographs of a group of horses investigated for a range of clinical abnormalities was inconclusive in its findings regarding nasal bone pathology [
12]. Interestingly, a higher incidence of nasal bone abnormality was found in the warmblood horses within that study, possibly suggesting a link to particular riding activities (notably dressage) and the use of a noseband. In their study of 144 mature cavalry horses, [
14] reported that 37.5% had one or more radiographic changes to the nasal bones, with radiological examination of these horses showing bone deposition (6.9%) and bone thinning (33.3%). Pérez-Manrique et al. (2020) reported that 13.8% of the same cavalry population had one or more radiographic changes to the mandible [
14].
The periosteum has a dense network of sensory and sympathetic nerve fibres, with a greater density of innervation than any other part of the bone [
29,
42,
43]. Nociceptors located in the periosteum are placed in the optimal location to detect pressure exerted on bone and transmit pain signals when stimulated through the exertion of pressure on bone [
46]. Mechanical distortion of the periosteum is thought to be a major source of bone pain and is a contributory factor in pain following bone fracture [
29].
The mean mechanical threshold for stimulation of nociceptors on a hind limb in cattle was shown by Ley et al. [
47] to be 6.9 N. Forces required to stimulate nociceptors in sheep were 4.9 N [
48]. The tightest noseband setting in the current study recorded noseband tension of 56 N (Test 2), which greatly exceeds those force levels. Tong et al. have shown that the epidermal innervation of equine and human skin from the gluteal region is remarkably similar, so the precautionary principle should certainly apply [
49]. It is accepted that skin sensitivity and underlying tissue thickness affect horses’ responses to pressure over various anatomical landmarks. Similarly, the density of nociceptors varies across different anatomical regions. In horses without pre-existing painful pathology, mechanical nociceptive threshold values of 12 N/cm
2 have been reported for the ventral abdominal wall [
50].
The use of aversive stimuli in equitation is increasingly contentious. The horse reacts to pressure cues because the pressure is aversive. However, visible expression of pain is not easily detected in the horse [
51]. Fortunately, progress is being made in the analysis of facial expression and changes in muscle tension at different locations of the face in response to procedures or situations expected to be painful or aversive in some other way [
51]. The application of the Horse Grimace Scale or similar approaches to pain assessment, including deep learning from video inputs [
45,
52], may allow for the measurement of the aversiveness of the use of tight nosebands on horses in the future.
Limitations
The authors acknowledge several limitations in the current study. First, we used no bit(s), so the pressures reported here should be considered the minimum for horse comfort when reins are not acting on the bit. The additional volume of bit(s) will occupy space in the buccal cavity and increase intra-oral pressures that are transmitted to the noseband when the horse opens, or attempts to open, the mouth. Second, in the absence of approval to deny any space under the noseband in a live horse, the current study was required to use a cadaver. The pressure from live tissues and the tongue’s inherent tendency to push against foreign bodies in the mouth would increase the tension through the noseband. So, again, we posit that the pressures reported here should be considered the minimum. Granting horses less than two fingers’ space is expected to compromise welfare as the intra-oral tissues, notably the tongue, are compressed when the horses cannot open their mouths. To apply learning theory correctly, if one chooses to use a noseband, there should be no pressure under the noseband unless the horse attempts to avoid bit pressure applied by the rider by opening its mouth rather than slowing. Third, the authors acknowledge that, when viewed laterally, the nasal profile of domestic horses varies [
47]. So, on a pro rata basis, more space would be needed for comfort in horses with larger heads and more convex profiles than the head of the horse in the current study. Fourth, being primarily designed to identify two fingers’ space, as is traditional, with a secondary ridge to identify one finger’s space, the ISES Noseband Taper Gauge should be regarded as only indicative when assessing 0.5 and 1.5 fingers’ space. Fifth, it is acknowledged that the ISES Noseband Taper Gauge could be inserted with greater or lesser amounts of force to render different outcomes. Every attempt was made to minimise variation in the amount of force used, but the estimates made are unavoidably approximate rather than precise measurements. Sixth, this was a study using a single cadaver head with a single type of noseband/bridle, using tissue that had undergone a freeze–thaw cycle and was subject to none of the changes associated with equine locomotion, some of which create a cyclical pattern of pressures. In addition, the morphology of horse heads varies greatly, and the current use of a single specimen limits the extent to which we can draw conclusions for all horses.
Finally, we note that other bridles will have gaps of different lengths between holes on their nosebands. For that reason, and to overcome the indicative nature of the fractional spacings (see above), we studied the ISES Noseband Taper Gauge spacings that were closest to the existing holes in the current bridle.
