
Social Inequalities in Dog Bites and Strikes in Scotland: Evidence from Administrative Health Records and Implications for Prevention Policy


Simple Summary
Abstract
1. Introduction
2. Materials and Methods
2.1. Data Access and Ethical Approval
2.2. Health Data Sources and DBS Records
2.2.1. NHS 24 Calls
2.2.2. A&E Attendances
2.2.3. SMR01 Hospital Admissions
2.3. Other Measures
2.4. Analytical Methods
3. Results
3.1. Health Records Involving DBS
3.2. Yearly Rates
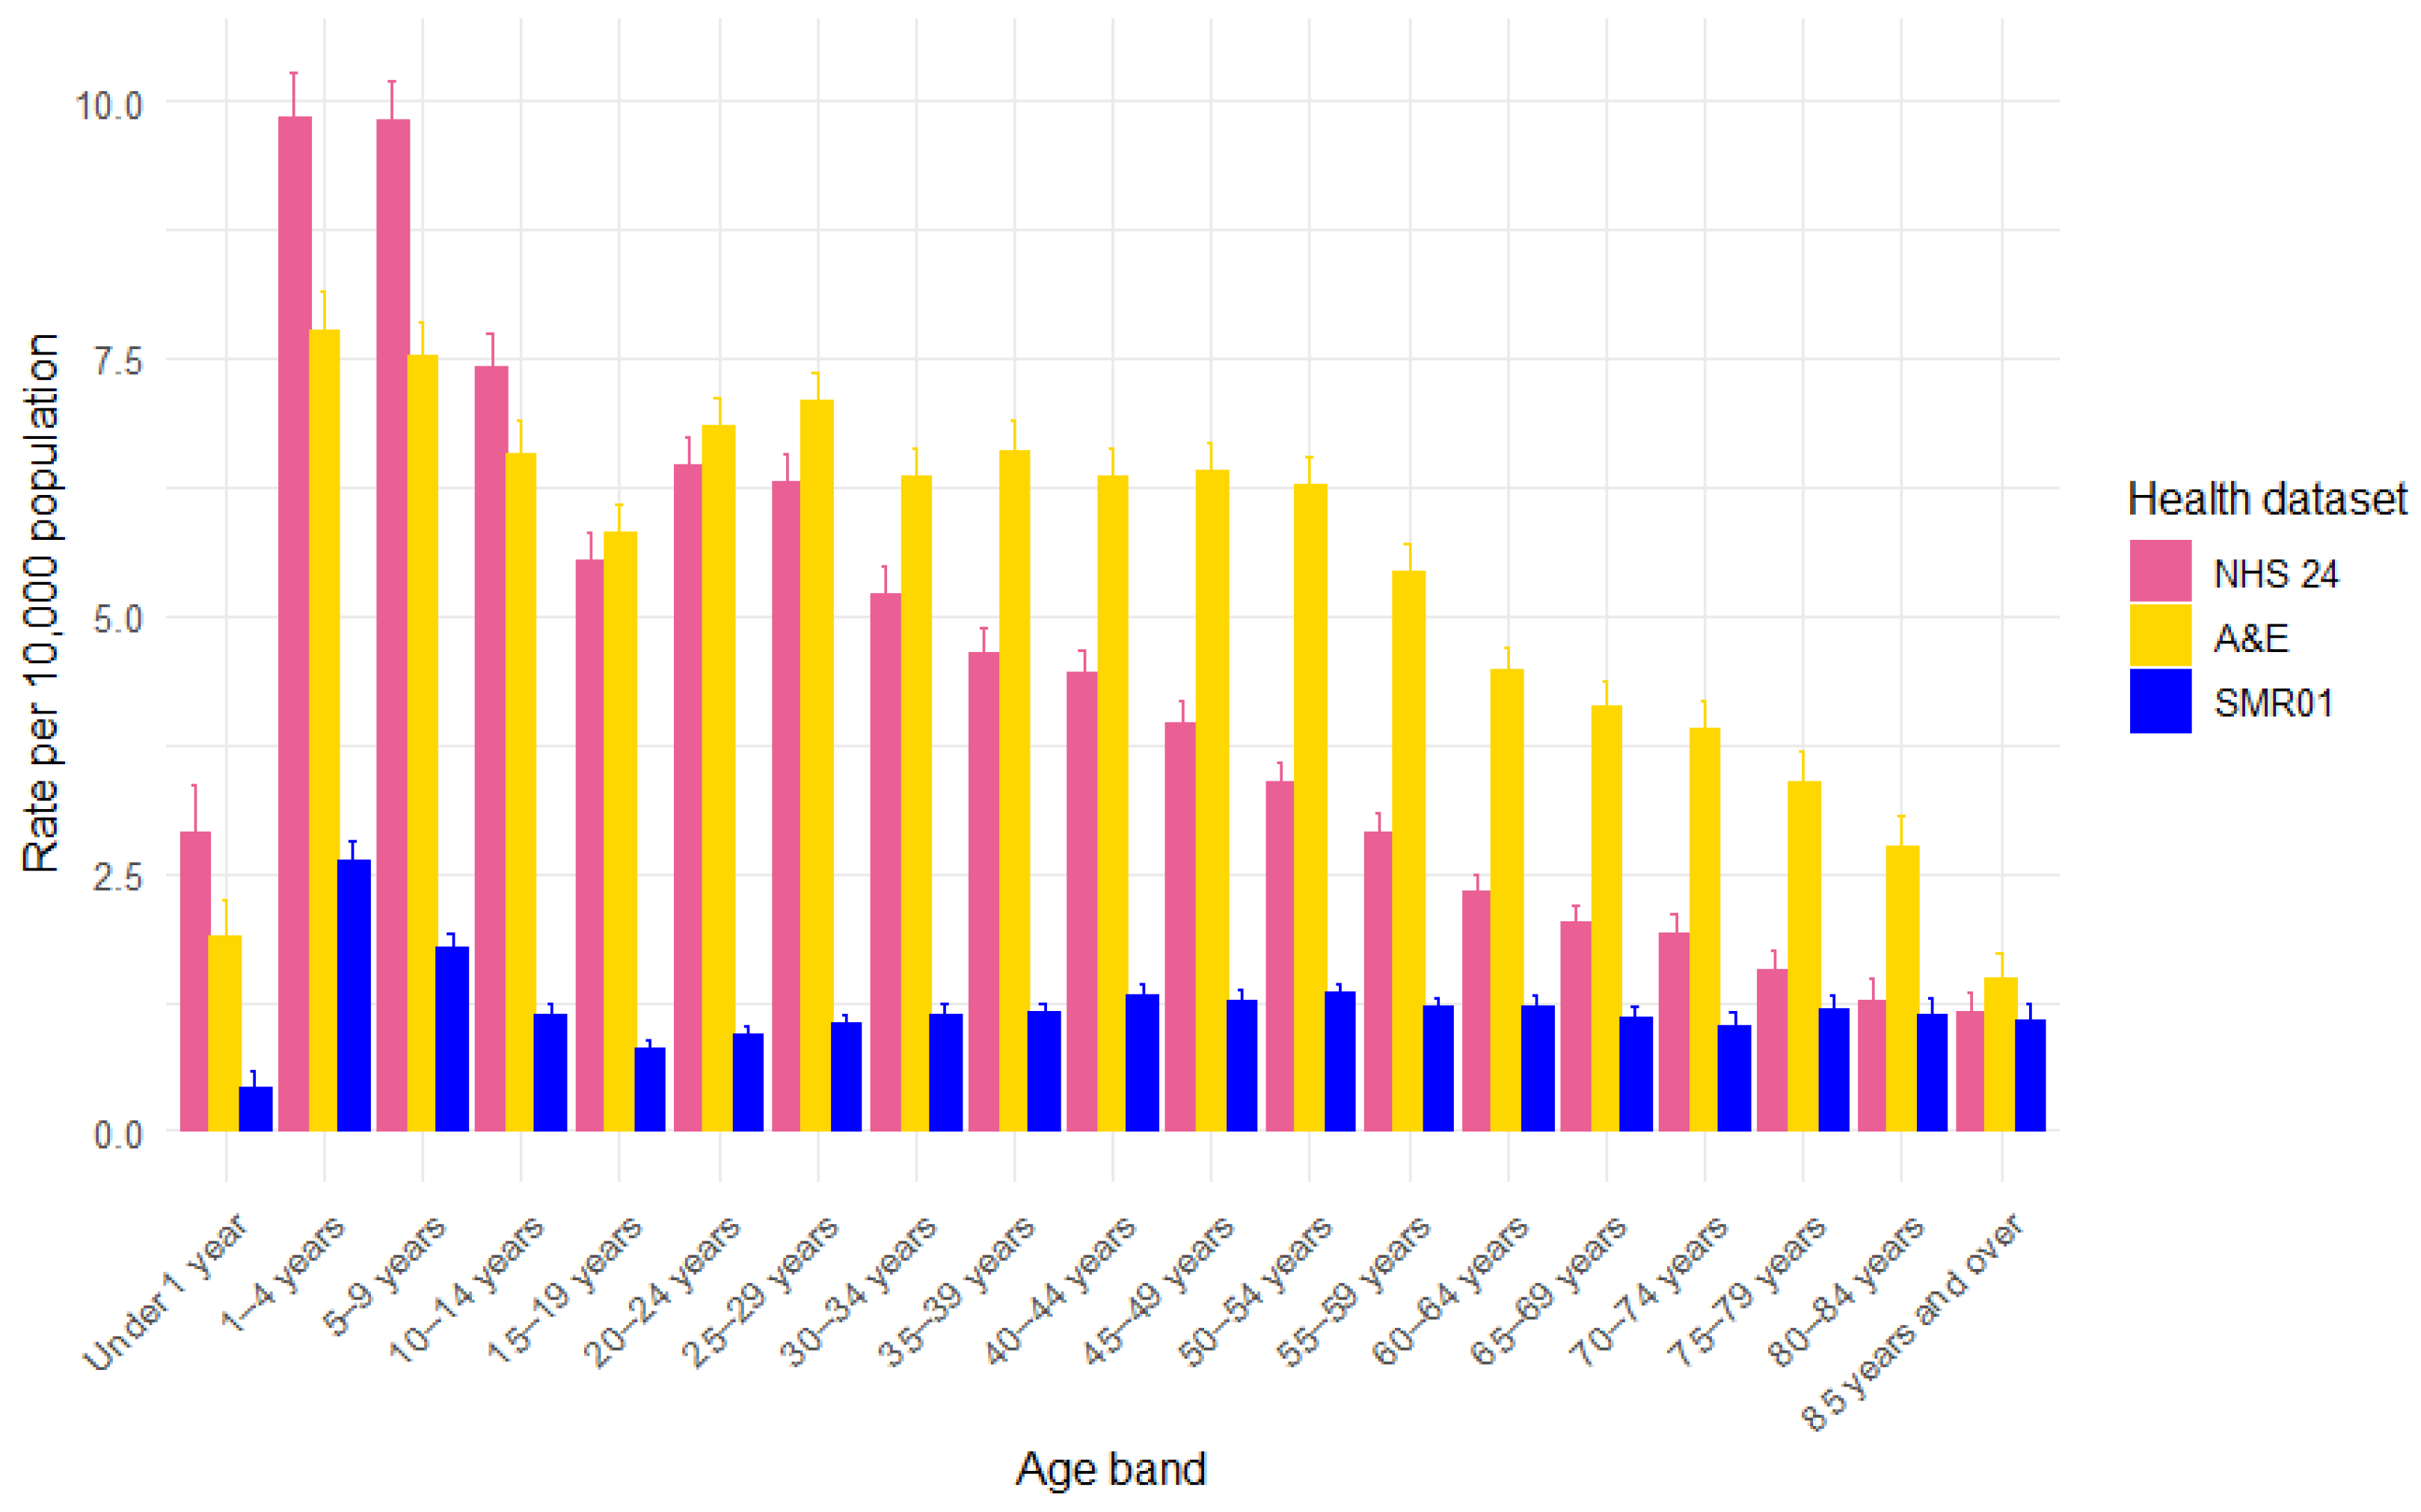
3.3. Age
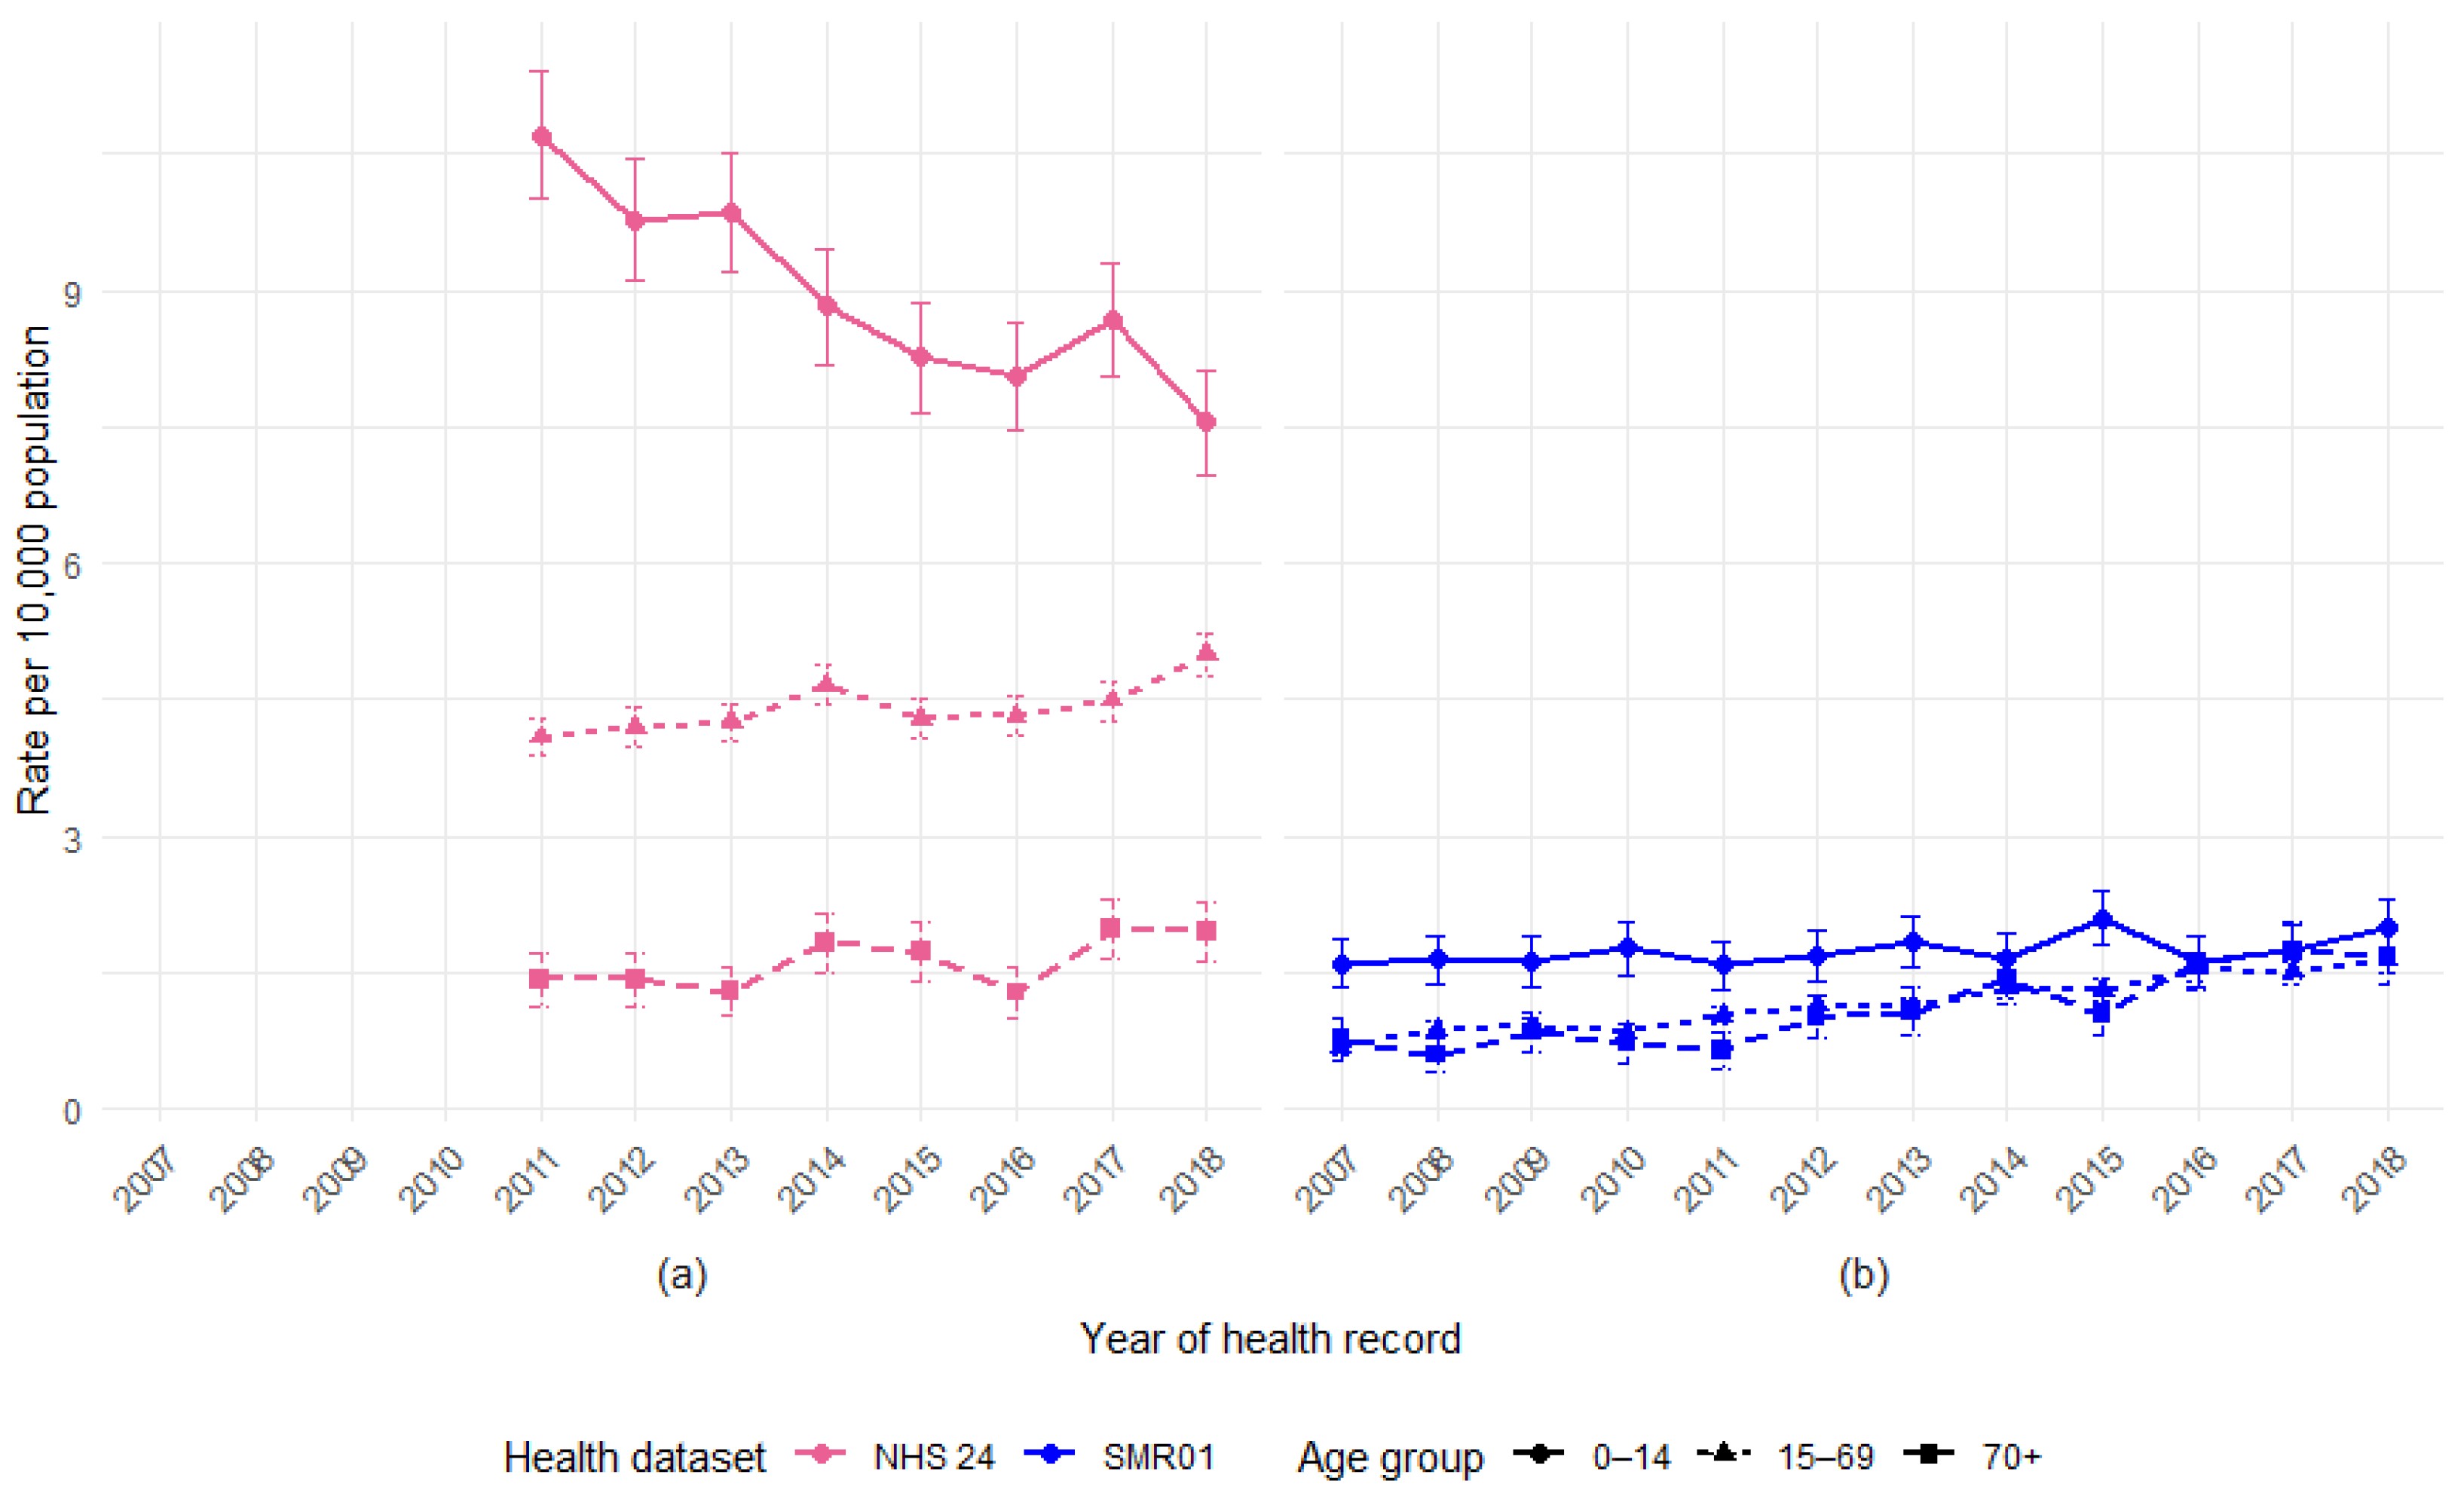
3.4. Age by Year
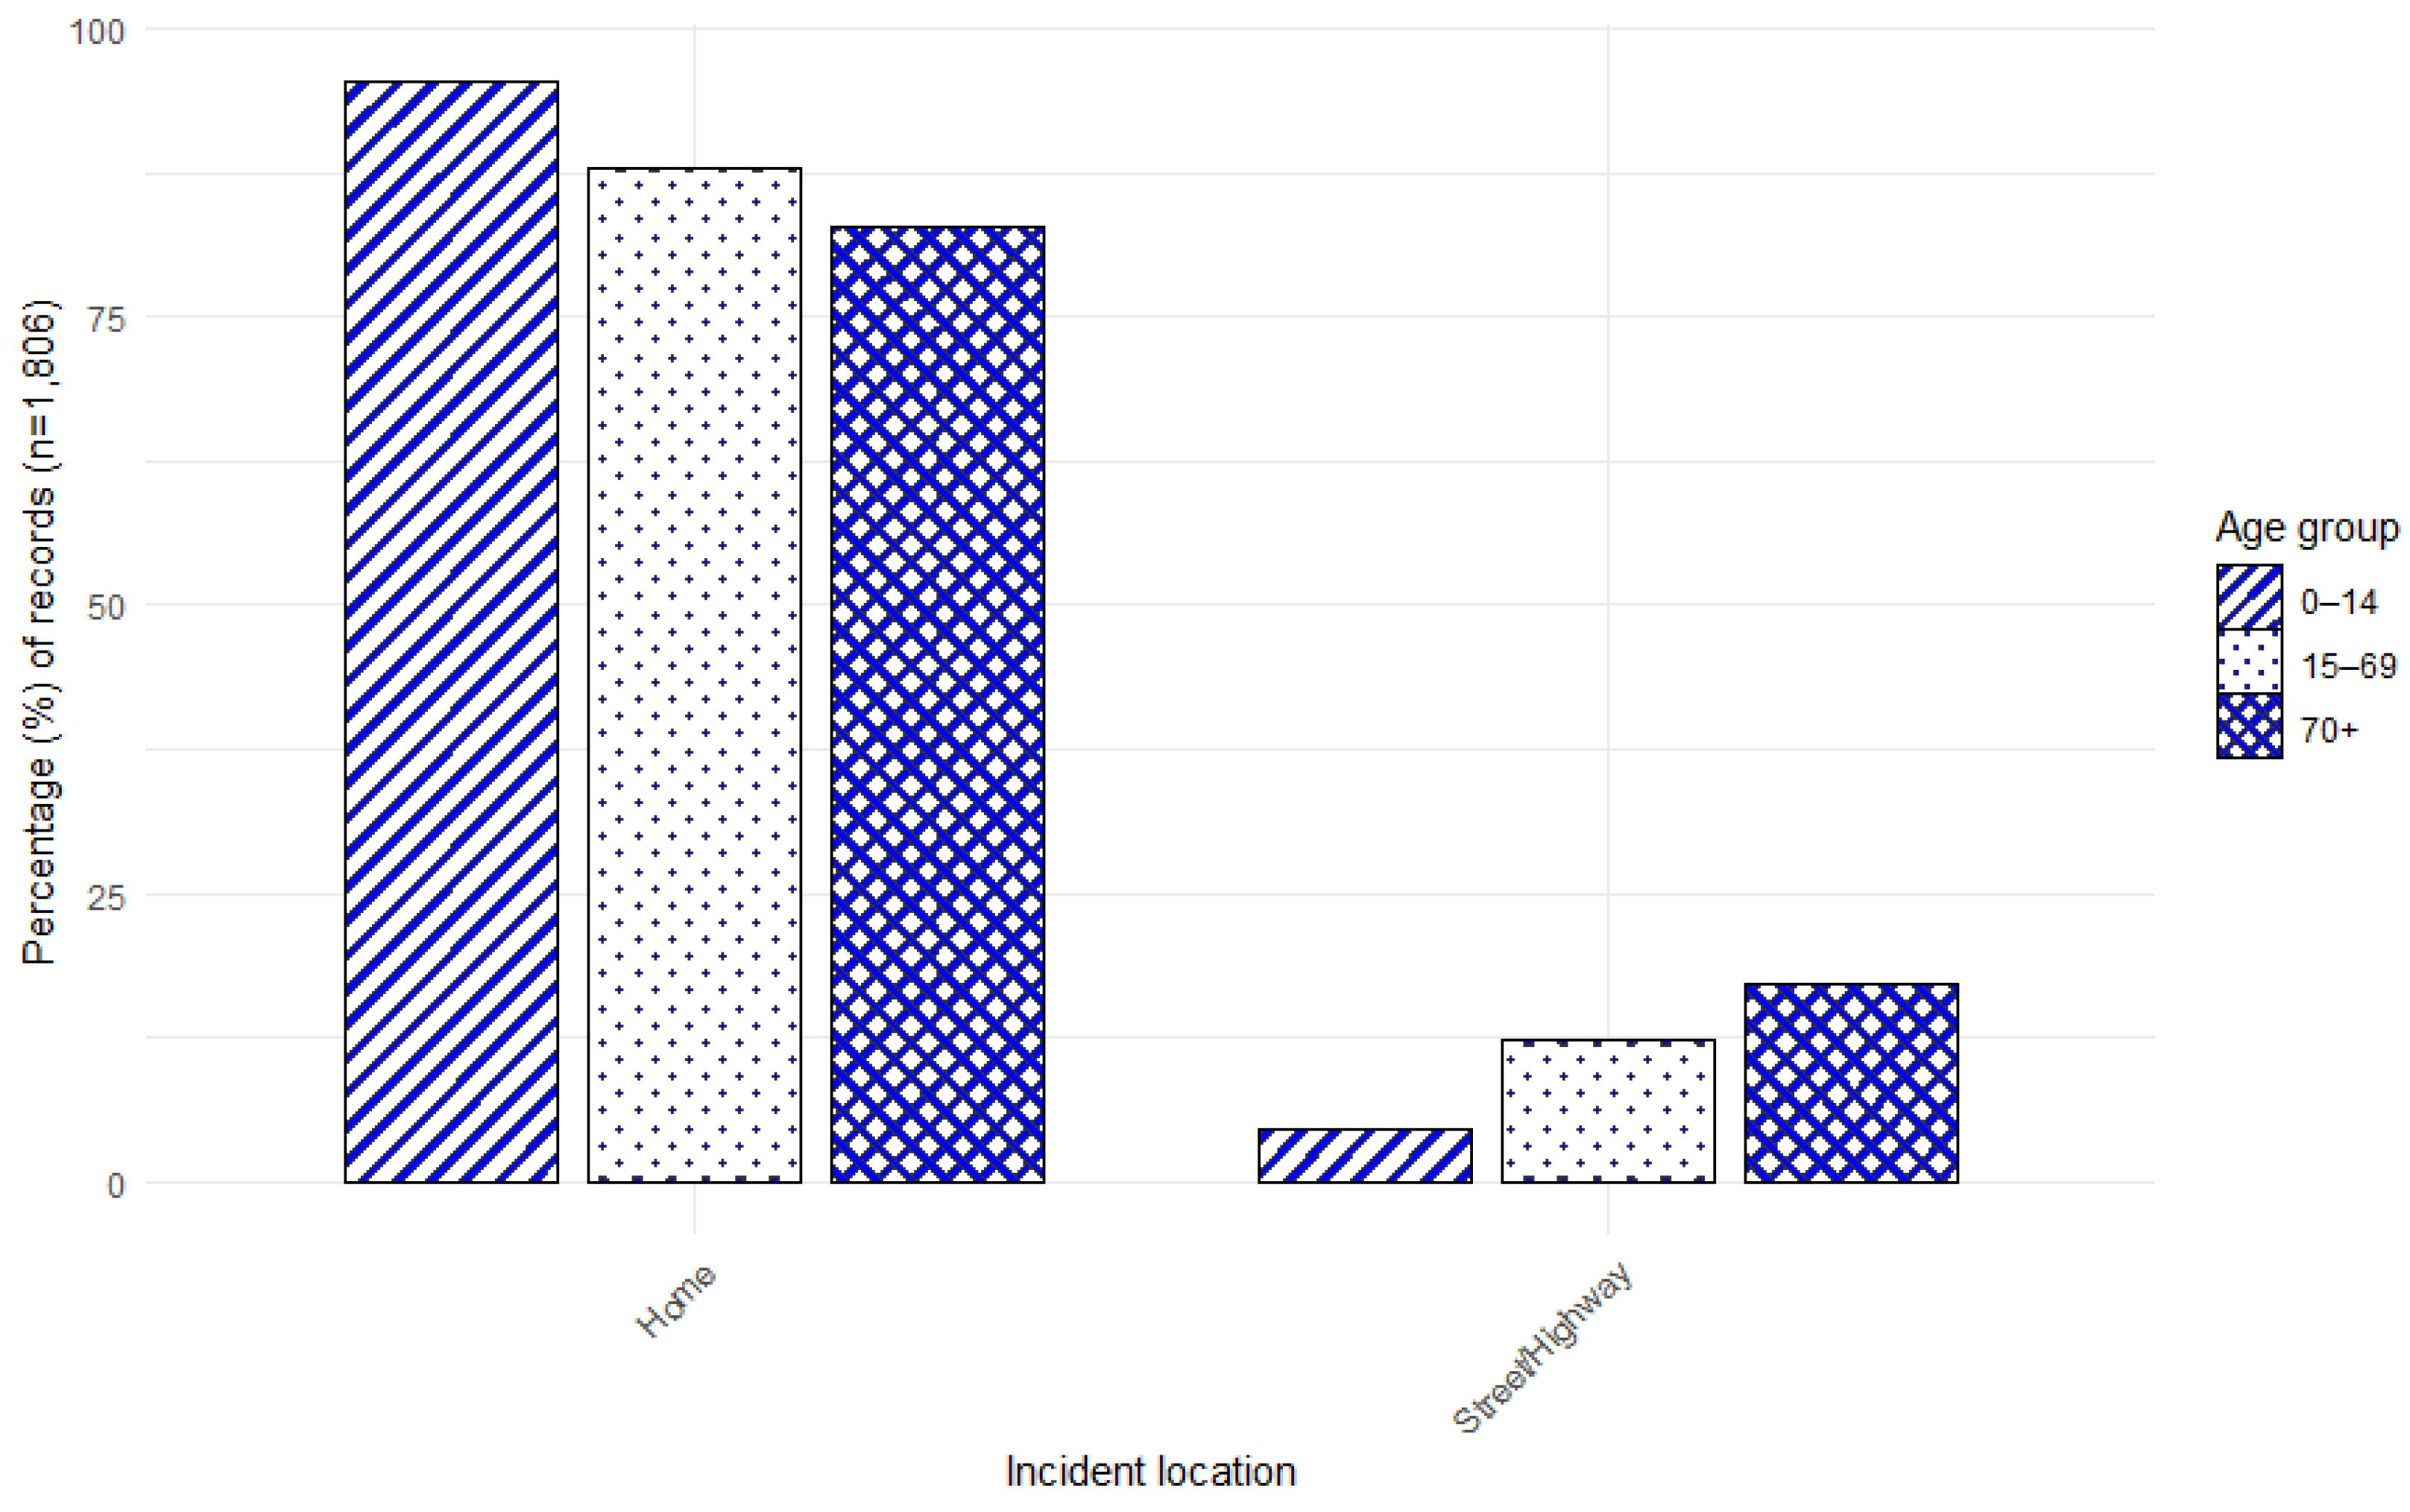
3.5. Age by Incident Location
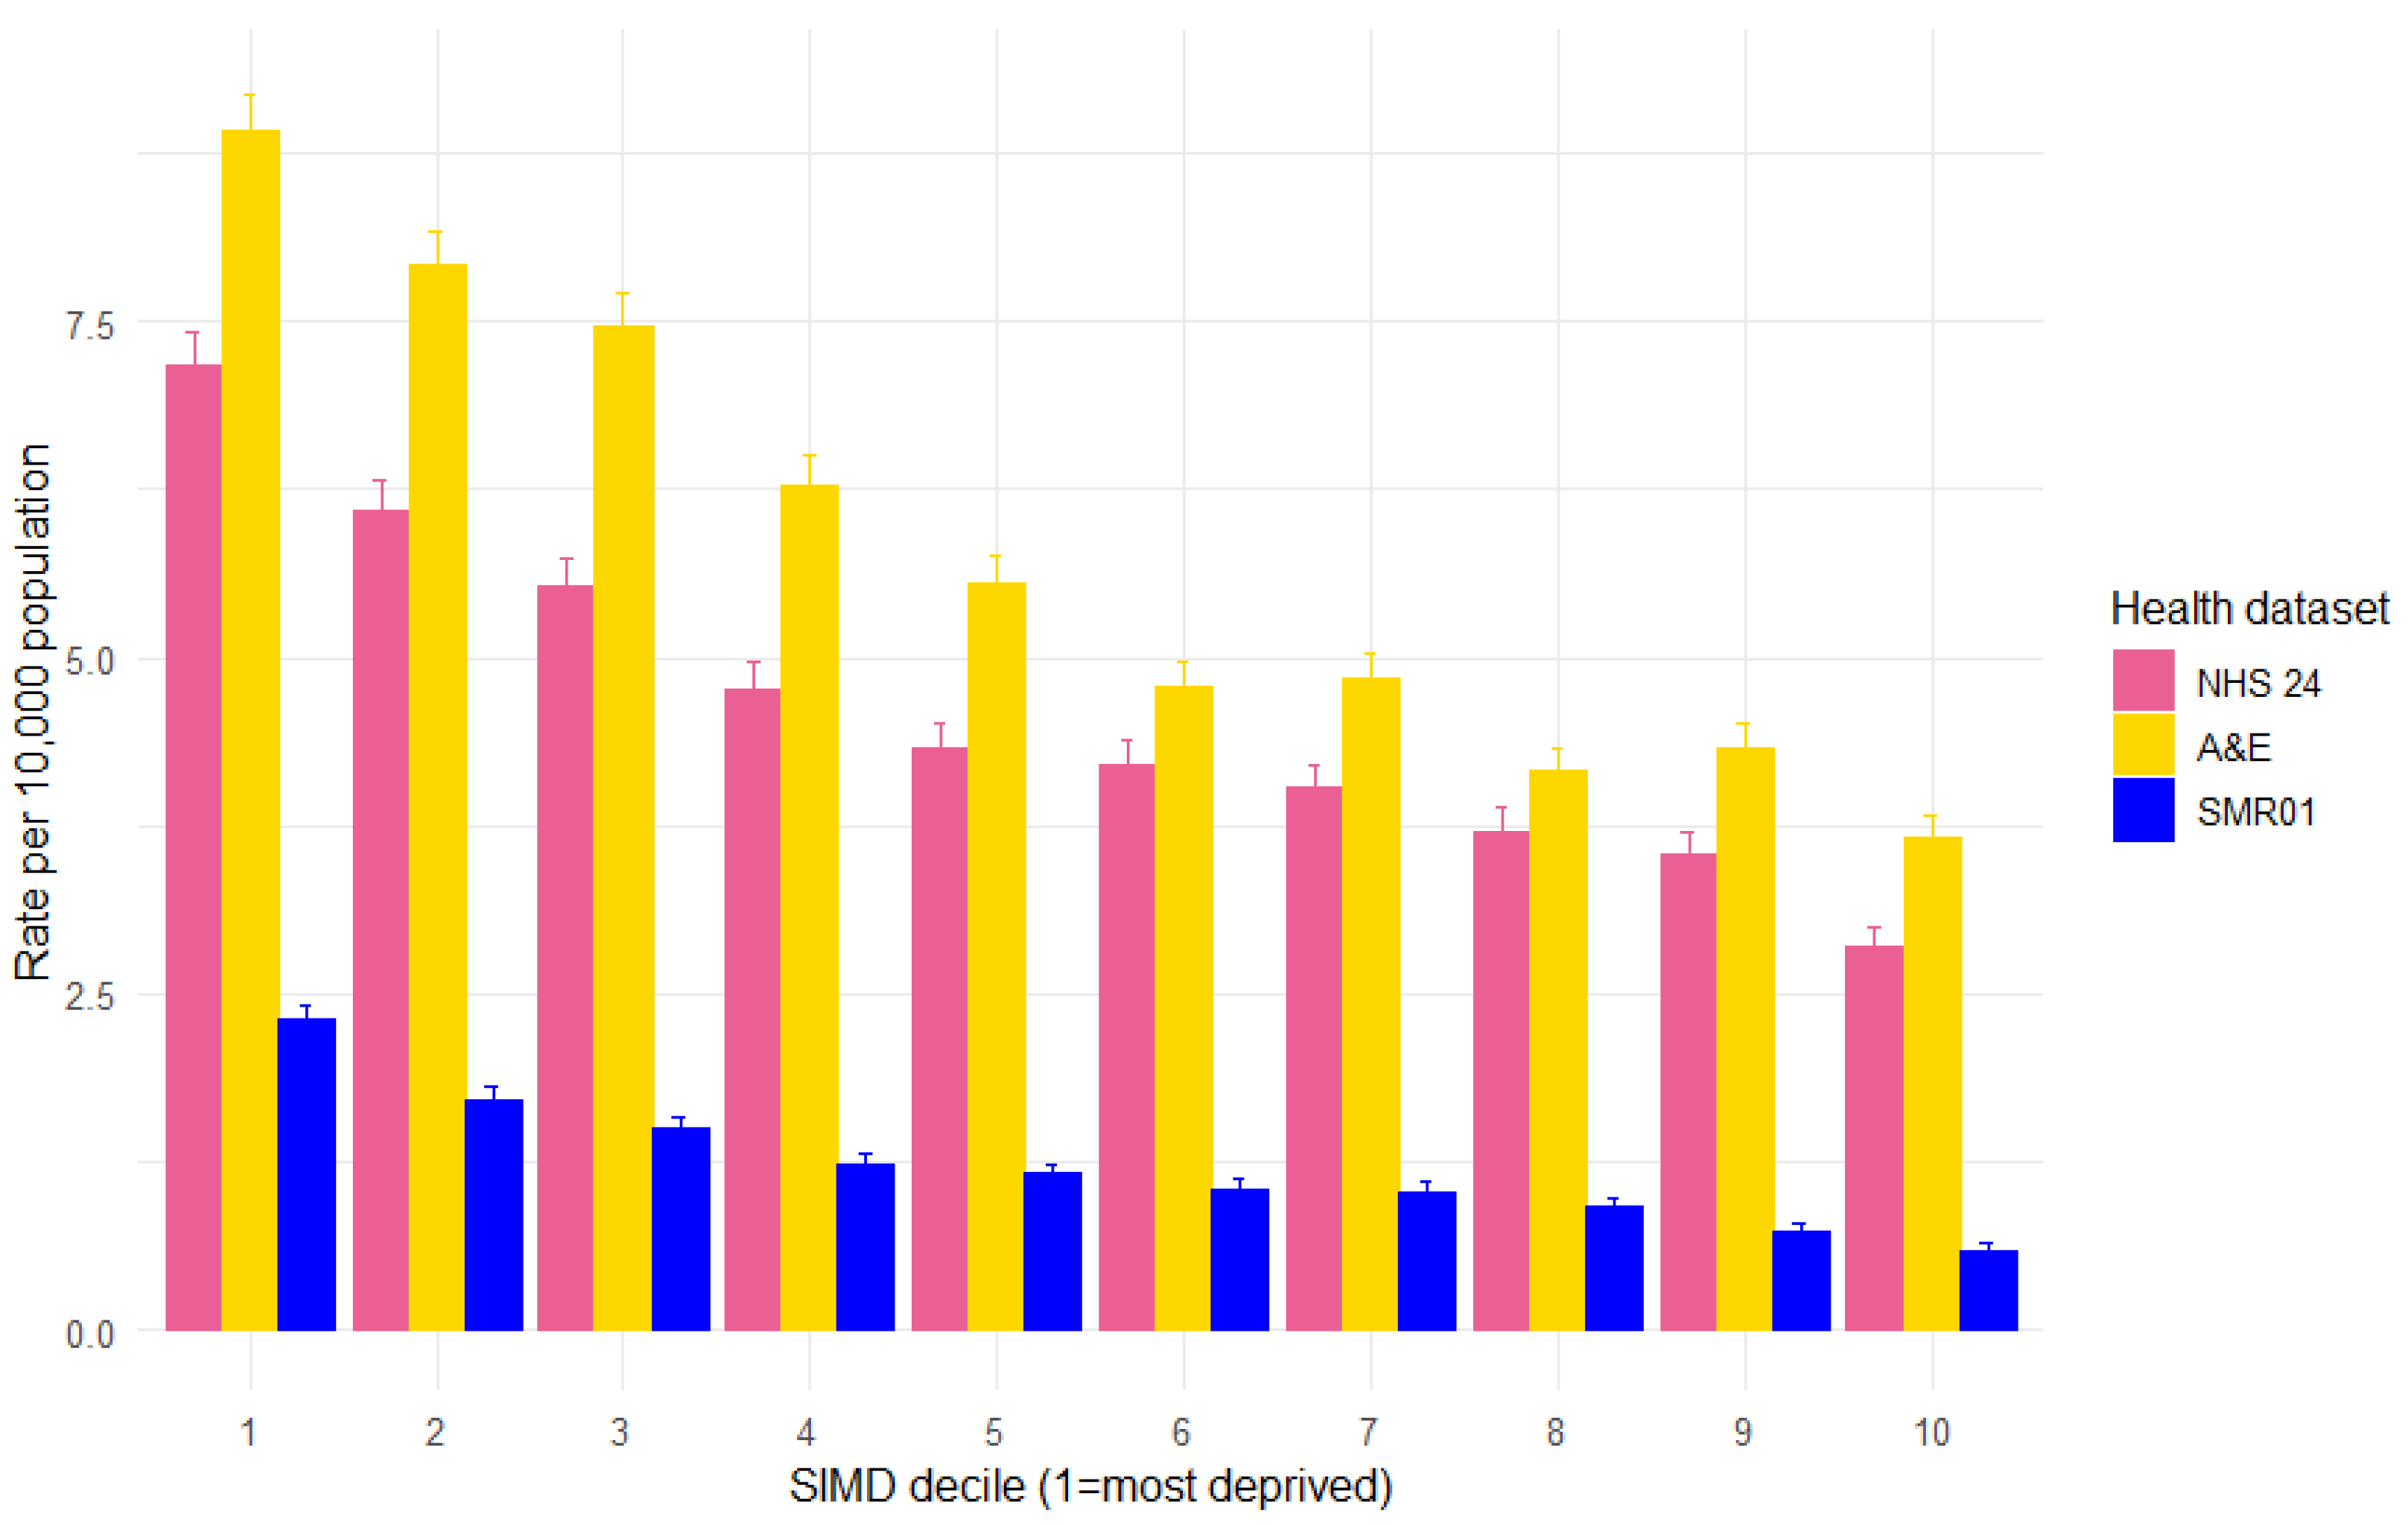
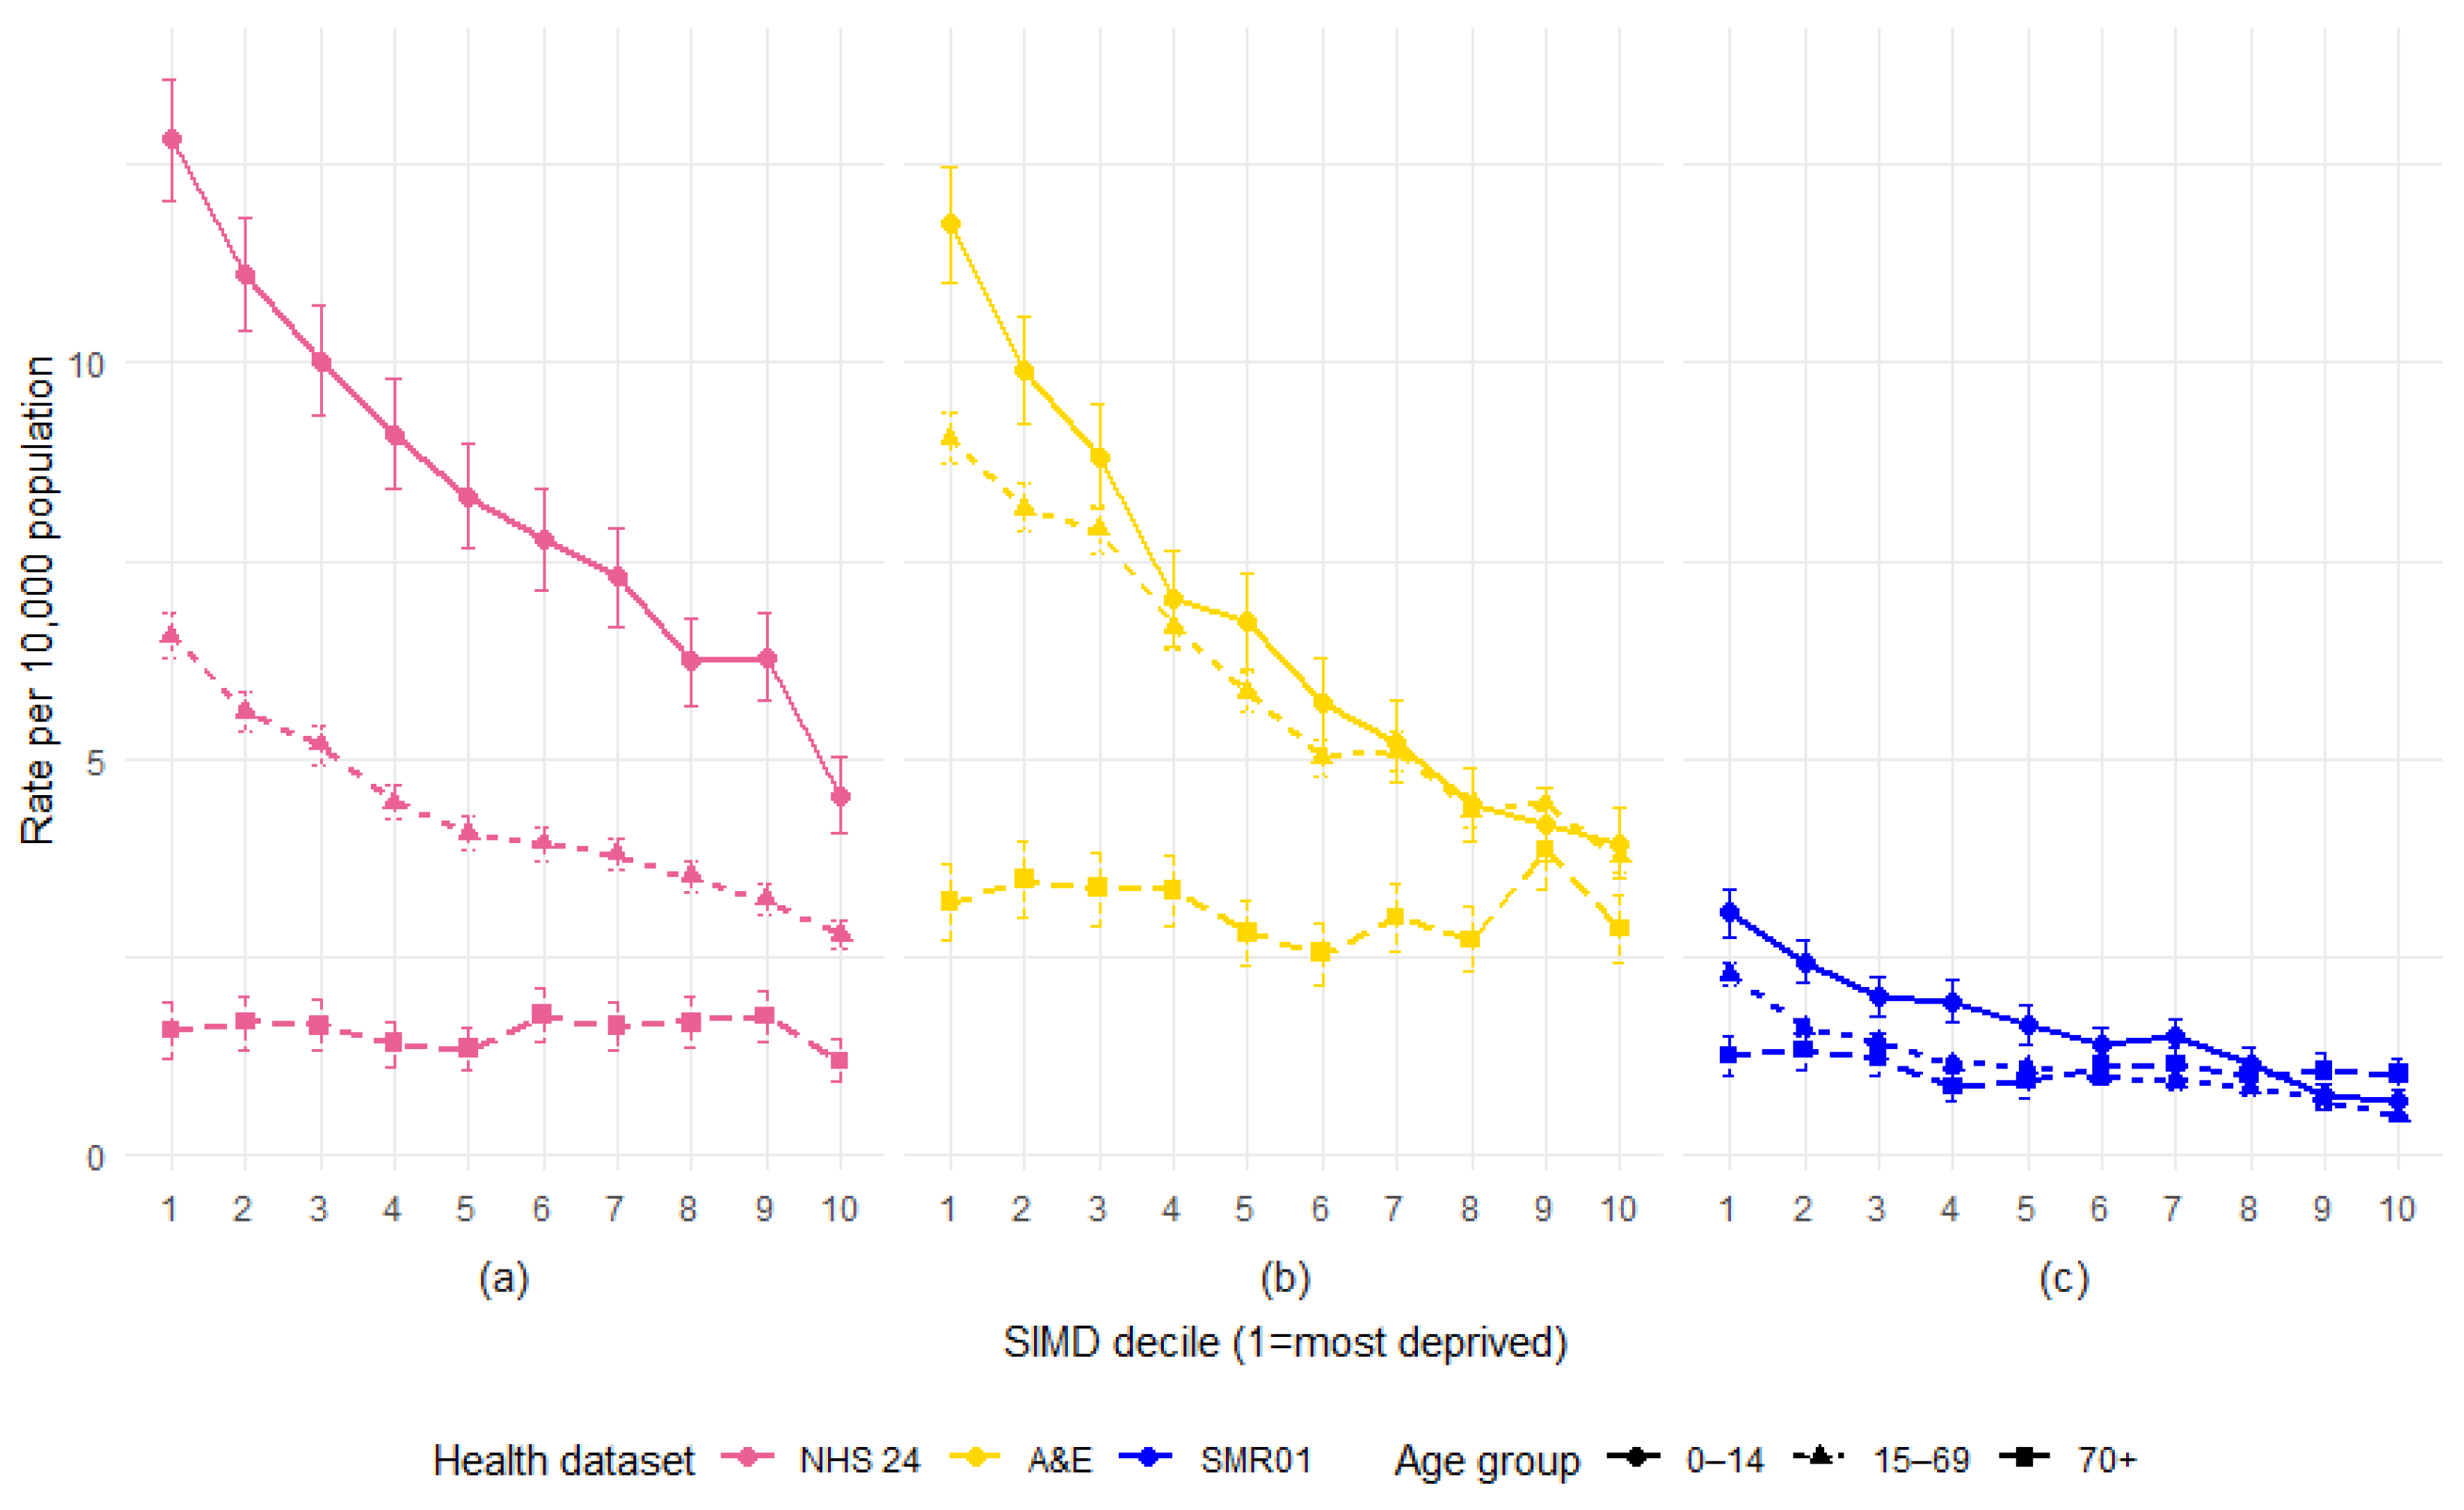
3.6. SIMD Decile
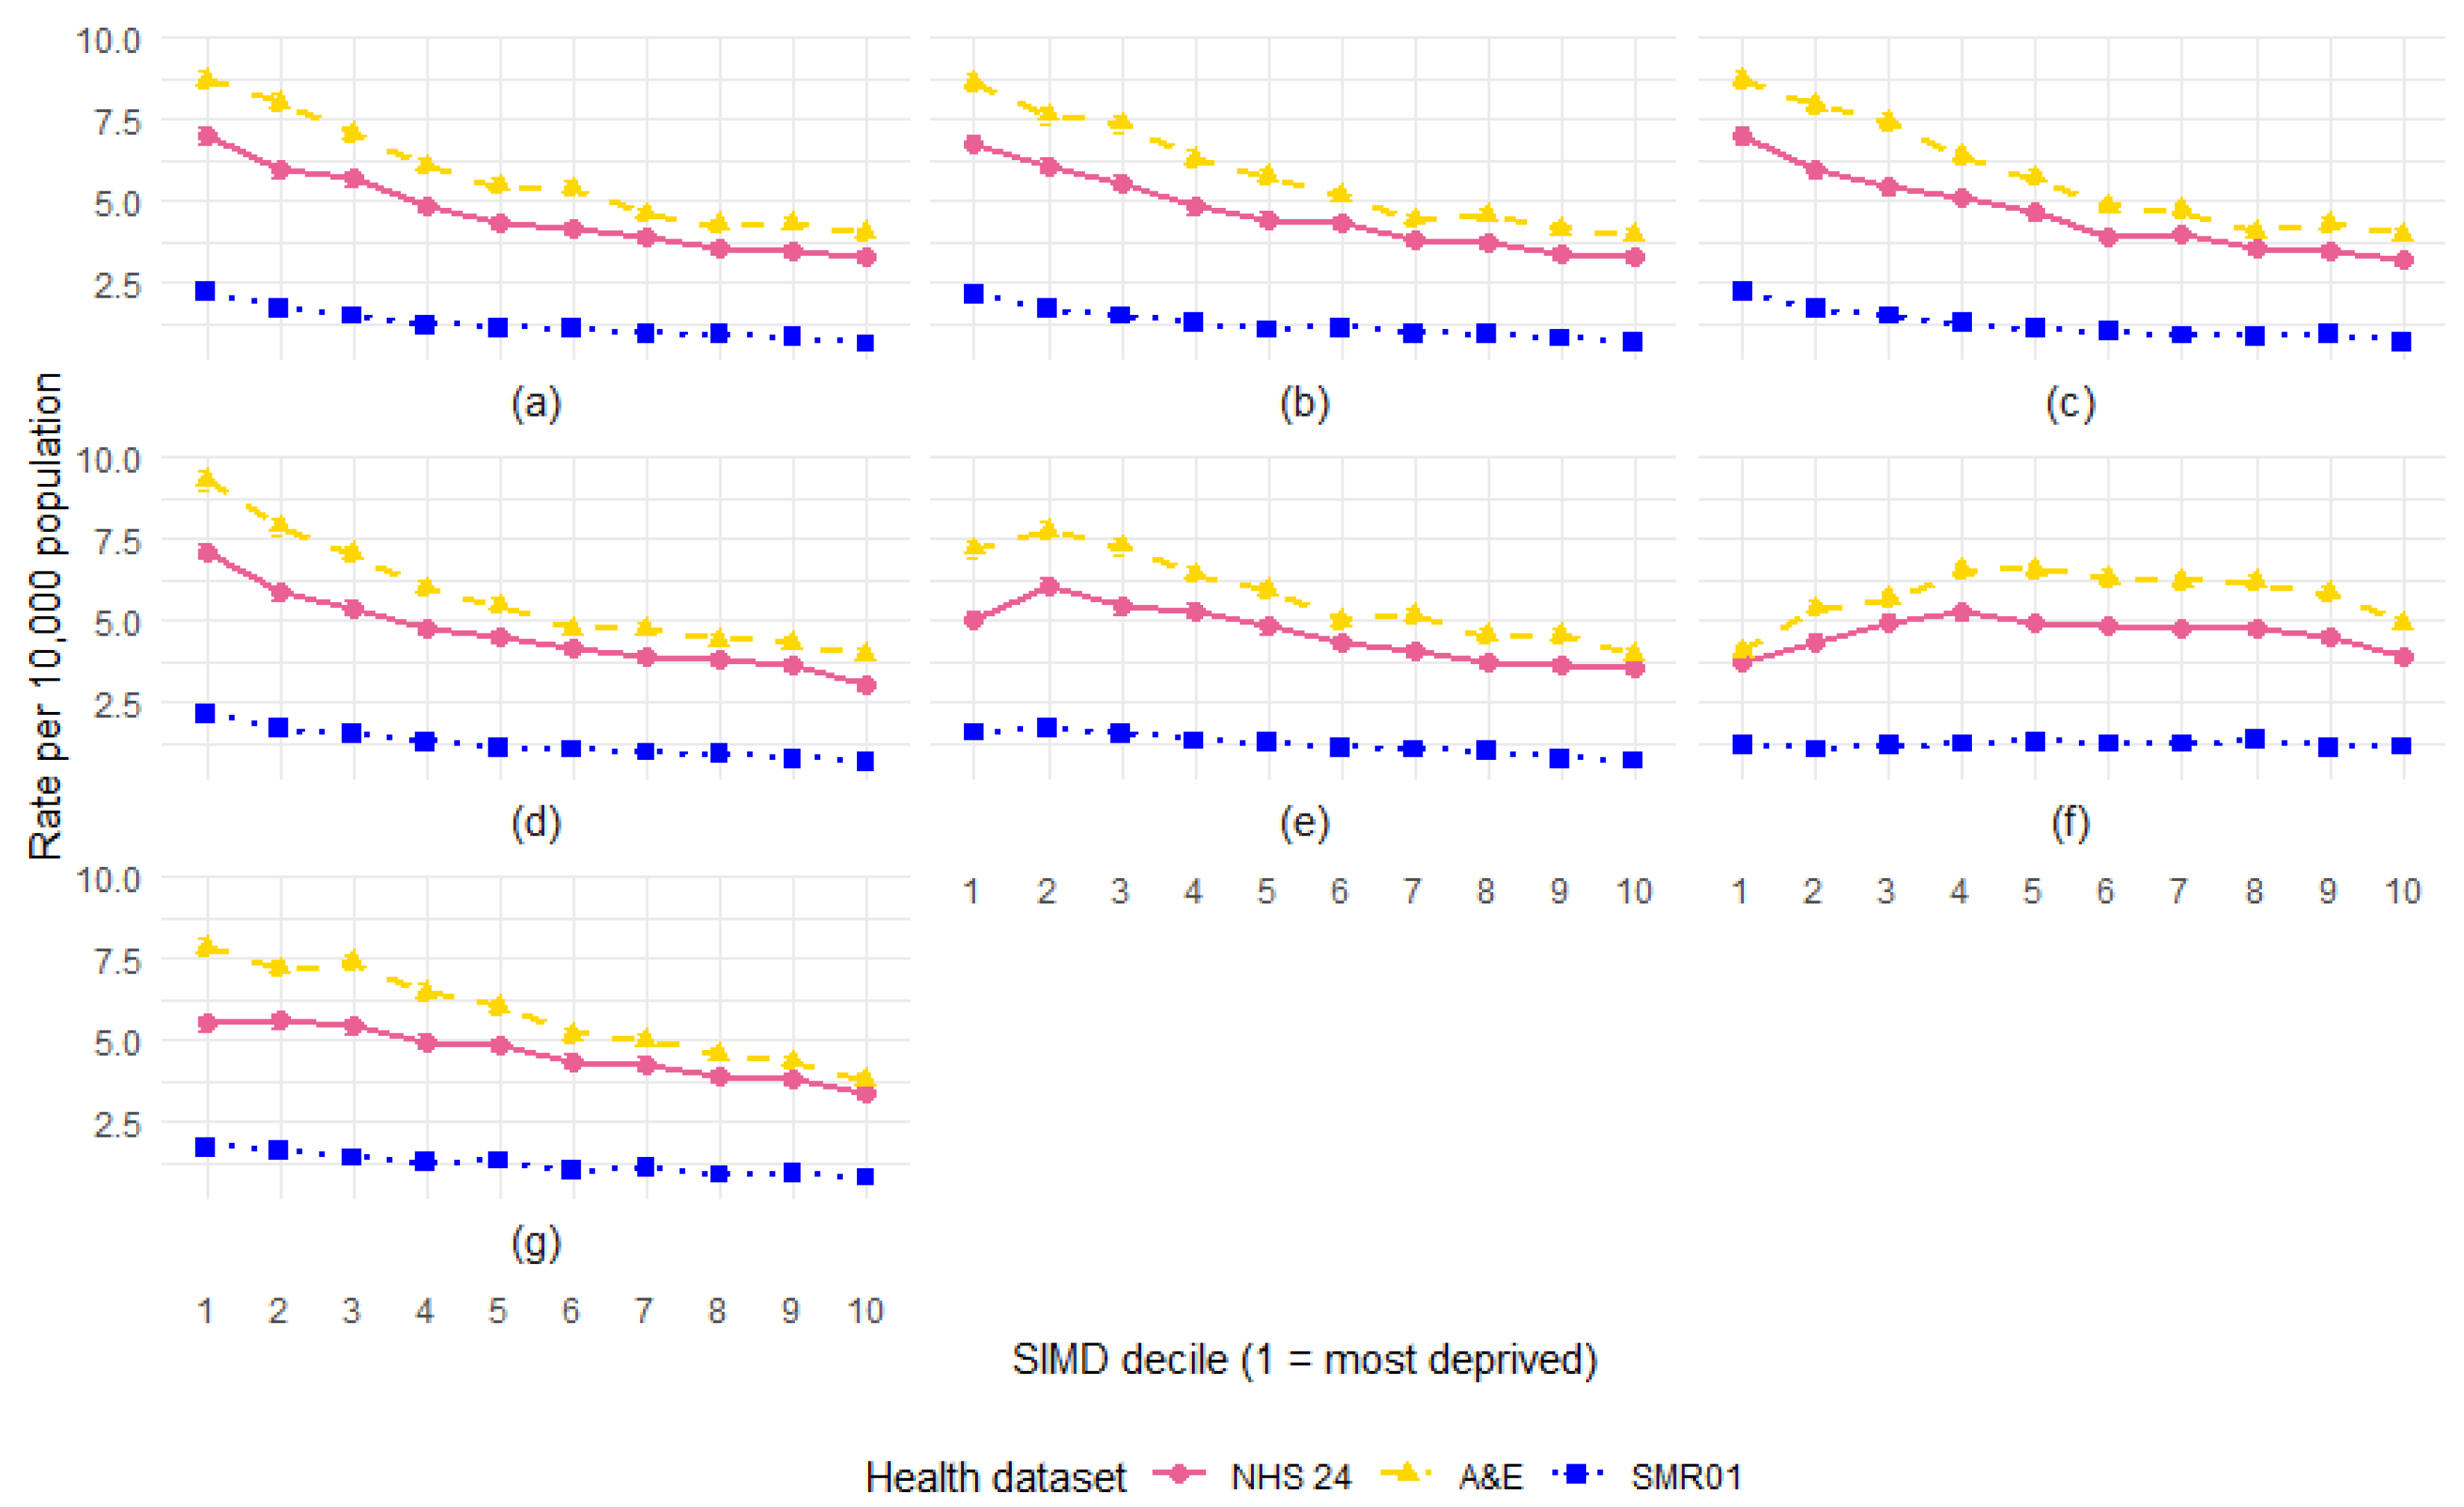
3.7. SIMD by Year
3.8. SIMD Decile by Age
3.9. SIMD Domains
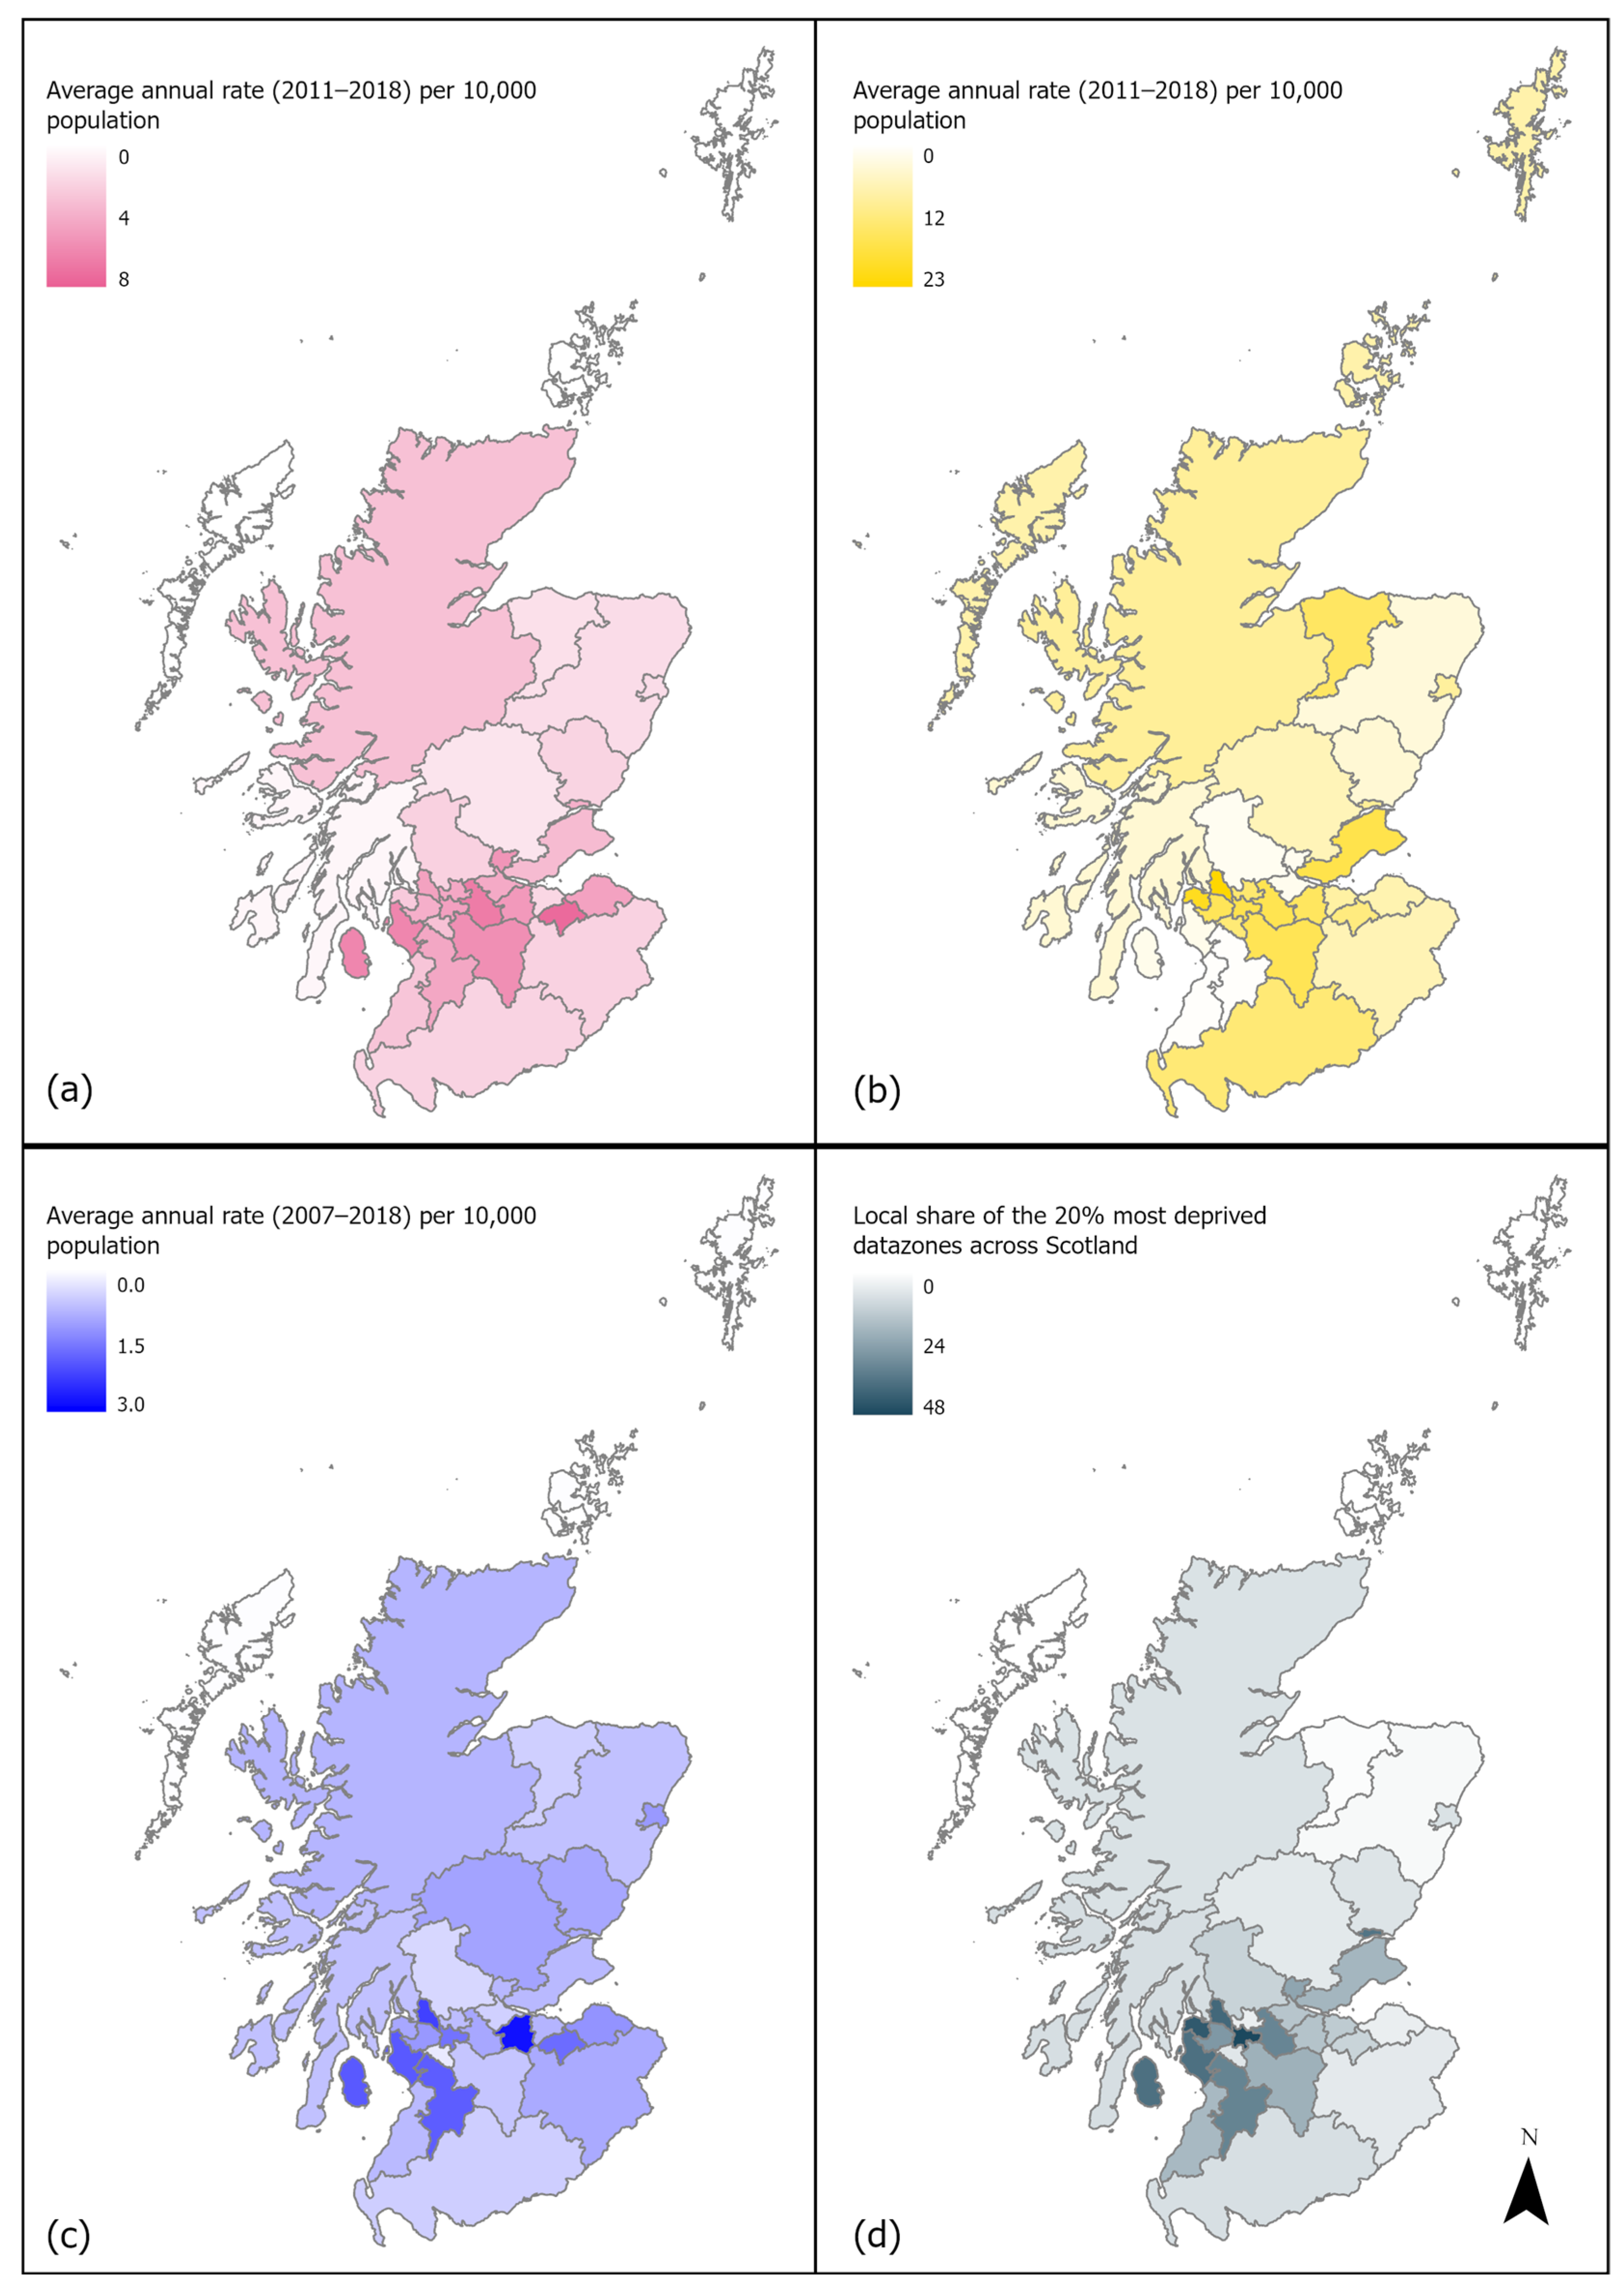
3.10. Local Authority Variation and SIMD
4. Discussion
4.1. Age Patterns
4.2. Social Inequalities
4.3. Implications
4.4. Limitations and Future Directions
- The acknowledgement of social inequities in DBS within policy and prevention strategies and in research priorities, alongside the review of all new and existing polices to ensure that they do not perpetuate these inequities.
- The improvement of data surveillance so that inequities can be monitored and policies can be evidence-informed and evaluated to ensure that they are effective both in reducing DBS risk and narrowing social inequality. This might include the following:
- o
- Investing in improvements for recording DBS within health records, particularly for A&E records which have known data quality issues. This might be achieved by providing additional resources and training and by ensuring that efficient systems are in place to assist already overburdened health care staff (e.g., by using specialist clinical coders for A&E data).
- o
- Maximising the use of existing statistics. For instance, PHS may wish to consider separating DBS figures from ‘other’ types of UIs in their statistical publications to allow for improved data surveillance. Other options include exploring the use of the newly created Scottish DCN Database for research and data monitoring purposes. It may also be helpful to explore opportunities for data linkage between existing data sources where possible.
- Ensure that prevention strategies are compassion-focused and family-centred. Policies to reduce risk should be supportive, rather than focusing on criminalisation or attributing blame to ‘irresponsible’ owners. Policies should be designed to assist, rather than penalise.
- Utilising the potential of a public health approach that includes the consideration of the wider social determinants of health and a multi-agency approach exploring systemic factors and focusing more on upstream intervention.
- Recognise the issue of DBS as a One Health concern where the interlinked nature of pet health and welfare with human health and welfare necessitates their joint consideration in broader health and social policies.
- A greater focus on DBS as a type of UI. This could involve drawing insights from the more developed literature on health inequalities in other types of UIs and exploring how these findings can inform the understanding and prevention of DBIs.
- Make room for the voices of the populations most at risk to better understand the pathways which lead to these inequalities and the barriers preventing change. Encourage positive change through the co-production of research and prevention strategies to empower communities.
5. Conclusions
6. Patents
Author Contributions
Funding
Institutional Review Board Statement
Informed Consent Statement
Data Availability Statement
Acknowledgments
Conflicts of Interest
Abbreviations
| A&E | Accident and emergency |
| DBS | Dog bites and strikes |
| eDRIS | Electronic Data Research and Innovation Service |
| GIS | Geographic information system |
| HSCIC | Health and Social Care Information Centre |
| ICD-10 | International Statistical Classification of Diseases and Related Health Problems 10th Revision |
| LA | Local authority |
| NHS | National Health Service |
| NRS | National Records Scotland |
| PAPSC | Public Audit and Post-legislative Scrutiny Committee |
| PHS | Public Health Scotland |
| SD | Standard deviation |
| SIMD | Scottish Index of Multiple Deprivation |
| SMR01 | Scottish Mortality Records general acute inpatient and day cases |
| UI | Unintentional injury |
| WHO | World Health Organization |
References
- Taylor, A.E.; Ogharanduku, O.; Connor, J.; Bridgman, S. Epidemiology of dog bite and strike related hospital admissions in Scotland, 1997 to 2022. Public Health 2025, 239, 142–148. [Google Scholar] [CrossRef]
- Owczarczak-Garstecka, S.; Oxley, J.A.; Tulloch, J.S.P. Welsh hospital admissions due to dog bites and strikes (2014–2022). Public Health 2024, 233, 83–89. [Google Scholar] [CrossRef]
- Tulloch, J.S.P.; Owczarczak-Garstecka, S.; Fleming, K.M.; Vivancos, R.; Westgarth, C. English hospital episode data analysis (1998–2018) reveal that the rise in dog bite hospital admissions is driven by adult cases. Sci. Rep. 2021, 11, 1767. [Google Scholar] [CrossRef]
- Westgarth, C.; Provazza, S.; Nicholas, J.; Gray, V. Review of psychological effects of dog bites in children. BMJ Paediatr. Open 2024, 8, e000922. [Google Scholar] [CrossRef]
- PAPSC. Post-Legislative Scrutiny: Control of Dogs (Scotland) Act 2010; Public Audit and Post-legislative Scrutiny Committee: Chapeltown, UK, 2019. [Google Scholar]
- Marmot, M.; Allen, J.; Goldblatt, P.; Boyce, T.; McNeish, D.; Grady, M.; Geddes, I. Fair Society, Healthy Lives: Strategic Review of Health Inequalities in England Post-2010; World Health Organisation: Geneva, Switzerland, 2010; ISSN 9780956487. [Google Scholar]
- Zambon, F.; Loring, B. Injuries and Inequities; World Health Organization: Geneva, Switzerland, 2014. [Google Scholar]
- Laflamme, L.; Burrows, S.; Hasselberg, M. Socioeconomic Differences in Injury Risks: A Review of Findings and a Discussion of Potential Countermeasures; World Health Organization: Copenhagen, Denmark, 2009. [Google Scholar]
- Sleet, D.A. The Global Challenge of Child Injury Prevention. Int. J. Environ. Res. Public Health 2018, 15, 1921. [Google Scholar] [CrossRef]
- Laflamme, L.; Hasselberg, M.; Burrows, S. 20 Years of Research on Socioeconomic Inequality and Children’s—Unintentional Injuries Understanding the Cause-Specific Evidence at Hand. Int. J. Pediatr. 2010, 2010, 819687. [Google Scholar] [CrossRef]
- Duncan-Sutherland, N.; Lissaman, A.C.; Shepherd, M.; Kool, B. Systematic review of dog bite prevention strategies. Inj. Prev. 2022, 28, 288–297. [Google Scholar] [CrossRef]
- Jakeman, M.; Oxley, J.A.; Owczarczak-Garstecka, S.; Westgarth, C. Pet dog bites in children: Management and prevention. BMJ Paediatr. Open 2020, 4, 15–18. [Google Scholar] [CrossRef]
- Peden, M.; Oyegbite, K.; Ozanne-Smith, J.; Hyder, A.A.; Branche, C.; Rahman, A.F.; Rivara, F.; Bartolomeos, K. World Report on Child Injury Prevention; World Health Organization: Geneva, Switzerland, 2008; ISSN 9789241563574. [Google Scholar]
- HSCIC. Provisional Monthly Topic of Interest: Admissions Caused by Dogs and Other Mammals; Health and Social Care Information Centre: Leeds, UK, 2015.
- HSCIC. Provisional Monthly Topic of Interest: Admissions Caused by Dogs and Other Mammals; Health and Social Care Information Centre: Leeds, UK, 2014.
- Humphreys, C.; Price, L.; Heatman, B.; Ruggiero, B. Child Death Review Programme: Rapid Review of Deaths of Children from Dog Bites or Strikes; Public Health Wales: Cardiff, UK, 2014. [Google Scholar]
- Campagna, R.A.; Roberts, E.; Porco, A.; Fritz, C.L. Clinical and epidemiologic features of persons accessing emergency departments for dog and cat bite injuries in California (2005–2019). J. Am. Vet. Med. Assoc. 2023, 261, 723–732. [Google Scholar] [CrossRef]
- Duncan-Sutherland, N.; Moaveni, Z.; Exeter, D.J.; Colbert, J.; Kool, B. Epidemiology of dog-related injuries within New Zealand. N. Z. Med. J. 2022, 135, 111–128. [Google Scholar]
- Lee, C.J.; Tiourin, E.; Schuljak, S.; Phan, J.; Heyming, T.W.; Schomberg, J.; Wallace, E.; Guner, Y.S.; Vyas, R.M. Surgical treatment of pediatric dog-bite wounds: A 5-year retrospective review. West. J. Emerg. Med. 2021, 22, 1301–1310. [Google Scholar] [CrossRef]
- Tuckel, P.S.; Milczarski, W. The changing epidemiology of dog bite injuries in the United States, 2005–2018. Inj. Epidemiol. 2020, 7, 57. [Google Scholar] [CrossRef]
- Mair, J.; Duncan-Sutherland, N.; Moaveni, Z. The incidence and risk factors of dog bite injuries requiring hospitalisation in New Zealand. N. Z. Med. J. 2019, 132, 8–14. [Google Scholar]
- Vertalka, J.; Reese, L.A.; Wilkins, M.J.; Pizarro, J.M. Environmental correlates of urban dog bites: A spatial analysis. J. Urban Aff. 2017, 40, 311–328. [Google Scholar] [CrossRef]
- Raghavan, M.; Martens, P.J.; Burchill, C. Exploring the relationship between socioeconomic status and dog-bite injuries through spatial analysis. Rural. Remote Health 2014, 14, 2846. [Google Scholar] [CrossRef]
- Adams, A.; Sutton, J.P.; Elixhauser, A.; NBSP. Emergency Department Visits and Hospitalizations Associated with Animal Injuries, 2009; U.S. Agency for Healthcare Research and Quality: Baltimore, MD, USA, 2012. [Google Scholar]
- Hemagiri, K.; Someshwar, G.M.; Karinagannanavar, A. An epidemiological study on dog bite and its management in Bellary, Karnataka. J. Commun. Dis. 2012, 44, 15–23. [Google Scholar]
- Hersant, B.; Cassier, S.; Constantinescu, G.; Gavelle, P.; Vazquez, M.P.; Picard, A.; Kadlub, N. Morsures de chien à la face chez l’enfant: Étude rétrospective de 77 cas. Ann. Chir. Plast. Esthétique 2012, 57, 230–239. [Google Scholar] [CrossRef]
- Day, H.; Roesler, J.S.; Kinde, M. Hospital-treated dog bites in Minnesota, 1998–2005. Minn. Med. 2007, 90, 43–47. [Google Scholar]
- Bernardo, L.M.; Gardner, M.J.; O’Connor, J.; Amon, N. Dog Bites in Children Treated in a Pediatric Emergency Department. J. Spec. Pediatr. Nurs. 2000, 5, 87–95. [Google Scholar] [CrossRef]
- Campbell, M.; Lai, E.T.C.; Pearce, A.; Orton, E.; Kendrick, D.; Wickham, S.; Taylor-Robinson, D. Understanding pathways to social inequalities in childhood unintentional injuries: Findings from the UK millennium cohort study. BMC Pediatr. 2019, 19, 150. [Google Scholar] [CrossRef]
- Watkins, F.; Westgarth, C. Dog bites from a public health perspective. In Dog Bites: A Multidisciplinary Perspective; Mills, D.S., Westgarth, C., Eds.; 5m Publishing: Sheffield, UK, 2017; pp. 46–53. [Google Scholar]
- Hallsworth, S. Then they came for the dogs! Crime Law Soc. Change 2011, 55, 391–403. [Google Scholar] [CrossRef]
- Nurse, A.; Guest, C.; Miles, L. An Investigation of Measures to Reduce Dog Attacks and Promote Responsible Ownership Amongst Dog Owners with Dog Control Issues in the UK-AW1410; Department for Environment Food & Rural Affairs: London, UK, 2021. [Google Scholar]
- Dahlgren, G.; Whitehead, M. Policies and strategies to promote social equity in health. In Background Document to WHO-Strategy Paper for Europe; Institute for Futures Studies: Stockholm, Sweden, 1991. [Google Scholar]
- Gouin, G.G.; Aenishaenslin, C.; Lévesque, F.; Simon, A.; Ravel, A. Description and Determinants of At-Risk Interactions for Human Health Between Children and Dogs in an Inuit Village. Anthrozoos 2021, 34, 723–738. [Google Scholar] [CrossRef]
- Oxley, J.A.; Christley, R.; Westgarth, C. What is a dog bite? Perceptions of UK dog bite victims. J. Vet. Behav. 2019, 29, 40–44. [Google Scholar] [CrossRef]
- Scottish, G. Scotland’s Health and Demographic Profile; Scottish Government: Edinburgh, UK, 2022. [Google Scholar]
- WHO. International Statistical Classification of Diseases and Related Health Problems (ICD). Available online: https://www.who.int/standards/classifications/classification-of-diseases (accessed on 1 August 2024).
- NRS. Population Estimates Time Series Data. Available online: https://www.nrscotland.gov.uk/publications/population-estimates-time-series-data/ (accessed on 31 May 2025).
- NRS. Population Estimates by Scottish Index of Multiple Deprivation (SIMD). Available online: https://www.nrscotland.gov.uk/publications/population-estimates-by-scottish-index-of-multiple-deprivation-simd/ (accessed on 29 December 2022).
- SpatialData.gov.scot. Local Authority Areas-Scotland. Available online: https://www.spatialdata.gov.scot/geonetwork/srv/eng/catalog.search#/metadata/1cd57ea6-8d6e-412b-a9dd-d1c89a80ad62 (accessed on 28 May 2023).
- PHS. Accident and Emergency: Metadata. Available online: https://publichealthscotland.scot/our-areas-of-work/acute-and-emergency-services/urgent-and-unscheduled-care/accident-and-emergency/#section-6-3 (accessed on 5 August 2024).
- Scottish, G. Scottish Index of Multiple Deprivation 2016: Introductory Booklet. Available online: https://www.gov.scot/publications/scottish-index-multiple-deprivation-2016/pages/7/ (accessed on 5 August 2024).
- Ryan, E.; O’Farrell, A.; O’Suillleabhain, P.; McKeown, D. Trends in in-hospital admissions due to dog bites in Ireland from 2012–2021. Ir. Med. J. 2023, 116, P887. [Google Scholar]
- Meints, K.; Brelsford, V.; De Keuster, T. Teaching Children and Parents to Understand Dog Signaling. Front. Vet. Sci. 2018, 5, 257. [Google Scholar] [CrossRef]
- Baatz, A.; Bidgood, A.; Taylor, G.; Young, R. The trouble with a cuddle: Families’ experiences of supervising interactions between children in middle childhood and the family dog. Hum. Anim. Interact. 2023, 2023, 1–8. [Google Scholar] [CrossRef]
- Alberghina, D.; Virga, A.; Sottile, G.; Buffa, S.P.; Panzera, M. A 10-year retrospective analysis (2012–2021) of hospitalizations resulting from dog bites in Southern Italy. Front. Vet. Sci. 2023, 10, 1104477. [Google Scholar] [CrossRef]
- Rajshekar, M.; Blizzard, L.; Julian, R.; Williams, A.M.; Tennant, M.; Forrest, A.; Walsh, L.J.; Wilson, G. The incidence of public sector hospitalisations due to dog bites in Australia 2001–2013. Aust. N. Z. J. Public Health 2017, 41, 377–380. [Google Scholar] [CrossRef]
- Constantino, C.; Da Silva, E.C.; Dos Santos, D.M.; Paploski, I.A.D.; Lopes, M.O.; Morikawa, V.M.; Biondo, A.W. One Health Approach on Dog Bites: Demographic and Associated Socioeconomic Factors in Southern Brazil. Trop. Med. Infect. Dis. 2023, 8, 189. [Google Scholar] [CrossRef]
- Garvey, E.M.; Twitchell, D.K.; Ragar, R.; Egan, J.C.; Jamshidi, R. Morbidity of pediatric dog bites: A case series at a level one pediatric trauma center. J. Pediatr. Surg. 2015, 50, 343–346. [Google Scholar] [CrossRef]
- Mannion, C.J.; Graham, A.; Shepherd, K.; Greenberg, D. Dog bites and maxillofacial surgery: What can we do? Br. J. Oral Maxillofac. Surg. 2015, 53, 522–525. [Google Scholar] [CrossRef]
- Morzycki, A.; Simpson, A.; Williams, J. Dog bites in the emergency department: A descriptive analysis. Can. J. Emerg. Med. 2019, 21, 63–70. [Google Scholar] [CrossRef]
- Ndon, J.A.; Jach, G.J.; Wehrenberg, W.B. Incidence of dog bites in Milwaukee, wis. Wis. Med. J. 1996, 95, 237–241. [Google Scholar]
- Oxley, J.A.; Christley, R.; Westgarth, C. Contexts and consequences of dog bite incidents. J. Vet. Behav. 2018, 23, 33–39. [Google Scholar] [CrossRef]
- Shuler, C.M.; DeBess, E.E.; Lapidus, J.A.; Hedberg, K. Canine and human factors related to dog bite injuries. J. Am. Vet. Med. Assoc. 2008, 232, 542–546. [Google Scholar] [CrossRef]
- Zangari, A.; Cerigioni, E.; Nino, F.; Guidi, R.; Gulia, C.; Piergentili, R.; Ilari, M.; Mazzoni, N.; Cobellis, G. Dog bite injuries in a tertiary care children’s hospital: A seven-year review. Pediatr. Int. 2021, 63, 575–580. [Google Scholar] [CrossRef]
- Chomel, B.B.; Trotignon, J. Epidemiologic surveys of dog and cat bites in the Lyon area, France. Eur. J. Epidemiol. 1992, 8, 619–624. [Google Scholar] [CrossRef]
- De Keuster, T.; Lamoureux, J.; Kahn, A.; Keuster, T.D.; Lamoureux, J.; Kahn, A. Epidemiology of dog bites: A Belgian experience of canine behaviour and public health concerns. Vet. J. 2006, 172, 482–487. [Google Scholar] [CrossRef]
- Klaassen, B.; Buckley, J.R.; Esmail, A. Does the dangerous dogs act protect against animal attacks: A prospective study of mammalian bites in the accident and emergency department. Injury 1996, 27, 89–91. [Google Scholar] [CrossRef]
- Loder, R.T. The demographics of dog bites in the United States. Heliyon 2019, 5, E01360. [Google Scholar] [CrossRef]
- Reisner, I.R.; Nance, M.L.; Zeller, J.S.; Houseknecht, E.M.; Kassam-Adams, N.; Wiebe, D.J. Behavioural characteristics associated with dog bites to children presenting to an urban trauma centre. Inj. Prev. 2011, 17, 348–353. [Google Scholar] [CrossRef]
- Rezac, P.; Rezac, K.; Slama, P. Human behavior preceding dog bites to the face. Vet. J. 2015, 206, 284–288. [Google Scholar] [CrossRef]
- Thomson, J. SIMD: Rural Deprivation. Evidence Summary; National Records Scotland: Edinburgh, UK, 2016. [Google Scholar]
- Henery, P.M.; Dundas, R.; Katikireddi, S.V.; Leyland, A.; Wood, R.; Pearce, A. Social inequalities and hospital admission for unintentional injury in young children in Scotland: A nationwide linked cohort study. Lancet Reg. Health Eur. 2021, 6, 100117. [Google Scholar] [CrossRef]
- Lee, C.J.; Santos, P.J.F.; Vyas, R.M. Epidemiology, Socioeconomic Analysis, and Specialist Involvement in Dog Bite Wounds in Adults. J. Craniofacial Surg. 2019, 30, 753–757. [Google Scholar] [CrossRef]
- Cook, J.A.; Sasor, S.E.; Soleimani, T.; Chu, M.W.; Tholpady, S.S. An Epidemiological Analysis of Pediatric Dog Bite Injuries Over a Decade. J. Surg. Res. 2020, 246, 231–235. [Google Scholar] [CrossRef]
- de la Puente-León, M.; Levy, M.Z.; Toledo, A.M.; Recuenco, S.; Shinnick, J.; Castillo-Neyra, R. Spatial Inequality Hides the Burden of Dog Bites and the Risk of Dog-Mediated Human Rabies. Am. J. Trop. Med. Hyg. 2020, 103, 1247–1257. [Google Scholar] [CrossRef]
- Ramgopal, S.; Macy, M.L. Pediatric patients with dog bites presenting to US children’s hospitals. Inj. Epidemiol. 2021, 8, 55. [Google Scholar] [CrossRef]
- Beck, A.M.; Loring, H.; Lockwood, R. The ecology of dog bite injury in St. Louis, Missouri. Public Health Rep. 1975, 90, 262–267. [Google Scholar]
- Duncan-Sutherland, N.; Hunt, M.; Alatini, M.; Shepherd, M.; Kool, B. Study of dog control strategies. Inj. Prev. 2023, 29, 219–226. [Google Scholar] [CrossRef]
- Westgarth, C.; Boddy, L.M.; Stratton, G.; German, A.J.; Gaskell, R.M.; Coyne, K.P.; Bundred, P.; McCune, S.; Dawson, S. Pet ownership, dog types and attachment to pets in 9–10 year old children in Liverpool, UK. BMC Vet. Res. 2013, 9, 102. [Google Scholar] [CrossRef]
- Eller, E.; Roll, S.; Chen, C.M.; Herbarth, O.; Wichmann, H.E.; Von Berg, A.; Krämer, U.; Mommers, M.; Thijs, C.; Wijga, A.; et al. Meta-analysis of determinants for pet ownership in 12 European birth cohorts on asthma and allergies: A GA2LEN initiative. Allergy Eur. J. Allergy Clin. Immunol. 2008, 63, 1491–1498. [Google Scholar] [CrossRef]
- Murray, J.K.; Browne, W.J.; Roberts, M.A.; Whitmarsh, A.; Gruffydd-Jones, T. Number and ownership profiles of cats and dogs in the UK. Vet. Rec. 2010, 166, 163. [Google Scholar] [CrossRef]
- Marsa-Sambola, F.; Williams, J.; Muldoon, J.; Lawrence, A.; Connor, M.; Roberts, C.; Brooks, F.; Currie, C. Sociodemographics of Pet Ownership among Adolescents in Great Britain: Findings from the HBSC Study in England, Scotland, and Wales. Anthrozoos 2016, 29, 559–580. [Google Scholar] [CrossRef]
- Purewal, R.; Christley, R.; Kordas, K.; Joinson, C.; Meints, K.; Gee, N.; Westgarth, C. Socio-demographic factors associated with pet ownership amongst adolescents from a UK birth cohort. BMC Vet. Res. 2019, 15, 334. [Google Scholar] [CrossRef]
- Saunders, J.; Parast, L.; Babey, S.H.; Miles, J.V. Exploring the differences between pet and non-pet owners: Implications for human-animal interaction research and policy. PLoS ONE 2017, 12, e0179494. [Google Scholar] [CrossRef]
- Westgarth, C.; Pinchbeck, G.L.; Bradshaw, J.W.S.; Dawson, S.; Gaskell, R.M.; Christley, R. Factors associated with dog ownership and contact with dogs in a UK community. BMC Vet. Res. 2007, 3, 5. [Google Scholar] [CrossRef]
- Newman, J.; Christley, R.; Westgarth, C.; Morgan, K. Risk Factors for Dog Bites-An Epidemiological Perspective. In Dog Bites: A Multidisciplinary Perspective; Mills, D.S., Westgarth, C., Eds.; 5m Publishing: Sheffield, UK, 2017; pp. 133–158. [Google Scholar]
- Alfahad, M.; Butt, F.; Aslam, M.A.; Abbas, T.; Qazi, A.A.; Qudratullah. Incidence of dog bite injuries and its associated factors in Punjab province of Pakistan. Sci. One Health 2022, 1, 100007. [Google Scholar] [CrossRef]
- Khan, K.; Horswell, B.B.; Samanta, D. Dog-Bite Injuries to the Craniofacial Region: An Epidemiologic and Pattern-of-Injury Review at a Level 1 Trauma Center. J. Oral Maxillofac. Surg. 2020, 78, 401–413. [Google Scholar] [CrossRef]
- Arhant, C.; Landenberger, R.; Beetz, A.; Troxler, J. Attitudes of caregivers to supervision of child–family dog interactions in children up to 6 years—An exploratory study. J. Vet. Behav. Clin. Appl. Res. 2016, 14, 10–16. [Google Scholar] [CrossRef]
- Damashek, A.; Corlis, M. The Role of Proximal Maternal Supervision in Children’s Risk for Injury in a Low-Income Sample. J. Pediatr. Psychol. 2017, 42, 727–737. [Google Scholar] [CrossRef]
- Mahboob, A.; Richmond, S.A.; Harkins, J.P.; Macpherson, A.K. Childhood unintentional injury: The impact of family income, education level, occupation status, and other measures of socioeconomic status. A systematic review. Paediatr. Child Health 2021, 26, E39–E45. [Google Scholar] [CrossRef]
- Saluja, G.; Brenner, R.; Morrongiello, B.A.; Haynie, D.; Rivera, M.; Cheng, T.L. The role of supervision in child injury risk: Definition, conceptual and measurement issues. Inj. Control. Saf. Promot. 2004, 11, 17–22. [Google Scholar] [CrossRef]
- Douglas, M. Beyond ‘health’: Why don’t we tackle the cause of health inequalities? In Health Inequalities: Critical Perspectives; Smith, K.E., Bambra, C., Hill, S.E., Eds.; Oxford University Press: Oxford, UK, 2015; pp. 109–123. [Google Scholar]
- Julien, D.A.; Sargeant, J.M.; Filejski, C.; Harper, S.L. Ouch! A cross-sectional study investigating self-reported human exposure to dog bites in rural and urban households in southern Ontario, Canada. Zoonoses Public Health 2020, 67, 554–565. [Google Scholar] [CrossRef]
- The Scottish Parliament. Meeting of the Parliament: Session 6, Thursday 9 May 2024; The Scottish Parliament: Chapeltown, UK, 2024.
- The Scottish Parliament. Meeting of the Parliament: Session 6, Thursday 18 January 2024; The Scottish Parliament: Chapeltown, UK, 2024.
- The Scottish Parliament. PE2083: Review the Rules to Ensure That no Dog Becomes more Dangerous as a Result of Breed Specific Regulations Annexe A: Summary of Petition. Available online: https://www.parliament.scot/get-involved/petitions/view-petitions/pe2083-review-the-rules-to-ensure-that-no-dog-becomes-more-dangerous-as-a-result-of-breed (accessed on 1 August 2024).
- Pearce, A. Will Policies in the Early Years Reduce Inequalities in Health? A Synthesis to Inform Policy; University College London: London, UK, 2011. [Google Scholar]
- Cerdá, M.; Tracy, M.; Ahern, J.; Galea, S. Addressing population health and health inequalities: The role of fundamental causes. Am. J. Public Health 2014, 104, 609–619. [Google Scholar] [CrossRef]
- Laflamme, L.; Sethi, D.; Burrows, S.; Hasselberg, M.; Racioppi, F.; Franklin, A. Addressing the Socioeconomic Safety Divide: Policy Briefing; World Health Organization: Geneva, Switzerland, 2009; p. 38. ISSN 9289043008. [Google Scholar]
- Card, C.; Epp, T.; Lem, M. Exploring the social determinants of animal health. J. Vet. Med. Educ. 2018, 45, 437–447. [Google Scholar] [CrossRef]
- Mouton, M.; Rock, M. Governing cities as more-than-human entities: From the population of databases to the legibility of urban populations. City 2021, 25, 652–670. [Google Scholar] [CrossRef]
- Senior, K.; Chenhall, R.; McRae-Williams, E.; Daniels, D.; Rogers, K. Dogs and People in Aboriginal Communities: Exploring the Relationship within the Context of the Social Determinants of Health. Environ. Health 2006, 6, 39–46. [Google Scholar]
- Owczarczak-Garstecka, S.; Watkins, F.; Christley, R.; Westgarth, C. Online videos indicate human and dog behaviour preceding dog bites and the context in which bites occur. Sci. Rep. 2018, 8, 7147. [Google Scholar] [CrossRef]
- Shen, J.; Rouse, J.; Godbole, M.; Wells, H.L.; Boppana, S.; Schwebel, D.C. Systematic Review: Interventions to Educate Children About Dog Safety and Prevent Pediatric Dog-Bite Injuries: A Meta-Analytic Review. J. Pediatr. Psychol. 2017, 42, 779–791. [Google Scholar] [CrossRef]
- Oxley, J.A.; Meyer, G.; Butcher, M.; Bellantuono, G.; Levers, A.; Westgarth, C. Veterinary students’ proximity to and interpretation of a simulated “aggressive” dog before and after training. Sci. Rep. 2024, 14, 3209. [Google Scholar] [CrossRef]
- Clarke, N.M.; Fraser, D. Animal control measures and their relationship to the reported incidence of dog bites in urban Canadian municipalities. Can. Vet. J. 2013, 54, 145–149. [Google Scholar]
- Guy, N.C.; Luescher, U.A.; Dohoo, S.E.; Spangler, E.; Miller, J.B.; Dohoo, I.R.; Bate, L.A. Demographic and aggressive characteristics of dogs in a general veterinary caseload. Appl. Anim. Behav. Sci. 2001, 74, 15–28. [Google Scholar] [CrossRef]
- Owczarczak-Garstecka, S.; Christley, R.; Watkins, F.; Yang, H.; Bishop, B.; Westgarth, C. Dog bite safety at work: An injury prevention perspective on reported occupational dog bites in the UK. Saf. Sci. 2019, 118, 595–606. [Google Scholar] [CrossRef]
- Schwebel, D.C. Why “accidents” are not accidental: Using psychological science to understand and prevent unintentional child injuries. Am. Psychol. 2019, 74, 1137–1147. [Google Scholar] [CrossRef]
- Haddon, W. Advances in the epidemiology of injuries as a basis for public policy. Public Health Rep. 1980, 95, 411–421. [Google Scholar]
- Levesque, J.-F.; Harris, M.F.; Russell, G. Patient-centred access to health care: Conceptualising access at the interface of health systems and populations. Berichte Der Dtsch. Chem. Ges. 2013, 12, 3262–3265. [Google Scholar] [CrossRef]
- van Wijk, E.C.; Landais, L.L.; Harting, J. Understanding the multitude of barriers that prevent smokers in lower socioeconomic groups from accessing smoking cessation support: A literature review. Prev. Med. 2019, 123, 143–151. [Google Scholar] [CrossRef]
- Westgarth, C.; Brooke, M.; Christley, R.M. How many people have been bitten by dogs? A cross-sectional survey of prevalence, incidence and factors associated with dog bites in a UK community. J. Epidemiol. Community Health 2018, 72, 331–336. [Google Scholar] [CrossRef]
- PHS. PHS FOI 2023-001712. Available online: https://publichealthscotland.scot/contact-us/freedom-of-information-foi-and-environmental-information-regulation-eir-requests/freedom-of-information-request-log/phs-foi-2023-001712/ (accessed on 15 June 2024).
- Dickson, J.M.; Mason, S.M.; Bailey, A. Emergency department diagnostic codes: Useful data? Emerg. Med. J. 2017, 34, 627. [Google Scholar] [CrossRef]
- Garde, E.; Marín-Vial, P.; Pérez, G.E.; Sandvig, E.M. A Review and Analysis of the National Dog Population Management Program in Chile. Animals 2022, 12, 228. [Google Scholar] [CrossRef]
- Oxley, J.A.; Santa, K.; Meyer, G.; Westgarth, C. A Systematic Scoping Review of Human-Dog Interactions in Virtual and Augmented Reality: The Use of Virtual Dog Models and Immersive Equipment. Front. Virtual Real. 2022, 3, 782023. [Google Scholar] [CrossRef]
- The Blue Dog. Available online: https://bluedog.blogs.lincoln.ac.uk/ (accessed on 19 June 2025).
- Oxley, J.A.; Meyer, G.; Cant, I.; Bellantuono, G.M.; Butcher, M.; Levers, A.; Westgarth, C. A pilot study investigating human behaviour towards DAVE (Dog Assisted Virtual Environment) and interpretation of non-reactive and aggressive behaviours during a virtual reality exploration task. PLoS ONE 2022, 17, e0274329. [Google Scholar] [CrossRef]
- is.DCN.scot-The Scottish Dog Control Database. Available online: https://www.improvementservice.org.uk/products-and-services/digital-public-services/dcn.scot-the-scottish-dog-control-database (accessed on 7 August 2024).


| Age Group | NHS 24 Calls | A&E Attendances | SMR01 Admissions |
|---|---|---|---|
| 0–14 | 2.8 | 3.0 | 4.6 |
| 15–69 | 2.4 | 2.4 | 4.6 |
| 70+ | 1.3 | 1.1 | 1.2 |
| All ages | 2.5 | 2.4 | 3.9 |
| SIMD Domain | NHS 24 Calls | A&E Attendances | SMR01 Admissions |
|---|---|---|---|
| Income | 2.1 | 2.2 | 3.4 |
| Employment | 2.0 | 2.2 | 3.0 |
| Health | 2.2 | 2.2 | 3.2 |
| Education | 2.3 | 2.3 | 3.1 |
| Housing | 1.4 | 1.8 | 2.2 |
| Access | 1.0 | 0.8 | 1.0 |
| Crime | 1.6 | 2.1 | 2.1 |
Disclaimer/Publisher’s Note: The statements, opinions and data contained in all publications are solely those of the individual author(s) and contributor(s) and not of MDPI and/or the editor(s). MDPI and/or the editor(s) disclaim responsibility for any injury to people or property resulting from any ideas, methods, instructions or products referred to in the content. |
© 2025 by the authors. Licensee MDPI, Basel, Switzerland. This article is an open access article distributed under the terms and conditions of the Creative Commons Attribution (CC BY) license (https://creativecommons.org/licenses/by/4.0/).
Share and Cite
Hooper, J.; Buchanan-Smith, H.M.; Robertson, T.; Lambert, P. Social Inequalities in Dog Bites and Strikes in Scotland: Evidence from Administrative Health Records and Implications for Prevention Policy. Animals 2025, 15, 1971. https://doi.org/10.3390/ani15131971
Hooper J, Buchanan-Smith HM, Robertson T, Lambert P. Social Inequalities in Dog Bites and Strikes in Scotland: Evidence from Administrative Health Records and Implications for Prevention Policy. Animals. 2025; 15(13):1971. https://doi.org/10.3390/ani15131971
Chicago/Turabian StyleHooper, Jade, Hannah M. Buchanan-Smith, Tony Robertson, and Paul Lambert. 2025. "Social Inequalities in Dog Bites and Strikes in Scotland: Evidence from Administrative Health Records and Implications for Prevention Policy" Animals 15, no. 13: 1971. https://doi.org/10.3390/ani15131971
APA StyleHooper, J., Buchanan-Smith, H. M., Robertson, T., & Lambert, P. (2025). Social Inequalities in Dog Bites and Strikes in Scotland: Evidence from Administrative Health Records and Implications for Prevention Policy. Animals, 15(13), 1971. https://doi.org/10.3390/ani15131971