Article

Evaluating the Impact of Arginine-to-Lysine Ratios on Growth Performance, Antioxidant Defense, and Immune Modulation in Juvenile Largemouth Bass (Micropterus salmoides)

1
Department of Aquaculture, Zhejiang Ocean University, Zhoushan 316022, China
2
Institute of Quality Standards and Testing Technology for Agricultural Products, Chinese Academy of Agricultural Science, Beijing 100081, China
*
Author to whom correspondence should be addressed.
Animals 2025, 15(13), 1947; https://doi.org/10.3390/ani15131947
Submission received: 29 April 2025 / Revised: 21 June 2025 / Accepted: 30 June 2025 / Published: 2 July 2025

Simple Summary

Optimal nutrition, particularly a balanced ratio of arginine to lysine, is critical for the healthy growth of juvenile largemouth bass. This study investigated the effects of varying dietary arginine-to-lysine ratios on growth performance, metabolism, and antioxidant capacity over an eight-week period. Results indicated that an arginine-to-lysine ratio of 0.85 enhanced hepatic antioxidant capacity and reduced inflammation. Conversely, excessive dietary lysine impaired growth, disrupted metabolic homeostasis, and increased oxidative stress. Supplementation with arginine under lysine-excess conditions improved growth, enhanced immunity, and bolstered antioxidant defenses, effectively mitigating the adverse effects of the amino acid imbalance. These findings suggest that maintaining an appropriate arginine-to-lysine ratio in aquaculture feed is essential for promoting growth and mitigating stress in juvenile largemouth bass, potentially leading to improvements in feed formulation.

Abstract

This study examines the impact of the arginine/lysine ratio in feed on the growth, serum amino acids, arginine metabolism, and antioxidant capacity of juvenile largemouth bass (5.95 ± 0.02 g). Five isonitrogenous and isolipidic diets with varying arginine/lysine ratios were formulated and administered over an eight-week period. The results indicated that the treatments had no significant effect on protein efficiency ratio (PER), daily feed intake (DFI), or morphological indices of juvenile largemouth bass (p > 0.05). When the arginine/lysine ratio was 0.85 (2.25/2.65; 2.54/3.00), liver antioxidant capacity was maximized, and inflammatory factors were suppressed. Conversely, a ratio of 2.25/2.99 significantly reduced weight gain (WG) and specific growth rate (SGR) in juvenile largemouth bass, inhibited arginase activity, and increased serum total nitric oxide synthase (T-NOS) activity. When lysine was in excess (2.25/2.99 group), elevating arginine content (2.54/3.00 group) enhanced growth, antioxidant, and immune performance. Analysis of glutathione metabolism and innate immune-related pathway revealed that an optimal arginine/lysine ratio mitigates inflammatory damage induced by oxidative stress. An arginine/lysine imbalance significantly elevated liver malondialdehyde (MDA) content while reducing total antioxidant capacity (T-AOC), superoxide dismutase (SOD), catalase (CAT) activities, and glutathione (GSH) content, thereby increasing the expression levels of inflammatory factors (IL1B, IL8, TGFB1, BAX). These findings demonstrate that an imbalance in arginine/lysine adversely affects the growth, metabolism, and antioxidant capacity of largemouth bass. When lysine is in excess, increasing the arginine content to achieve an arginine/lysine ratio of 0.85 alleviates the negative effects of antagonism, suggesting arginine supplementation may regulate oxidative damage caused by lysine excess.

1. Introduction

Nutritional immunology has gained global attention [1], particularly the interplay between essential amino acids and fish immune organs, along with their molecular mechanisms, which is a central focus in fish nutrition research [2,3,4]. Studies demonstrate that fish growth is closely linked to immune organ function, antimicrobial compounds [5], and the production of inflammatory factors [6]. Among essential amino acids, arginine and lysine are notable for their critical roles in animal nutrition. Beyond their function as protein synthesis substrates, these amino acids are involved in diverse metabolic activities and possess various physiological functions, influencing growth, development, metabolism, and health in fish [7,8]. Arginine, serving as a precursor for nitric oxide (NO), polyamines, creatine, and agmatine, has been identified as a key immunonutrient [9]. It is central to multiple metabolic pathways mediated by enzymes such as arginase, nitric oxide synthase, arginine: glycine amidinotransferase, and arginine decarboxylase [10], and its role in fish immunity has attracted widespread interest. Additionally, arginine and its metabolites contribute to cell proliferation, intestinal homeostasis, antioxidant capacity, and energy metabolism regulation [11,12], while also acting as potent stimulants for insulin and growth hormone secretion [13]. Conversely, lysine is the first limiting amino acid in many plant-based aquafeed protein sources. It functions as a precursor for carnitine, facilitating the transport of long-chain fatty acids to mitochondria for β-oxidation [14]. Lysine also regulates key metabolic and cellular signaling pathways, essential for nutrient utilization, growth promotion, and digestive system development in fish [15]. Its immune and antioxidant functions are well-documented [5,15,16,17], with optimal levels enhancing growth performance and intestinal antioxidant capacity [15,17]. However, lysine deficiency or excess can impair growth [18,19], increase oxidative stress [15], and exacerbate inflammatory responses [16].
Recent studies have extensively explored the requirements of arginine and lysine in different fish species [20,21,22]. These investigations consistently highlight the importance of maintaining appropriate amino acid levels for optimal growth, as deficiencies or excesses lead to reduced survival, stunted growth, and decreased feed efficiency [18,19,23,24,25,26]. However, most research has focused on individual amino acids, with limited investigation into their interactions. Arginine and lysine, both alkaline amino acids, share the same transport mechanism, leading to competitive uptake into cells [27,28]. Excessive lysine can reduce arginine availability [29], and their shared dibasic amino acid carrier suggests a potential antagonistic interaction that may influence absorption, transport, and metabolism [27,28,29]. While some studies have examined this interaction in aquatic species, results remain inconsistent [30,31]. For instance, Alam found no antagonism between arginine and lysine in olive flounder [30], whereas Dong observed significant antagonism in the giant freshwater prawn (Macrobrachium rosenbergii) [32]. Berge reported that high lysine levels inhibit arginine availability in Atlantic salmon muscle, though the specific mechanism remains unclear [33]. Thus, further research is required to comprehensively evaluate the impact of the interaction between dietary arginine and lysine on fish health. This evaluation should investigate the antagonistic effects of these amino acids on oxidative stress and inflammation from the perspective of nutritional immunology.
The largemouth bass (Micropterus salmoides), a freshwater carnivorous fish native to North America, was introduced to China in the 1980s and has since become a major aquaculture species due to its high-quality meat, short farming cycle, and adaptability. In 2023, largemouth bass farming in China exceeded 802,000 tons. While studies on the nutritional requirements of juvenile largemouth bass have been reported [34,35,36,37], gaps remain in understanding the interaction between arginine and lysine. Zhou et al. demonstrated that a diet containing 2.23% arginine optimizes growth performance [38]. Dairiki et al. suggested an optimal lysine supplementation level of 2.10% [39], while Coyle proposed that 2.80% lysine meets growth requirements [35]. However, no research has explored the potential antagonistic relationship between these amino acids. This study aims to investigate the effects of different arginine/lysine ratios on the growth performance, amino acid composition, antioxidant function, and arginine metabolism of juvenile largemouth bass, providing a theoretical basis for optimizing their inclusion in largemouth bass feed formulations.

2. Materials and Methods

2.1. Experimental Diets, Feeding Procedure, and Sampling

Diets were formulated using soybean meal, fish meal, and crystalline amino acids as primary protein sources, with fish oil as the fat source. All diets were iso-nitrogenous (45% crude protein) and iso-caloric (20 MJ·kg−1) (Table 1). The experiment comprised five treatment groups: D1, Optimal arginine-deficient lysine (Arg/Lys = 2.27/2.25); D2, Optimal arginine-optimal lysine (Arg/Lys = 2.25/2.65); D3, Optimal arginine-excess lysine (Arg/Lys = 2.25/2.99); D4, Excess arginine-excess lysine (Arg/Lys = 2.54/3.00); D5, Excess arginine-high lysine (Arg/Lys = 2.55/3.84).
Glycine was added to maintain iso-nitrogenity, and the amino acid composition mirrored the whole-body profile of juvenile largemouth bass (Table 2). Crystalline amino acids were weighed precisely and encapsulated using carboxymethyl cellulose (CMC) [35]. The pH of the mixture was adjusted to 7.0–7.5 with 6 N NaOH. The amino acid mixture was blended with dry ingredients, followed by the addition of oil and distilled water. The mixture was extruded into 1.5 mm pellets using a twin-screw extruder (G-250, South China University of Technology, Guangzhou, China). Pellets were dried at 50 °C for 12 h, cooled, and stored in sealed plastic bags at −20 °C until use.
Juvenile largemouth bass were obtained from Zhengda Aquaculture Co., Ltd., Huzhou, China and the experiment was conducted at the Nutrition and Feed Laboratory of Zhejiang Ocean University. After a 14-day acclimation period, 300 healthy fish (initial weight: 5.95 ± 0.02 g) were randomly allocated to 15 tanks, with five triplicate groups of 20 fish each. Fish were fed to satiation twice daily (8:30 and 17:30), and uneaten feed and feces were removed via siphoning 1 h post-feeding. Water temperature was maintained at 26 ± 1 °C, dissolved oxygen at >6 mg L−1, ammonia nitrogen at <0.05 mg L−1, and photoperiod at 12L:12D.
At the end of the 8-week trial, fish were fasted for 24 h and anesthetized with 150 mg L−1 MS-222. Fish were counted, weighed, and three individuals per tank were randomly selected for whole-body nutrient analysis. Blood was collected from six fish via the caudal vein, placed in 1.5 mL heparinized tubes, and stored at 4 °C for 12 h. Serum was isolated by centrifugation (4 °C, 4000 rpm, 10 min). Fish were dissected on ice, and viscerosomatic index (VSI), intraperitoneal fat ratio (IPF), hepatosomatic index (HSI), and condition factor (CF) were calculated. Tissue samples were flash-frozen in liquid nitrogen and stored at −80 °C for further analysis.

2.2. Sample Analysis

Proximate composition was analyzed according to AOAC standards [40]. Feed moisture was determined by drying at 105 °C for 24 h to constant weight. Whole fish and tissues were freeze-dried at −110 °C (LL1500, Thermo Scientific, Waltham, MA, USA) to constant weight for moisture content determination. Crude protein and crude fat were measured using an automatic Kjeldahl nitrogen analyzer (K355/K437, Büchi, Flawil, Switzerland) and Soxhlet extraction apparatus (E816, Büchi, Flawil, Switzerland), respectively. Ash content was determined by incineration at 550 °C for approximately 12 h. Total energy content of the feed and whole fish was measured using an adiabatic bomb calorimeter (HWR-15E, Shangli, Shanghai, China).

2.3. Biochemical Analysis and Amino Acid Determination

The activities of total nitric oxide synthase (T-NOS), aspartate aminotransferase (AST), alanine aminotransferase (ALT), total antioxidant capacity (T-AOC), superoxide dismutase (SOD), and catalase (CAT) were measured using commercial assay kits (Nanjing Jiancheng Bioengineering Institute, Nanjing, China). Serum ammonia, glutathione (GSH), and malondialdehyde (MDA) concentrations were determined following the manufacturer’s instructions, and absorbance was read using a microplate reader (Multiskan Go, Thermo Scientific, Waltham, MA, USA). Arginase activity was measured using a previously published method [41], with urea quantified via a colorimetric method using p-dimethylaminobenzaldehyde. One unit of arginase activity was defined as the amount of enzyme catalyzing the production of 1 mmol urea per minute.
To measure free amino acids in serum, 0.05 mL serum was mixed with 0.35 mL 8% sulfosalicylic acid. Then, 0.05 mL acetonitrile and 0.05 mL 2 M sodium bicarbonate were added, mixed thoroughly, and centrifuged (4 °C, 15,000 rpm, 10 min). The supernatant was collected for analysis.
For whole-body amino acids, 0.2 g of sample was hydrolyzed in 10 mL 6 N HCl under N2 for 10 min and incubated at 110 °C for 24 h. The sample was diluted to 100 mL with distilled water, and 0.5 mL supernatant was mixed with 0.5 mL acetonitrile, centrifuged (4 °C, 15,000 rpm, 10 min), and 0.2 mL supernatant was diluted with 0.8 mL 0.1 N HCl for amino acid analysis. All samples were analyzed using high-performance liquid chromatography (Agilent, 1260 Infinity II, Santa Clara, CA, USA) [42].

2.4. Determination of Gene Expression in Liver

Liver samples were collected from each treatment group post-trial. Fish were anesthetized with MS-222 (0.125 g/L), and blood was collected via the caudal vein using a 1 mL sterile syringe. Livers were dissected and flash-frozen in liquid nitrogen, and then stored at −80 °C for RNA extraction. Total RNA was isolated using TRIzol reagent (Invitrogen, Carlsbad, CA, USA), chloroform, isopropanol, ethanol, and DEPC water [43]. A total of 500 ng RNA was reverse transcribed into cDNA using the PrimeScript™ RT kit (Takara, Dalian, China) following the manufacturer’s instructions. Gene expression was analyzed using a Real-Time PCR system (QuantStudio™ 6 Flex, Life Technologies, Carlsbad, CA, USA), with relative expression levels calculated using the 2−ΔΔCt method. Primer sequences are listed in Table S1 (Supplementary Materials).

2.5. Data Analysis

All data are expressed as mean ± SD. Statistical analyses were performed using SPSS (version 26.0). Data homogeneity and normality were assessed using Levene’s test and the Kolmogorov–Smirnov test, respectively. Significant differences were analyzed by one-way ANOVA followed by Tukey’s multiple comparison test (p < 0.05). Heatmaps were generated using R (v3.6.3) to visualize antioxidant and inflammation-related gene expression. Regulatory networks for the Keap1-Nrf2 signaling pathway and inflammatory factors were constructed using the GeneMANIA Cytoscape app (3.8.0). KEGG mapping results for glutathione pathway-related genes were generated using the OmicStudio tools platform (https://www.omicstudio.cn/tool/81) (accessed on 15 August 2024).

3. Results

3.1. Growth Performance and Morphological Indicators

The survival rate of largemouth bass was high (96.67–100.00%), with no significant differences among treatments (p > 0.05) (Table 3). The 2.25/2.65 group had the highest WG and SGR, while the 2.25/2.99 group had the lowest (p < 0.05). Although not statistically significant, the 2.54/3.00 group showed some improvement in WG and SGR compared to the 2.25/2.99 group. The highest FCR was recorded in the 2.27/2.25 group, although the difference was not statistically significant. Dietary treatments had no significant effect on PER, DFI, or FI (p > 0.05). Morphological indices were also unaffected by varying arginine/lysine ratios (p > 0.05) (Table 4). The CF in the 2.27/2.25 and 2.25/2.99 groups was numerically lower than in other groups.

3.2. Nutritional Components of the Whole Body and Tissues

The proximate composition of the whole fish, muscle, and liver was unaffected by dietary arginine/lysine ratios (p > 0.05) (Table 5). Liver fat content in the 2.25/2.99 group was numerically higher than in other groups.

3.3. Nitrogen, Lipid, and Energy Intake and Utilization

Daily lipid intake (DLI) was significantly affected by dietary treatments (p < 0.05) (Table 6). The DLI of the other four groups showed no significant difference compared to the control group (2.25/2.65) (p > 0.05). Although the difference was not statistically significant, DEI was highest in the 2.27/2.25 group.

3.4. Plasma Free Amino Acid Profile

The effects of dietary arginine/lysine ratios on serum amino acid composition are presented in Table 7. Among essential amino acids, Arg, Lys, and Met were significantly affected by dietary ratios (p < 0.05), while other essential amino acids remained unchanged. The 2.25/2.99 and 2.25/2.65 group exhibited significantly higher serum arginine content compared to other groups (p < 0.05). Serum lysine content increased with dietary lysine levels, except in the 2.54/3.00 group. Among non-essential amino acids, Asn, Gly, Ser, Tyr, and Cit were significantly influenced by dietary ratios (p < 0.05). Serum glycine content mirrored dietary glycine levels, while citrulline content in the 2.25/2.99 group was significantly higher than in other groups (p < 0.05). Moreover, the serum ornithine content in the 2.25/2.99 group achieved the highest numerical value (p > 0.05).

3.5. Whole Body Amino Acid Composition

Dietary arginine/lysine ratios had no significant effect on whole-body arginine and lysine content (p > 0.05; Table 8). However, His, Thr, Val, and Ser were significantly influenced by dietary treatments (p < 0.05). Amino acid retention rates indicated that Arg, Lys, and Gly retention rates decreased with increased dietary levels (p < 0.05; Table 9). Additionally, Ala, and Tyr retention rates were significantly impacted by dietary treatments (p < 0.05), with the lowest retention rates observed in the 2.27/2.25 group.

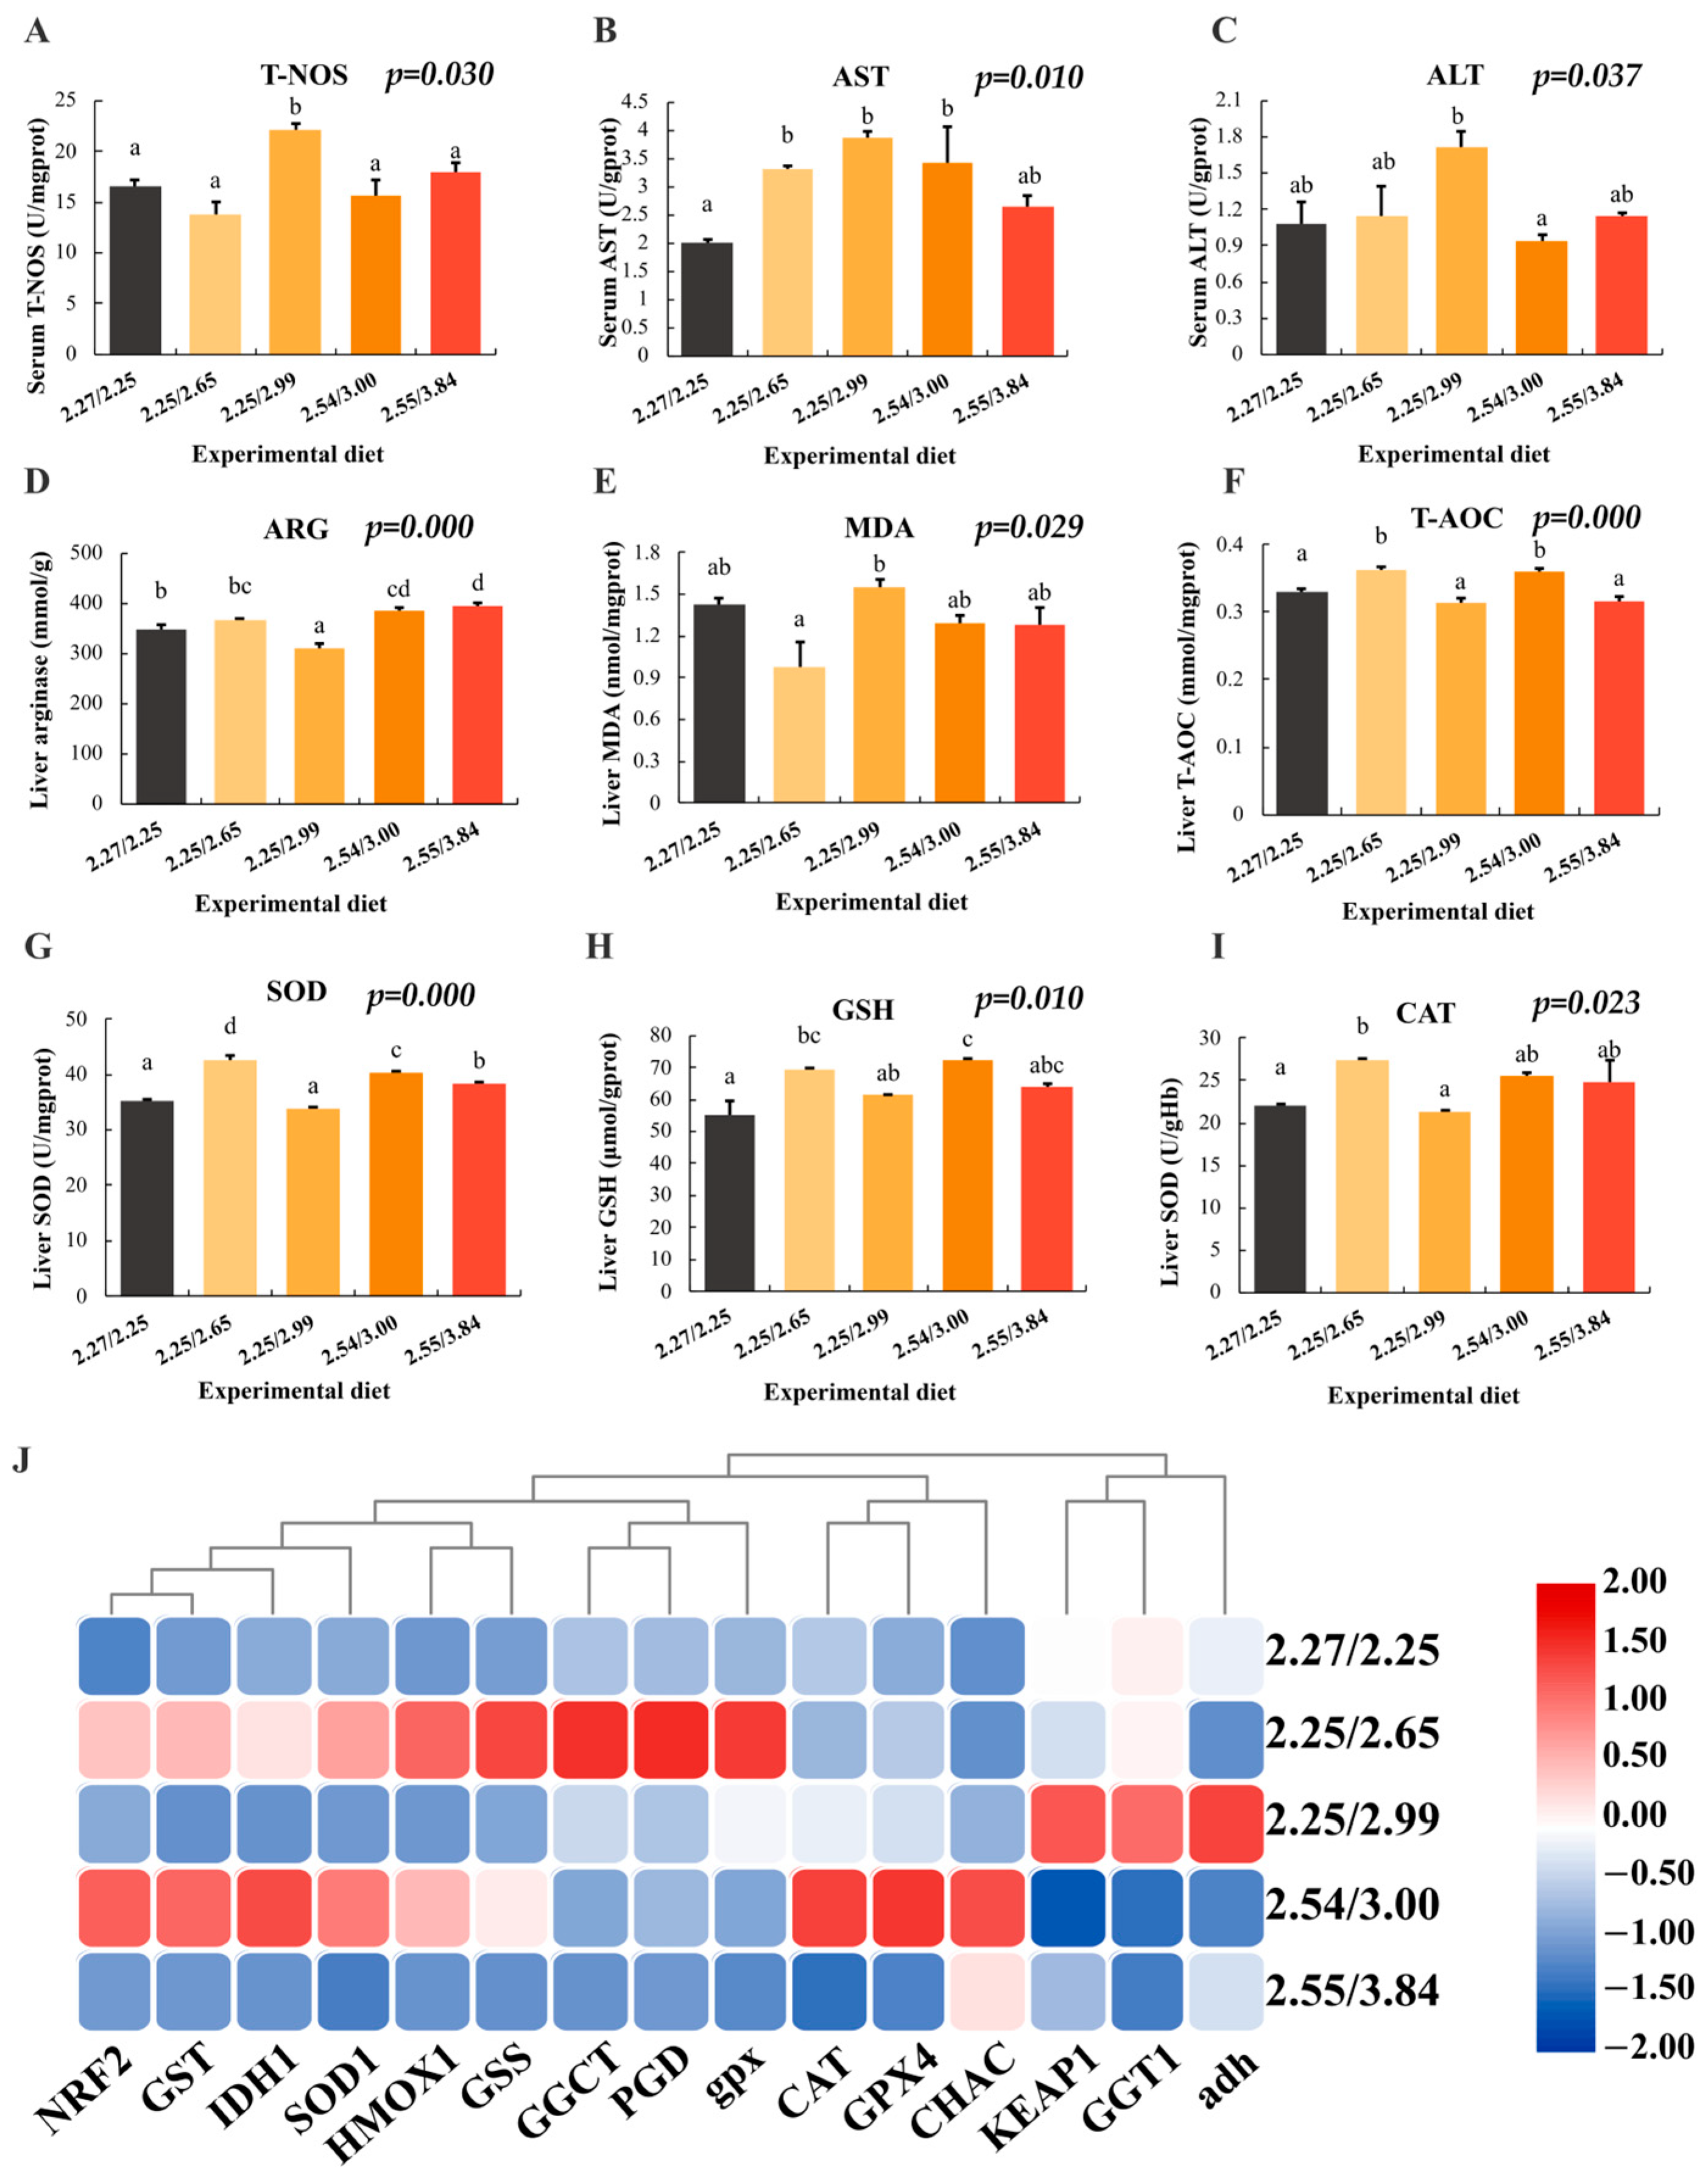
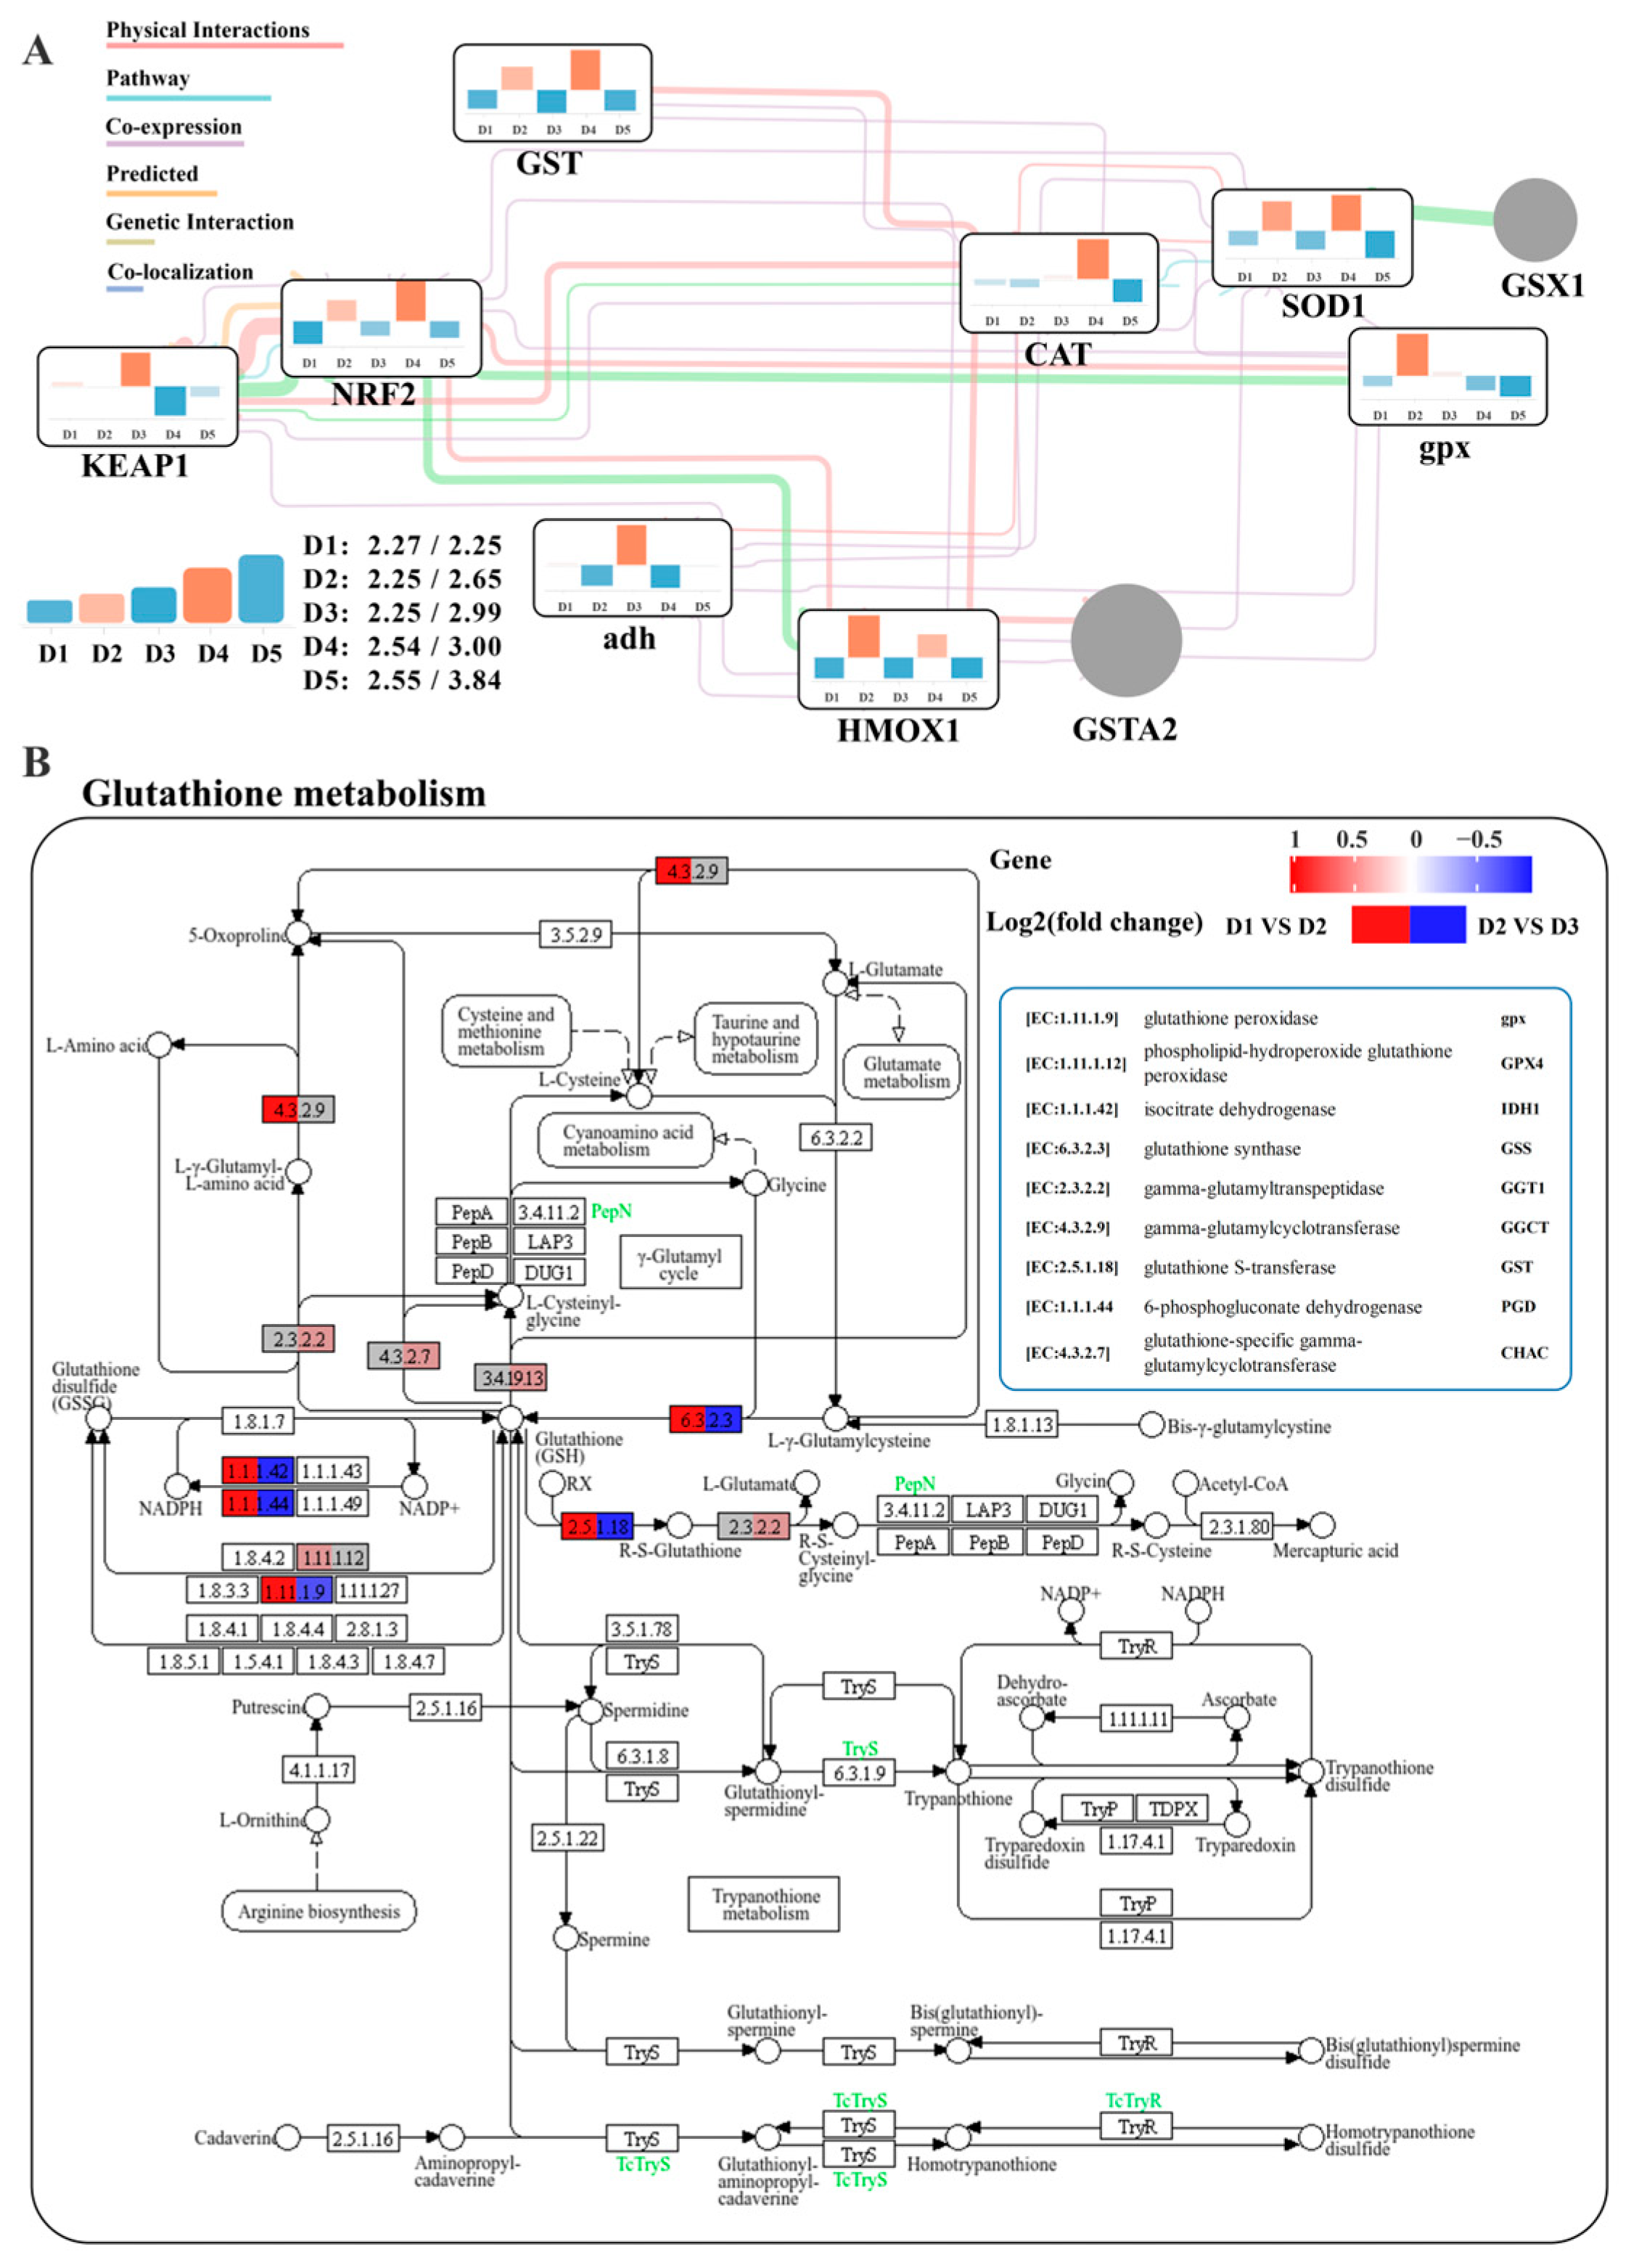
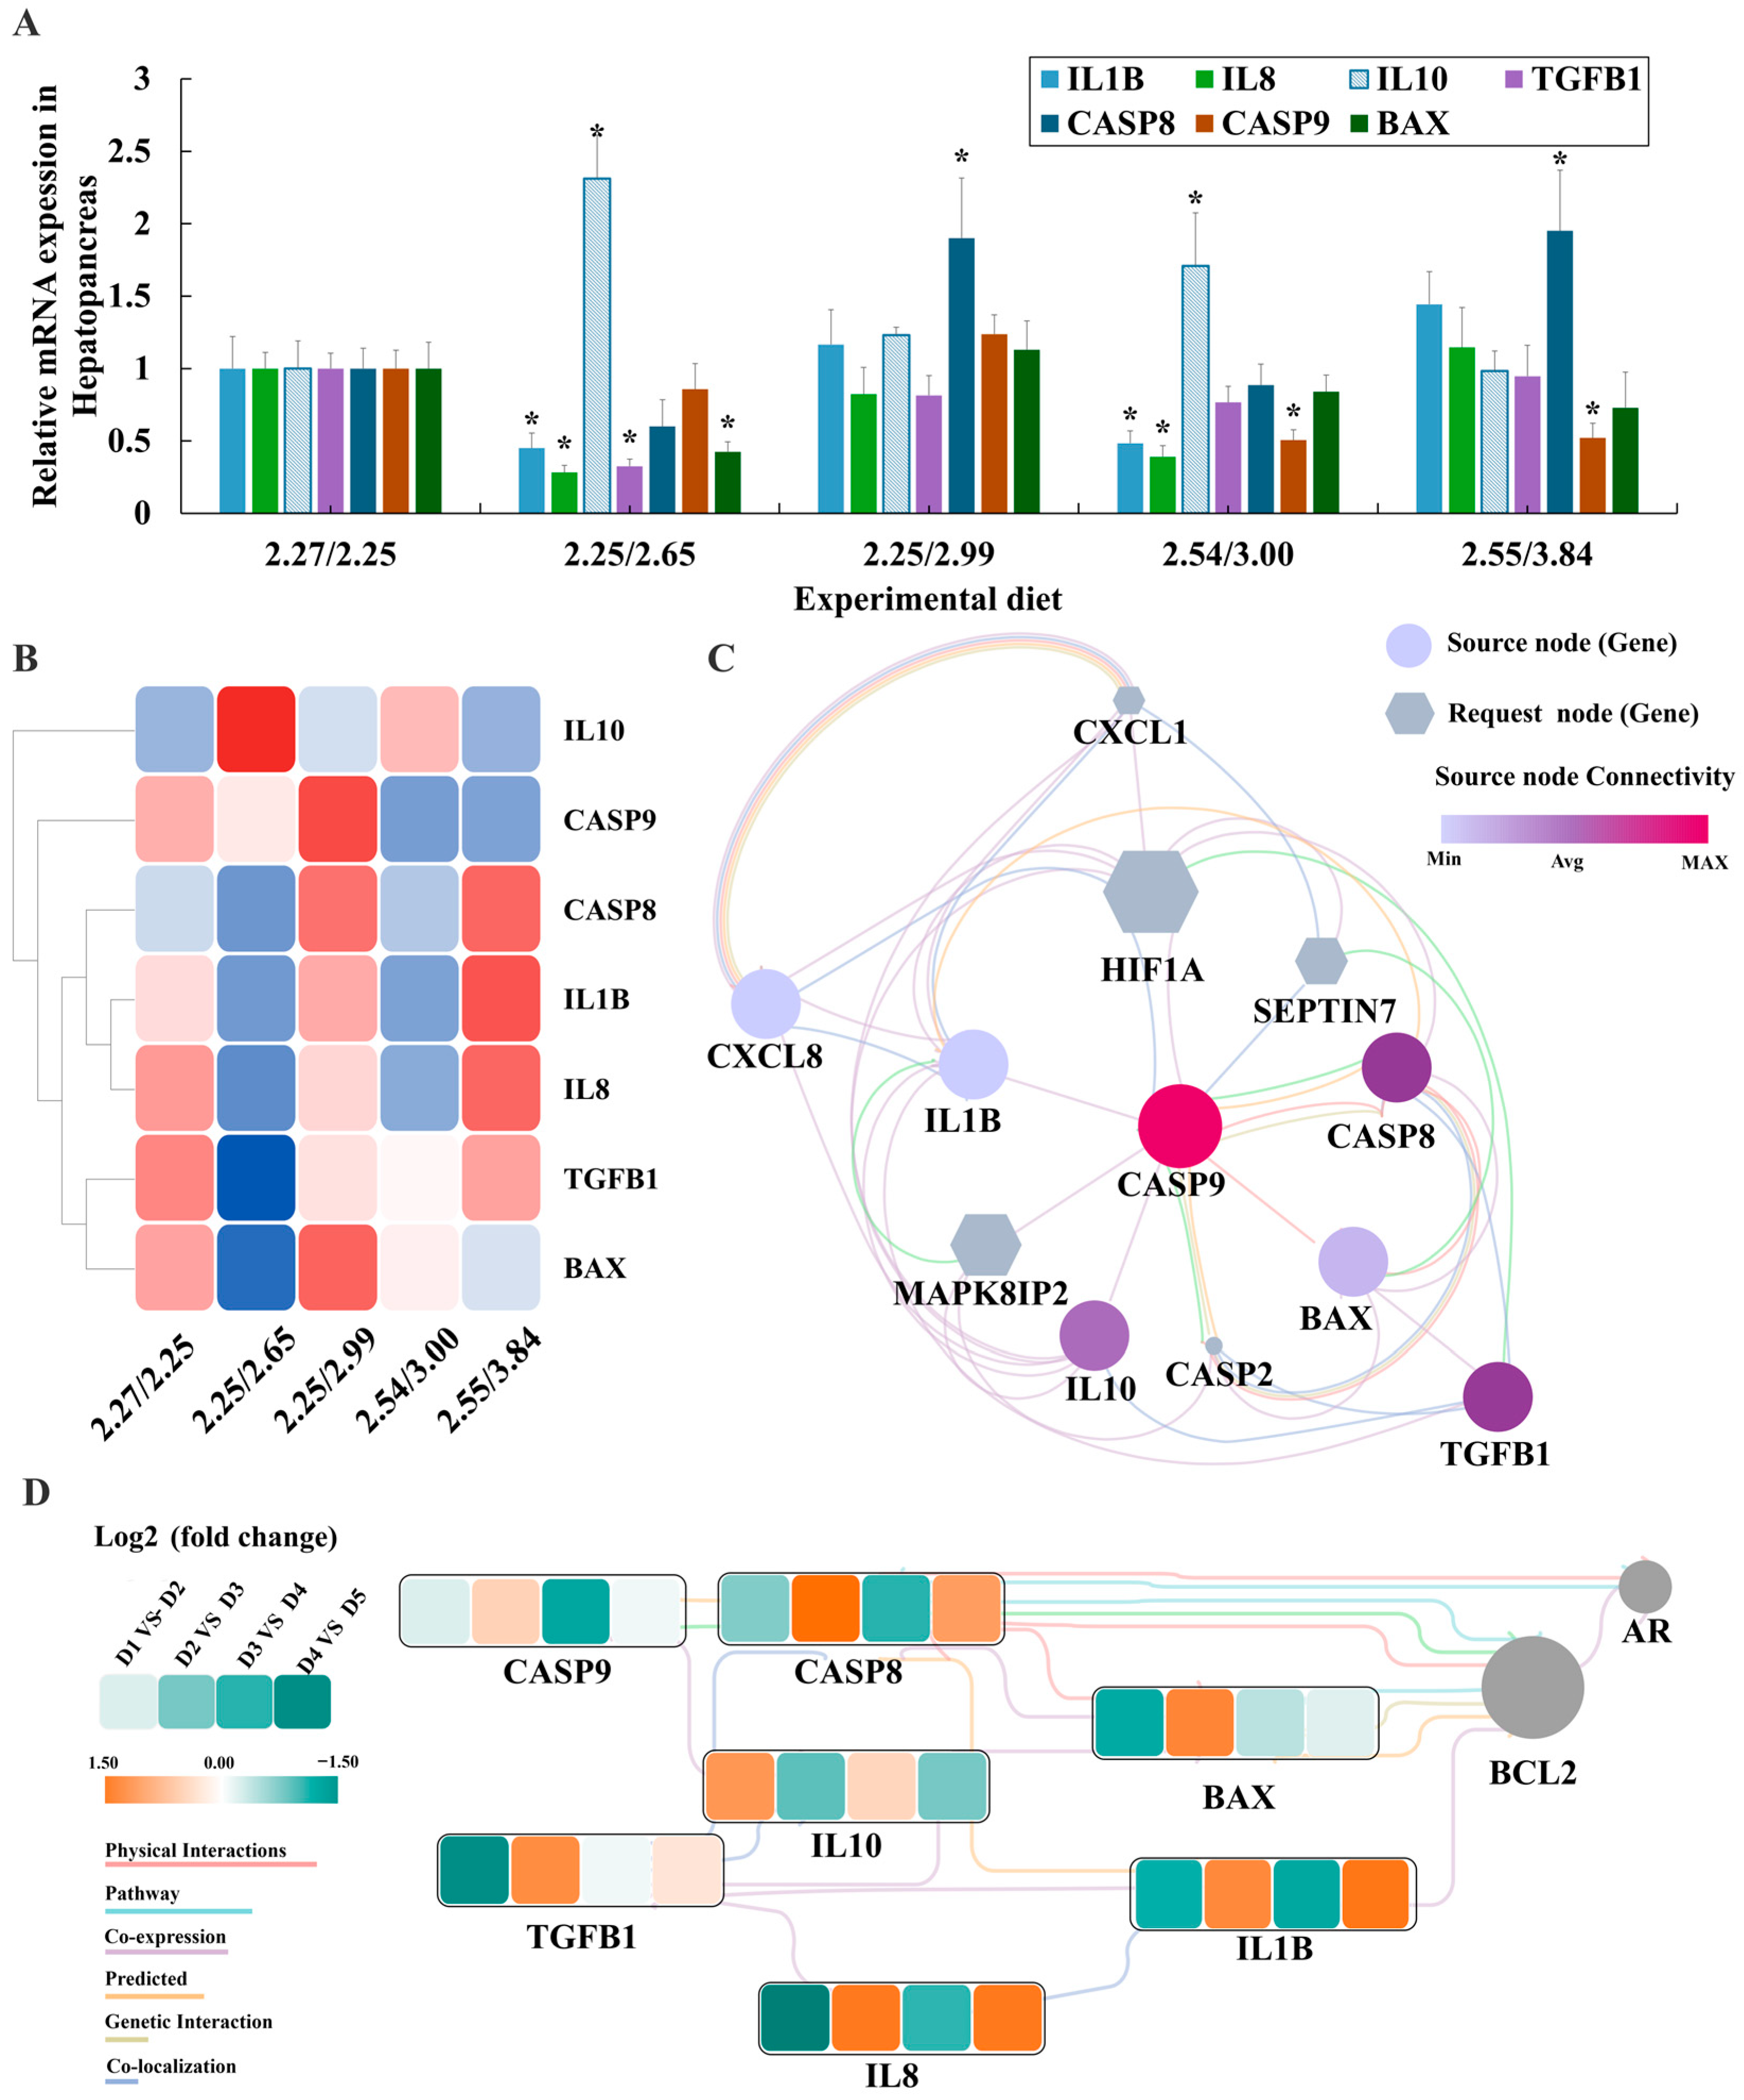
3.6. Serum and Liver Biochemical Indicators and Gene Expression Analysis

Serum biochemical analysis revealed that T-NOS, AST, and ALT enzyme activities were highest in the 2.25/2.99 group (Figure 1A–C). Liver analysis showed that arginase activity in the 2.25/2.99 group (D3) was significantly lower than in the control group, while the 2.55/3.84 group (D5) exhibited significantly higher arginase activity (Figure 1D). Antioxidant-related indicators indicated that MDA content in the 2.25/2.99 group (D3) was significantly higher than in the control group, but decreased with increased dietary arginine levels in the 2.54/3.00 and 2.55/3.84 groups (Figure 1E). Liver T-AOC and SOD enzyme activities in the 2.25/2.65 and 2.54/3.00 groups (D2 and D4) were significantly higher than in other groups (Figure 1F,G). GSH content and CAT activity peaked in the 2.25/2.65 and 2.54/3.00 groups, respectively (Figure 1H,I).
qPCR analysis of liver antioxidant genes revealed that SOD1, GST, HMOX1, and Nrf2 were significantly upregulated under optimal arginine/lysine ratios (D2 and D4 groups) compared to the control groups (D1). Meanwhile, gpx and CAT were upregulated in the D2 and D4 groups, respectively. Keap1 exhibited a downward trend in the D4 group. Key glutathione metabolism-related genes, including IDH1, GGCT, and GSS, were significantly upregulated in the D2 and D4 groups. PGD and GPX4 were upregulated in the D2 and D4 groups, respectively, while GGT1 showed no significant differences. CHAC was upregulated in the D4 and D5 groups, potentially due to its involvement in multiple amino acid metabolic pathways (Figure 1J; Supplementary Materials, Figure S1).
A molecular interaction network constructed using Cytoscape placed Keap1 and Nrf2 at the regulatory network’s starting point, controlling downstream genes such as GST, CAT, adh, HMOX1, SOD1, and gpx (Figure 2A). This highlights the critical role of the Keap1-Nrf2 pathway in regulating oxidative stress. Glutathione metabolism, crucial for the antioxidant system, was more active in the D2 group compared to the D1 group, with overall upregulated gene expression (Figure 2B). As the arginine/lysine ratio became imbalanced (D2 vs. D3), glutathione metabolism-related genes were downregulated, suppressing GSH synthesis and reducing antioxidant capacity.
The antioxidant system’s interaction with inflammatory responses was evident, as antioxidants inhibited pro-inflammatory gene expression. Under optimal arginine/lysine ratios (D2 and D4 groups), pro-inflammatory genes IL1B and IL8 were downregulated, while TGFB1, BAX, and CASP9 were suppressed. Conversely, the anti-inflammatory gene IL10 and apoptotic gene CASP8 were upregulated as ratios shifted from optimal (D2 and D4 groups) to imbalanced (D3 and D5 groups) (Figure 3A,B). A Cytoscape regulatory network identified CASP9 as the core gene, with CXCL1, HIF1A, SEPTIN7, MAPK8IP2, and CASP2 as related genes (Figure 3C). Standardized analysis showed that most inflammatory factors (CASP9, CASP8, IL1B, IL8, TGFB1, BAX) were downregulated under optimal ratios (D1 vs. D2; D3 vs. D4), except for IL10 (Figure 3D). CASP9’s central position in the interaction network underscores its regulatory importance, with BCL and AR identified as additional key inflammatory genes.

4. Discussion

After an 8-week feeding trial, dietary treatments significantly influenced the growth performance of juvenile largemouth bass. The arginine and lysine levels in the D2 group were identified as optimal for this species. The highest weight gain (WG) and specific growth rate (SGR) values were observed in the D2 group, significantly surpassing those in the D3 group. Under the optimal dietary arginine content (D2, 2.25%; Arg: Lys ratio 0.85), both lysine deficiency (D1, 2.25%; Arg: Lys ratio 1.01) and excess (D3, 2.99%; Arg: Lys ratio 0.75) resulted in reduced growth performance and feed utilization in juvenile largemouth bass. These results further underscore the importance of maintaining optimal dietary levels of both arginine and lysine to promote growth in largemouth bass. The optimal Arg: Lys ratio for growth performance was determined to be 0.85. Deviations from this ratio, either an increase to 1.01 (D1) or a decrease to 0.75 (D2), resulted in reduced growth performance. These findings emphasize the need for precise dietary formulation to ensure balanced amino acid provision for optimal growth in largemouth bass aquaculture. Similar effects of imbalanced amino acid diets on growth performance have been reported in other species, including grass carp (Ctenopharyngodon idella) [17,44], golden pompano (Trachinotus blochii) [45] and yellow catfish (Pelteobagrus vachelli) [46].
Fish growth primarily depends on protein deposition, and a continuous supply of amino acids is essential for protein synthesis, as protein turnover is necessary for both growth and tissue repair. In this study, the D1 group showed the highest dry feed intake (DFI), dry nitrogen intake (DNI), and lysine retention rate, but the lowest nitrogen retention (NR) and protein efficiency ratio (PER) values. These findings suggest that lysine deficiency limits the utilization of amino acids for protein synthesis, thereby impeding the growth of largemouth bass. In agreement with this, Berge et al. [47] reported that Atlantic salmon fed a lysine-deficient diet exhibited poor FCR and PER. Ammonia is a major metabolic byproduct of undigested or unabsorbed proteins or amino acids in fish, and elevated blood ammonia levels can lead to toxicity or even death [48]. Studies on rainbow trout (Salmo gairdneri) [49], Atlantic salmon [47], black seabream (Acanthopagrus schlegelii) [50], and striped catfish (Mystus nemurus Cuv. & Val.) [51] have shown that dietary amino acid imbalances increase blood ammonia levels. It is generally believed that an imbalance between dietary arginine and lysine reduces protein turnover efficiency in fish, leading to increased amino acid oxidation for energy and elevated blood ammonia levels [52].
However, in this study, juvenile largemouth bass did not exhibit increased blood ammonia levels under imbalanced dietary arginine and lysine conditions. This may be because glutamate, glutamine, and aspartate supply 60–70% of the energy for largemouth bass [53], making energy metabolism less sensitive to imbalanced amino acids. Consequently, blood ammonia levels in juvenile largemouth bass were insensitive to the imbalanced dietary arginine and lysine levels.
On the other hand, increasing dietary lysine levels from 2.65% (D2 group) to 2.99% (D3 group) significantly reduced the growth performance of largemouth bass. Similar results have been reported in Japanese flounder [30]. This decline in growth performance may be attributed to the toxicity of excessive amino acids, which can hinder the absorption and utilization of other amino acids. Additionally, it could be due to the antagonistic interaction between arginine and lysine, resulting in more energy being expended on amino acid excretion rather than growth. Nutritional interactions between dietary amino acids, particularly imbalances and antagonisms, affect the efficiency of amino acid utilization for protein synthesis and other metabolic processes. Amino acid imbalance and antagonism are distinct concepts: imbalance can be corrected by supplementing the limiting amino acid, while antagonism can only be alleviated by supplementing the antagonized amino acid [54,55]. Although the D4 diet contained the same high lysine level (3.00%) as the D3 group (2.25/2.99; Arg: Lys ratio 0.75), the arginine level was increased to 2.54% (2.54/3.00) to replicate the Arg: Lys ratio (0.85) found in the D2 group. Notably, although not statistically significant, the D4 group showed a certain degree of improvement in growth performance compared to the D3 group. These results indicate that when excess lysine reduces the Arg: Lys ratio to 0.75 (D3, 2.25/2.99), subsequent arginine supplementation to restore the optimal ratio of 0.85 (D4, 2.54/3.00) can ameliorate growth performance declines resulting from amino acid imbalance, thereby mitigating antagonism. Similarly, Kim et al. reported that rainbow trout require higher dietary arginine levels when lysine levels are elevated [56]. Zhou et al. also found that supplementing arginine could reverse the negative effects of excess lysine on growth performance, feed efficiency, and liver arginase activity in black seabream [50]. Thus, increasing dietary arginine levels can partially mitigate the adverse effects of excessive dietary lysine, suggesting an antagonistic interaction between arginine and lysine in largemouth bass. Furthermore, juvenile largemouth bass fed the D5 diet (lysine 3.84%) did not show further improvement in growth performance. This may be due to increased deamination, leading to the excretion of excess lysine as ammonia, urea, or trimethylamine, resulting in amino acid wastage. Similar results were observed in olive flounder by Alam et al. [30]. In terrestrial animals, both arginine and lysine are basic amino acids that share the same transport mechanism, resulting in competition for transporters [27,28]. Excess lysine reduces the intracellular availability of arginine [29]. Iaccarino et al. [57] suggested that similar competition occurs in fish. Therefore, it is speculated that the antagonistic interaction between arginine and lysine in largemouth bass may also be influenced by transporter competition, although the exact mechanisms warrant further investigation. Specifically, the antagonistic effect between arginine and lysine should be evaluated comprehensively, taking into account feed intake, growth indices, digestion and absorption rates, and arginine metabolism parameters.
Free amino acids are critical for nutrient sensing and metabolic responses, with their concentrations influenced by dietary amino acid imbalances. In this study, serum lysine levels were strongly correlated with dietary lysine levels, increasing with dietary lysine content except in the D4 group. Although the difference was not statistically significant, serum lysine levels in the D4 group were substantially lower than those in the D3 group (147.26 vs. 90.35), suggesting that excess dietary arginine inhibits lysine deposition in largemouth bass. Consistent with this, Berge et al. [58] reported that excessive dietary arginine reduces plasma lysine levels in Atlantic salmon. Although the arginine content in the D4 and D5 group diets was significantly higher than in the first three groups, arginine retention rates in the D4 and D5 groups were considerably lower than in the D2 group, indicating that excess dietary arginine does not promote anabolic processes. Berge et al. [58] also noted that lysine can either stimulate or inhibit arginine absorption, depending on their relative concentrations. In this study, when dietary arginine was fixed at 2.25%, increasing dietary lysine significantly elevated serum arginine levels in juvenile largemouth bass. Additionally, increasing dietary lysine from 2.65% (D2 group) to 2.99% (D3 group) significantly raised serum citrulline levels. Previous studies on black seabream and zebrafish have shown that high dietary lysine levels inhibit arginase activity, reducing arginine metabolism efficiency. Similarly, in this study, increasing dietary lysine (2.99%) significantly reduced liver arginase activity in juvenile largemouth bass. Furthermore, T-NOS activity in the D3 group was significantly higher than in other groups. Since NOS and arginase compete for arginine in cellular metabolism [28], their relative activities determine arginine metabolite levels. These findings suggest that elevated dietary lysine decreases liver arginase activity, increases T-NOS activity, and elevates serum citrulline levels. Although not statistically significant, serum ornithine levels tended to increase with dietary lysine at both arginine levels. Berge et al. [47] also reported that increasing dietary lysine to 1.80% significantly elevated serum arginine and ornithine levels in Atlantic salmon. This may result from high lysine levels increasing T-NOS activity, promoting arginine metabolism into citrulline, and ultimately raising circulating ornithine due to enhanced arginase activity in largemouth bass. However, the effects of lysine on arginase activity vary among fish species. For example, increasing dietary lysine enhances tissue arginase activity in olive flounder [30], while no such effect was observed in yellow catfish (Pelteobagrus fulvidraco) [46].
ALT and AST are crucial aminotransferases present in the mitochondria of animal cells. These enzymes catalyze the transfer of amino groups from amino acids to α-keto acids and are released into the bloodstream following liver cell damage or injury [59]. In this study, serum ALT levels in the D3 group showed an upward trend compared to the other groups and were significantly higher than those in the D4 group. Serum AST levels also reached the highest value in the D3 group. Similar findings have been reported in black seabream [50] and blunt snout bream [60], where increasing dietary lysine levels under optimal arginine conditions led to elevated blood AST and ALT activities. These results suggest that an imbalance in dietary amino acids may disrupt amino acid metabolism in the liver, thereby impairing liver function. Fish antioxidant capacity, essential for self-defense and immune function, involves both enzymatic and non-enzymatic activities. MDA, a lipid peroxidation product, serves as a marker of oxidative damage [61]. T-AOC is a widely used measure of overall antioxidant activity, while SOD, CAT, and GSH are key antioxidant enzymes that form the primary defense against oxidative stress [62,63]. In this study, liver MDA levels in the D2 group were significantly lower than those in the D3 group. In contrast, T-AOC, SOD, GSH, and CAT activities in the D2 group were significantly higher than in the D1 and D3 groups. These findings indicate that lysine deficiency or excess compromises the antioxidant capacity of largemouth bass. Notably, T-AOC, SOD, and GSH activities in the D4 group (2.54/3.00) were significantly higher than in the D3 group (2.25/2.99), demonstrating that arginine supplementation mitigates oxidative damage induced by excessive lysine.
The Keap1-Nrf2 signaling pathway is critical for cellular antioxidant defense, regulating the expression and activity of antioxidant enzyme-dependent genes [64]. Glutathione, an endogenous antioxidant, plays a key role in preventing oxidative stress, scavenging free radicals, and reducing biological damage [65]. The Keap1-Nrf2 pathway controls genes involved in GSH synthesis and metabolism, such as GS, GCL, GST, and GPx, influencing de novo GSH synthesis and redox balance [66,67]. Additionally, Nrf2 promotes the transcription and translation of antioxidant genes, including SOD, CAT, HMOX1, and NQO1, which regulate cellular oxidative stress defense mechanisms [68,69,70]. Thus, activation of the Keap1-Nrf2 pathway is essential for enhancing GSH synthesis and the endogenous antioxidant response. In this study, NRF2, SOD1, GST, and HMOX1 were significantly upregulated in the D2 and D4 groups under optimal arginine/lysine ratios, indicating that these ratios activate the Keap1-Nrf2 pathway to mitigate oxidative damage caused by excessive lysine. Furthermore, key glutathione metabolism genes were significantly upregulated in the D2 and D4 groups. Given the pivotal role of the Keap1-Nrf2 pathway in GSH homeostasis, it is hypothesized that this pathway activates GSH-dependent antioxidant systems to alleviate oxidative damage. The constructed glutathione metabolism regulatory network showed pathway suppression under imbalanced arginine/lysine ratios but upregulation under optimal conditions. Previous studies suggest that arginine mitigates oxidative stress and enhances immune function [10,71,72,73]. As a substrate for glutamate synthesis [74,75,76], arginine likely supports endogenous GSH synthesis [77]. Therefore, optimal arginine levels may exert antioxidant effects by modulating glutathione metabolism, though further targeted metabolic data are required for confirmation.
Excessive or deficient lysine impairs fish growth performance, increases oxidative stress damage [15], and exacerbates inflammatory responses [16]. Our analysis of key pro-inflammatory factors and the construction of a molecular regulatory network demonstrated that, under optimal arginine/lysine ratios (D2 and D4 groups), pro-inflammatory genes (IL1B, IL8, TGFB1, BAX) and apoptosis-related genes (CASP9, CASP8) were downregulated, while inflammatory factors increased as the arginine/lysine ratio shifted from optimal to imbalanced. In fish, the antioxidant system is closely linked to inflammatory responses [5], and antioxidants and antioxidant enzymes can suppress the expression of inflammatory genes, thereby maintaining health. Considering the observed activation of antioxidant genes and the glutathione metabolism pathway at the optimal arginine level in this study, we hypothesize that the optimal Arg: Lys ratio 0.85 may enhance the endogenous antioxidant system by activating glutathione metabolism, thus alleviating inflammatory responses. This further suggests that arginine supplementation may mitigate oxidative damage and inflammatory responses induced by lysine excess.
Although our findings indicate that an arginine-to-lysine ratio of 0.85 (2.54% arginine and 3.00% lysine) optimizes growth performance, antioxidant capacity, and immune responses in juvenile largemouth bass, certain limitations should be acknowledged. The eight-week experimental period may be insufficient to fully assess long-term physiological or metabolic adaptations; future studies with extended durations would help evaluate long-term impacts and nutritional adaptation mechanisms. Furthermore, regarding the antagonistic interaction between arginine and lysine, further assessment of arginine and lysine digestibility or amino acid transporter gene expression could strengthen our conclusions. While this study evaluated immunomodulation by focusing on immune and antioxidant marker expression, advanced techniques such as transcriptomics or proteomics could provide a more comprehensive understanding of immune regulation. Environmental factors (e.g., temperature, hypoxia) are also critical influences on animal nutritional regulation; future studies incorporating environmental stressors encountered in practical aquaculture could provide a more comprehensive and in-depth understanding, thereby enhancing the practical applicability of effective aquaculture feed formulations.

5. Conclusions

In conclusion, juvenile largemouth bass fed diets with 2.25% arginine and 2.65% lysine (Arg: Lys ratio 0.85) exhibited optimal growth performance. Imbalanced arginine/lysine ratios negatively affected growth, serum amino acid composition, antioxidant capacity, and immune responses. However, arginine supplementation partially mitigated the adverse effects of excessive lysine. Based on growth performance, serum amino acid composition, liver arginase activity, antioxidant enzyme activity, and inflammatory factor indicators, an antagonistic interaction between arginine and lysine was identified in juvenile largemouth bass. Furthermore, considering the activation of the antioxidant system and glutathione metabolism pathway, it is hypothesized that an optimal Arg: Lys ratio 0.85 may enhance the endogenous antioxidant system by activating glutathione metabolism, thus alleviating inflammatory responses. Increasing dietary arginine levels alleviated this antagonism when lysine was excessive, thereby mitigating oxidative damage and inflammatory responses induced by lysine excess.

Supplementary Materials

The following supporting information can be downloaded at: https://www.mdpi.com/article/10.3390/ani15131947/s1, Figure S1: The expression levels of genes related to the Keap1-Nrf2 pathway (A), antioxidant mechanisms (A), and glutathione metabolism (B) in the livers of juvenile black bass were analyzed under varying ratios of arginine to lysine. Table S1: Primers used in this study.

Author Contributions

Y.S.: Investigation, Methodology, Formal analysis, Software, Writing—original draft. S.Z.: Methodology, Formal analysis, Writing—original draft. X.L.: Software, Validation, Visualization, Writing—review and editing. T.L.: Methodology, Formal analysis. J.H.: Investigation, Formal analysis. J.W.: Conceptualization, Formal analysis, Methodology, Software, Writing—review and editing. T.H.: Funding acquisition, Resources, Project administration, Writing—review and editing. All authors have read and agreed to the published version of the manuscript.

Funding

This research was funded by the Ten-thousand Talents Plan of Zhejiang Province (No. 2022R52021), Major Scientific and Technological Research Projects of Zhoushan (2023C13017), Zhejiang Province “three agricultural six-party” Science and Technology Collaboration Program (2024SNJF059), “Pioneer” and “Leading Goose” R&D Program of Zhejiang (No. 2022C04020), National Natural Science Foundation of China (32273151).

Institutional Review Board Statement

All experiments involving fish in this study were meticulously conducted in accordance with the Management Rule of Laboratory Animals (Chinese Order No. 676 of the State Council, revised on 1 March 2017). All animal care and handling procedures performed in the present study were approved by Animal Experimental Ethical Inspection, Institutional Animals Care and Use Committee of Zhejiang Ocean University (Approval number 2025054, approval date 28 April 2025).

Informed Consent Statement

Not applicable.

Data Availability Statement

The data presented in this study are available upon request from the corresponding author.

Conflicts of Interest

The authors declare no conflicts of interest.

References

  1. Li, P.; Yin, Y.-L.; Li, D.; Kim, S.W.; Wu, G. Amino acids and immune function. Br. J. Nutr. 2007, 98, 237–252. [Google Scholar] [CrossRef] [PubMed]
  2. Jiang, W.-D.; Deng, Y.-P.; Liu, Y.; Qu, B.; Jiang, J.; Kuang, S.-Y.; Tang, L.; Tang, W.-N.; Wu, P.; Zhang, Y.-A. Dietary leucine regulates the intestinal immune status, immune-related signalling molecules and tight junction transcript abundance in grass carp (Ctenopharyngodon idella). Aquaculture 2015, 444, 134–142. [Google Scholar] [CrossRef]
  3. Jiang, W.-D.; Wen, H.-L.; Liu, Y.; Jiang, J.; Kuang, S.-Y.; Wu, P.; Zhao, J.; Tang, L.; Tang, W.-N.; Zhang, Y.-A. The tight junction protein transcript abundance changes and oxidative damage by tryptophan deficiency or excess are related to the modulation of the signalling molecules, NF-κB p65, TOR, caspase-(3, 8, 9) and Nrf2 mRNA levels, in the gill of young grass carp (Ctenopharyngodon idellus). Fish Shellfish Immunol. 2015, 46, 168–180. [Google Scholar] [PubMed]
  4. Luo, J.-B.; Feng, L.; Jiang, W.-D.; Liu, Y.; Wu, P.; Jiang, J.; Kuang, S.-Y.; Tang, L.; Zhang, Y.-A.; Zhou, X.-Q. The impaired intestinal mucosal immune system by valine deficiency for young grass carp (Ctenopharyngodon idella) is associated with decreasing immune status and regulating tight junction proteins transcript abundance in the intestine. Fish Shellfish Immunol. 2014, 40, 197–207. [Google Scholar] [CrossRef]
  5. Zheng, L.; Feng, L.; Jiang, W.-D.; Wu, P.; Tang, L.; Kuang, S.-Y.; Zeng, Y.-Y.; Zhou, X.-Q.; Liu, Y. Selenium deficiency impaired immune function of the immune organs in young grass carp (Ctenopharyngodon idella). Fish Shellfish Immunol. 2018, 77, 53–70. [Google Scholar] [CrossRef]
  6. Liu, H.-X.; Zhou, X.-Q.; Jiang, W.-D.; Wu, P.; Liu, Y.; Zeng, Y.-Y.; Jiang, J.; Kuang, S.-Y.; Tang, L.; Feng, L. Optimal α-lipoic acid strengthen immunity of young grass carp (Ctenopharyngodon idella) by enhancing immune function of head kidney, spleen and skin. Fish Shellfish Immunol. 2018, 80, 600–617. [Google Scholar] [CrossRef]
  7. Li, X.; Zheng, S.; Wu, G. Nutrition and functions of amino acids in fish. In Amino Acids in Nutrition and Health: Amino Acids in the Nutrition of Companion, Zoo and Farm Animals; Springer Nature: Berlin/Heidelberg, Germany, 2021; pp. 133–168. [Google Scholar]
  8. Herring, C.M.; Bazer, F.W.; Wu, G. Amino acid nutrition for optimum growth, development, reproduction, and health of zoo animals. In Amino Acids in Nutrition and Health: Amino Acids in the Nutrition of Companion, Zoo and Farm Animals; Springer Nature: Berlin/Heidelberg, Germany, 2021; pp. 233–253. [Google Scholar]
  9. Evoy, D.; Lieberman, M.D.; Fahey, T.J., III; Daly, J.M. Immunonutrition: The role of arginine. Nutrition 1998, 14, 611–617. [Google Scholar] [CrossRef]
  10. Wu, G.; Bazer, F.W.; Davis, T.A.; Kim, S.W.; Li, P.; Marc Rhoads, J.; Carey Satterfield, M.; Smith, S.B.; Spencer, T.E.; Yin, Y. Arginine metabolism and nutrition in growth, health and disease. Amino Acids 2009, 37, 153–168. [Google Scholar] [CrossRef]
  11. Eddy, F.; Tibbs, P. Effects of nitric oxide synthase inhibitors and a substrate, L-arginine, on the cardiac function of juvenile salmonid fish. Comp. Biochem. Physiol. Part C Toxicol. Pharmacol. 2003, 135, 137–144. [Google Scholar] [CrossRef]
  12. Council, N.R. Nutrient Requirements of Fish and Shrimp; National Academies Press: Washington, DC, USA, 2011. [Google Scholar]
  13. Wu, G. Amino Acids: Biochemistry and Nutrition; CRC Press: Boca Raton, FL, USA, 2021. [Google Scholar]
  14. Tanphaichitr, V.; Horne, D.W.; Broquist, H.P. Lysine, a precursor of carnitine in the rat. J. Biol. Chem. 1971, 246, 6364–6366. [Google Scholar] [CrossRef]
  15. Li, X.-Y.; Liu, Y.; Jiang, W.-D.; Jiang, J.; Wu, P.; Zhao, J.; Kuang, S.-Y.; Tang, L.; Tang, W.-N.; Zhang, Y.-A. Co-and post-treatment with lysine protects primary fish enterocytes against Cu-induced oxidative damage. PLoS ONE 2016, 11, e0147408. [Google Scholar] [CrossRef] [PubMed]
  16. Hu, Y.; Feng, L.; Jiang, W.; Wu, P.; Liu, Y.; Kuang, S.; Tang, L.; Zhou, X. Lysine deficiency impaired growth performance and immune response and aggravated inflammatory response of the skin, spleen and head kidney in grown-up grass carp (Ctenopharyngodon idella). Anim. Nutr. 2021, 7, 556–568. [Google Scholar] [CrossRef]
  17. Li, X.-Y.; Tang, L.; Hu, K.; Liu, Y.; Jiang, W.-D.; Jiang, J.; Wu, P.; Chen, G.-F.; Li, S.-H.; Kuang, S.-Y. Effect of dietary lysine on growth, intestinal enzymes activities and antioxidant status of sub-adult grass carp (Ctenopharyngodon idella). Fish Physiol. Biochem. 2014, 40, 659–671. [Google Scholar] [CrossRef] [PubMed]
  18. Forster, I.; Ogata, H.Y. Lysine requirement of juvenile Japanese flounder Paralichthys olivaceus and juvenile red sea bream Pagrus major. Aquaculture 1998, 161, 131–142. [Google Scholar] [CrossRef]
  19. Ketola, H.G. Requirement for dietary lysine and arginine by fry of rainbow trout. J. Anim. Sci. 1983, 56, 101–107. [Google Scholar] [CrossRef] [PubMed]
  20. Gu, D.; Zhao, J.; Limbu, S.M.; Liang, Y.; Deng, J.; Bi, B.; Kong, L.; Yan, H.; Wang, X.; Hu, Q. Arginine supplementation in plant-rich diets affects growth, feed utilization, body composition, blood biochemical indices and gene expressions of the target of rapamycin signaling pathway in juvenile Asian red-tailed catfish (Hemibagrus wyckoiides). J. World Aquac. Soc. 2022, 53, 133–150. [Google Scholar] [CrossRef]
  21. Chen, G.; Feng, L.; Kuang, S.; Liu, Y.; Jiang, J.; Hu, K.; Jiang, W.; Li, S.; Tang, L.; Zhou, X. Effect of dietary arginine on growth, intestinal enzyme activities and gene expression in muscle, hepatopancreas and intestine of juvenile Jian carp (Cyprinus carpio var. Jian). Br. J. Nutr. 2012, 108, 195–207. [Google Scholar] [CrossRef]
  22. Lee, S.; Small, B.C.; Patro, B.; Overturf, K.; Hardy, R.W. The dietary lysine requirement for optimum protein retention differs with rainbow trout (Oncorhynchus mykiss Walbaum) strain. Aquaculture 2020, 514, 734483. [Google Scholar] [CrossRef]
  23. Zehra, S.; Khan, M.A. Dietary arginine requirement of fingerling Indian major carp, Catla catla (Hamilton). J. World Aquac. Soc. 2013, 44, 363–373. [Google Scholar] [CrossRef]
  24. Borlongan, I.G.; Coloso, R.M. Requirements of juvenile milkfish (Chanos chanos Forsskal) for essential amino acids. J. Nutr. 1993, 123, 125–132. [Google Scholar] [CrossRef]
  25. Zhou, Q.-C.; Zeng, W.-P.; Wang, H.-L.; Xie, F.-J.; Zheng, C.-Q. Dietary arginine requirement of juvenile yellow grouper Epinephelus awoara. Aquaculture 2012, 350, 175–182. [Google Scholar] [CrossRef]
  26. Walton, M. Aspects of amino acid metabolism in teleost fish. In Nutrition and Feeding in Fish; Academic Press: London, UK, 1985; pp. 47–67. [Google Scholar]
  27. Cynober, L.; Le Boucher, J.; Vasson, M.-P. Arginine metabolism in mammals. J. Nutr. Biochem. 1995, 6, 402–413. [Google Scholar] [CrossRef]
  28. Rath, M.; Müller, I.; Kropf, P.; Closs, E.I.; Munder, M. Metabolism via arginase or nitric oxide synthase: Two competing arginine pathways in macrophages. Front. Immunol. 2014, 5, 532. [Google Scholar] [CrossRef] [PubMed]
  29. Wu, G.; Meininger, C.J. Regulation of nitric oxide synthesis by dietary factors. Annu. Rev. Nutr. 2002, 22, 61–86. [Google Scholar] [CrossRef]
  30. Alam, S.; Teshima, S.-I.; Ishikawa, M.; Koshio, S. Effects of dietary arginine and lysine levels on growth performance and biochemical parameters of juvenile Japanese flounder Paralichthys olivaceus. Fish. Sci. 2002, 68, 509–516. [Google Scholar] [CrossRef]
  31. Shen, Y.; Qiu, Q.; Sun, L.; Yang, J.; Chen, Y.; Jin, L. Effects of dietary Arg/Lys ratios on digestive enzyme activity and apparent digestibility in all-male yellow catfish. Fish. Sci. 2018, 37, 152–158. [Google Scholar]
  32. Dong, X.; Wu, J.; Shen, Y.; Chen, J.; Miao, S.; Zhang, X.; Sun, L. Effects of different arginine/lysine level on growth performance, body composition and digestive enzyme activity of Macrobrachium rosenbergii. Aquac. Nutr. 2018, 24, 1101–1111. [Google Scholar] [CrossRef]
  33. Berge, G.; Sveier, H.; Lied, E. Effects of feeding Atlantic salmon (Salmo salar L.) imbalanced levels of lysine and arginine. Aquac. Nutr. 2002, 8, 239–248. [Google Scholar] [CrossRef]
  34. Huang, D.; Wu, Y.; Lin, Y.; Chen, J.; Karrow, N.; Ren, X.; Wang, Y. Dietary protein and lipid requirements for juvenile largemouth bass, Micropterus salmoides. J. World Aquac. Soc. 2017, 48, 782–790. [Google Scholar] [CrossRef]
  35. Coyle, S.D.; Tidwell, J.H.; Webster, C.D. Response of largemouth bass Micropterus salmoides to dietary supplementation of lysine, methionine, and highly unsaturated fatty acids. J. World Aquac. Soc. 2000, 31, 89–95. [Google Scholar] [CrossRef]
  36. Liang, H.; Xu, P.; Xu, G.; Zhang, L.; Huang, D.; Ren, M.; Zhang, L. Histidine deficiency inhibits intestinal antioxidant capacity and induces intestinal endoplasmic-reticulum stress, inflammatory response, apoptosis, and necroptosis in Largemouth Bass (Micropterus salmoides). Antioxidants 2022, 11, 2399. [Google Scholar] [CrossRef]
  37. Bright, L.A.; Coyle, S.D.; Tidwell, J.H. Effect of dietary lipid level and protein energy ratio on growth and body composition of largemouth bass Micropterus salmoides. J. World Aquac. Soc. 2005, 36, 129–134. [Google Scholar] [CrossRef]
  38. Zhou, H.; Chen, N.; Qiu, X.; Zhao, M.; Jin, L. Arginine requirement and effect of arginine intake on immunity in largemouth bass, Micropterus salmoides. Aquac. Nutr. 2012, 18, 107–116. [Google Scholar] [CrossRef]
  39. Dairiki, J.K.; Dias, C.T.d.S.; Cyrino, J.E.P. Lysine requirements of largemouth bass, Micropterus salmoides: A comparison of methods of analysis of dose-response trials data. J. Appl. Aquac. 2007, 19, 1–27. [Google Scholar] [CrossRef]
  40. AOAC International. Official Methods of Analysis of AOAC International; AOAC International: Gaithersburg, MD, USA, 2000; Volume 17. [Google Scholar]
  41. Meng, J.; Yan, L.; Li, M.; Yue, X. Effect of matrine on inflammatory response and activity of arginase and adenosine nucleotide hydrolase in plateletsin rats with carrageenan-induced arthritis. Acta Chin. Med. 2021, 36, 7. [Google Scholar]
  42. Matsushita, K. Automatic precolumn derivatization of amino acids and analysis by fast LC using the Agilent 1290 Infinity LC system. Agil. Tech. Note 2010, 5990, 1–4. [Google Scholar]
  43. Chomczynski, P.; Sacchi, N. The single-step method of RNA isolation by acid guanidinium thiocyanate–phenol–chloroform extraction: Twenty-something years on. Nat. Protoc. 2006, 1, 581–585. [Google Scholar] [CrossRef]
  44. Wang, S.; Liu, Y.-J.; Tian, L.-X.; Xie, M.-Q.; Yang, H.-J.; Wang, Y.; Liang, G.-Y. Quantitative dietary lysine requirement of juvenile grass carp Ctenopharyngodon idella. Aquaculture 2005, 249, 419–429. [Google Scholar] [CrossRef]
  45. Ebeneezar, S.; Vijayagopal, P.; Srivastava, P.; Gupta, S.; Varghese, T.; Prabu, D.L.; Chandrasekar, S.; Varghese, E.; Sayooj, P.; Tejpal, C. Dietary lysine requirement of juvenile Silver pompano, Trachinotus blochii (Lacepede, 1801). Aquaculture 2019, 511, 734234. [Google Scholar] [CrossRef]
  46. Feng, F.F.; Ai, Q.; Xu, W.; Mai, K.; Zhang, W. Effects of dietary arginine and lysine on growth and non-specific immune responses of juvenile darkbarbel catfish (Pelteobagrus vachelli). J. Fish. China 2011, 35, 1072–1080. [Google Scholar] [CrossRef]
  47. Berge, G.E.; Sveier, H.; Lied, E. Nutrition of Atlantic salmon (Salmo salar); the requirement and metabolic effect of lysine. Comp. Biochem. Physiol. Part A Mol. Integr. Physiol. 1998, 120, 477–485. [Google Scholar] [CrossRef]
  48. Sashaw, J.; Nawata, M.; Thompson, S.; Wood, C.M.; Wright, P.A. Rhesus glycoprotein and urea transporter genes in rainbow trout embryos are upregulated in response to alkaline water (pH 9.7) but not elevated water ammonia. Aquat. Toxicol. 2010, 96, 308–313. [Google Scholar] [CrossRef]
  49. Barash, H. The influence of the lysine level in the diet on nitrogen excretion and on the concentration of ammonia and free amino acids in the plasma of rainbow trout (Salmo gairdneri). Nutr. Rep. Int. 1984, 29, 283–289. [Google Scholar]
  50. Zhou, F.; Shao, Q.-j.; Xiao, J.-x.; Peng, X.; Ngandzali, B.-O.; Sun, Z.; Ng, W.-K. Effects of dietary arginine and lysine levels on growth performance, nutrient utilization and tissue biochemical profile of black sea bream, Acanthopagrus schlegelii, fingerlings. Aquaculture 2011, 319, 72–80. [Google Scholar] [CrossRef]
  51. Tantikitti, C.; Chimsung, N. Dietary lysine requirement of freshwater catfish (Mystus nemurus Cuv. & Val.). Aquac. Res. 2001, 32, 135–141. [Google Scholar]
  52. Zhou, F. Study on Effects of Dietary Lysine and Arginine on Growth Performance, and the Arginine/Lysine Antagonism Mechanism in Juvenile Black Sea bream, Acanthopagrus schlegelii. Ph.D. Thesis, Zhejiang University, Hangzhou, China, 2011; pp. 62–68. [Google Scholar]
  53. Li, X.; Zheng, S.; Jia, S.; Song, F.; Zhou, C.; Wu, G. Oxidation of energy substrates in tissues of largemouth bass (Micropterus salmoides). Amino Acids 2020, 52, 1017–1032. [Google Scholar] [CrossRef]
  54. Harper, A.; Benevenga, N.; Wohlhueter, R. Effects of ingestion of disproportionate amounts of amino acids. Physiol. Rev. 1970, 50, 428–558. [Google Scholar] [CrossRef]
  55. Fico, M.E.; Hassan, A.S.; Milner, J.A. The influence of excess lysine on urea cycle operation and pyrimidine biosynthesis. J. Nutr. 1982, 112, 1854–1861. [Google Scholar] [CrossRef]
  56. Kim, K.-I.; Kayes, T.B.; Amundson, C.H. Requirements for lysine and arginine by rainbow trout (Oncorhynchus mykiss). Aquaculture 1992, 106, 333–344. [Google Scholar] [CrossRef]
  57. Iaccarino, D.; Uliano, E.; Agnisola, C. Effects of arginine and/or lysine diet supplementation on nitrogen excretion in zebrafish. Comp. Biochem. Physiol. Part A Mol. Integr. Physiol. 2009, 154, S36. [Google Scholar] [CrossRef]
  58. Berge, G.E.; Bakke-McKellep, A.M.; Lied, E. In vitro uptake and interaction between arginine and lysine in the intestine of Atlantic salmon (Salmo salar). Aquaculture 1999, 179, 181–193. [Google Scholar] [CrossRef]
  59. Zhou, Q.; Jin, M.; Elmada, Z.C.; Liang, X.; Mai, K. Growth, immune response and resistance to Aeromonas hydrophila of juvenile yellow catfish, Pelteobagrus fulvidraco, fed diets with different arginine levels. Aquaculture 2015, 437, 84–91. [Google Scholar] [CrossRef]
  60. Liao, Y.; Liu, B.; Ren, M.; Cui, H.; Xie, J.; Ge, X. Effects of lysine on growth, physiological and biochemical indexes of blood and essential amino acids of serum in juvenile blunt snout bream (Megalobrama amblycephala). J. Fish. China 2013, 37, 1716–1724. [Google Scholar] [CrossRef]
  61. Jiang, W.-D.; Wen, H.-L.; Liu, Y.; Jiang, J.; Wu, P.; Zhao, J.; Kuang, S.-Y.; Tang, L.; Tang, W.-N.; Zhang, Y.-A. Enhanced muscle nutrient content and flesh quality, resulting from tryptophan, is associated with anti-oxidative damage referred to the Nrf2 and TOR signalling factors in young grass carp (Ctenopharyngodon idella): Avoid tryptophan deficiency or excess. Food Chem. 2016, 199, 210–219. [Google Scholar] [CrossRef] [PubMed]
  62. Deng, J.; Kang, B.; Tao, L.; Rong, H.; Zhang, X. Effects of dietary cholesterol on antioxidant capacity, non-specific immune response, and resistance to Aeromonas hydrophila in rainbow trout (Oncorhynchus mykiss) fed soybean meal-based diets. Fish Shellfish Immunol. 2013, 34, 324–331. [Google Scholar] [CrossRef]
  63. Tovar-Ramírez, D.; Mazurais, D.; Gatesoupe, J.; Quazuguel, P.; Cahu, C.; Zambonino-Infante, J. Dietary probiotic live yeast modulates antioxidant enzyme activities and gene expression of sea bass (Dicentrarchus labrax) larvae. Aquaculture 2010, 300, 142–147. [Google Scholar] [CrossRef]
  64. Mourente, G.; Dıaz-Salvago, E.; Bell, J.G.; Tocher, D.R. Increased activities of hepatic antioxidant defence enzymes in juvenile gilthead sea bream (Sparus aurata L.) fed dietary oxidised oil: Attenuation by dietary vitamin E. Aquaculture 2002, 214, 343–361. [Google Scholar] [CrossRef]
  65. Matthaiou, C.M.; Goutzourelas, N.; Stagos, D.; Sarafoglou, E.; Jamurtas, A.; Koulocheri, S.D.; Haroutounian, S.A.; Tsatsakis, A.M.; Kouretas, D. Pomegranate juice consumption increases GSH levels and reduces lipid and protein oxidation in human blood. Food Chem. Toxicol. 2014, 73, 1–6. [Google Scholar] [CrossRef]
  66. Nguyen, T.; Nioi, P.; Pickett, C.B. The Nrf2-antioxidant response element signaling pathway and its activation by oxidative stress. J. Biol. Chem. 2009, 284, 13291–13295. [Google Scholar] [CrossRef]
  67. Suzuki, T.; Yamamoto, M. Molecular basis of the Keap1–Nrf2 system. Free Radic. Biol. Med. 2015, 88, 93–100. [Google Scholar] [CrossRef]
  68. Saw, C.L.L.; Yang, A.Y.; Guo, Y.; Kong, A.-N.T. Astaxanthin and omega-3 fatty acids individually and in combination protect against oxidative stress via the Nrf2–ARE pathway. Food Chem. Toxicol. 2013, 62, 869–875. [Google Scholar] [CrossRef]
  69. Tabei, Y.; Murotomi, K.; Umeno, A.; Horie, M.; Tsujino, Y.; Masutani, B.; Yoshida, Y.; Nakajima, Y. Antioxidant properties of 5-hydroxy-4-phenyl-butenolide via activation of Nrf2/ARE signaling pathway. Food Chem. Toxicol. 2017, 107, 129–137. [Google Scholar] [CrossRef] [PubMed]
  70. Wang, P.; Gao, Y.-M.; Sun, X.; Guo, N.; Li, J.; Wang, W.; Yao, L.-P.; Fu, Y.-J. Hepatoprotective effect of 2′-O-galloylhyperin against oxidative stress-induced liver damage through induction of Nrf2/ARE-mediated antioxidant pathway. Food Chem. Toxicol. 2017, 102, 129–142. [Google Scholar] [CrossRef]
  71. Böger, R.H.; Bode-Böger, S.M.; Frölich, J.C. The l-arginine—Nitric oxide pathway: Role in atherosclerosis and therapeutic implications. Atherosclerosis 1996, 127, 1–11. [Google Scholar] [CrossRef]
  72. Bronte, V.; Zanovello, P. Regulation of immune responses by L-arginine metabolism. Nat. Rev. Immunol. 2005, 5, 641–654. [Google Scholar] [CrossRef] [PubMed]
  73. Yang, L.; Chen, J.-H.; Zhang, H.; Qiu, W.; Liu, Q.-H.; Peng, X.; Li, Y.-N.; Yang, H.-K. Alkali treatment affects in vitro digestibility and bile acid binding activity of rice protein due to varying its ratio of arginine to lysine. Food Chem. 2012, 132, 925–930. [Google Scholar] [CrossRef]
  74. Bansal, V.; Ochoa, J.B. Arginine availability, arginase, and the immune response. Curr. Opin. Clin. Nutr. Metab. Care 2003, 6, 223–228. [Google Scholar] [CrossRef]
  75. Morris, S.M., Jr. Enzymes of arginine metabolism. J. Nutr. 2004, 134, 2743S–2747S. [Google Scholar] [CrossRef]
  76. Wu, G.; Morris, S.M., Jr. Arginine metabolism: Nitric oxide and beyond. Biochem. J. 1998, 336, 1–17. [Google Scholar] [CrossRef]
  77. Liang, M.; Wang, Z.; Li, H.; Cai, L.; Pan, J.; He, H.; Wu, Q.; Tang, Y.; Ma, J.; Yang, L. l-Arginine induces antioxidant response to prevent oxidative stress via stimulation of glutathione synthesis and activation of Nrf2 pathway. Food Chem. Toxicol. 2018, 115, 315–328. [Google Scholar] [CrossRef]
Figure 1. Serum and liver biochemical indicators and gene expression analysis under different arginine/lysine ratios. (AC): Analysis of enzymatic activities of T-NOS, AST, and ALT in the serum of juvenile largemouth bass; (D): analysis of arginase activity in the liver of juvenile largemouth bass; (EI): analysis of antioxidant-related indicators in the liver, including (E): MDA, (F): T-AOC, (G): SOD, (H): GSH, and (I): CAT; (J) heatmap of gene expression analysis related to the Keap1-Nrf2 pathway, antioxidant activity, and glutathione metabolism. Data are presented as mean ± standard deviation (SD) and were analyzed using one-way ANOVA. Different letters indicate statistically significant differences (p < 0.05) among groups.
Animals 15 01947 g001
Figure 2. Integrated analysis of antioxidant and glutathione metabolism-related genes expression. (A): The interaction network of the Keap1-Nrf2 pathway and antioxidant-related genes represents the changes in the expression levels of key genes and their interactions under different arginine/lysine ratios. The color represents the relative expression value, where red and blue colors indicate up-regulation and down-regulation, respectively. The genes not subject to research are marked in gray. (B): KEGG mapping results of key genes in the glutathione metabolism pathway. The blue or red box illustrated significant downregulation or upregulation of the gene, respectively. White boxes or circles represent components not investigated in this study.
Animals 15 01947 g002
Figure 3. Integrated analysis of inflammation and apoptosis-related gene expression in the liver of juvenile largemouth bass. (A) Changes in the expression levels of inflammation and apoptosis-related genes under varying arginine/lysine ratios. Asterisks (*) indicate significant differences compared with the 2.27/2.25 group (p < 0.05). (B) Heatmap analysis of inflammation and apoptosis-related genes in the liver under different arginine/lysine ratios. The heatmap colors represent gene expression levels, with red, blue, and white indicating upregulated, downregulated, and unchanged expression, respectively. (C) Interaction network of inflammation and apoptosis-related genes, where purple circles represent the studied genes. The closer the color is to purple, the greater the gene’s importance in the network. Gray hexagons represent unstudied genes. (D) Interaction network of key inflammation and apoptosis-related genes based on qPCR results, illustrating changes in expression levels under different arginine/lysine ratios. Colors indicate relative expression values (Log2 fold change), with orange, green, and white representing upregulated, downregulated, and unchanged expression, respectively. Unstudied genes are marked in gray.
Animals 15 01947 g003
Table 1. Dietary formulation and proximate composition of the experimental diets (%dry matter).
Ingredients (g 100 g−1)Argine/Lysine Ratio
D1: 1.01
(2.27/2.25)
D2: 0.85
(2.25/2.65)
D3: 0.75
(2.25/2.99)
D4: 0.85 (2.54/3.00)D5: 0.66 (2.55/3.84)
Soybean meal19.0019.0019.0027.0027.00
Fish meal26.0026.0026.0026.0026.00
AA mix a15.2215.2215.2211.6411.64
Lys0.000.511.110.861.96
Gly2.812.291.671.130.00
Corn starch12.0012.0012.0012.0012.00
Fish oil9.929.929.929.929.92
Vitamin mix b1.101.101.101.101.10
Mineral mix c0.500.500.500.500.50
Calcium dihydrogen phosphate1.001.001.001.001.00
Choline chloride0.400.400.400.400.40
CMC4.004.004.004.004.00
Cellulose8.058.068.084.634.66
100.00100.00100.00100.00100.00
Proximate composition (g 100 g−1 dry matter)
Moisture7.878.257.317.435.53
Crude protein44.4144.0544.0244.8444.07
Crude lipid12.2612.3212.3212.0512.61
Ash8.748.969.089.069.50
Energy (MJ/kg)20.5720.4620.6021.1621.48
a Amino acid mixture (g kg−1 diet): Histidine, 1.6; Isoleucine 3.9; Leucine 24.0; Methionine, 5.5; Phenylalanine, 3.1; Threonine, 4.0; Tryptophan, 0.7; Valine, 4.9; Aspartic acid 18.1; Glutamic acid, 39.6; Serine, 6.6; Proline, 22.1; Glycine, 22.6; Alanine, 10.6; Tyrosine, 2.1; Cysteine 2.8. b Vitamin mixture (mg or IU kg−1 diet): Vitamin A, 10,000 IU; thiamine, 30; riboflavin, 60; Vitamin B6, 20; cyanocobalamin, 0.1; Vitamin C, 2000; Vitamin D3, 2000 IU; menadione, 40; Vitamin E, 160IU; Biotin, 2.5; Calcium pantothenate, 100; Folic acid, 10; Niacin, 200; Inositol, 100. c Mineral mixture (mg kg−1 diet): FeC6H5O7·5H2O, 13.2; MgSO4·7H2O, 53.2; KH2PO4, 93.2; NaH2PO4·2H2O, 33.2; AlCl3·6H2O, 2.8; ZnCl2, 8; CuSO4·5H2O, 4; MnSO4·H2O, 2.8; KI, 2.8; CoCl2·6H2O, 0.6; NaSeO3·H2O, 0.08.
Table 2. Amino acid composition of the experimental diets (%dry matter).
Amino AcidArgine/Lysine Ratio
D1: 1.01
(2.27/2.25)
D2: 0.85
(2.25/2.65)
D3: 0.75
(2.25/2.99)
D4: 0.85 (2.54/3.00)D5: 0.66 (2.55/3.84)
Arg2.272.252.252.542.55
His0.840.850.840.960.97
lle1.631.671.591.641.67
Leu2.822.842.792.942.96
Lys2.252.652.993.003.84
Met1.241.241.251.141.19
Thr1.871.871.861.801.80
Phe1.851.871.841.831.89
Val2.402.372.332.282.27
Ala3.153.153.123.073.07
Asp5.225.235.215.165.19
Glu9.109.109.059.009.02
Gly6.606.145.535.003.94
Pro0.550.560.540.540.57
Ser2.012.002.032.132.15
Tyr1.141.081.131.191.22
Table 3. Effect of arginine/lysine ratio on the growth performance of juvenile largemouth bass.
Argine/Lysine RatioSEM 1ANOVA 2
D1: 1.01
(2.27/2.25)
D2: 0.85
(2.25/2.65)
D3: 0.75
(2.25/2.99)
D4: 0.85 (2.54/3.00)D5: 0.66 (2.55/3.84)p Value
Survival 398.33%100.00%100.00%96.67%100.00%0.010.519
IBW 45.95 ± 0.105.92 ± 0.135.95 ± 0.065.98 ± 0.095.98 ± 0.060.020.930
FBW530.64 ± 0.8632.41 ± 1.4829.03 ± 0.5932.21 ± 2.2332.11 ± 1.360.460.068
WG 6415.27 ± 5.95 ab447.29 ± 21.40 b388.34 ± 13.32 a438.53 ± 29.83 ab436.87 ± 23.23 ab7.230.033
SGR 73.15 ± 0.03 ab3.27 ± 0.08 b3.05 ± 0.06 a3.24 ± 0.11 ab3.23 ± 0.09 ab0.030.033
FCR 81.06 ± 0.040.98 ± 0.011.04 ± 0.030.97 ± 0.060.98 ± 0.030.010.035
PER 92.30 ± 0.082.52 ± 0.032.36 ± 0.072.48 ± 0.142.45 ± 0.060.030.053
DFI 102.76 ± 0.112.61 ± 0.032.64 ± 0.042.57 ± 0.132.58 ± 0.030.030.090
Data are expressed as mean ± standard deviation (n = 3). Different superscript letters (a, b) indicate significant differences among treatments (p < 0.05) The absence of superscript letters denotes no significant difference. 1 SEM: pooled standard error of means; 2 ANOVA: one-way analysis of variance, same as below. 3 Survival, % = 100 × final number/initial number. 4 Initial body weight, IBW, g. 5 Finial body weight, FBW, g. 6 Weight gain, WG, % = 100 × ((FBW − IBW)/IBW). 7 Specific growth rate, SGR, % day−1 = 100 × (ln (FBW) − ln (IBW))/day. 8 Feed conversion ratio, FCR = dry feed consumed/wet weight gain. 9 Protein efficiency ratio, PER = wet weight gain/protein intake. 10 Daily feed intake (DFI, g 100 g fish−1 day−1) = 100 × feed offered/average total weight/days.
Table 4. Effect of arginine/lysine ratio on the morphometrical parameters of juvenile largemouth bass.
Argine/Lysine RatioSEMANOVA
D1: 1.01
(2.27/2.25)
D2: 0.85
(2.25/2.65)
D3: 0.75
(2.25/2.99)
D4: 0.85 (2.54/3.00)D5: 0.66 (2.55/3.84)p Value
IPF 17.00 ± 0.337.37 ± 0.697.11 ± 0.186.87 ± 0.036.69 ± 0.030.100.115
HIS 21.49 ± 0.161.74 ± 0.321.53 ± 0.291.36 ± 0.061.36 ± 0.200.060.303
VSI 31.21 ± 0.161.34 ± 0.061.38 ± 0.031.39 ± 0.161.15 ± 0.070.030.073
CF 41.58 ± 0.271.87 ± 0.051.55 ± 0.311.84 ± 0.241.81 ± 0.030.060.109
1 Intraperitoneal fat ratio, IPF = 100 × (intraperitoneal fat weight/whole body weight). 2 Hepatosomatic index, HIS = 100 × (hepatosomatic weight/whole body weight). 3 Viscerosomatic index, VSI = 100 × (viscera weight/whole body weight). 4 Condition factor, CF = 100 × (live weight/length3).
Table 5. Effect of arginine/lysine ratio on the whole body and tissue proximate composition of juvenile largemouth bass.
Argine/Lysine RatioSEMANOVA
D1: 1.01
(2.27/2.25)
D2: 0.85
(2.25/2.65)
D3: 0.75
(2.25/2.99)
D4: 0.85 (2.54/3.00)D5: 0.66 (2.55/3.84)p Value
Whole body%
Moisture70.93 ± 1.8871.56 ± 0.0971.13 ± 1.0372.14 ± 1.1572.30 ± 0.110.280.212
Crude protein17.01 ± 1.5116.89 ± 0.2317.22 ± 0.5916.91 ± 0.4117.17 ± 0.810.190.926
Crude lipid8.46 ± 1.087.76 ± 0.388.18 ± 0.837.42 ± 0.996.70 ± 0.400.240.134
Ash3.70 ± 0.363.65 ± 0.023.77 ± 0.073.41 ± 0.093.62 ± 0.140.050.220
Muscle%
Moisture76.55 ± 2.5176.76 ± 0.2273.21 ± 7.4476.48 ± 0.6276.69 ± 0.430.850.833
Crude protein19.56 ± 1.0819.58 ± 1.1522.57 ± 6.1419.09 ± 0.3219.99 ± 0.460.700.600
Crude lipid3.21 ± 1.763.23 ± 0.893.77 ± 1.753.34 ± 0.362.65 ± 0.270.280.621
   Liver%
Moisture68.71 ± 0.7770.06 ± 3.2868.75 ± 3.5469.90 ± 1.2471.56 ± 1.520.590.585
Crude protein10.70 ± 0.429.21 ± 1.3110.88 ± 1.4510.90 ± 1.2410.78 ± 1.050.300.373
Crude lipid3.33 ± 0.213.24 ± 0.304.10 ± 0.973.24 ± 0.193.17 ± 0.500.150.838
Table 6. Effect of arginine/lysine ratio on the nitrogen, lipid and energy utilization of juvenile largemouth bass.
Argine/Lysine RatioSEMANOVA
D1: 1.01
(2.27/2.25)
D2: 0.85
(2.25/2.65)
D3: 0.75
(2.25/2.99)
D4: 0.85 (2.54/3.00)D5: 0.66 (2.55/3.84)p Value
   Nitrogen
DNI (g kg−1 day−1) 11.81 ± 0.071.69 ± 0.021.72 ± 0.031.71 ± 0.091.72 ± 0.020.020.132
DNG (g kg −1 day−1) 20.70 ± 0.080.71 ± 0.010.70 ± 0.040.71 ± 0.010.72 ± 0.040.010.834
NR (%) 338.74 ± 3.0942.19 ± 0.2940.48 ± 2.8041.58 ± 2.8641.93 ± 3.080.670.523
Lipid
DLI (g kg −1 day−1) 43.12 ± 0.12 a2.95 ± 0.03 ab3.01 ± 0.05 ab2.87 ± 0.15 b3.08 ± 0.04 a0.030.044
DLG (g kg −1 day−1) 52.22 ± 0.362.04 ± 0.152.08 ± 0.291.91 ± 0.341.68 ± 0.100.080.217
LR (%) 670.90 ± 8.5169.10 ± 4.9469.19 ± 10.5666.54 ± 8.4554.59 ± 3.182.290.136
   Energy
DEI (102 kJ kg−1 day−1) 75.20 ± 0.214.90 ± 0.055.00 ± 0.084.87 ± 0.264.99 ± 0.060.050.161
DEG (102 kJ kg −1 day−1) 82.05 ± 0.181.88 ± 0.231.86 ± 0.111.90 ± 0.201.94 ± 0.020.040.656
ER (%) 939.35 ± 1.8638.39 ± 4.7937.18 ± 2.7738.94 ± 2.1238.86 ± 0.820.640.827
Data are expressed as mean ± standard deviation (n = 3). Different superscript letters (a, b) indicate significant differences among treatments (p < 0.05) The absence of superscript letters denotes no significant difference. 1 Daily nitrogen intake; 2 daily nitrogen gain; 3 nitrogen retention; 4 daily lipid intake; 5 daily lipid gain; 6 lipid retention; 7 daily energy intake; 8 daily energy gain; 9 energy retention.
Table 7. Effect of arginine/lysine ratio on the serum amino acid composition of juvenile largemouth bass.
Amino AcidArgine/Lysine RatioSEMANOVA
D1: 1.01
(2.27/2.25)
D2: 0.85
(2.25/2.65)
D3: 0.75
(2.25/2.99)
D4: 0.85 (2.54/3.00)D5: 0.66 (2.55/3.84)p Value
Arg2.96 ± 0.87 a5.29 ± 1.16 b6.73 ± 0.23 b2.97 ± 0.12 a2.16 ± 0.95 a0.490.028
His70.22 ± 12.3573.82 ± 11.65101.46 ± 11.9979.93 ± 17.46104.28 ± 16.714.910.042
Ile132.12 ± 30.69139.91 ± 35.77170.51 ± 14.73146.28 ± 13.55169.21 ± 14.656.660.248
Leu227.08 ± 53.64245.53 ± 58.98299.12 ± 16.45257.89 ± 28.41297.29 ± 24.9211.610.188
Lys80.75 ± 35.35 a139.80 ± 31.71 ab147.26 ± 5.36 ab90.35 ± 18.10 a209.56 ± 46.78 b14.070.003
Met77.33 ± 10.50 a82.35 ± 13.66 a120.80 ± 1.74 b95.59 ± 17.56 ab95.45 ± 21.61 ab5.140.035
Thr206.75 ± 31.46186.33 ± 40.69252.06 ± 2.98175.32 ± 41.32225.96 ± 33.7810.330.102
Phe94.73 ± 23.2596.60 ± 29.15104.73 ± 17.76103.79 ± 5.72105.19 ± 18.934.620.946
Val219.30 ± 48.31230.31 ± 44.91300.16 ± 21.31246.26 ± 22.67274.02 ± 24.2610.890.087
EAA1111.2467 ± 234.241199.94 ± 220.361502.83 ± 75.431198.39 ± 124 1483.13 ± 166.9257.600.061
Ala726.65 ± 178.62693.38 ± 165.24901.69 ± 37.56667.97 ± 46.07888.09 ± 95.4037.260.103
Asp23.90 ± 11.7025.44 ± 1.4926.71 ± 0.7026.27 ± 2.0728.01 ± 3.271.270.693
Asn43.05 ± 16.60 a55.29 ± 5.92 ab87.41 ± 9.22 b61.20 ± 17.14 ab85.68 ± 9.66 b5.390.005
Glu39.59 ± 13.7546.58 ± 13.7939.11 ± 4.5335.48 ± 5.6053.06 ± 8.822.770.287
Gln213.62 ± 77.16256.20 ± 80.53365.19 ± 59.59275.75 ± 51.72248.46 ± 11.3320.270.060
Gly1880.44 ± 483.90 b1451.10 ± 245.11 ab1547.77 ± 110.18 ab1104.66 ± 253.94 a1116.80 ± 45.86 a97.780.036
Pro83.42 ± 26.6385.02 ± 25.21100.46 ± 16.4389.03 ± 2.56115.26 ± 11.585.180.270
Ser258.02 ± 58.75 ab282.89 ± 96.55 b304.09 ± 14.10 b134.23 ± 29.65 a136.82 ± 37.29 a22.950.032
Tyr123.61 ± 19.47 ab108.69 ± 21.66 a175.84 ± 23.84 b140.32 ± 22.20 ab149.74 ± 30.02 ab8.020.049
Cit44.59 ± 12.59 a42.96 ± 6.00 a74.76 ± 9.80 b49.65 ± 8.17 a45.54 ± 1.72 a3.670.005
Orn78.52 ± 29.4292.00 ± 23.10120.25 ± 20.3096.89 ± 1.56109.71 ± 12.875.800.176
NEAA3515.41 ± 861.723139.54 ± 653.803743.26 ± 215.712681.45 ± 392.72 3077.17 ± 144.54151.430.201
Data are expressed as mean ± standard deviation (n = 3). Different superscript letters (a, b) indicate significant differences among treatments (p < 0.05) The absence of superscript letters denotes no significant difference.
Table 8. Effect of arginine/lysine ratio on the whole-body amino acid composition of juvenile largemouth bass.
Amino AcidArgine/Lysine RatioSEMANOVA
D1: 1.01
(2.27/2.25)
D2: 0.85
(2.25/2.65)
D3: 0.75
(2.25/2.99)
D4: 0.85 (2.54/3.00)D5: 0.66 (2.55/3.84)p Value
Arg7.62 ± 0.137.58 ± 0.057.48 ± 0.027.52 ± 0.127.55 ± 0.160.030.573
His2.72 ± 0.05 a2.73 ± 0.03 ab2.77 ± 0.02 abc2.82 ± 0.04 c2.82 ± 0.04 bc0.010.012
Ile4.84 ± 0.114.90 ± 0.014.86 ± 0.064.79 ± 0.084.66 ± 0.150.030.064
Leu8.17 ± 0.128.19 ± 0.098.30 ± 0.048.31 ± 0.138.27 ± 0.210.030.576
Lys9.23 ± 0.199.37 ± 0.109.45 ± 0.079.51 ± 0.169.49 ± 0.220.040.269
Met3.21 ± 0.073.27 ± 0.033.20 ± 0.093.22 ± 0.093.21 ± 0.060.020.792
Thr4.94 ± 0.09 ab4.91 ± 0.04 a5.00 ± 0.04 ab5.03 ± 0.04 ab5.06 ± 0.04 b0.020.027
Phe4.80 ± 0.054.81 ± 0.034.86 ± 0.014.85 ± 0.064.83 ± 0.070.010.466
Val6.00 ± 0.05 b6.03 ± 0.02 b6.00 ± 0.02 b5.90 ± 0.09 ab5.76 ± 0.09 a0.030.003
EAA51.52 ± 0.5451.79 ± 0.2751.92 ± 0.2351.96 ± 0.4251.64 ± 0.670.110.745
Ala1.23 ± 0.021.21 ± 0.061.47 ± 0.041.32 ± 0.171.29 ± 0.050.030.071
Asp10.84 ± 0.0710.88 ± 0.0510.92 ± 0.0410.98 ± 0.1310.99 ± 0.150.030.334
Glu15.87 ± 0.1215.86 ± 0.0815.93 ± 0.0615.98 ± 0.0616.01 ± 0.100.020.205
Gly10.81 ± 0.6310.49 ± 0.3410.06 ± 0.389.96 ± 0.709.97 ± 0.970.170.445
Pro1.85 ± 0.101.91 ± 0.141.79 ± 0.051.77 ± 0.062.00 ± 0.150.030.135
Ser4.85 ± 0.08 ab4.74 ± 0.07 a4.88 ± 0.06 ab4.92 ± 0.03 b4.99 ± 0.03 b0.030.004
Tyr3.05 ± 0.123.12 ± 0.073.04 ± 0.203.12 ± 0.233.10 ± 0.200.040.963
NEAA48.49 ± 0.5448.21 ± 0.2748.09 ± 0.2248.05 ± 0.4148.35 ± 0.670.110.741
Data are expressed as mean ± standard deviation (n = 3). Different superscript letters (a–c) indicate significant differences among treatments (p < 0.05) The absence of superscript letters denotes no significant difference.
Table 9. Effect of arginine/lysine ratio on the amino acid retention rate of juvenile largemouth bass.
Amino AcidArgine/Lysine RatioSEMANOVA
D1: 1.01
(2.27/2.25)
D2: 0.85
(2.25/2.65)
D3: 0.75
(2.25/2.99)
D4: 0.85 (2.54/3.00)D5: 0.66 (2.55/3.84)p Value
Arg58.81 ± 3.44 ab64.25 ± 0.27 b59.99 ± 3.62 ab55.01 ± 3.62 a55.22 ± 3.46 a1.140.027
His56.50 ± 3.3161.46 ± 0.2559.60 ± 3.5954.72 ± 3.6054.25 ± 3.401.010.070
Ile52.21 ± 3.0655.90 ± 0.2355.05 ± 3.3253.97 ± 3.5552.07 ± 3.260.760.457
Leu50.81 ± 2.9755.14 ± 0.2353.66 ± 3.2352.38 ± 3.4552.15 ± 3.270.740.468
Lys72.09 ± 4.22 c67.46 ± 0.28 c57.10 ± 3.44 b58.79 ± 3.87 b46.16 ± 2.89 a2.500.000
Met45.58 ± 2.6750.41 ± 0.2146.14 ± 2.7852.31 ± 3.4550.46 ± 3.160.920.047
Thr46.26 ± 2.7150.10 ± 0.2148.41 ± 2.9251.80 ± 3.4152.50 ± 3.280.860.106
Phe45.61 ± 2.6749.08 ± 0.2047.62 ± 2.8749.23 ± 3.2447.76 ± 2.990.670.492
Val43.88 ± 2.5748.60 ± 0.2046.56 ± 2.8148.02 ± 3.1647.30 ± 2.970.710.268
EAA52.67 ± 3.0856.14 ± 0.2352.81 ± 3.1853.15 ± 3.5050.38 ± 3.160.800.270
Ala6.86 ± 0.41 a7.33 ± 0.03 a8.48 ± 0.51 b7.98 ± 0.53 ab7.84 ± 0.49 ab0.180.009
Asp36.43 ± 2.1339.74 ± 0.1737.82 ± 2.2839.44 ± 2.6039.53 ± 2.480.580.316
Glu30.62 ± 1.7933.28 ± 0.1331.75 ± 1.9132.90 ± 2.1733.13 ± 2.070.470.367
Gly28.74 ± 1.69 a32.63 ± 0.13 ab32.80 ± 1.98 ab36.92 ± 2.43 b47.19 ± 2.95 c1.750.000
Pro58.74 ± 3.4465.54 ± 0.2759.18 ± 3.5760.32 ± 3.9764.81 ± 4.061.060.090
Ser42.37 ± 2.4845.22 ± 0.1943.33 ± 2.6142.79 ± 2.8243.34 ± 2.710.580.651
Tyr47.08 ± 2.75 a55.09 ± 0.23 b48.48 ± 2.92 a48.62 ± 3.20 a47.49 ± 2.98 a0.970.023
NEAA30.66 ± 1.80 a33.77 ± 0.14 ab32.58 ± 1.96 ab34.13 ± 2.25 ab35.86 ± 2.24 b0.610.059
Data are expressed as mean ± standard deviation (n = 3). Different superscript letters (a–c) indicate significant differences among treatments (p < 0.05) The absence of superscript letters denotes no significant difference.
Disclaimer/Publisher’s Note: The statements, opinions and data contained in all publications are solely those of the individual author(s) and contributor(s) and not of MDPI and/or the editor(s). MDPI and/or the editor(s) disclaim responsibility for any injury to people or property resulting from any ideas, methods, instructions or products referred to in the content.

