
Effects of Dietary Net Energy/Lysine Ratio and Sex on Growth Performance, Digestive Organ Development, and Cecal Microbiota of Broiler Chickens

Simple Summary
Abstract
1. Introduction
2. Materials and Methods
2.1. Ethics Statement
2.2. Experimental Design and Animal Husbandry
2.3. Experimental Diets
2.4. Measured Indicators and Methods
2.4.1. Growth Performance
2.4.2. Intestinal Development
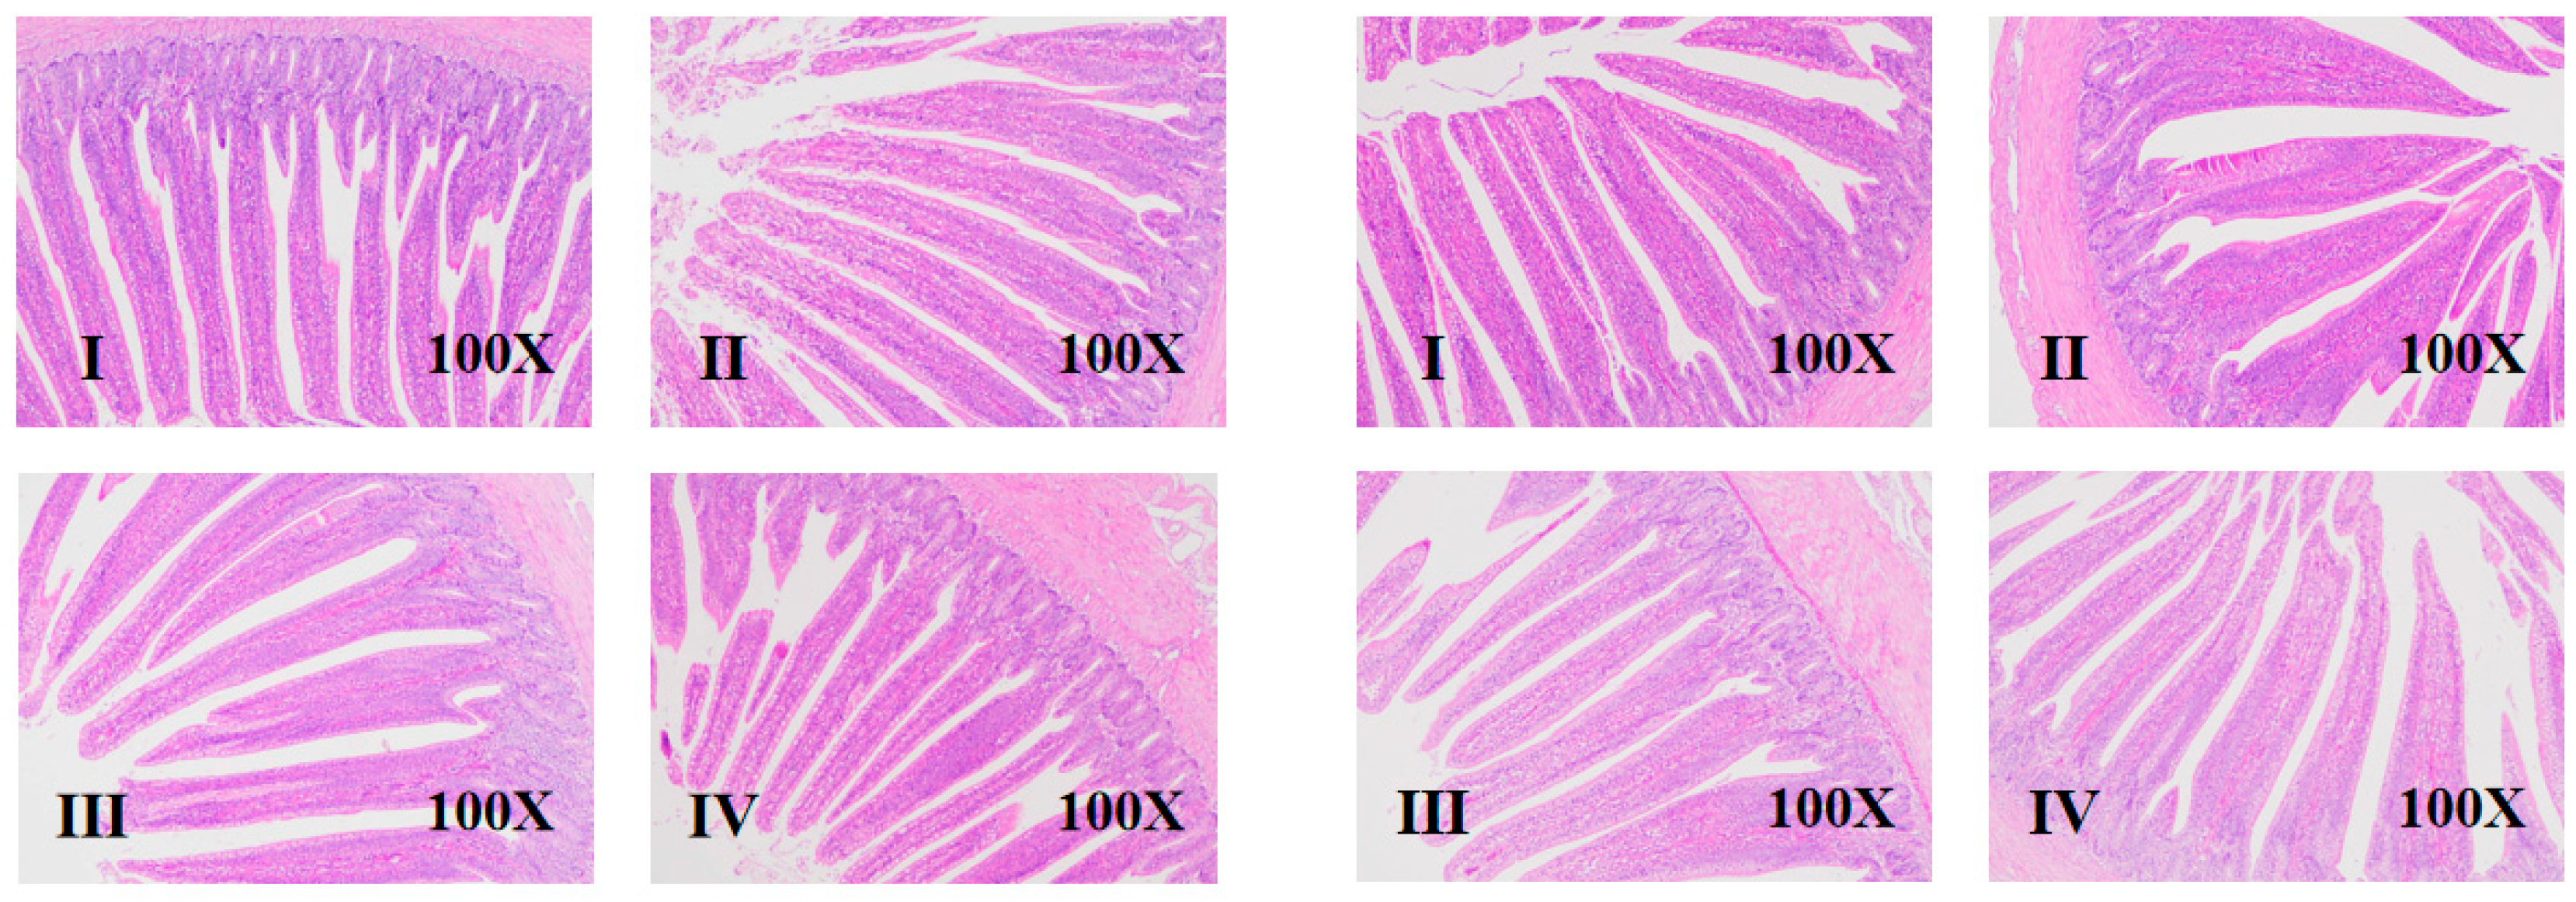
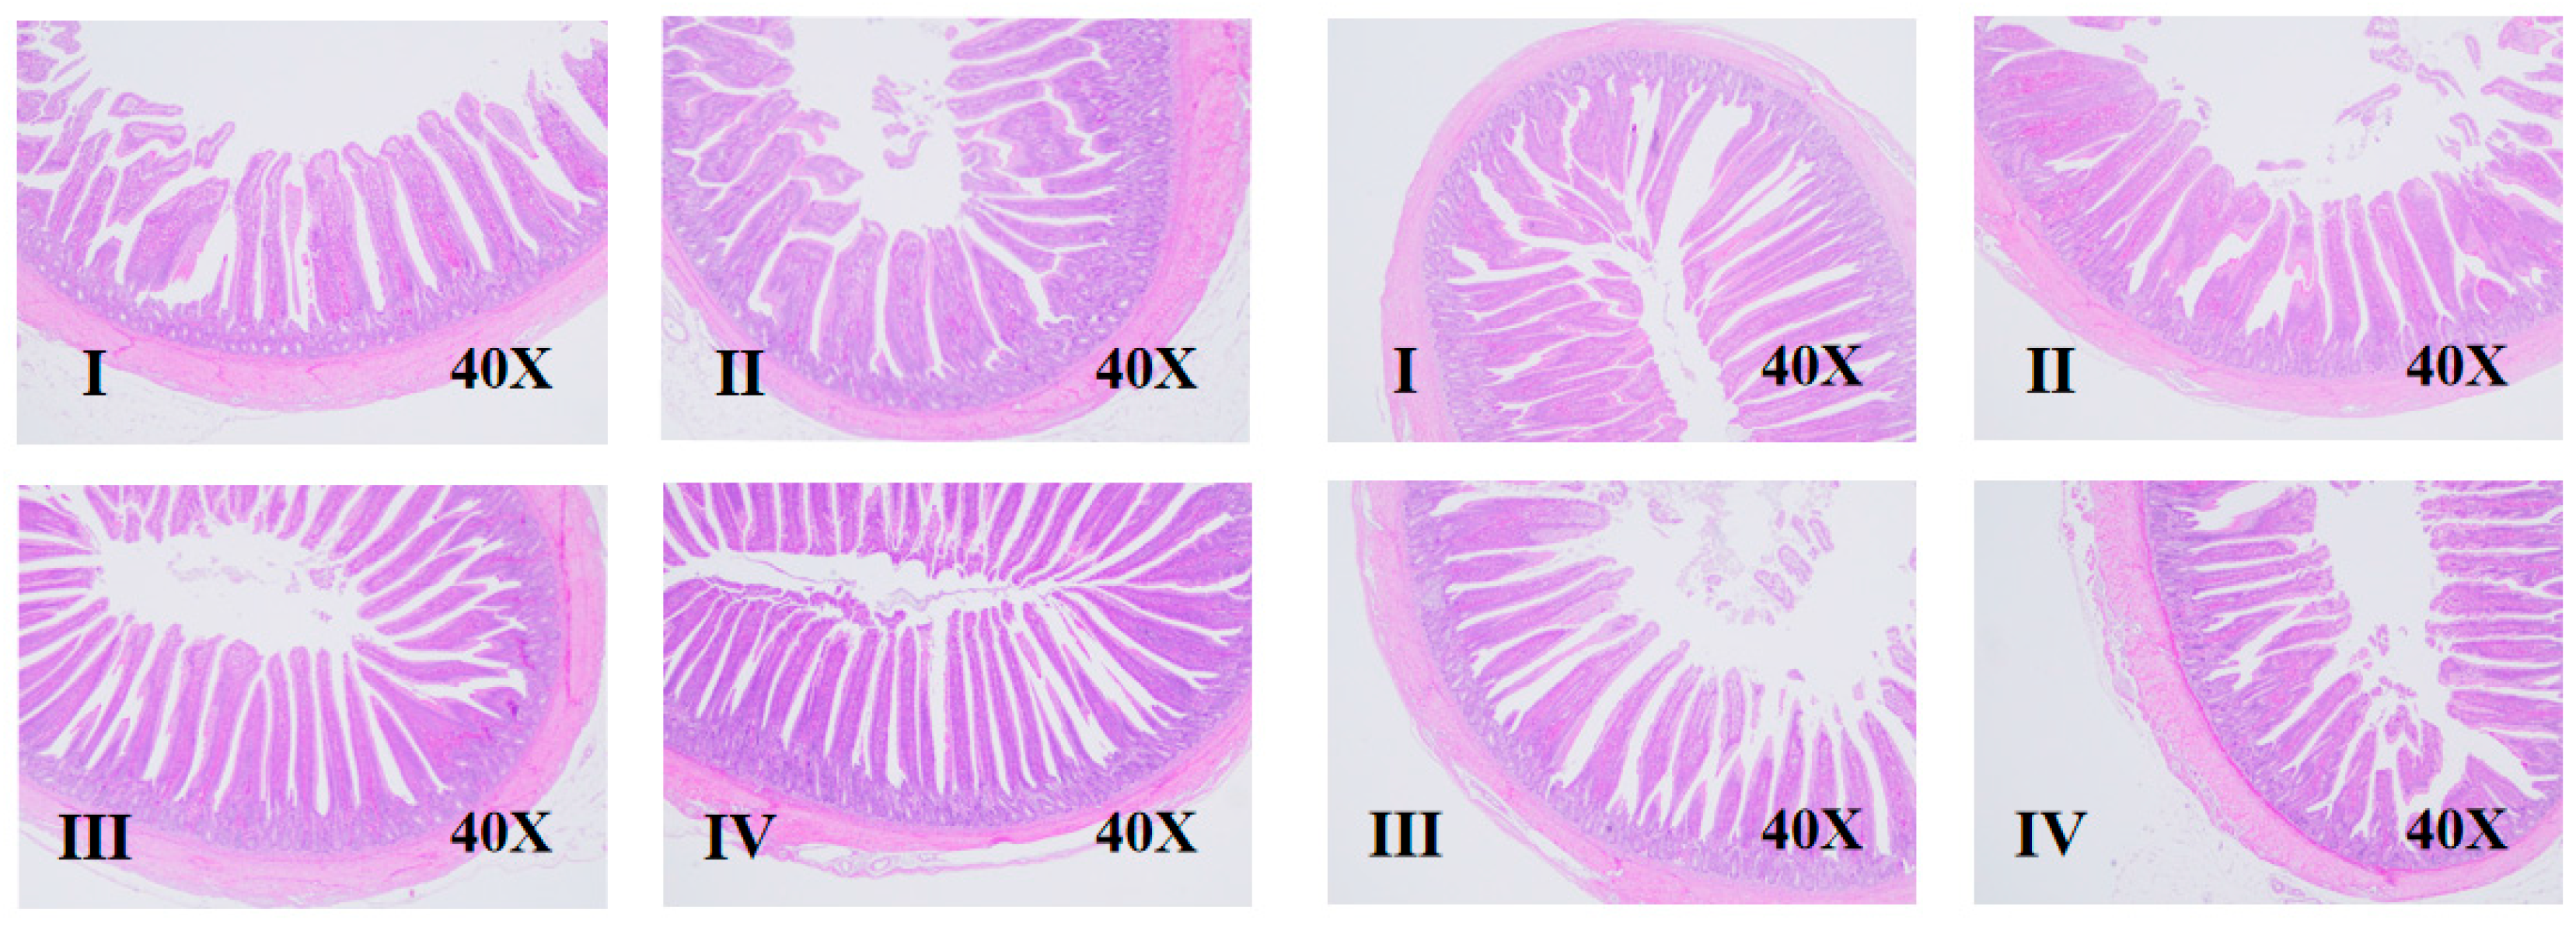
2.4.3. Intestinal Morphology
2.4.4. Cecal Microbiota
2.5. Data Analysis
3. Results
3.1. Growth Performance
3.2. Intestinal Development
3.3. Intestinal Morphology
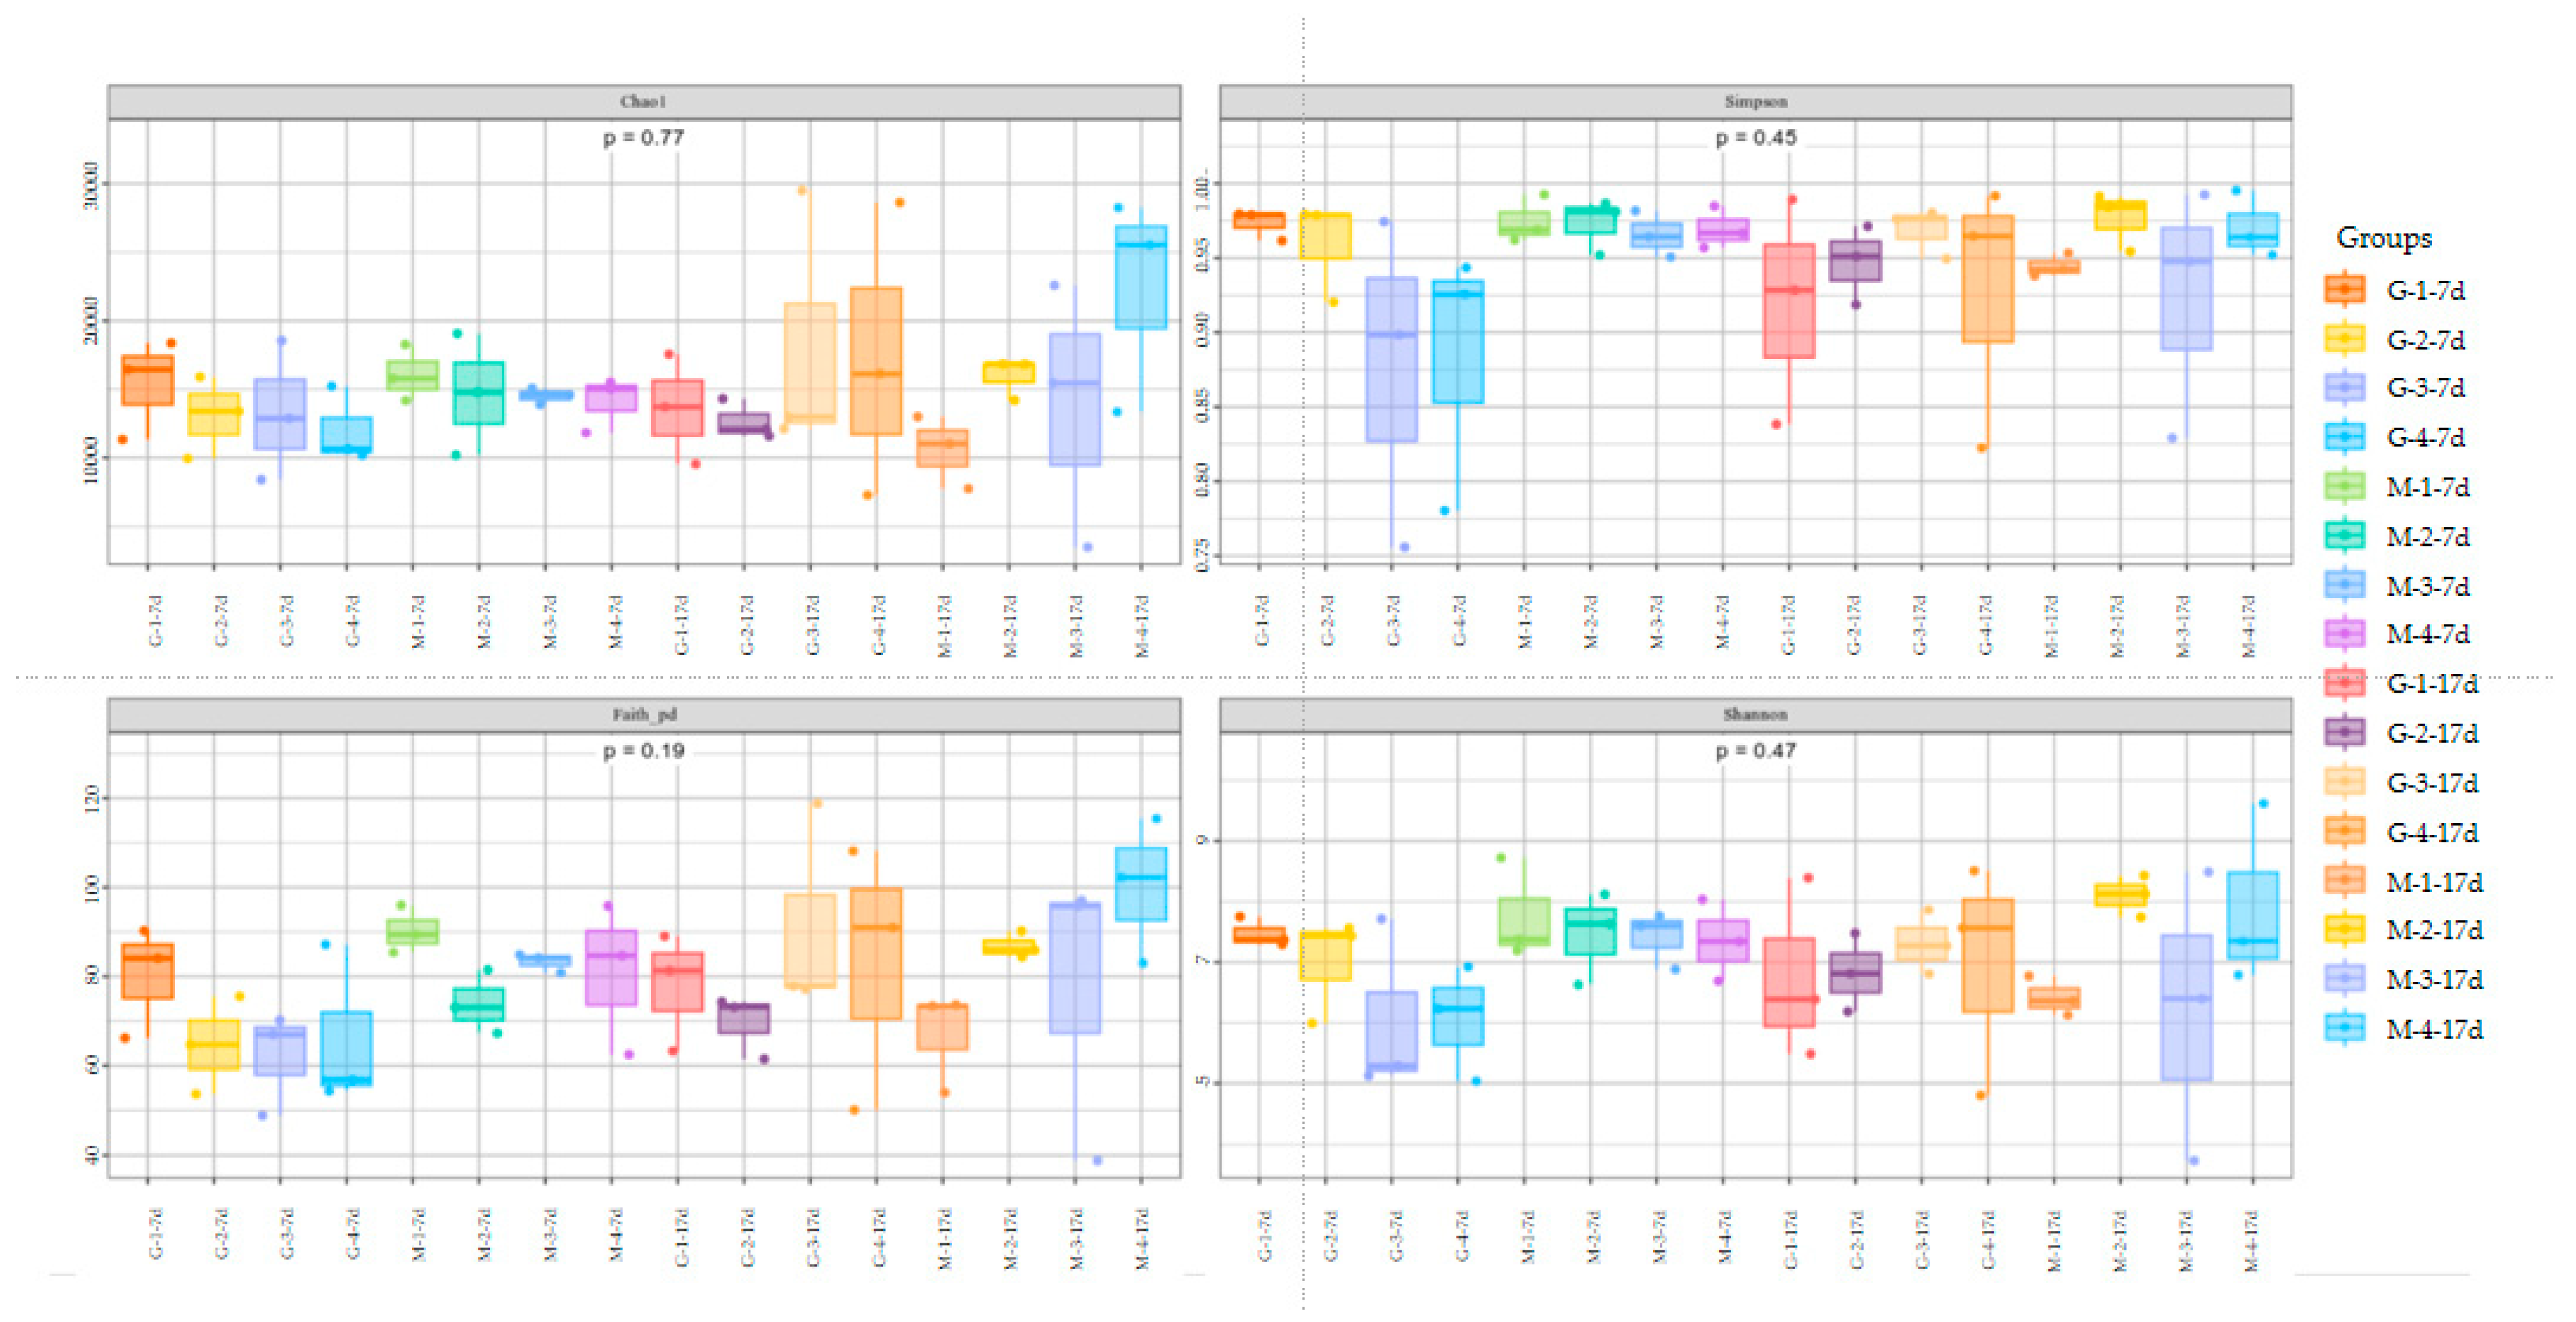
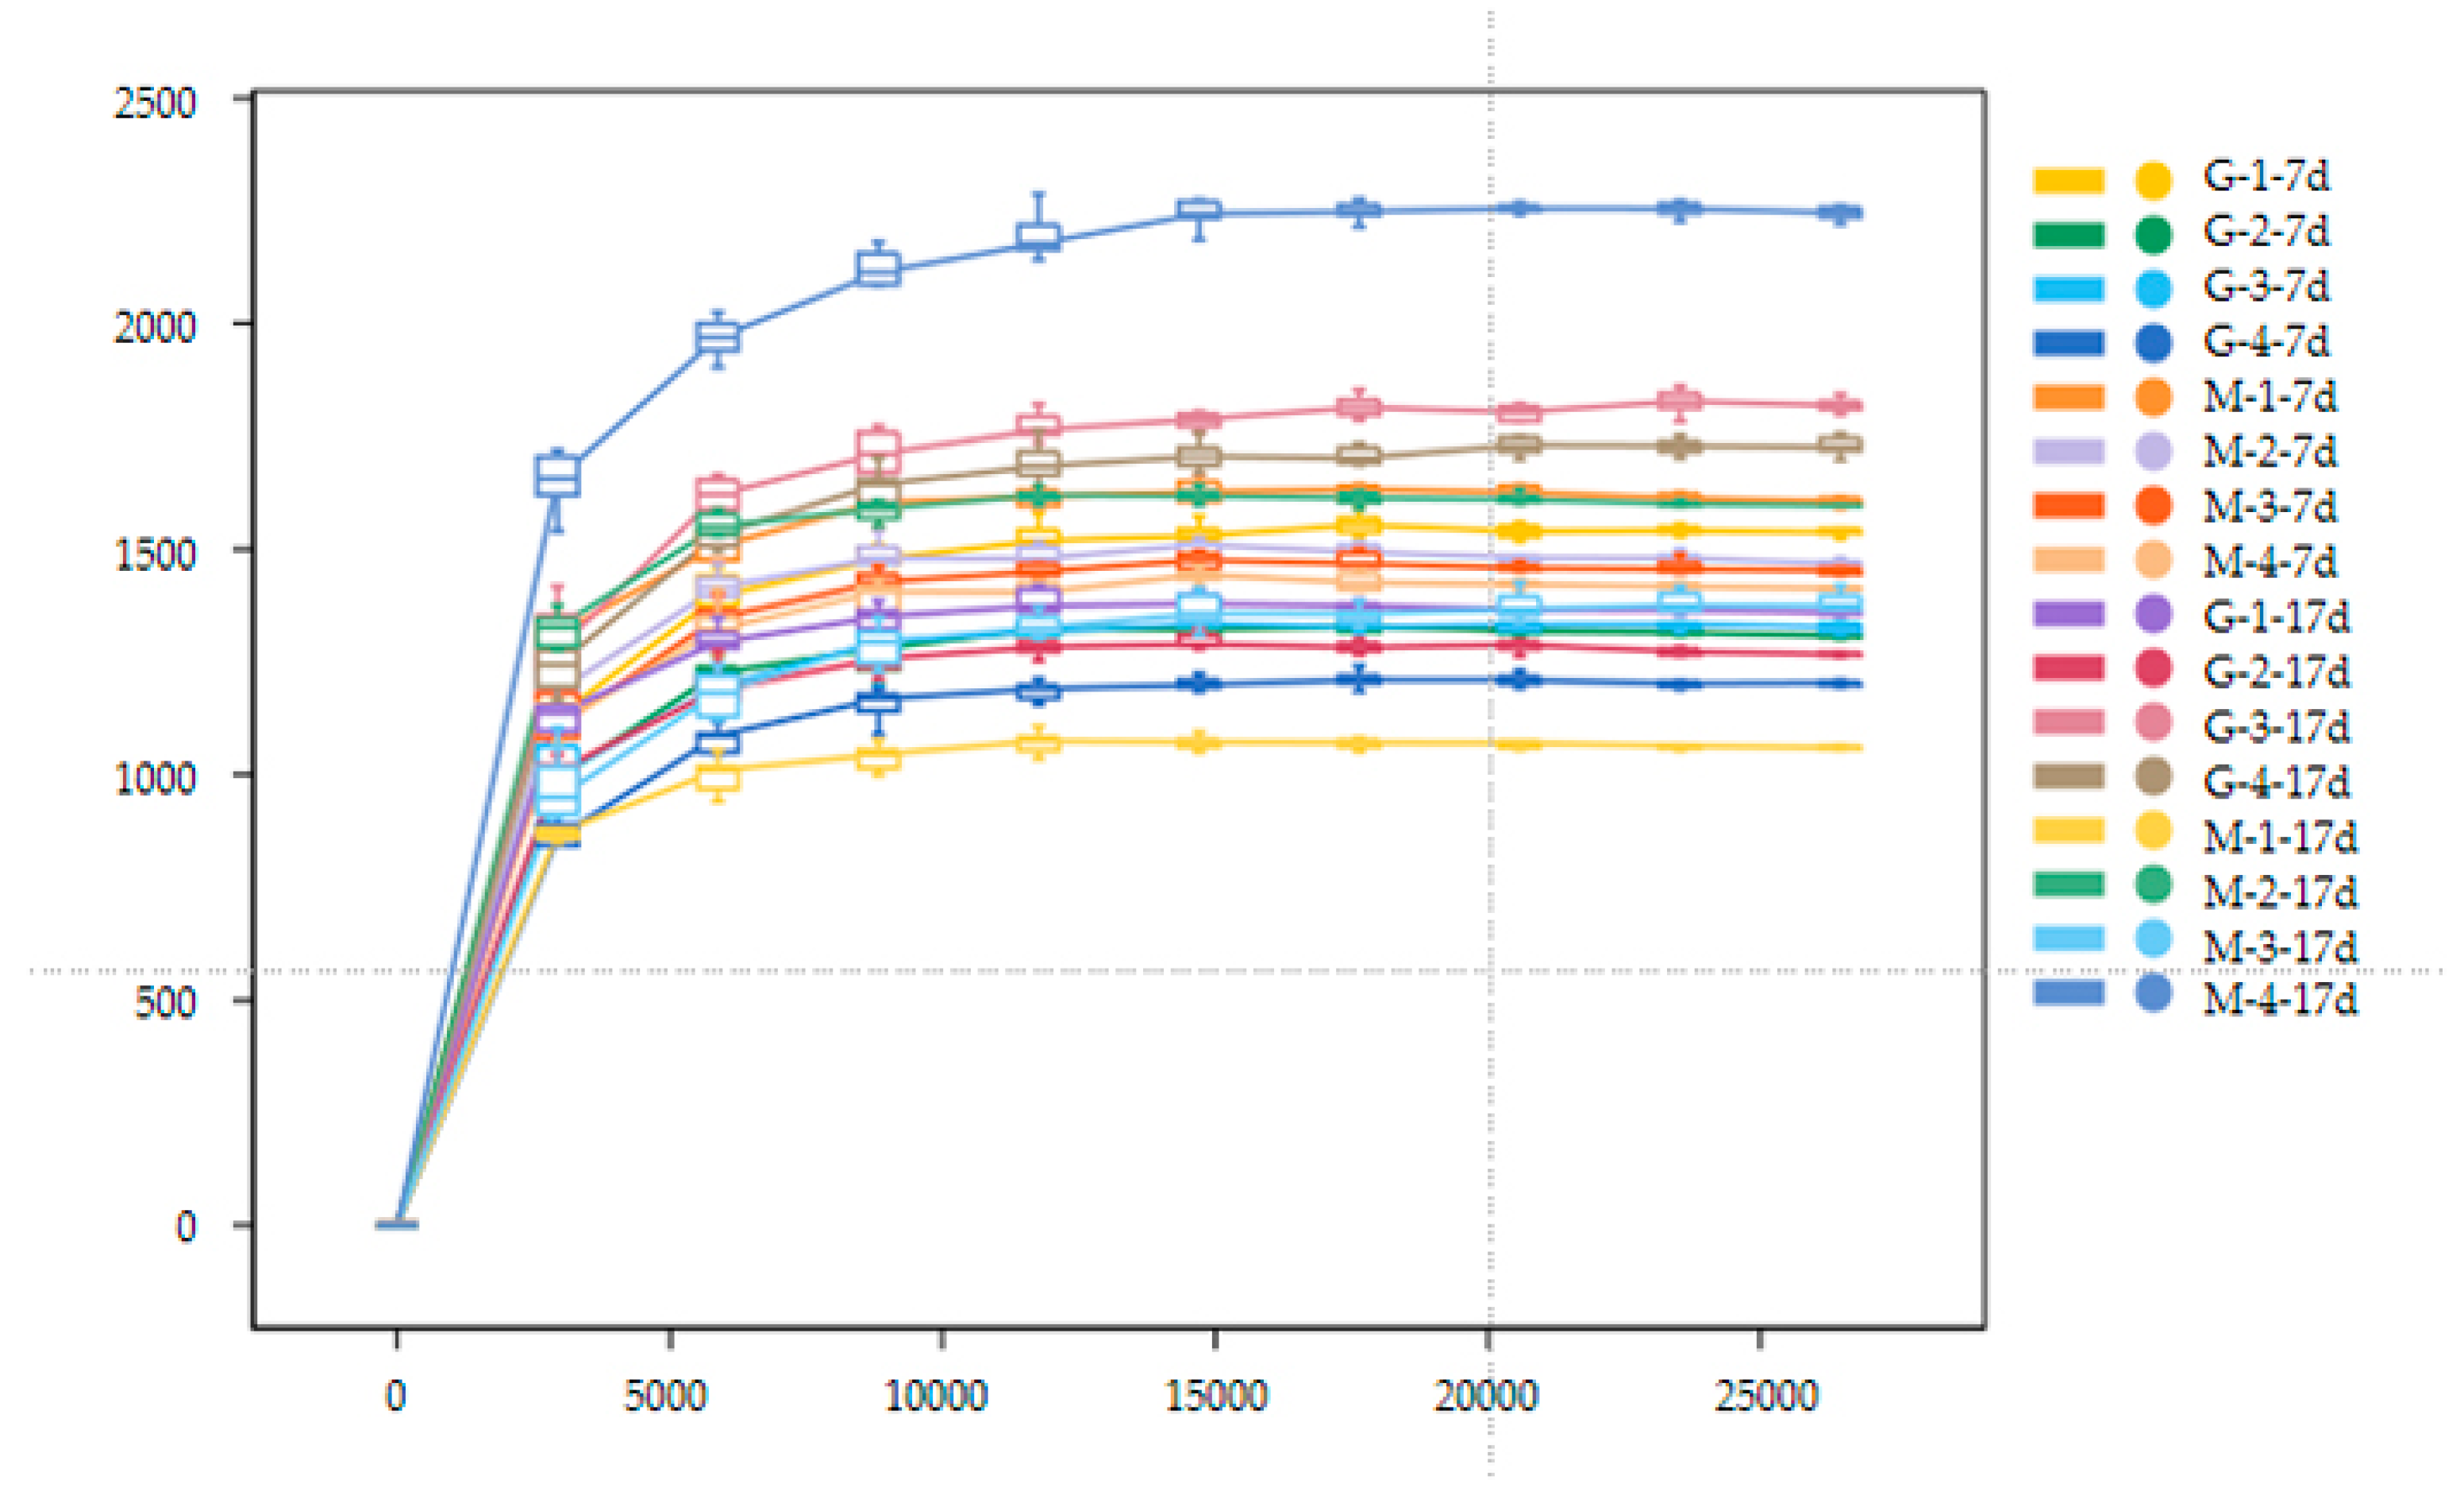
3.4. Cecal Microbiota
4. Discussion
5. Conclusions
Author Contributions
Funding
Institutional Review Board Statement
Informed Consent Statement
Data Availability Statement
Acknowledgments
Conflicts of Interest
References
- Pirgozliev, V.; Rose, S.P. Net energy systems for poultry feeds: A quantitative review. Worlds Poult. Sci. J. 1999, 55, 23–36. [Google Scholar]
- Cerrate, S.; Ekmay, R.; England, J.A.; Coon, C. Predicting nutrient digestibility and energy value for broilers. Poult. Sci. 2019, 98, 3994–4007. [Google Scholar]
- Plumstead, P.W.; Romero-Sanchez, H.; Paton, N.D.; Spears, J.W.; Brake, J. Effects of dietary metabolizable energy and protein on early growth responses of broilers to dietary lysine. Poult. Sci. 2007, 86, 2639–2648. [Google Scholar] [PubMed]
- Mohd Shaufi, M.A.; Sieo, C.C.; Chong, C.W.; Gan, H.M.; Ho, Y.W. Deciphering chicken gut microbial dynamics based on high-throughput 16S rRNA metagenomics analyses. Gut Pathog. 2015, 7, 4. [Google Scholar]
- Tian, D.L.; Guo, R.J.; Li, Y.M.; Chen, P.P.; Zi, B.B.; Wang, J.J.; Liu, R.F.; Min, Y.N.; Wang, Z.P.; Niu, Z.Y.; et al. Effects of lysine deficiency or excess on growth and the expression of lipid metabolism genes in slow-growing broilers. Poult. Sci. 2019, 98, 2927–2932. [Google Scholar] [CrossRef] [PubMed]
- England, A.; Gharib-Naseri, K.; Kheravii, S.K.; Wu, S.B. Influence of sex and rearing method on performance and flock uniformity in broilers—Implications for research settings. Anim. Nutr. 2023, 12, 276–283. [Google Scholar] [CrossRef]
- Lopez, K.P.; Schilling, M.W.; Corzo, A. Broiler genetic strain and sex effects on meat characteristics. Poult. Sci. 2011, 90, 1105–1111. [Google Scholar] [CrossRef] [PubMed]
- Hernández, F.; López, M.; Martínez, S.; Megías, M.D.; Catalá, P.; Madrid, J. Effect of low-protein diets and single sex on production performance, plasma metabolites, digestibility, and nitrogen excretion in 1- to 48-day-old broilers. Poult. Sci. 2012, 91, 683–692. [Google Scholar]
- Shafey, T.M.; Alodan, M.A.; Hussein, E.O.S.; AI-Batshan, H.A. The effect of sex on the accuracy of predicting carcass composition of Ross broiler chickens. J. Anim. Plant Sci. 2013, 23, 975–980. [Google Scholar]
- Boisen, S. Ideal dietary amino acid profiles for pigs. In Amino Acids in Animal Nutrition; CABI Publishing: Wallingford, UK, 2003; pp. 157–168. [Google Scholar]
- Kassim, H.; Suwanpradit, S. The effects of dietary protein levels on the carcass composition of starter and grower broilers. Asian-Australas. J. Anim. Sci. 1996, 9, 261–266. [Google Scholar] [CrossRef]
- Rabie, M.H.; Szilágyi, M. Effects of L-carnitine supplementation of diets differing in energy levels on performance, abdominal fat content, and yield and composition of edible meat of broilers. Br. J. Nutr. 1998, 80, 391–400. [Google Scholar] [PubMed]
- Taylor, J.; Kyriazakis, I. Towards the prediction of feed intake capacity of modern broilers on bulky feeds. Poult. Sci. 2021, 100, 101501. [Google Scholar] [CrossRef]
- Barekatain, R.; Romero, L.F.; Sorbara, J.O.B.; Cowieson, A.J. Balanced nutrient density for broiler chickens using a range of digestible lysine-to-metabolizable energy ratios and nutrient density: Growth performance, nutrient utilisation and apparent metabolizable energy. Anim. Nutr. 2021, 7, 430–439. [Google Scholar]
- Mansilla, W.D.; Moreno-Rubio, J.; Sevillano-Quintero, F.; Saraswathy, S.; Garcia-Ruiz, A.I. The effect of gradually decreasing the dietary energy content, at constant or increased lysine: Energy ratio on broiler performance, carcass yield, and body composition. Poult. Sci. 2022, 101, 102132. [Google Scholar] [CrossRef]
- Benyi, K.; Tshilate, T.S.; Netshipale, A.J.; Mahlako, K.T. Effects of genotype and sex on the growth performance and carcass characteristics of broiler chickens. Trop. Anim. Health Prod. 2015, 47, 1225–1231. [Google Scholar] [CrossRef] [PubMed]
- Madilindi, M.A.; Mokobane, A.; Letwaba, P.B.; Tshilate, T.S.; Banga, C.B.; Rambau, M.D.; Bhebhe, E.; Benyi, K. Effects of sex and stocking density on the performance of broiler chickens in a sub-tropical environment. S. Afr. J. Anim. Sci. 2018, 48, 459–468. [Google Scholar]
- Goo, D.; Kim, J.H.; Choi, H.S.; Park, G.H.; Han, G.P.; Kil, D.Y. Effect of stocking density and sex on growth performance, meat quality, and intestinal barrier function in broiler chickens. Poult. Sci. 2019, 98, 1153–1160. [Google Scholar]
- Paiva, D.; Walk, C.; McElroy, A. Dietary calcium, phosphorus, and phytase effects on bird performance, intestinal morphology, mineral digestibility, and bone ash during a natural necrotic enteritis episode. Poult. Sci. 2014, 93, 2752–2762. [Google Scholar]
- Lilburn, M.S.; Loeffler, S. Early intestinal growth and development in poultry. Poult. Sci. 2015, 94, 1569–1576. [Google Scholar] [CrossRef]
- Dong, Y.; Lei, J.; Zhang, B. Effects of dietary quercetin on the antioxidative status and cecal microbiota in broiler chickens fed with oxidized oil. Poult. Sci. 2020, 99, 4892–4903. [Google Scholar]
- Griela, E.; Paraskeuas, V.; Mountzouris, K.C. Effects of diet and phytogenic inclusion on the antioxidant capacity of the broiler chicken gut. Animals 2021, 11, 739. [Google Scholar] [CrossRef] [PubMed]
- Adewole, D.; Akinyemi, F. Gut microbiota dynamics, growth performance, and gut morphology in broiler chickens fed diets varying in energy density with or without bacitracin methylene disalicylate (Bmd). Microorganisms 2021, 9, 787. [Google Scholar] [CrossRef] [PubMed]
- Iji, P.A.; Saki, A.; Tivey, D.R. Body and intestinal growth of broiler chicks on a commercial starter diet. 1. Intestinal weight and mucosal development. Br. Poult. Sci. 2001, 42, 505–513. [Google Scholar] [CrossRef] [PubMed]
- De-Vries, S.; Pustjens, A.M.; Kabel, M.A.; Kwakkel, R.P.; Gerrits, W.J.J. Effects of processing technologies and pectolytic enzymes on degradability of nonstarch polysaccharides from rapeseed meal in broilers. Poult. Sci. 2014, 93, 589–599. [Google Scholar] [CrossRef]
- Uni, Z.; Noy, Y.; Sklan, D. Posthatch development of small intestinal function in the poult. Poult. Sci. 1999, 78, 215–222. [Google Scholar] [CrossRef]
- Kaoutari, A.E.; Armougom, F.; Gordon, J.I.; Raoult, D.; Henrissat, B. The abundance and variety of carbohydrate-active enzymes in the human gut microbiota. Nat. Rev. Microbiol. 2013, 11, 497–504. [Google Scholar] [CrossRef]
- Stanley, D.; Geier, M.S.; Denman, S.E.; Haring, V.R.; Crowley, T.M.; Hughes, R.J.; Moore, R.J. Identification of chicken intestinal microbiota correlated with the efficiency of energy extraction from feed. Vet. Microbiol. 2013, 164, 85–92. [Google Scholar] [CrossRef]
- Liao, X.D.; Shao, Y.X.; Sun, G.G.; Yang, Y.F.; Zhang, L.Y.; Guo, Y.L.; Luo, X.G.; Lu, L. The relationship among gutmicrobiota, short-chain fatty acids, and intestinal morphology of growingand healthy broilers. Poult. Sci. 2020, 99, 5883–5895. [Google Scholar] [CrossRef]
- Couper, L.; Swei, A. Tick microbiome characterization by next-generation 16S rRNA amplicon sequencing. J. Vis. Exp. 2018, 138, 58239. [Google Scholar]
- Liu, L.; Li, Q.; Yang, Y.; Guo, A.W. Biological function of short-chain fatty acids and its regulation on intestinal health of poultry. Front. Vet. Sci. 2021, 8, 736739. [Google Scholar] [CrossRef]
- Yang, Z.Q.; Zhang, C.H.; Wang, J.P.; Celi, P.; Ding, X.M.; Bai, S.P.; Zeng, Q.F.; Mao, X.B.; Zhuo, Y.; Xu, S.Y.; et al. Characterization of the intestinal microbiota of broiler breeders with different egg laying rate. Front. Vet. Sci. 2020, 7, 599337. [Google Scholar] [CrossRef] [PubMed]
- Caporaso, J.G.; Lauber, C.L.; Walters, W.A.; Berg-Lyons, D.; Huntley, J.; Fierer, N.; Owens, S.M.; Betley, J.; Fraser, L.; Bauer, M.; et al. Ultra-high-throughput microbial community analysis on the Illumina HiSeq and MiSeq platforms. ISME J. 2012, 6, 1621–1624. [Google Scholar] [CrossRef] [PubMed]
- Qin, X.; Xiong, T.; Xiong, S.J.; Liu, Z.G.; Xie, M.Y.; Guan, Q.Q. Metatranscriptomics unravel the formation mechanism of key flavors during the natural fermentation of suansun. Food Biosci. 2024, 53, 103436. [Google Scholar]
- Nancy, S.; Boparai, J.K.; Sharma, P.K. Metatranscriptomics: A promising tool to depict dynamics of microbial community structure and function. In Microbial Metatranscriptomics Belowground; Springer: Berlin/Heidelberg, Germany, 2021. [Google Scholar]


| Item | NE Level MJ/kg | Lys Level% | NE/Lys |
|---|---|---|---|
| Group I | 8.93 | 1.0 | 8.93 |
| Group II | 8.93 | 1.5 | 5.95 |
| Group III | 9.76 | 1.0 | 9.76 |
| Group IV | 9.76 | 1.5 | 6.51 |
| Item | Group | |||
|---|---|---|---|---|
| I | II | III | IV | |
| Corn | 65.33 | 62.24 | 60.91 | 60.91 |
| Soybean meal | 27.34 | 27.06 | 27.57 | 26.23 |
| Soybean oil | 0.90 | 2.80 | 4.71 | 4.71 |
| Domestic extruded soybean | 2 | 2 | 2 | 2 |
| Corn gluten meal | 0.56 | 0.73 | 0.90 | 0.90 |
| NaHCO3 | 1.50 | 1.51 | 1.52 | 1.52 |
| Limestone | 1.43 | 1.43 | 1.43 | 1.43 |
| NaCl | 0.25 | 0.25 | 0.25 | 0.25 |
| L-lysine hydrochloride | 0.10 | 0.75 | 0.12 | 0.80 |
| DL-Met | 0.25 | 0.50 | 0.24 | 0.50 |
| Salinomycin | 0.05 | 0.05 | 0.05 | 0.05 |
| Premix 1 | 0.20 | 0.20 | 0.20 | 0.20 |
| L-Thr | 0.09 | 0.48 | 0.10 | 0.50 |
| Total | 100 | 100 | 100 | 100 |
| Nutrient level 2 | ||||
| Poultry ME (MJ/kg) | 12.45 | 12.45 | 13.28 | 13.28 |
| Poultry NE (MJ/kg) | 8.93 | 8.93 | 9.76 | 9.76 |
| Crude protein (%) | 21.50 | 21.50 | 21.50 | 21.50 |
| Ca (%) | 0.95 | 0.95 | 0.96 | 0.95 |
| Non-phytic acid phosphor (%) | 0.33 | 0.33 | 0.33 | 0.33 |
| Lys (%) | 1 | 1.50 | 1 | 1.50 |
| Met (%) | 0.53 | 0.78 | 0.52 | 0.77 |
| Met + Cys (%) | 0.84 | 1.08 | 0.83 | 1.07 |
| Try (%) | 0.20 | 0.19 | 0.20 | 0.19 |
| Ile (%) | 0.76 | 0.75 | 0.77 | 0.74 |
| Arg (%) | 1.19 | 1.18 | 1.19 | 1.14 |
| Thr (%) | 0.82 | 1.19 | 0.83 | 1.19 |
| Dlys (%) | 0.87 | 1.30 | 0.87 | 1.31 |
| DMet (%) | 0.48 | 0.71 | 0.47 | 0.70 |
| DMet + DCys (%) | 0.76 | 1 | 0.74 | 0.99 |
| DThr (%) | 0.74 | 1.07 | 0.75 | 1.06 |
| DTry (%) | 0.18 | 0.17 | 0.18 | 0.17 |
| DArg (%) | 1.09 | 1.08 | 1.09 | 1.05 |
| NE/Lys | Sex | IABW/g | 1–7 d | 1–17 d | ||||||
|---|---|---|---|---|---|---|---|---|---|---|
| FABW/g | FCR | ADGW/g | ADFI/g | FABW/g | FCR | ADGW/g | ADFI/g | |||
| I (8.93) | Male | 42.20 | 200.67 | 0.92 | 22.64 | 20.84 | 707.33 | 1.20 | 39.12 | 46.89 |
| Female | 41.50 | 197.33 | 0.91 | 22.22 | 20.22 | 684.67 | 1.16 | 37.83 | 43.64 | |
| II (5.93) | Male | 41.62 | 195.67 | 0.94 | 22.07 | 20.75 | 661.00 | 1.21 | 36.43 | 44.04 |
| Female | 42.25 | 192.00 | 0.98 | 21.31 | 20.88 | 651.67 | 1.31 | 35.85 | 47.06 | |
| III (9.76) | Male | 42.35 | 194.33 | 0.99 | 21.80 | 21.58 | 700.67 | 1.19 | 38.72 | 45.96 |
| Female | 42.42 | 197.00 | 0.93 | 22.15 | 20.60 | 682.67 | 1.13 | 37.66 | 42.73 | |
| IV (6.50) | Male | 41.50 | 195.67 | 0.93 | 22.04 | 20.50 | 652.00 | 1.22 | 35.90 | 43.62 |
| Female | 42.40 | 192.33 | 0.97 | 21.33 | 20.69 | 638.00 | 1.25 | 35.03 | 43.83 | |
| SEM | 0.32 | 6.35 | 0.03 | 0.90 | 0.99 | 10.16 | 0.05 | 0.60 | 1.77 | |
| Main effect | ||||||||||
| NE/Lys | I (8.93) | 41.85 | 199.00 | 0.92 | 22.45 | 20.53 | 696.00 A | 1.18 | 38.48 A | 45.27 |
| II (5.93) | 41.93 | 193.83 | 0.96 | 21.70 | 20.82 | 656.33 B | 1.26 | 36.14 B | 45.55 | |
| III (9.76) | 42.38 | 195.67 | 0.96 | 21.90 | 21.09 | 691.67 A | 1.16 | 38.19 A | 44.34 | |
| IV (6.50) | 42.09 | 194.00 | 0.95 | 21.70 | 20.60 | 645.00 B | 1.23 | 35.47 B | 43.72 | |
| Sex | Male | 41.99 | 196.58 | 0.95 | 22.08 | 20.92 | 680.25 a | 1.20 | 37.54 a | 45.13 |
| Female | 42.14 | 194.67 | 0.95 | 21.79 | 20.60 | 664.25 b | 1.21 | 36.59 b | 44.32 | |
| p-value | ||||||||||
| NE/Lys | 0.395 | 0.835 | 0.361 | 0.818 | 0.941 | <0.001 | 0.225 | <0.001 | 0.720 | |
| Sex | 0.510 | 0.675 | 0.968 | 0.652 | 0.653 | 0.041 | 0.756 | 0.039 | 0.526 | |
| NE/Lys × Sex | 0.173 | 0.949 | 0.357 | 0.943 | 0.916 | 0.924 | 0.425 | 0.944 | 0.263 | |
| NE/Lys | Sex | 1–7 d | 1–17 d | ||||||||
|---|---|---|---|---|---|---|---|---|---|---|---|
| Glandular g/kg | Gizzard g/kg | Duodenum /cm | Jejunum /cm | Ileum /cm | Glandular g/kg | Gizzard g/kg | Duodenum /cm | Jejunum /cm | Ileum /cm | ||
| I (8.93) | Male | 6.74 | 26.21 | 19.68 | 41.97 | 38.52 | 5.47 | 21.48 | 26.58 | 63.50 | 64.50 |
| Female | 6.41 | 27.25 | 20.00 | 46.08 | 45.12 | 5.50 | 23.78 | 24.42 | 60.25 | 57.50 | |
| II (5.93) | Male | 7.31 | 25.71 | 19.80 | 45.00 | 42.18 | 5.74 | 23.59 | 24.83 | 55.33 | 57.25 |
| Female | 6.55 | 27.30 | 22.00 | 47.17 | 46.00 | 5.79 | 24.35 | 22.42 | 52.33 | 49.50 | |
| III (9.76) | Male | 7.59 | 26.74 | 19.67 | 43.42 | 40.67 | 5.21 | 23.93 | 25.75 | 60.33 | 61.83 |
| Female | 7.32 | 26.89 | 20.25 | 45.92 | 44.50 | 5.34 | 23.03 | 23.92 | 58.42 | 55.58 | |
| IV (6.50) | Male | 7.23 | 28.06 | 18.47 | 42.72 | 40.92 | 6.08 | 24.09 | 24.00 | 54.85 | 55.18 |
| Female | 7.67 | 27.78 | 20.67 | 44.25 | 42.67 | 6.28 | 25.76 | 23.25 | 59.92 | 57.17 | |
| SEM | 0.14 | 0.45 | 0.30 | 0.60 | 0.51 | 0.10 | 0.33 | 0.29 | 0.86 | 0.91 | |
| Main effect | |||||||||||
| NE/Lys | I (8.93) | 6.58 | 26.73 | 19.84 | 44.03 | 41.82 | 5.49 b | 22.63 | 25.50 | 61.88 a | 61.00 a |
| II (5.93) | 6.93 | 26.50 | 20.90 | 46.08 | 44.09 | 5.77 ab | 23.97 | 23.63 | 53.83 b | 53.38 b | |
| III (9.76) | 7.46 | 26.81 | 19.96 | 44.67 | 42.58 | 5.28 b | 23.48 | 24.83 | 59.38 a | 58.71 a | |
| IV (6.50) | 7.45 | 27.92 | 19.57 | 43.48 | 41.79 | 6.18 a | 24.93 | 23.63 | 57.38 b | 56.18 b | |
| Sex | Male | 7.22 | 26.68 | 19.40 b | 43.28 b | 40.57 B | 5.62 | 23.27 | 25.29 A | 58.50 | 59.69 a |
| Female | 6.99 | 27.30 | 20.73 a | 45.85 a | 44.57 A | 5.73 | 24.23 | 23.50 B | 57.73 | 54.94 b | |
| p-value | |||||||||||
| NE/Lys | 0.109 | 0.691 | 0.434 | 0.472 | 0.37 | 0.027 | 0.134 | 0.085 | 0.03 | 0.049 | |
| Sex | 0.421 | 0.496 | 0.039 | 0.046 | 0.001 | 0.601 | 0.161 | 0.006 | 0.66 | 0.019 | |
| NE/Lys × Sex | 0.519 | 0.88 | 0.543 | 0.887 | 0.438 | 0.987 | 0.369 | 0.747 | 0.31 | 0.239 | |
| NE/Lys | Sex | 1–7 d | 1–17 d | ||||
|---|---|---|---|---|---|---|---|
| VH/μm | CD/μm | VH/CD | VH/μm | CD/μm | VH/CD | ||
| I (8.93) | Male | 632.63 | 127.73 | 4.97 | 541.21 | 147.19 | 3.68 |
| Female | 787.52 | 187.32 | 4.21 | 834.63 | 141.79 | 5.89 | |
| II (5.93) | Male | 567.26 | 212.10 | 2.76 | 828.73 | 164.31 | 5.05 |
| Female | 702.71 | 142.38 | 4.94 | 743.67 | 204.70 | 3.72 | |
| III (9.76) | Male | 709.70 | 193.27 | 3.67 | 602.97 | 180.38 | 3.34 |
| Female | 829.24 | 140.48 | 5.90 | 833.64 | 125.83 | 6.63 | |
| IV (6.50) | Male | 653.93 | 136.94 | 4.78 | 808.60 | 192.86 | 4.19 |
| Female | 660.26 | 134.20 | 4.92 | 826.54 | 143.33 | 5.77 | |
| SEM | 48.09 | 13.79 | 0.36 | 33.01 | 13.36 | 0.37 | |
| Main effect | |||||||
| NE/Lys | I (8.93) | 710.07 | 157.53 | 4.59 | 687.92 d | 144.49 | 4.79 ab |
| II (5.93) | 634.99 | 177.24 | 3.85 | 786.20 ab | 184.51 | 4.38 c | |
| III (9.76) | 769.47 | 166.88 | 4.79 | 718.31 c | 153.11 | 4.99 a | |
| IV (6.50) | 657.09 | 135.57 | 4.85 | 817.57 a | 168.10 | 4.98 a | |
| Sex | Male | 640.88 | 167.51 | 4.04 b | 695.38 b | 171.19 | 4.07 b |
| Female | 744.93 | 151.10 | 4.99 a | 809.62 a | 153.91 | 5.50 a | |
| p-value | |||||||
| NE/Lys | 0.281 | 0.231 | 0.240 | 0.111 | 0.187 | 0.48 | |
| Sex | 0.062 | 0.245 | 0.040 | 0.022 | 0.224 | 0.024 | |
| NE/Lys × Sex | 0.604 | 0.041 | 0.059 | 0.032 | 0.091 | 0.048 | |
| Items | SEM | Main Effect | p-Value | |||||||||||||||
|---|---|---|---|---|---|---|---|---|---|---|---|---|---|---|---|---|---|---|
| NE/Lys | I (8.93) | II (5.93) | III (9.76) | IV (6.50) | NE/Lys | Sex | NE/Lys | Sex | NE/Lys ×Sex | |||||||||
| Sex | Male | Female | Male | Female | Male | Female | Male | Female | I (8.93) | II (5.93) | III (9.76) | IV (6.50) | Male | Female | ||||
| Firmicutes_A | 0.742 | 0.792 | 0.699 | 0.724 | 0.524 | 0.646 | 0.646 | 0.686 | 0.035 | 0.767 | 0.711 | 0.585 | 0.666 | 0.653 | 0.712 | 0.346 | 0.413 | 0.962 |
| Bacteroidota | 0.067 | 0.028 | 0.132 | 0.11 | 0.182 | 0.242 | 0.164 | 0.098 | 0.042 | 0.047 | 0.121 | 0.212 | 0.131 | 0.136 | 0.119 | 0.598 | 0.839 | 0.956 |
| Firmicutes_D | 0.135 | 0.064 | 0.083 | 0.063 | 0.118 | 0.059 | 0.075 | 0.094 | 0.013 | 0.099 | 0.073 | 0.089 | 0.084 | 0.103 | 0.07 | 0.911 | 0.224 | 0.61 |
| Proteobacteria | 0.035 | 0.051 | 0.075 | 0.043 | 0.158 | 0.002 | 0.104 | 0.075 | 0.016 | 0.043 | 0.059 | 0.08 | 0.089 | 0.093 | 0.043 | 0.747 | 0.143 | 0.317 |
| Actinobacteriota | 0.014 | 0.058 | 0.002 | 0.022 | 0.006 | 0.022 | 0.003 | 0.007 | 0.007 | 0.036 | 0.012 | 0.014 | 0.005 | 0.006 | 0.027 | 0.516 | 0.181 | 0.819 |
| Firmicutes_C | 4.62 × 10⁻⁵ | 4.74 × 10⁻⁵ | −5.42 × 10⁻²⁰ | −5.42 × 10⁻²⁰ | 0 | 0.001 | −5.42 × 10⁻²⁰ | 5.81 × 10⁻⁵ | 0 | 4.68 × 10⁻⁵ | −5.42 × 10⁻²⁰ | 0.001 | 2.90 × 10⁻⁵ | 1.16 × 10⁻⁵ | 0 | 0.45 | 0.313 | 0.431 |
| Campylobacterota | −6.94 × 10⁻¹⁸ | 0 | 0 | 0.022 | 1.62 × 10⁻⁵ | 0.023 | 4.39 × 10⁻⁵ | 0.032 | 0.005 | 0 | 0.011 | 0.012 | 0.016 | 1.50 × 10⁻⁵ | 0.019 | 0.726 | 0.077 | 0.727 |
| Cyanobacteria | 0 | 0 | 6.91 × 10⁻⁵ | 0.006 | 1.78 × 10⁻⁵ | 0 | 0 | 6.13 × 10⁻⁵ | 0.001 | 0 | 0.003 | 8.44 × 10⁻⁵ | 0 | 0 | 0.002 | 0.439 | 0.357 | 0.417 |
| Firmicutes_B | 0 | 0 | 1.75 × 10⁻⁵ | 9.14 × 10⁻⁵ | 6.99 × 10⁻⁵ | 0.001 | 5.23 × 10⁻⁵ | 0 | 0 | 0 | 5.45 × 10⁻⁵ | 0 | 0 | 3.49 × 10⁻⁵ a | 0 b | 0.216 | 0.017 | 0.305 |
| Acidobacteriota | 2.31 × 10⁻⁵ | 0 | 7.09 × 10⁻⁵ | 5.87 × 10⁻⁵ | 4.85 × 10⁻⁵ | 2.08 × 10⁻⁵ | 6.66 × 10⁻⁵ | 1.75 × 10⁻⁵ | 0 | 1.16 × 10⁻⁵ | 6.48 × 10⁻⁵ | 3.46 × 10⁻⁵ | 4.21 × 10⁻⁵ | 5.23 × 10⁻⁵ | 2.43 × 10⁻⁵ | 0.519 | 0.275 | 0.96 |
| Desulfobacterota_I | 0 | −6.78 × 10⁻²¹ | −1.06 × 10⁻²¹ | −6.78 × 10⁻²¹ | 4.66 × 10⁻²¹ | 0 | 4.04 × 10⁻⁵ | 3.91 × 10⁻⁵ | 0 | 6.03 × 10⁻⁵ | −3.92 × 10⁻²¹ | 2.33 × 10⁻²¹ | 3.97 × 10⁻⁵ | 4.03 × 10⁻⁵ | 9.78 × 10⁻⁶ | 0.146 | 0.165 | 0.146 |
| Spirochaetota | 7.71 × 10⁻⁵ | 6.78 × 10⁻²¹ | −3.39 × 10⁻²¹ | 0 | 0 | 6.78 × 10⁻²¹ | 6.78 × 10⁻²¹ | 2.88 × 10⁻⁵ | 0 | 3.85 × 10⁻⁵ | −1.69 × 10⁻²¹ | 0 | 1.44 × 10⁻⁵ | 1.93 × 10⁻⁵ | 7.19 × 10⁻⁶ | 0.137 | 0.347 | 0.047 |
| Chloroflexota | −1.69 × 10⁻²¹ | −1.69 × 10⁻²¹ | 0 | 0 | 6.78 × 10⁻²¹ | 3.21 × 10⁻⁵ | 0 | −3.39 × 10⁻²¹ | 0 | −1.69 × 10⁻²¹ | 0 | 1.61 × 10⁻⁵ | −1.69 × 10⁻²¹ | −1.69 × 10⁻²¹ | 8.04 × 10⁻⁶ | 0.418 | 0.332 | 0.418 |
| Gemmatimonadota | 0 | 0 | 1.75 × 10⁻⁵ | 0 | 0 | 3.11 × 10⁻⁵ | 0 | 3.39 × 10⁻²¹ | 0 | 0 | 8.74 × 10⁻⁶ | 1.56 × 10⁻⁵ | 1.69 × 10⁻²¹ | 4.37 × 10⁻⁶ | 7.79 × 10⁻⁶ | 0.557 | 0.707 | 0.314 |
| Verrucomicrobiota | 2.12 × 10⁻²¹ | 1.99 × 10⁻⁵ | 0 | 8.47 × 10⁻²² | 2.67 × 10⁻⁵ | −4.24 × 10⁻²² | 3.51 × 10⁻⁵ | −4.66 × 10⁻²¹ | 0 | 9.96 × 10⁻⁶ | 0 | 1.34 × 10⁻⁵ | 1.75 × 10⁻⁵ | 1.55 × 10⁻⁶ | 4.98 × 10⁻⁶ | 0.767 | 0.399 | 0.384 |
| Desulfobacterota_B | 4.24 × 10⁻²² | 4.24 × 10⁻²² | 3.95 × 10⁻⁵ | 3.05 × 10⁻⁵ | 4.24 × 10⁻²² | 4.24 × 10⁻²² | 2.12 × 10⁻²¹ | −1.27 × 10⁻²¹ | 0 | 4.24 × 10⁻²² | 3.50 × 10⁻⁵ | 4.24 × 10⁻²² | 4.24 × 10⁻²² | 9.88 × 10⁻⁶ | 7.62 × 10⁻⁶ | 0.16 | 1 | 1 |
| Nitrospirota_A | 1.69 × 10⁻²¹ | 0 | 0 | 1.69 × 10⁻²¹ | 0 | 3.39 × 10⁻²¹ | 2.29 × 10−05 | −1.69 × 10⁻²¹ | 0 | 0 | 0 | 1.69 × 10⁻²¹ | 1.15 × 10⁻⁵ | 5.73 × 10⁻⁶ | 8.47 × 10⁻²² | 0.418 | 0.332 | 0.418 |
| Items | SEM | Main Effect | p-Value | |||||||||||||||
|---|---|---|---|---|---|---|---|---|---|---|---|---|---|---|---|---|---|---|
| NE/Lys | I (8.93) | II (5.93) | III (9.76) | IV (6.50) | NE/Lys | Sex | NE/Lys | Sex | NE/Lys × Sex | |||||||||
| Sex | Male | Female | Male | Female | Male | Female | Male | Female | I (8.93) | II (5.93) | III (9.76) | IV (6.50) | Male | Female | ||||
| Firmicutes_A | 0.435 | 0.506 | 0.547 | 0.734 | 0.541 | 0.349 | 0.608 | 0.55 | 0.046 | 0.471 | 0.641 | 0.445 | 0.579 | 0.533 | 0.535 | 0.428 | 0.982 | 0.526 |
| Bacteroidota | 0.4 | 0.293 | 0.359 | 0.036 | 0.327 | 0.409 | 0.292 | 0.367 | 0.043 | 0.347 | 0.197 | 0.368 | 0.329 | 0.344 | 0.276 | 0.513 | 0.442 | 0.33 |
| Firmicutes_D | 0.055 | 0.046 | 0.067 | 0.061 | 0.049 | 0.049 | 0.073 | 0.053 | 0.009 | 0.05 | 0.064 | 0.049 | 0.063 | 0.061 | 0.052 | 0.889 | 0.627 | 0.982 |
| Proteobacteria | 0.008 | 0.032 | 0.008 | 0.006 | 0.037 | 0.063 | 0.013 | 0.002 | 0.009 | 0.02 | 0.007 | 0.05 | 0.007 | 0.017 | 0.026 | 0.295 | 0.622 | 0.832 |
| Actinobacteriota | 0.011 | 0.107 | 0.007 | 0.103 | 0.024 | 0.015 | 0.003 | 0.01 | 0.016 | 0.059 | 0.055 | 0.02 | 0.007 | 0.011 | 0.059 | 0.596 | 0.157 | 0.529 |
| Firmicutes_C | 0.08 | 5.811 × 10⁻⁵ | 0 | 1.00 × 10⁻³ | 2.772 × 10⁻⁵ | 0.101 | 0 | 0 | 0.012 | 0.04 | 0 | 0.05 | 0 | 0.02 | 0.025 | 0.353 | 0.83 | 0.114 |
| Campylobacterota | 3.00 × 10⁻³ | 0.004 | 0.003 | 0.022 | 0.003 | 0.003 | 0 | 0.006 | 0.003 | 0.004 | 0.013 | 0.003 | 0.003 | 0.002 | 0.009 | 0.581 | 0.282 | 0.672 |
| Cyanobacteria | 0 | 0.001 | 0.001 | 0.031 | 0.007 | 0.003 | 0.004 | 0.005 | 0.003 | 0 | 0.016 | 0.005 | 0.005 | 0.003 | 0.01 | 0.417 | 0.316 | 0.28 |
| Firmicutes_B | 0.001 | 0.001 | 0 | 0.002 | 0 | 0 | 0 | 0.001 | 0 | 0.001 | 0.001 | 0 | 0.001 | 0 | 0.001 | 0.714 | 0.387 | 0.378 |
| Acidobacteriota | 5.168 × 10⁻⁵ | 0 | 1.977 × 10⁻⁵ | 3.590 × 10⁻⁵ | 0 | 3.900 × 10⁻⁵ | 5.499 × 10⁻⁵ | 5.106 × 10⁻⁵ | 0 | 2.584 × 10⁻⁵ | 2.783 × 10⁻⁵ | 1.950 × 10⁻⁵ | 5.303 × 10⁻⁵ | 3.161 × 10⁻⁵ | 3.149 × 10⁻⁵ | 0.6 | 1 | 0.38 |
| Desulfobacterota_I | 0 | 2.91 × 10⁻⁵ | 2.97 × 10⁻⁵ | 0 | 1.694 × 10⁻²¹ | 3.452 × 10⁻⁵ | 0 | 4.204 × 10⁻⁵ | 0 | 1.453 × 10⁻⁵ | 1.48 × 10⁻⁵ | 1.726 × 10⁻⁵ | 2.102 × 10⁻⁵ | 7.413 × 10⁻⁶ | 2.640 × 10⁻⁵ | 0.992 | 0.283 | 0.452 |
| Spirochaetota | 2.878 × 10⁻⁵ | 3.874 × 10⁻⁵ | 1.27 × 10⁻²¹ | 1.271 × 10⁻²¹ | 1.386 × 10⁻⁵ | 8.470 × 10⁻²² | 8.470 × 10⁻²² | −2.54 × 10⁻²¹ | 0 | 3.376 × 10⁻⁵ | 1.27 × 10⁻²¹ | 6.931 × 10⁻⁶ | −8.47 × 10⁻²² | 1.066 × 10⁻⁵ | 9.684 × 10⁻⁶ | 0.22 | 1 | 0.927 |
| Chloroflexota | 0 | 0 | 0 | 5.983 × 10⁻⁵ | −6.78 × 10⁻²¹ | 3.900 × 10⁻⁵ | −1.69 × 10⁻²¹ | 1.69 × 10⁻²¹ | 0 | 0 | 2.992 × 10⁻⁵ | 1.950 × 10⁻⁵ | 0 | 1.694 × 10⁻²¹ | 2.471 × 10⁻⁵ | 0.467 | 0.137 | 0.467 |
| Gemmatimonadota | −2.47 × 10⁻²¹ | 2.905 × 10⁻⁵ | 2.792 × 10⁻⁵ | 2.052 × 10⁻⁵ | 7.764 × 10⁻²² | −2.12 × 10⁻²² | −2.61 × 10⁻²¹ | 7.694 × 10⁻²¹ | 0 | 1.453 × 10⁻⁵ | 2.422 × 10⁻⁵ | 2.823 × 10⁻²² | 2.541 × 10⁻²¹ | 6.980 × 10⁻⁶ | 1.239 × 10⁻⁵ | 0.377 | 0.639 | 0.681 |
| Verrucomicrobiota | 0 | 2.142 × 10⁻⁵ | 0 | 0 | 0 | 0 | 0 | 0 | 0 | 1.071 × 10⁻⁵ | 0 | 0 | 0 | 0 | 5.354 × 10⁻⁶ | 0.418 | 0.332 | 0.418 |
| Firmicutes_G | 0 | 0 | 0 | 0 | 7.855 × 10⁻⁵ | 0 | −6.78 × 10⁻²¹ | 0 | 0 | 0 | 0 | 3.927 × 10⁻⁵ | −3.39 × 10⁻²¹ | 1.964 × 10⁻⁵ | 0 | 0.418 | 0.332 | 0.418 |
| Myxococcota_A | −3.39 × 10⁻²¹ | 1.937 × 10⁻⁵ | −3.39 × 10⁻²¹ | −3.39 × 10⁻²¹ | −3.39 × 10⁻²¹ | 2.878 × 10⁻⁵ | −3.39 × 10⁻²¹ | 1.953 × 10⁻⁵ | 0 | 9.684 × 10⁻⁶ | −3.39 × 10⁻²¹ | 1.439 × 10⁻⁵ | 9.767 × 10⁻⁶ | −2.97 × 10⁻²¹ | 1.692 × 10⁻⁵ | 0.776 | 0.108 | 0.776 |
| Nitrospirota_A | 0 | 0 | 0 | 0 | 0 | 2.589 × 10⁻⁵ | 0 | 9.49 × 10⁻⁶ | 0 | 0 | 0 | 1.295 × 10⁻⁵ | 4.745 × 10⁻⁶ | 8.470 × 10⁻²² | 8.846 × 10⁻⁶ | 0.52 | 0.218 | 0.52 |
| Desulfobacterota_G | 0 | 0 | 0 | 4.787 × 10⁻⁵ | 0 | 0 | 0 | 0 | 0 | 0 | 2.393 × 10⁻⁵ | 0 | 0 | 0 | 1.197 × 10⁻⁵ | 0.418 | 0.332 | 0.418 |
Disclaimer/Publisher’s Note: The statements, opinions and data contained in all publications are solely those of the individual author(s) and contributor(s) and not of MDPI and/or the editor(s). MDPI and/or the editor(s) disclaim responsibility for any injury to people or property resulting from any ideas, methods, instructions or products referred to in the content. |
© 2025 by the authors. Licensee MDPI, Basel, Switzerland. This article is an open access article distributed under the terms and conditions of the Creative Commons Attribution (CC BY) license (https://creativecommons.org/licenses/by/4.0/).
Share and Cite
Ban, Z.; Chen, S.; Li, L.; Zhang, Q.; Zhao, X.; Liang, H.; Guo, Y. Effects of Dietary Net Energy/Lysine Ratio and Sex on Growth Performance, Digestive Organ Development, and Cecal Microbiota of Broiler Chickens. Animals 2025, 15, 1572. https://doi.org/10.3390/ani15111572
Ban Z, Chen S, Li L, Zhang Q, Zhao X, Liang H, Guo Y. Effects of Dietary Net Energy/Lysine Ratio and Sex on Growth Performance, Digestive Organ Development, and Cecal Microbiota of Broiler Chickens. Animals. 2025; 15(11):1572. https://doi.org/10.3390/ani15111572
Chicago/Turabian StyleBan, Zhibin, Simiao Chen, Lijia Li, Qiyu Zhang, Xiaodong Zhao, Hao Liang, and Yuming Guo. 2025. "Effects of Dietary Net Energy/Lysine Ratio and Sex on Growth Performance, Digestive Organ Development, and Cecal Microbiota of Broiler Chickens" Animals 15, no. 11: 1572. https://doi.org/10.3390/ani15111572
APA StyleBan, Z., Chen, S., Li, L., Zhang, Q., Zhao, X., Liang, H., & Guo, Y. (2025). Effects of Dietary Net Energy/Lysine Ratio and Sex on Growth Performance, Digestive Organ Development, and Cecal Microbiota of Broiler Chickens. Animals, 15(11), 1572. https://doi.org/10.3390/ani15111572