Article

Effect of GnRHR, BMP6 and FSHR Gene Pyramiding on Litter Traits of Goats

1
College of Animal Science, South China Agricultural University, Guangzhou 510642, China
2
State Key Laboratory of Animal Nutrition and Feeding, College of Animal Science and Technology, China Agricultural University, Beijing 100193, China
*
Authors to whom correspondence should be addressed.
Animals 2025, 15(10), 1358; https://doi.org/10.3390/ani15101358
Submission received: 10 April 2025 / Revised: 5 May 2025 / Accepted: 6 May 2025 / Published: 8 May 2025
(This article belongs to the Special Issue Polygene and Polyprotein Research on Reproductive Traits of Livestock)

Simple Summary

With the increasing demand for goat meat by humans, increasing goat production to meet the demand for a healthy diet is an urgent task in the current livestock industry. In the production of small ruminants, it is particularly important to enhance their reproductive capacity, especially the litter-giving characteristics of does. Identifying key fecundity genes and utilizing polygene polymerizing effect analysis in goats can enhance litter size and improve production efficiency in the livestock industry. This study aimed to identify SNPs in the GnRHR, BMP6, and FSHR genes across four goat breeds, examine their association with litter size, and analyze the polygenic pyramiding effect on goat prolificacy. Our research identified four SNPs, and polygene polymerizing effect analysis further determined the optimal combination genotype that affects high prolificacy in goats. Overall, our results provide a foundation for molecular marker selection related to goat litter-size traits and a useful strategy for the further development of goat breeding.

Abstract

Many studies have shown that only a few breeds of goat have the trait of high fertility, and genes play an important role in regulating litter size. This study investigated the effects of GnRHR, BMP6, and FSHR gene polymorphisms on litter traits in four goat breeds (Chongqing black, Chuanzhong black, Leizhou, and Nubian). Single nucleotide polymorphisms (SNPs) (g.75G > A in GnRHR, g.951T > C in BMP6, and g.-112C > T/g.3236C > A in FSHR) were genotyped using PCR-RFLP/HRM in 959 goats. Association analysis revealed significant correlations between these SNPs and litter size in the Chongqing, Chuanzhong, and Leizhou breeds, with genotypes AA (GnRHR), CC (BMP6), TT (FSHR), and AA (FSHR) linked to higher prolificacy. Polygene polymerizing effect analysis identified the optimal combinations (e.g., AATTCC, AACCAACC) with enhanced litter sizes. Tissue-specific qPCR in Chuanzhong goats showed GnRHR, BMP6, and FSHR were significantly more highly expressed in reproductive tissues (pituitary, breast, ovary, oviduct) of the prolific group than those in the non-prolific group. These SNPs serve as potential molecular markers for improving goat litter traits through polygenic selection, emphasizing the synergistic impact of multi-gene interactions on prolificacy.

1. Introduction

Utilizing molecular genetics techniques is a powerful approach for selecting and breeding animals with superior reproductive traits [1,2]. Numerous single nucleotide polymorphisms (SNPs) affecting goat litter size have been identified [3,4], yet most studies focus on single molecular markers, with limited research on multi-gene polymerization. Some traits or functions of biological organisms are controlled by multiple genes and belong to a regulatory network consisting of multiple genes and their products. Therefore, the effect of single genetic markers is relatively small and often cannot be practically applied in production, and polygenic polymerization is the first step to open the regulatory network of complex traits. In this study, the gonadotropin-releasing hormone receptor (GnRHR), bone morphogenetic protein 6 (BMP6) and follicle-stimulating hormone (FSH) receptor (FSHR) genes, which were the most prevalent, were used as candidate genes.
GnRHR gene is a high-affinity G-protein-coupled receptor of the pituitary gonadotropin membrane, which is located on chromosome 6 of sheep and is composed of 3 exons and 2 introns [5,6]. GnRHR gene as an essential mediator in the Gonadotropin-releasing hormone (GnRH) signaling pathway, GnRHR coupled to GnRH, plays an important role in activating the downstream pathway after stimulating a series of cascades to regulate reproduction [7]. In addition, GnRHR can transduce the signal of GnRH produced in the hypothalamus, regulate the synthesis and release of FSH and LH in the anterior pituitary, thereby promoting the growth, maturation and regulation of the reproductive performance of the gonad tissue.
BMP6 gene is a member of the bone morphogenetic proteins (BMPs), which are members of the TGF-β superfamily. BMP6 cDNA was first isolated from mouse embryos by Lyons et al. [8]. Recent studies have found that the BMP6 gene directly participates in the regulation of the synthesis and secretion of reproduction-related hormones by inhibiting or promoting the activity of related enzymes or hormones in the body, thus affecting the formation and development of reproductive organs. For example, the BMP6 gene can stimulate the synthesis of FSH via the autocrine or paracrine pathway [9,10,11]. El-Halawany et al. investigated the effect of BMP6 gene polymorphisms on Egyptian sheep fecundity and its transcript expression in ovarian cells, but the result showed that the mutations of BMP6 had no significance for litter size [12].
The FSHR gene, which contains 10 exons and 9 introns, is a glycoprotein family member of the G-protein-coupled receptor super-family, which mainly encodes the transmembrane domain and the intracellular domain in the 10th exon [13]. FSHR cDNA was first cloned from rat Sertoli cells in 1990 and its genetic mutations may affect the ability of FSH signal transduction [14]. More importantly, FSHR plays an important role in regulating the growth, development, differentiation and maturation of animal follicles. Borgbo et al. found that FSHR deficiency in Homo sapiens can lead to primary infertility [15]. Several studies have demonstrated that mutations of the FSHR gene were significantly associated with litter size in Hu sheep, Small Tailed Han sheep and Jining Grey goats [16,17,18]. Additionally, one study showed that the ovine FSHR gene was expressed widely and was significantly higher in sexual glands (testicle and ovary) than in other tissues [19].
This study analyzed four goat breeds: Chongqing black goat (CQ), Chuanzhong black goat (CZ), Leizhou goat (LZ), and Nubian goat (NS). Among them, NS were imported from abroad and then cultivated by local people, while the other three breeds are local goats in China. GnRHR, BMP6 and FSHR genes have been extensively studied in pigs, sheep and other livestock, but most of them are based on the effects of a single-marker on fecundity. So far, no reports have been published on the analysis of the pyramiding effect of these three genes in goats. Although the polygene breeding of plants has achieved initial success, there were almost no reports of success on goat breeding. The aim of this study is to detect the SNPs of GnRHR, BMP6, and FSHR genes in four goat breeds, investigate their relationship with litter size, and analyze the polygene pyramiding effect on goat prolificacy, providing a basis for molecular marker selection for goat litter-size traits.

2. Materials and Methods

2.1. Experimental Materials

A total of 959 does were collected, including 290 LZ from Wuzhou company Shengzhou breeding goat farm (Wuzhou, China), 391 NS from Lezhu breeding goat farm of Xinxing County WENS Xinwang Goat Industry Co., Ltd. (Yunfu, China), 91 CQ and 187 CZ from Liangdong breeding goat farm of Xinxing County WENS Xinwang Goat Industry Co., Ltd. (Yunfu, China). All goats were raised in the same managed conditions. Venous jugular blood samples (5 mL per doe) were collected from these does in 2017, using acid citrate dextrose as an anticoagulant, and stored at −20 °C until DNA extraction; at the same time, the data on litter size in the first, second, third, or fourth parity of each individual were recorded in detail.
In addition, 8 CZ does were selected from Liangdong breeding goat farm of Xinxing County WENS Xinwang Goat Industry Co., Ltd. (Yunfu, China), which were equally divided into a non-prolific group (single lambs in three to four consecutive parities) and a prolific group (multiple lambs in three to four consecutive parities). All goats, aged 3–4 years, healthy, were in the artificial insemination system. Twelve tissue samples (heart, liver, spleen, lung, kidney, dorsal longest muscle, hypothalamus, pituitary, ovary, oviduct, uterus and breast) were taken from different parts of each goat, and immediately placed in liquid nitrogen and then stored at −80 °C until RNA extraction.

2.2. DNA Extraction

Genomic DNA was extracted from whole blood with Tissue DNA Kit D3396 kit, and detected by electrophoresis on 1% agarose gels (TaKaRa, Osaka, Japan); then, the concentration and purity of DNA fragment was detected by nanodrop spectrophotometer, and kept at −20 °C.

2.3. RNA Extraction and cDNA Synthesis

Total RNA was extracted from caprine tissues using a kit according to the instructions of the manufacturer (Total RNA Kit R6731, OMEGA, Bienne, Switzerland). RNA integrity was ascertained by agarose gel electrophoresis, and the purity and concentration of RNA were determined by spectrophotometer. A measure of 1 μg of total RNA was used for reverse transcription in a final volume of 20 μL according to the manufacturer’s recommendations (PrimeScriptTM RT reagent Kit with gDNA Eraser, TaKaRa, Japan). Synthesized cDNA was stored at −20 °C until further use.

2.4. Primers Design

Using Primer Primier 5.0 software, design universal primers and real-time PCR primers for GnRHR, BMP6, FSHR, and β-actin genes based on GenBank sequences (the accession number of goat genomic GnRHR, BMP6 and FSHR are NC_019463.2, NC_019477.2, and NC_019460.2, respectively) were obtained and synthesized by Beijing Huada gene Biotechnology Co., Ltd. (Beijing, China). All primer information is listed in Table 1.

2.5. Genotyping of SNPs

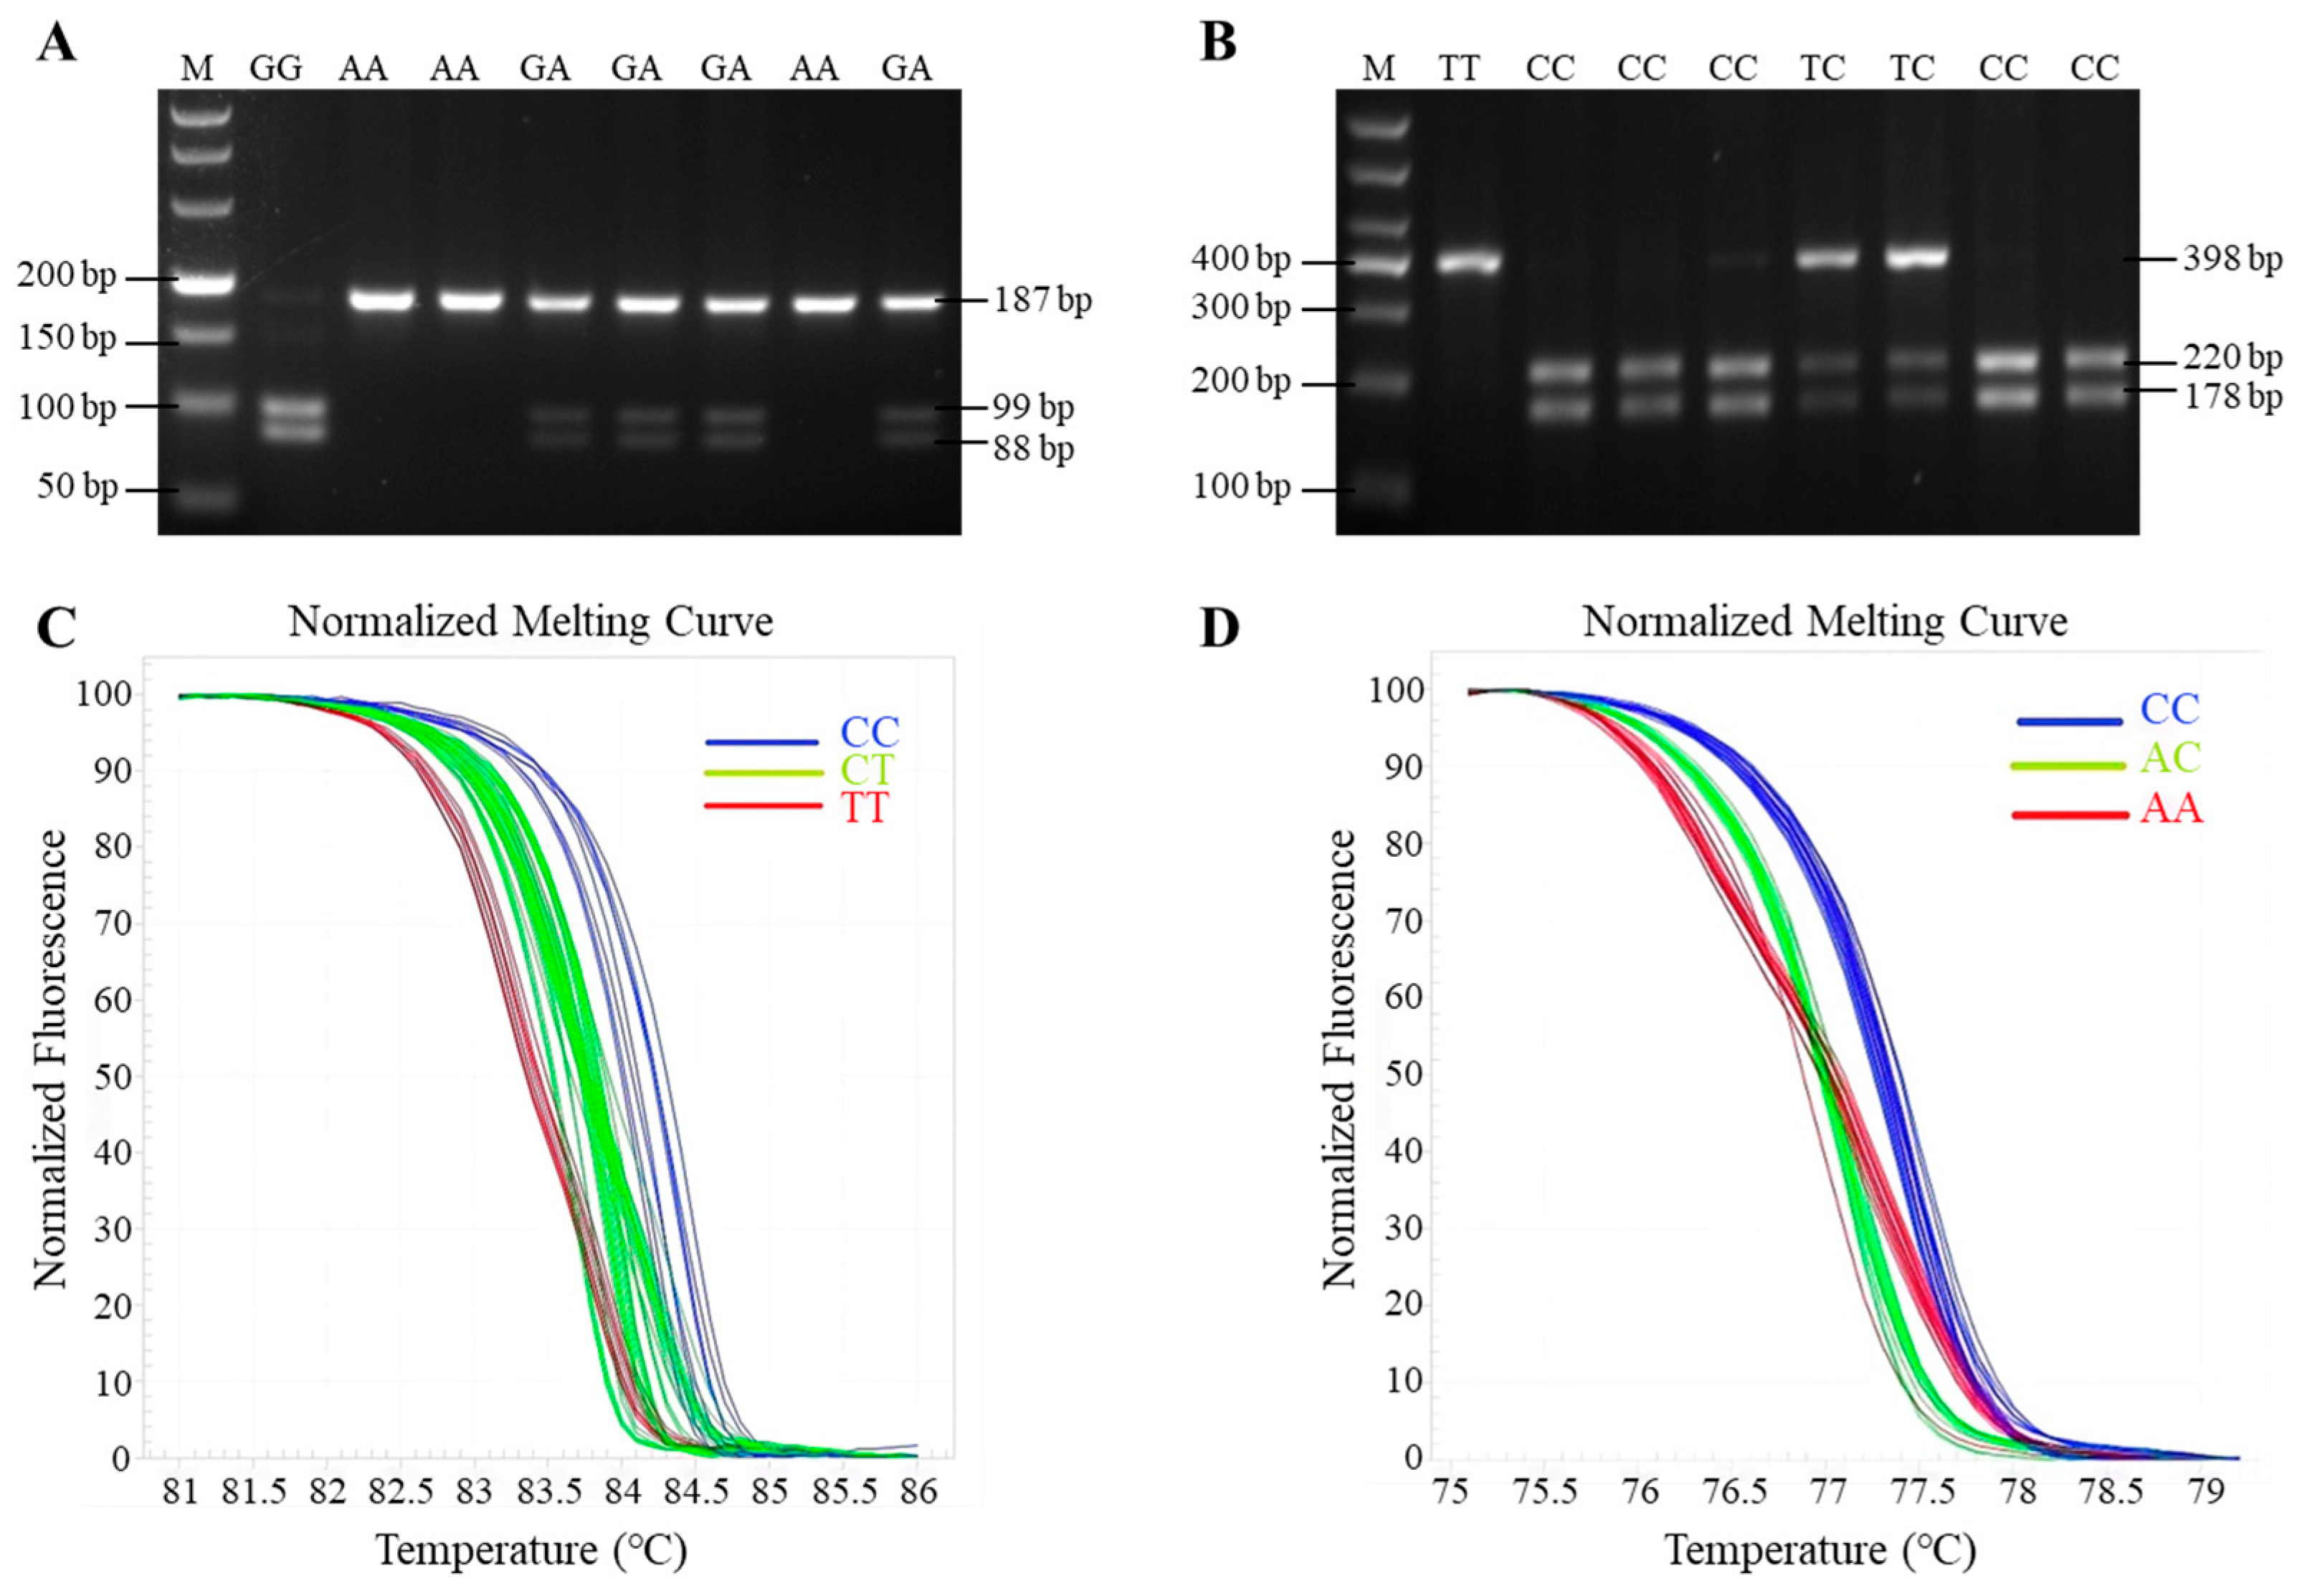
PCR was carried out in a 10 µL reaction mixture containing 5 µL Taq DNA polymerase (Takara), 3.4 µL of ddH2O, 1 µL of goat genomic DNA, and 0.3 µL each of forward and reverse primer, respectively. The PCR amplification procedure was as follows: pre-denaturation at 94 °C for 2 min; followed by 35 cycles of denaturation at 94 °C for 30 s, annealing at 60 °C for 30 s, and extension at 72 °C for 30 s; extension at 72 °C for 5 min; and with a final preservation at 4 °C for 10 min. The PCR products of GnRHR and BMP6 genes were digested separately with MspI (Thermo, Waltham, MA, USA) and HhaI (Thermo, Waltham, MA, USA) at 37 °C for 30 min in a 15 µL reaction mixture. The digestion system was as follows: 1 µL 10 × buffer, 8.5 µL of ddH2O, 0.5 µL restriction endonuclease (10 U/µL), and 5 µL PCR product. Then, the resultant fragments were separated by electrophoresis on 3% agarose gels.
HRM of FSHR gene was carried out in 10 µL reaction mixture containing 5 µL EvaGreen® dye (Takara), 3.4 µL RNase-free water, 1 µL of goat genomic DNA, and 0.3 µL upstream and downstream primers, respectively. The HRM procedure was as follows: pre-denaturation at 94 °C for 2 min; followed by 40 cycles of denaturation at 94 °C for 10 s, annealing at 60 °C for 10 s, and extension at 72 °C for 5 s; finally, the fluorescence changes were monitored continuously during the procedure at 95 °C for 15 s, 55 °C 15 s, 55–95 °C (0.1 °C/s temperature rise rate), and the melting curve was obtained; the whole process takes about 10 min.

2.6. Reaction System and Conditions for qPCR

The cDNA of all tissue samples was used for qPCR analysis. qPCR amplification was performed in 20 µL of reaction mixture containing 10 µL of SYBR® Green qPCR Master Mix (2×), 0.4 µL of ROX Reference Dye II (50×), 0.4 µL each of forward and reverse primer, 2 µL of cDNA, and 6.8 µL of ddH2O. PCR amplification was performed in triplicate wells, using the following procedure: 95 °C for 10 min, followed by 40 cycles of 95 °C for 15 s, and 60 °C for 10 s. Then, the melting curve was obtained, and the fluorescence changes were monitored continuously at 58 °C. The results were analyzed with the 2−ΔΔCt method, using β-actin as the reference gene. The primers are listed in Table 1.

2.7. Statistical Analysis

Statistical analysis was conducted using GraphPad Prism version 8.0 (GraphPad Software, San Diego, CA, USA), with data presented as means ± SEM. Significant differences between two groups were determined using an unpaired two-tailed Student’s t-test or the Mann–Whitney U test for non-normally distributed samples. For data sets involving more than two groups, one-way ANOVA followed by the least significant difference (LSD) test or the non-parametric Kruskal–Wallis test was used, with SPSS 24.0 (SPSS Inc., Chicago, IL, USA). A p-value of less than 0.05 was considered statistically significant.

3. Results

3.1. Detection and Genotyping of Polymorphic Loci of GnRHR, BMP6 and FSHR Genes

Four pairs of primers of GnRHR, BMP6 and FSHR genes were amplified, and detected by electrophoresis on 1.5% agarose gels. The length of the PCR amplified fragment was consistent with the target fragment, with clear bands and no stray bands, and could be directly used for sequencing (Figure 1). Then, the sequences were stitched and contrasted with gene reference sequences published in GeneBank. Four SNPs were identified in these three genes, namely g.75G > A locus, g.951T > C locus, g.-112C > T locus and g.3236C > A locus (Figure 2). Among them, g.75G > A locus is located in exon 1 of the GnRHR gene, and g.951T > C locus is located in exon 3 of the BMP6 gene, but these two loci did not cause amino acid changes and belong to synonymous mutations; The g.-112C > T and g.3236C > A loci are located in the 5′URT and intron 10 of the FSHR gene, respectively.
After the g.75G > A locus of GnRHR gene was digested by MspI, there were three genotypes of GG (99 bp/98 bp), GA (187 bp/99 bp/98 bp), and AA (187 bp) in these four goat breeds (Figure 3A). The g.951T > C locus of BMP6 gene was digested by HhaI, there were three genotypes of TT (398 bp), TC (398 bp/220 bp/178 bp), and CC (220 bp/178 bp) in these four goat breeds (Figure 3B).The g.-112C > T locus has three genotypes of CC, CT and TT (Figure 3C), also the g.3236C > A locus also has three genotypes of CC, AC and AA (Figure 3D) by the PCR-HRM analysis.

3.2. Genetic Parameter Analysis of SNPs

Heterozygosity (He), homozygosity (Ho), polymorphic information content (PIC) and effective allele numbers (Ne) are important parameters by which to judge the genetic variation in a population, and the different genetic parameters represent the essential genetic differences between groups. The genetic parameters of the g.75G > A locus of the GnRHR gene in LZ, CZ, NS and CQ are shown in Table 2. The PIC of these four goat breeds was between 0.25 and 0.5, so all of them show moderate polymorphism; the He and Ne of NS are lower, so the Ho is higher, indicating that the genetic performance of NS is stable, and it is easy to breed for conservation and raise the heterosis during breeding work; of the other three goat breeds, the Ho and He are both nearly 0.5, and the number of alleles detected and He are almost the same, indicating that the two alleles were evenly distributed among these three populations. The results of chi-square test (χ2) show that the Hardy–Weinberg equilibrium (HWE) bias occurred in the NS, indicating that the NS is in a non-natural equilibrium state, which may be a result of people’s long-term selection of a certain trait associated with the g.75G > A locus. The genotype distribution of the LZ, CZ and CQ is in the HWE state, which indicates that the g.75G > A locus of GnRHR gene might not be affected by current breeding measures, and their genetic changes are still random in the breeding process.
The genetic parameters of the g.951T > C locus of BMP6 gene showed these four goat breeds were PIC < 0.25, so they all showed low polymorphism. The chi-square test showed that the g.951T > C locus was in the HWE state in the four goat breeds (Table 3).
According to Table 4 and Table 5, the PIC of g.-112C > T and g.3236C > A loci of the FSHR gene in the four goat breeds was between 0.25 and 0.5, so they all show moderate polymorphism. The chi-square test showed that the genotype distribution of these two loci had HWE bias in LZ, NS and CZ, but it was in the state of HWE in CQ.

3.3. Single Marker–Trait Association

Table 6, Table 7, Table 8 and Table 9 present the association analysis between four SNPs and litter size among individuals with different genotypes in CQ, CZ, LZ, and NS. The results indicate that there are no significant correlations between these four SNPs and litter size in NS. The association analysis result between the g.75G > A locus of GnRHR gene and litter size indicated that the does with genotype AA had 2.36 and 2.04 at the third birth and average litter size, and gave birth to more lambs than those with genotype GA and GG in CQ. The does with genotype AA were 0.69 and 0.28 more than the GG genotype ones at the second birth, respectively, with an average litter size of CZ. The does carrying genotype AA had more lambs when compared with the does carrying genotypes GA and GG in LZ.
The association analysis of the g.951T > C locus of the BMP6 gene and litter size showed that does with the CC genotype had 2.28 and at their third birth and overall litter size of 1.98 lambs on average, respectively, compared to those with the TT genotype in CQ. In CZ, the does with the CC genotype produced significantly more lambs than those with the TT genotype at both the fourth birth and in overall litter size. In LZ, does with the CC and CT genotypes had more lambs than those with the TT genotype at their first, second births, and overall larger litter sizes. Additionally, the average litter size of does with the CC genotype was 0.45 more than those with the TT genotype.
The association analysis of the g.-112C > T locus of the FSHR gene and litter size revealed that does with the TT genotype had litter sizes of 3.00, 2.55, and 2.35 for their third, fourth births, and average litter size, respectively. These values were significantly higher than those with the CT and CC genotypes in CQ. Similarly, does with the TT genotype had significantly higher litter sizes compared to those with the CT and CC genotypes in CZ. However, there was no significant difference in kidding traits among the three genotypes in LZ.
The results from the association analysis between the g.3236C > A locus of FSHR gene and litter size showed that the litter size of genotype AA was significantly higher than those of genotypes CC and CA in the first birth and average litter size of CZ and LZ, but there was no significant difference between the litter sizes of the different genotypes in CQ.

3.4. Genetic Analysis of Polygene Pyramiding

The polygene pyramiding effect analysis of the three genes (GnRHR, FSHR and BMP6) on litter size is presented in Table 10, Table 11 and Table 12. The combination genotype AATTCC and AACCAACC had a significantly greater contribution on litter size than any other combination genotypes in CQ and CZ, respectively. The litter sizes of combination genotypes AAAACC and AACCCC were significantly higher than those in other combination genotypes in LZ. All of these four combination genotypes can be regarded as the optimal combination genotypes, where the combination genotypes AATTCC, AACCAACC and AAAACC were the combined forms of the dominant genotypes of SNPs. Interestingly, we found that the pyramiding effect of the three genes on litter size was far higher than those with either mutation alone.

3.5. Tissue Expression Analysis of Genes

The mRNA expression of GnRHR and BMP6 genes was detected in 12 tissues including heart, liver, spleen, lung, kidney, dorsal longest muscle, hypothalamus, pituitary, ovary, oviduct, uterus and breast of CZ (Figure 4A,B), while the FSHR gene was expressed only in 6 tissues related to reproduction, such as hypothalamus, pituitary, ovary, oviduct, uterus and breast (Figure 4C). The expression of GnRHR gene in the pituitary, breast, and ovary of the prolific group was significantly higher than that of the non-prolific group, among which the expression of GnRHR in the pituitary was the highest (Figure 4A). The expression of the BMP6 gene was highest in the longest dorsal muscle, and was higher in the prolific group than in the non-prolific group. Moreover, the BMP6 expression in the breast and ovary tissues in the prolific group was significantly higher than in the non-prolific group (Figure 4B). In addition, the expression level of the FSHR gene in the pituitary, breast, and oviduct tissues in the prolific group was significantly higher than in the non-prolific group (Figure 4C). These results indicated that GnRHR, BMP6, and FSHR are closely related to the kidding performance of goats.

4. Discussion

In the present study, we selected the caprine GnRHR, BMP6 and FSHR genes as candidate genes to analyze the effect of single-marker and multi-marker aggregation on litter size. The GnRHR gene plays a vital role in the regulation of reproductive performance in goats. Several studies indicated that does carrying the mutation of the GnRHR gene had significantly higher litter sizes compared with wild-type individuals [20,21,22]. The caprine BMP6 gene is crucial in promoting normal fertility and skeletal growth in mice [23,24,25]. In the control study of sheep and rats, it was found that BMP6 inhibited the progesterone production of both ovarian granulosa cells and stimulated the proliferation or survival of granulosa cells in rats. In contrast, it had no effect on the proliferation of ovarian granulosa cells but could inhibit its differentiation [10]. In addition, BMP6 can maintain a lower apoptotic rate in cumulus cells by forming a local concentration gradient [26]. Numerous reports have shown that the FSHR has a central role in animal follicular development and litter traits [27,28,29]. Guo et al. research showed that allele C of 5′ regulatory region of the FSHR gene was a potential marker for improving litter size in goats [17]. Additionally, the g.47C > T mutation was found in the 5′ flanking region of the FSHR gene in the Small Tailed Han sheep and Hu sheep, and was significantly associated with litter size [19]. Overall, all these three genes could be selected as candidate genes for improving litter-size traits in goat husbandry.
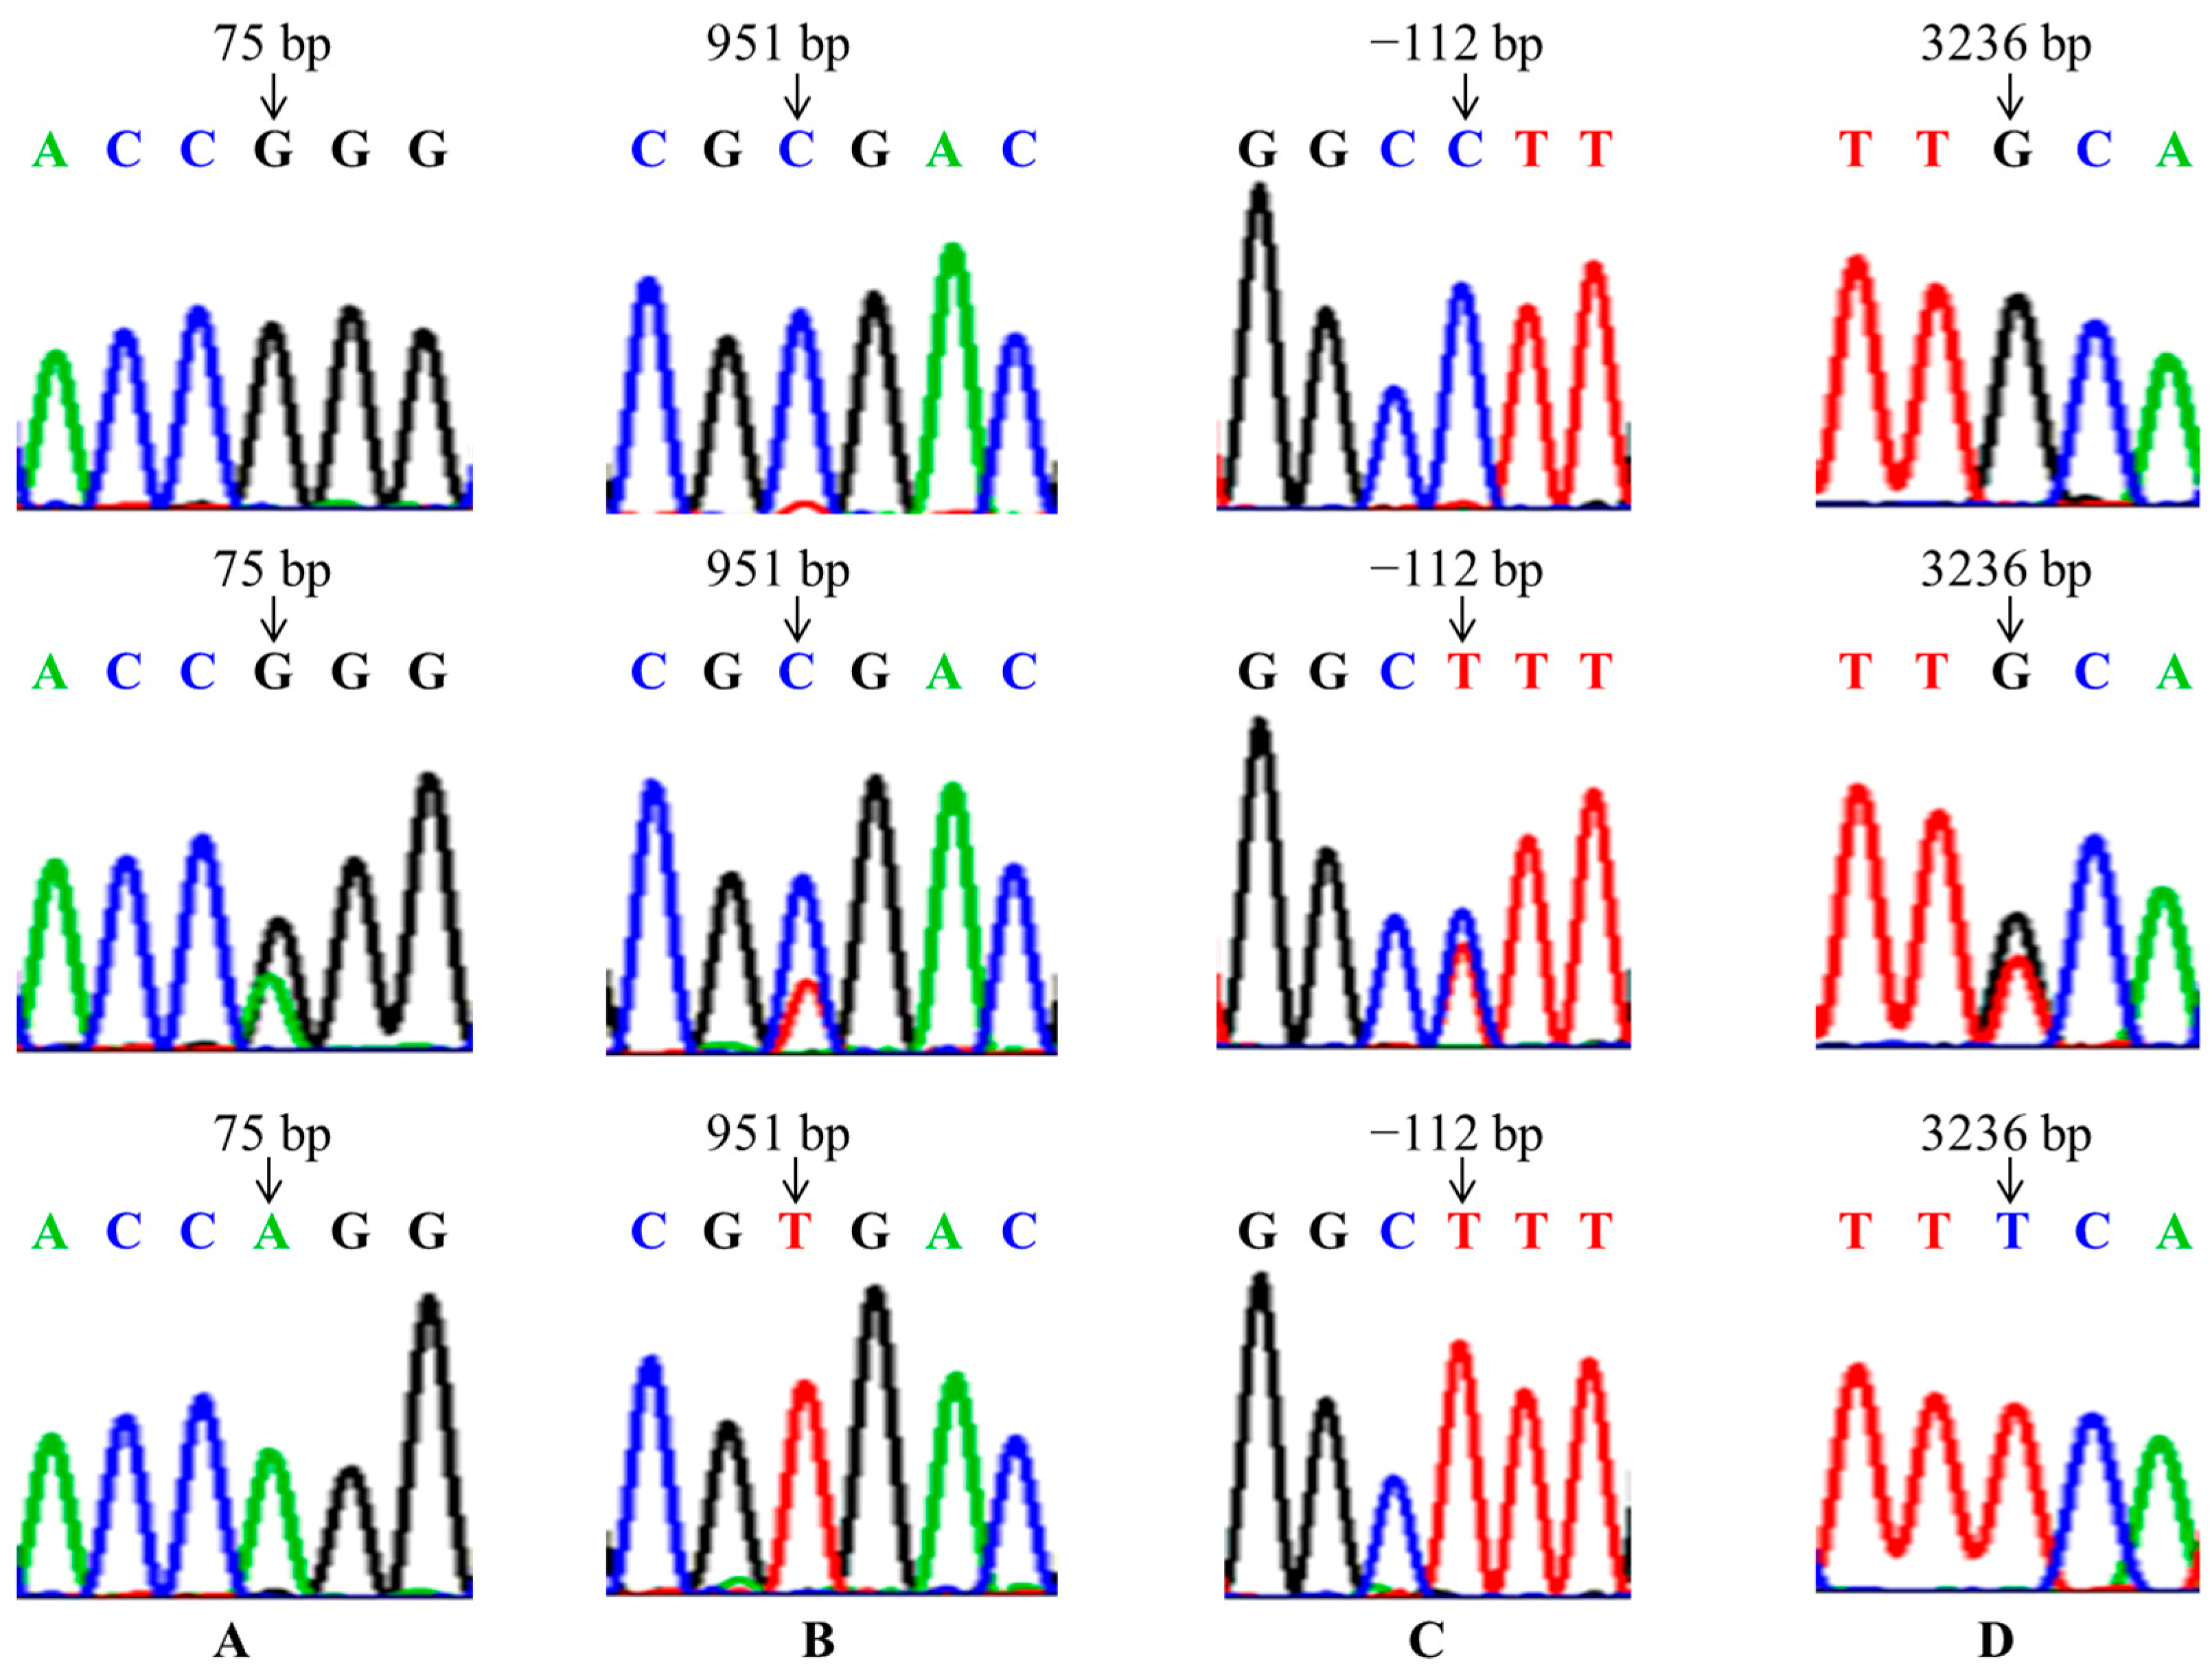
In the present study, the mutations of GnRHR (g.75G > A), FSHR (g.-112C > T, g.3236C > A) and BMP6 (g.951T > C) were found in four goat breeds, and were significantly associated with litter size in the CZ, CQ and DS breeds, so we can select the dominant genotypes to improve the fecundity of these three goat breeds in breeding work. But these four SNPs had no significant association with litter size in the NS. This may be because the NS had just been introduced into the field from Yunnan, and the growth environment was quite different, so its reproductive performance was still very unstable. Nonetheless, it may also be due to the small sample size or the distribution of the samples not being wide enough. Therefore, in order to make the research results more universal, we can further expand the sample size and sample distribution range in the following study.
Interestingly, the expression of BMP6 in ovarian cells suggests that BMP6 would be the most likely ligand regulating follicular maturation and ovulation rate through BMPR-IB [12]. In addition, studies have shown that the expression level of GnRHR mRNA is highest in the pituitary tissues of rats, pigs, cattle and sheep [
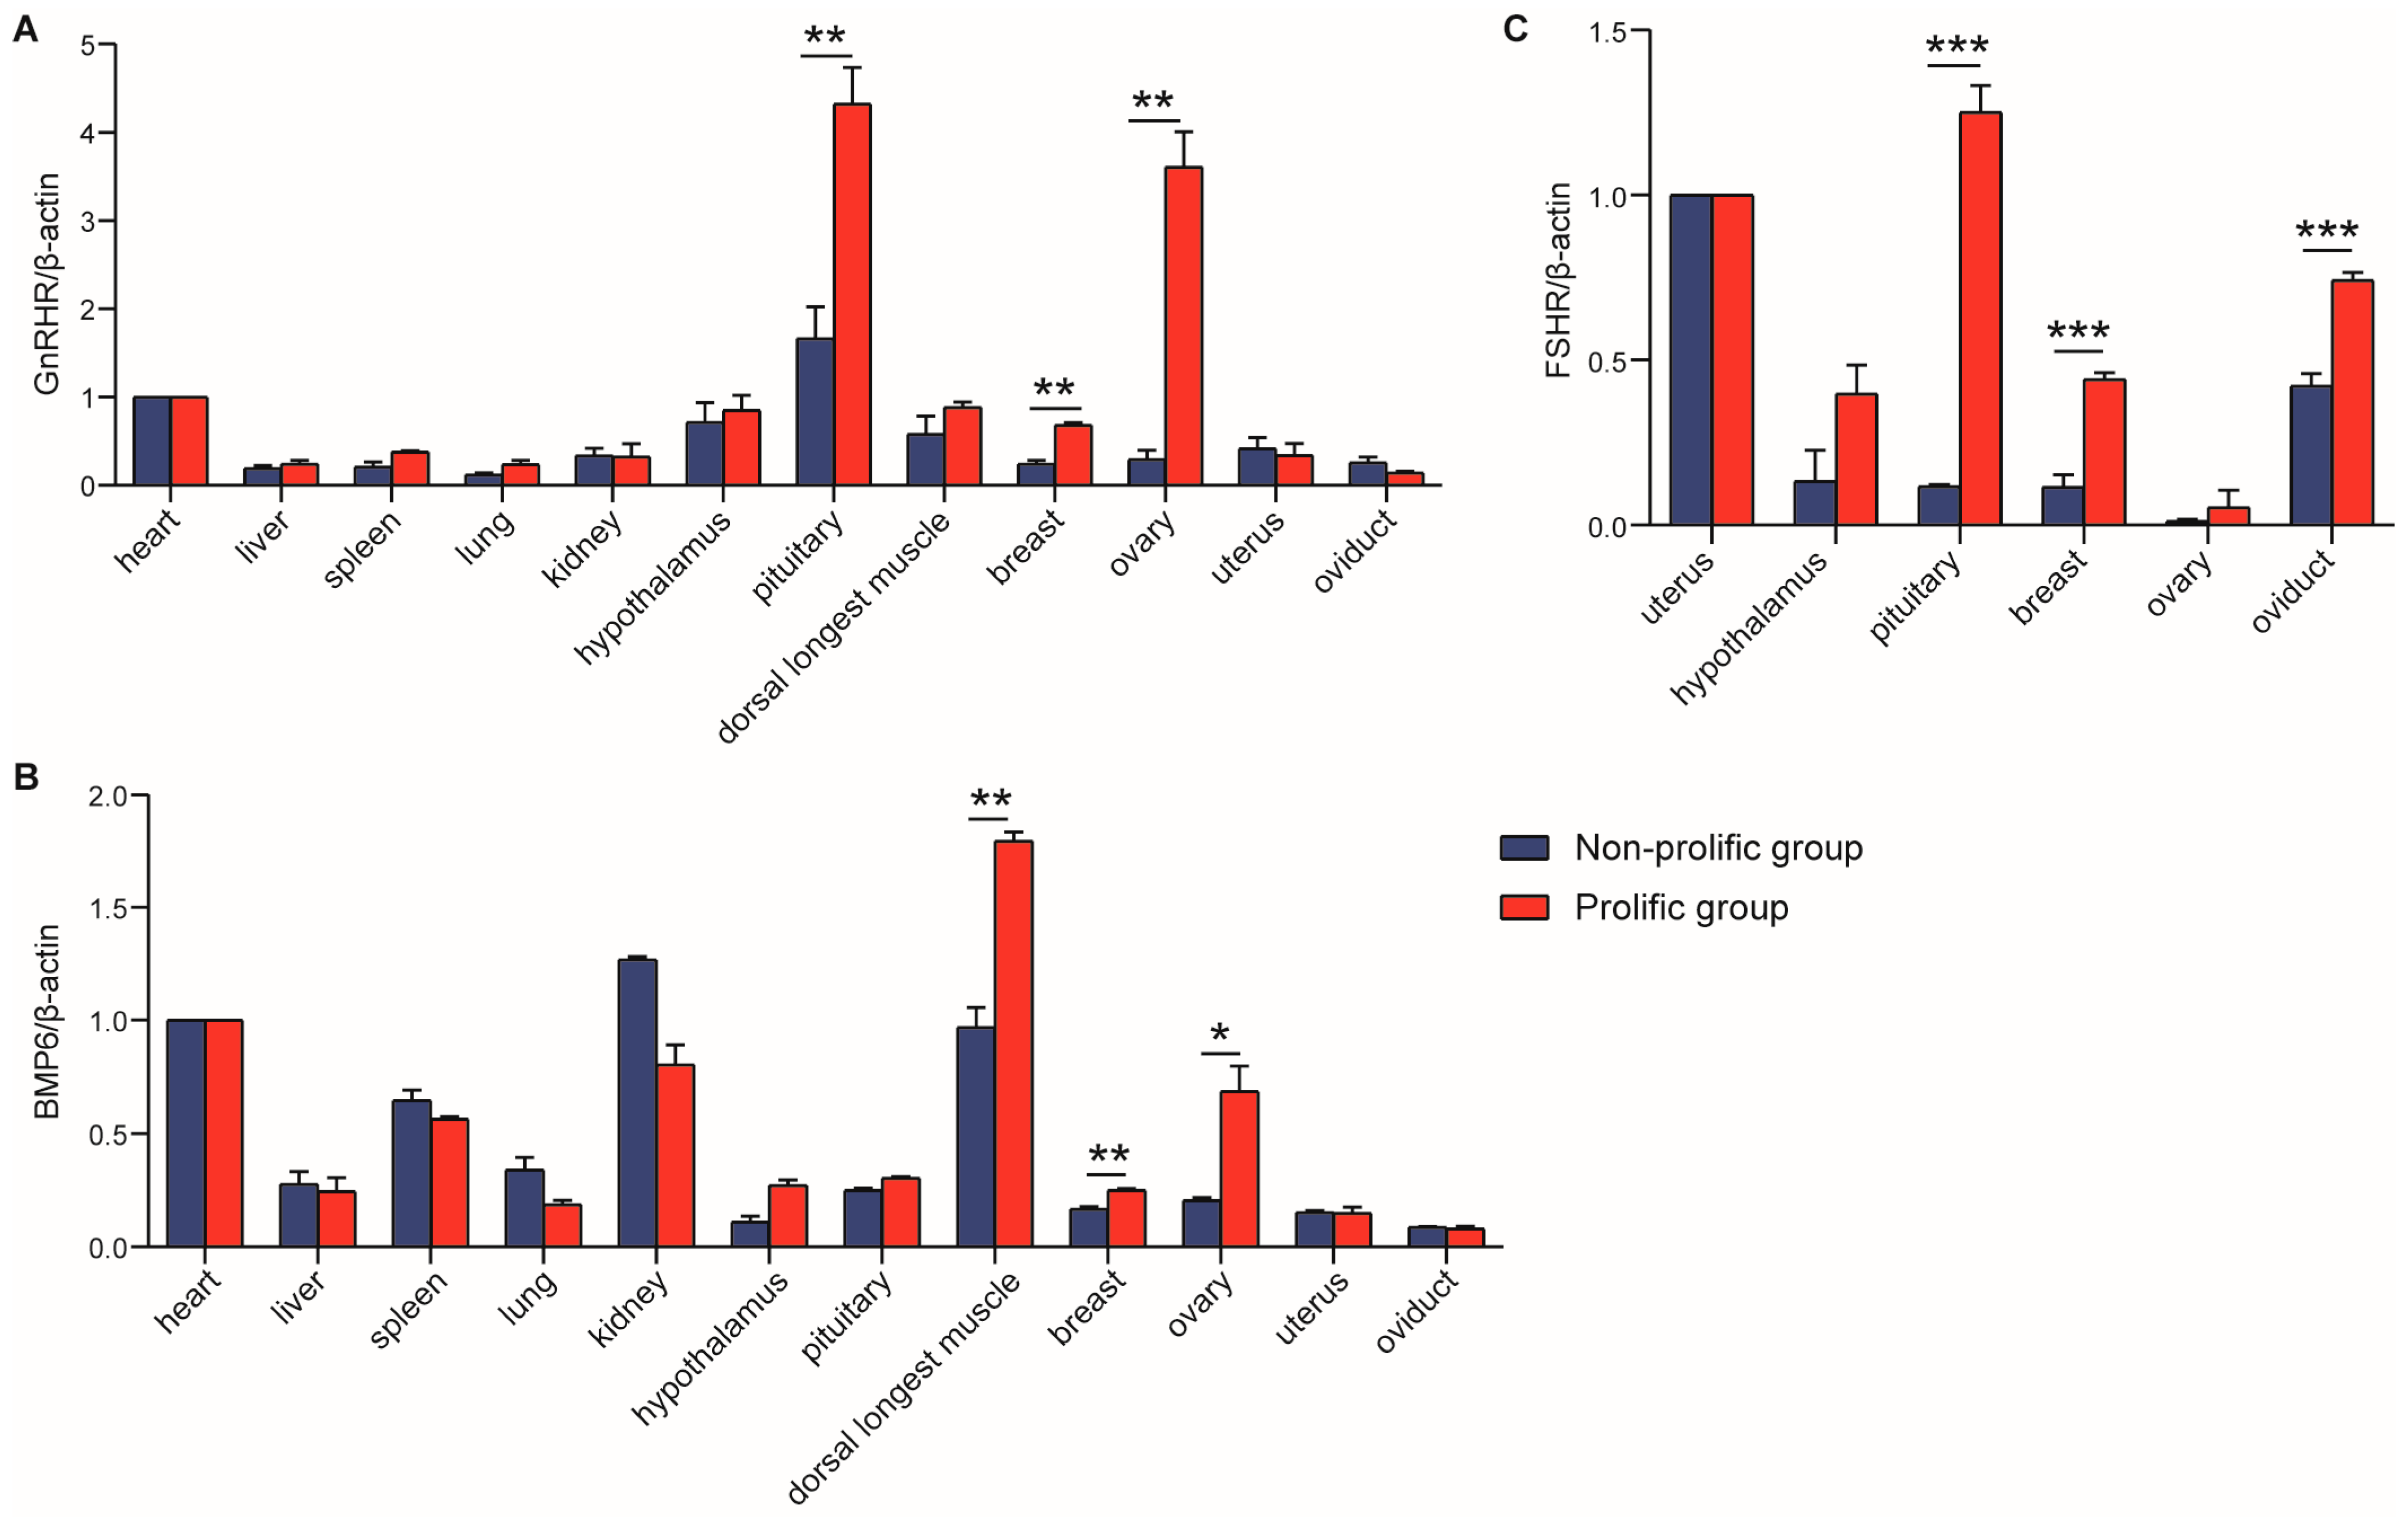
30], which was consistent with our study. In this study, GnRHR and BMP6 were detected in all 12 tissues, which implied that they played a role in promoting differentiation in many body tissues. The highest expression of GnRHR and BMP6 was in the pituitary and longest dorsal muscle, respectively. Moreover, the GnRHR mRNA expression level in breast and ovary in the prolific group was significantly higher than that in the non-prolific group; BMP6 mRNA expression level in the longest dorsal muscle, breast and ovary in the prolific group was prominently higher than that in the non-prolific group. The results of Pan et al. showed that ovine FSHR was expressed widely in detected tissues and was significantly higher in sexual glands (testicle and ovary) than in other tissues (heart, liver, spleen, lung, kidney, rumen, duodenum, muscle, fat, hypothalamus and pituitary) [19]. However, in our study, FSHR was checked only in reproduction-related tissues, and the expression level in the prolific group was significantly higher than the non-prolific group in the pituitary. This evidence suggested that FSHR might play a different role in goats and sheep. To some extent, the expression of candidate genes in the ovary is positively correlated with the reproductive performance of mammals [31,32], and the function of the ovary is generally regulated by the pituitary gland. In this study, the high expression of GnRHR and FSHR in the pituitary of the prolific group may promote the development and maturation of the follicle; it was also explained by the fact that they could regulate the ovulation rate of the ovary by their expression level, and then participate in the mechanism of regulating litter size in animals [33]. All these results further confirmed that these three genes are associated with the litter-size traits of goats.
So far, some studies have reported the effect of polygene pyramiding on litter size in sheep. Hanrahan et al. found that the ewes with mutations in both GDF9and BMP15 had a greater ovulation rate than those with either mutation alone in Cambridge and Belclare Sheep [34]. In the research of Chu et al., the Small Tailed Han sheep carried genotype BB/G+ (BMPR-IB/BMP-15) showed a greater litter size than those with only one mutation [35]. The result of Wang et al. indicated that mutations among BMPR-IB, BMP15 and FSHR genes were found and the association analysis revealed that sheep with multiple markers had a higher litter size than those with single marker or two markers, and the combination genotype BB/G+/CC of BMPR-IB, BMP15 and FSHR genes was considered the superior genotype [18], which is consistent with the present study. There were four SNPs detected in the current experimental populations. Polygene polymerizing effect analysis revealed that the CQ and CZ with combination genotypes AATTCC and AACCAACC, and LZ with combination genotypes AAAACC and AACCCC had more kids than any other combination genotypes or those with only one predominant genotype among the does. Moreover, the combination genotypes AATTCC, AACCAACC and AAAACC were the combination of the predominant genotypes of GnRHR, BMP6 and FSHR genes, indicating that polygene polymerizing may have a greater effect on contributing to the litter size of goats, and the combination genotypes AATTCC, AACCAACC, AAAACC and AACCCC could be considered as the superior genotypes and used as molecular markers in breeding work.
Obviously, it is unrealistic to predict that the does that are selected will have a high litter size in the future if they rely solely on molecular markers to detect the genotype of the base. There are many factors that affect the litter size of does, including temperature, nutrition, disease, and stress response. If the does carry a dominant genotype, it can only show that the does have the potential for high fecundity, and their potential is also influenced by external factors during the process of growth and development. If the environment is conducive to the growth and development of the does, the potential of their prolificacy is likely to be exerted, otherwise their potential will be buried. It can be seen that in order to give full play to the role of molecular markers related to litter size in production and breeding, we must pay attention to the feeding and management level of the goats at the same time, so as to get better breeding effects.

5. Conclusions

In summary, the polymerization effect of the GnRHR, BMP6 and FSHR genes of goats were analyzed for the first time. The results revealed that the optimal combination genotypes (AATTCC, AACCAACC, AAAACC and AACCCC) were a polymerization of the dominant genotypes of single molecular markers, but the number of individuals with optimal combination genotypes was not enough in the experimental population; more samples should be selected to investigate the pyramiding effect of more genes in future studies, and to obtain effective molecular markers for polygene polymerization breeding of goats. In addition, the high expression of these three genes in the ovary or pituitary of the prolific group of goats further explained their correlation with litter traits.

Author Contributions

Methodology, X.Y.; validation, X.Y.; formal analysis, X.Y.; investigation, X.Y.; data curation, X.Y.; writing—original draft preparation, X.Y.; writing—review and editing, G.L.; supervision, Y.L., B.S., Y.G., M.D., D.L. and G.L.; project administration, G.L.; funding acquisition, G.L. All authors have read and agreed to the published version of the manuscript.

Funding

This research was funded by the Science and Technology Program from Forestry Administration of Guangdong Province (2023KJCX004) and the project of the Department of Agriculture and Rural Affairs of Guangdong Province (2024-XPY-00-008).

Institutional Review Board Statement

The experimental procedures were performed according to protocols approved by the Institutional Studies Animal Care and Use Committee of China Agricultural University (Beijing, China) (permit AW13501202-2–2).

Informed Consent Statement

Not applicable.

Data Availability Statement

Data are contained within the article.

Acknowledgments

We would like to thank all the farm staff of WENS Company for the help in realizing this experiment.

Conflicts of Interest

The authors declare no conflicts of interest.

Abbreviations

The following abbreviations are used in this manuscript:
GnRHRGonadotropin-releasing hormone receptor
BMP6Bone morphogenetic protein 6
FSHRFollicle-stimulating hormone receptor
GnRHGonadotropin-releasing hormone
CQChongqing black goat
CZChuanzhong black goat
LZLeizhou goat
NSNubian goat
HeHeterozygosity
HoHomozygosity
PICPolymorphic information content
NeEffective allele numbers
HWEHardy–Weinberg equilibrium

References

  1. Yang, Z.; Yang, X.; Liu, G.; Deng, M.; Sun, B.; Guo, Y.; Liu, D.; Li, Y. Polymorphisms in BMPR-IB gene and their association with litter size trait in Chinese Hu sheep. Anim. Biotechnol. 2022, 33, 250–259. [Google Scholar] [CrossRef] [PubMed]
  2. Yang, Z.; Lian, Z.; Liu, G.; Deng, M.; Sun, B.; Guo, Y.; Liu, D.; Li, Y. Identification of genetic markers associated with milk production traits in Chinese Holstein cattle based on post genome-wide association studies. Anim. Biotechnol. 2019, 32, 67–76. [Google Scholar] [CrossRef]
  3. Feng, T.; Geng, C.X.; Lang, X.Z.; Chu, M.X.; Cao, G.L.; Di, R.; Fang, L.; Chen, H.Q.; Liu, X.L.; Li, N. Polymorphisms of caprine GDF9 gene and their association with litter size in Jining Grey goats. Mol. Biol. Rep. 2011, 38, 5189–5197. [Google Scholar] [CrossRef]
  4. Dutta, R.; Laskar, S.; Borah, P.; Kalita, D.; Das, B.; Zaman, G.; Barman, N.N.; Saikia, D.P. Polymorphism and nucleotide sequencing of BMPR1B gene in prolific Assam hill goat. Mol. Biol. Rep. 2014, 41, 3677–3681. [Google Scholar] [CrossRef]
  5. Campion, C.E.; Turzillo, A.M.; Clay, C.M. The gene encoding the ovine gonadotropin-releasing hormone (GnRH) receptor: Cloning and initial characterization. Gene 1996, 170, 277–280. [Google Scholar] [CrossRef]
  6. Montgomery, G.W.; Penty, J.M.; Lord, E.A.; Brooks, J.; McNeilly, A.S. The gonadotrophin-releasing hormone receptor maps to sheep chromosome 6 outside of the region of the FecB locus. Mamm. Genome 1995, 6, 436–438. [Google Scholar] [CrossRef] [PubMed]
  7. Ma, K.Y.; Zhang, S.F.; Wang, S.S.; Qiu, G.F. Molecular cloning and characterization of a gonadotropin-releasing hormone receptor homolog in the Chinese mitten crab, Eriocheir sinensis. Gene 2018, 665, 111–118. [Google Scholar] [CrossRef]
  8. Lyons, K.M.; Pelton, R.W.; Hogan, B.L. Patterns of expression of murine Vgr-1 and BMP-2a RNA suggest that transforming growth factor-beta-like genes coordinately regulate aspects of embryonic development. Genes Dev. 1989, 3, 1657–1668. [Google Scholar] [CrossRef] [PubMed]
  9. Otsuka, F.; Moore, R.K.; Shimasaki, S. Biological function and cellular mechanism of bone morphogenetic protein-6 in the ovary. J. Biol. Chem. 2001, 276, 32889–32895. [Google Scholar] [CrossRef]
  10. Juengel, J.L.; Reader, K.L.; Bibby, A.H.; Lun, S.; Ross, I.; Haydon, L.J.; McNatty, K.P. The role of bone morphogenetic proteins 2, 4, 6 and 7 during ovarian follicular development in sheep: Contrast to rat. Reproduction 2006, 131, 501–513. [Google Scholar] [CrossRef]
  11. Juengel, J.L.; McNatty, K.P. The role of proteins of the transforming growth factor-beta superfamily in the intraovarian regulation of follicular development. Hum. Reprod. Update 2005, 11, 143–160. [Google Scholar] [CrossRef] [PubMed]
  12. Nermin, E.H.; Kandil, O.M.; Shawky, A.-E.-M.A.; Al-Tohamy, A.F.M.; El-Sayd, Y.A.; Hamdy, A.S.; Abou-Fandoud, E.-S.I.; Abdel-Azeem, S.N.; Abd, E.R.A.H.; Abdoon, A.S.S. Investigating the effect of GDF9, BMP15, BMP6 and BMPR1B polymorphisms on Egyptian sheep fecundity and their transcripts expression in ovarian cells. Small Rumin. Res. 2018, 165, 34–40. [Google Scholar]
  13. Daelemans, C.; Smits, G.; de Maertelaer, V.; Costagliola, S.; Englert, Y.; Vassart, G.; Delbaere, A. Prediction of severity of symptoms in iatrogenic ovarian hyperstimulation syndrome by follicle-stimulating hormone receptor Ser680Asn polymorphism. J. Clin. Endocrinol. Metab. 2004, 89, 6310–6315. [Google Scholar] [CrossRef]
  14. Sprengel, R.; Braun, T.; Nikolics, K.; Segaloff, D.L.; Seeburg, P.H. The testicular receptor for follicle stimulating hormone: Structure and functional expression of cloned cDNA. Mol. Endocrinol. 1990, 4, 525–530. [Google Scholar] [CrossRef] [PubMed]
  15. Borgbo, T.; Jeppesen, J.V.; Lindgren, I.; Lundberg Giwercman, Y.; Hansen, L.L.; Yding Andersen, C. Effect of the FSH receptor single nucleotide polymorphisms (FSHR 307/680) on the follicular fluid hormone profile and the granulosa cell gene expression in human small antral follicles. Mol. Hum. Reprod. 2015, 21, 255–261. [Google Scholar] [CrossRef] [PubMed]
  16. Chu, M.X.; Guo, X.H.; Feng, C.J.; Li, Y.; Huang, D.W.; Feng, T.; Cao, G.L.; Fang, L.; Di, R.; Tang, Q.Q.; et al. Polymorphism of 5′ regulatory region of ovine FSHR gene and its association with litter size in Small Tail Han sheep. Mol. Biol. Rep. 2012, 39, 3721–3725. [Google Scholar] [CrossRef] [PubMed]
  17. Guo, X.; Li, Y.; Chu, M.; Feng, C.; Di, R.; Liu, Q.; Feng, T.; Cao, G.; Huang, D.; Fang, L.; et al. Polymorphism of 5′ regulatory region of caprine FSHR gene and its association with litter size in Jining Grey goat. Turk. J. Vet. Anim. Sci. 2013, 37, 497–503. [Google Scholar] [CrossRef]
  18. Wang, W.; Liu, S.; Li, F.; Pan, X.; Li, C.; Zhang, X.; Ma, Y.; La, Y.; Xi, R.; Li, T. Polymorphisms of the Ovine BMPR-IB, BMP-15 and FSHR and Their Associations with Litter Size in Two Chinese Indigenous Sheep Breeds. Int. J. Mol. Sci. 2015, 16, 11385–11397. [Google Scholar] [CrossRef]
  19. Pan, X.; Liu, S.; Li, F.; Wang, W.; Li, C.; Ma, Y.; Li, T. Molecular characterization, expression profiles of the ovine FSHR gene and its association with litter size. Mol. Biol. Rep. 2014, 41, 7749–7754, Erratum in Mol. Biol. Rep. 2015, 42, 315. [Google Scholar] [CrossRef]
  20. Bemji, M.N.; Isa, A.M.; Ibeagha-Awemu, E.M.; Wheto, M. Polymorphisms of caprine GnRHR gene and their association with litter size in West African Dwarf goats. Mol. Biol. Rep. 2018, 45, 63–69. [Google Scholar] [CrossRef]
  21. An, X.P.; Han, D.; Hou, J.X.; Li, G.; Wang, J.G.; Yang, M.M.; Song, Y.X.; Zhou, G.Q.; Wang, Y.N.; Ling, L. GnRHR gene polymorphisms and their effects on reproductive performance in Chinese goats. Small Rumin. Res. 2009, 85, 130–134. [Google Scholar] [CrossRef]
  22. Yang, W.; Tang, K.; Zhang, C.; Xu, D.; Yang, L. Polymorphism of the GnRHR gene and its association with litter size in Boer goats. South Afr. J. Anim. Sci. 2011, 41, 398–402. [Google Scholar]
  23. Sugiura, K.; Su, Y.Q.; Eppig, J.J. Does bone morphogenetic protein 6 (BMP6) affect female fertility in the mouse? Biol. Reprod. 2010, 83, 997–1004. [Google Scholar] [CrossRef]
  24. Solloway, M.J.; Dudley, A.T.; Bikoff, E.K.; Lyons, K.M.; Hogan, B.L.; Robertson, E.J. Mice lacking Bmp6 function. Dev. Genet. 1998, 22, 321–339. [Google Scholar] [CrossRef]
  25. Kugimiya, F. Involvement of endogenous bone morphogenetic protein (BMP) 2 and BMP6 in bone formation. J. Biol. Chem. 2005, 280, 35704–35712. [Google Scholar] [CrossRef] [PubMed]
  26. Hussein, T.S.; Froiland, D.A.; Amato, F.; Thompson, J.G.; Gilchrist, R.B. Oocytes prevent cumulus cell apoptosis by maintaining a morphogenic paracrine gradient of bone morphogenetic proteins. J. Cell Sci. 2005, 118, 5257–5268. [Google Scholar] [CrossRef] [PubMed]
  27. Zhang, S.; Xiong, Y.; Den, C.; Xiao, S.; Sun, S. FSHR Gene Mutation and Its Effect on Litter Size in Pigs. Asian Australas. J. Anim. Sci. 2004, 17, 179–182. [Google Scholar] [CrossRef]
  28. Cui, H.X.; Zhao, S.M.; Cheng, M.L.; Guo, L.; Ye, R.Q.; Liu, W.Q.; Gao, S.Z. Cloning and expression levels of genes relating to the ovulation rate of the Yunling black goat. Biol. Reprod. 2009, 80, 219–226. [Google Scholar] [CrossRef]
  29. Jiang, Z.; Rottmann, O.J.; Krebs, O.; Chen, J.; Liu, H.; Pirchner, F. A missense mutation in the follicle stimulating hormone receptor (FSHR) gene shows different allele effects on litter size in Chinese Erhualian and German Landrace pigs. J. Anim. Breed. Genet. 2002, 119, 335–341. [Google Scholar] [CrossRef]
  30. Miller, D.W.; Harrison, J.L.; Brown, Y.A.; Doyle, U.; Lindsay, A.; Adam, C.L.; Lea, R.G. Immunohistochemical evidence for an endocrine/paracrine role for ghrelin in the reproductive tissues of sheep. Reprod. Biol. Endocrinol. 2005, 3, 60. [Google Scholar] [CrossRef]
  31. Zhang, J.Q.; Gao, B.W.; Wang, J.; Ren, Q.L.; Chen, J.F.; Ma, Q.; Zhang, Z.J.; Xing, B.S. Critical Role of FoxO1 in Granulosa Cell Apoptosis Caused by Oxidative Stress and Protective Effects of Grape Seed Procyanidin B2. Oxidative Med. Cell. Longev. 2016, 2016, 6147345. [Google Scholar] [CrossRef] [PubMed]
  32. Stolk, L.; Perry, J.R.; Chasman, D.I.; He, C.; Mangino, M.; Sulem, P.; Barbalic, M.; Broer, L.; Byrne, E.M.; Ernst, F.; et al. Meta-analyses identify 13 loci associated with age at menopause and highlight DNA repair and immune pathways. Nat. Genet. 2012, 44, 260–268. [Google Scholar] [CrossRef] [PubMed]
  33. Yan, Y.; Gong, Z.; Zhang, L.; Li, Y.; Li, X.; Zhu, L.; Sun, L. Association of follicle-stimulating hormone receptor polymorphisms with ovarian response in Chinese women: A prospective clinical study. PLoS ONE 2013, 8, e78138. [Google Scholar] [CrossRef] [PubMed]
  34. Hanrahan, J.P.; Gregan, S.M.; Mulsant, P.; Mullen, M.; Davis, G.H.; Powell, R.; Galloway, S.M. Mutations in the genes for oocyte-derived growth factors GDF9 and BMP15 are associated with both increased ovulation rate and sterility in Cambridge and Belclare sheep (Ovis aries). Biol. Reprod. 2004, 70, 900–909. [Google Scholar] [CrossRef]
  35. Chu, M.X.; Liu, Z.H.; Jiao, C.L.; He, Y.Q.; Fang, L.; Ye, S.C.; Chen, G.H.; Wang, J.Y. Mutations in BMPR-IB and BMP-15 genes are associated with litter size in Small Tailed Han sheep (Ovis aries). J. Anim. Sci. 2007, 85, 598–603. [Google Scholar] [CrossRef]
Figure 1. PCR amplification results of primers: (A) primer GnRHR, (B) primer BMP6, (C) primer FSHR-T1, (D) primer FSHR-T2. The numbers 1 to 8 denote the amplified fragment; M means DNA molecular weight marker (DL1000).
Animals 15 01358 g001
Figure 2. The sequencing map of polymorphic loci: (A) g.75G > A mutation of GnRHR gene, (B) g.951T > C mutation of BMP6 gene, (C) the g.-112C > T mutation of FSHR gene, (D) the g.3236C > A mutation of FSHR gene.
Animals 15 01358 g002
Figure 3. The results of genotyping: (A) the PCR-MspI-RFLP electrophoresis results of the g.75G > A mutation of GnRHR gene, (B) the PCR-HhaI-RFLP electrophoresis results of the g.75G > A mutation of BMP6 gene, the genotypes are marked on the top of the lanes. M means DNA marker (DL2000). (C) PCR-HRM analysis of the g.-112C > T mutation of FSHR gene, (D) PCR-HRM analysis of the g.3236C > A mutation of FSHR gene.
Animals 15 01358 g003
Figure 4. The mRNA expression level of GnRHR (A), BMP6 (B) and FSHR (C) in different tissues of CZ. * p < 0.05, ** p < 0.01, *** p < 0.001.
Animals 15 01358 g004
Table 1. Primer sequences of PCR-RFLP/PCR-HRM and real-time PCR.
Gene Name Primer Sequence (5′→3′)Product Size (bp)Annealing
Temperature (°C)
Endonuclease/HRM
PCR-RFLP/PCR-HRM primerGnRHRFTCTTGAAGCTGTATCAGCCATA18756MspI
RGTGTTGAAAATTGTGGAGAGTAGA
BMP6FTTTTAGGGCTCCATGTACTCC39859HhaI
RTTTCCTCTGGGTGCTGTG
FSHR-T1FTACCAGCTCCCAATGCAGAC18358HRM
RGACAGAGTCGATGGTGGCAT
FSHR-T2FTACACACTCATCCCCCTA12560HRM
RGTGCTCTGTCAGCTCTTG
Real-time PCR primerGnRHRFGGCTGAGGACCCTAAAGATG13460-
RACCATGTCAGGATCAAACCA
BMP6FCTTTCTCAACGACGCCGATAT10660-
RTCACCGCCTCACCCTCAG
FSHRFCGAGTCATCCCAGAAGGAG13760-
RGGCAGGTTGGAGAACACATT
β-actinFAGCCTTCCTTCCTGGGCATGGA11360-
RGGACAGCACCGTGTTGGCGTAGA
F: forward primer; R: reverse primer.
Table 2. The genetic parameters of GnRHR gene g.75G > A locus.
BreedNumberAllelic FrequencyGenotypic Frequency (N)χ2 (HWE)PICHoHeNe
GAGGGAAA
CQ910.440.560.24 (22)0.40 (36)0.36 (33)3.530.370.510.491.97
CZ1870.460.540.21 (40)0.49 (92)0.29 (55)0.020.370.500.501.99
LZ2900.630.370.40 (115)0.46 (134)0.14 (41)0.040.360.530.471.88
NS3910.250.750.05 (19)0.40 (155)0.55 (217)180.91 **0.300.630.371.59
Note: the numbers in the parentheses represent the number of the genotypes, df = 2, χ20.05 = 5.99, χ20.01 = 9.21; the superscript with ** means extremely significant difference (p < 0.01), no mark indicates that the difference is not significant (p > 0.05). 0.25 < PIC < 0.5 is moderately polymorphic.
Table 3. The genetic parameters of BMP6 gene g.951T > C locus.
BreedNumberAllelic FrequencyGenotypic Frequency (N)χ2 (HWE)PICHoHeNe
CTCCCTTT
CQ910.340.670.13 (12)0.41 (37)0.46 (42)0.700.350.550.451.80
CZ1870.250.750.07 (13)0.36 (68)0.57 (106)0.210.310.620.381.60
LZ2900.310.690.07 (19)0.48 (140)0.45 (131)5.270.340.570.431.74
NS3910.340.660.12 (48)0.44 (170)0.44 (173)0.390.350.550.451.81
Note: the numbers in the parentheses represent the number of the genotypes, df = 2, χ20.05 = 5.99, χ20.01 = 9.21. 0.25 < PIC < 0.5 is moderately polymorphic.
Table 4. The genetic parameters of FSHR gene g.-112C > T locus.
BreedNumberAllelic FrequencyGenotypic Frequency (N)χ2 (HWE)PICHoHeNe
CTCCCTTT
CQ910.690.310.51 (46)0.37 (34)0.12 (11)1.380.340.570.431.74
CZ1870.57 0.430.42 (78)0.30 (57)0.28 (52)26.79 **0.370.510.491.96
LZ2900.480.520.32 (93)0.31 (90)0.37 (107)41.40 **0.370.500.502.00
NS3910.460.540.29 (114)0.33 (129)0.38 (148)43.90 **0.370.500.501.99
Note: the numbers in the parentheses represent the number of the genotypes, df = 2, χ20.05 = 5.99, χ20.01 = 9.21; the superscript with ** means extremely significant difference (p < 0.01), no mark indicates that the difference is not significant (p > 0.05). 0.25 < PIC < 0.5 is moderately polymorphic.
Table 5. The genetic parameters of FSHR gene g.3236C > A locus.
BreedNumberAllelic FrequencyGenotypic Frequency (N)χ2 (HWE)PICHoHeNe
CACCCAAA
CQ910.580.420.37 (34)0.41 (37)0.22 (20)2.540.370.510.491.95
CZ1870.480.520.35 (65)0.26 (48)0.40 (74)44.07 **0.370.500.502.00
LZ2900.400.5980.23 (67)0.34 (99)0.43 (124)24.35 **0.370.520.481.93
NS3910.420.580.28 (111)0.27 (105)0.45 (175)78.54 **0.370.510.491.95
Note: the numbers in the parentheses represent the number of the genotypes, df = 2, χ20.05 = 5.99, χ20.01 = 9.21; the superscript with ** means extremely significant difference (p < 0.01), no mark indicates that the difference is not significant (p > 0.05). 0.25 < PIC < 0.5 is moderately polymorphic.
Table 6. Association analysis between g.75G > A locus of GnRHR gene and litter size of four goat breeds.
BreedGenotypeLitter Size (N)
First ParitySecond ParityThird ParityFourth ParityAverage
CQGG1.50 ± 0.51 (22)2.00 ± 0.56 (20)1.74 ± 0.56 b (19)2.00 ± 0.82 (13)1.77 ± 0.30 b (22)
GA1.56 ± 0.50 (36)1.82 ± 0.77 (33)1.97 ± 0.68 b (29)1.92 ± 0.64 (25)1.80 ± 0.33 b (36)
AA1.82 ± 0.77 (33)1.91 ± 0.59 (22)2.36 ± 0.84 a (31)2.04 ± 0.66 (26)2.04 ± 0.47 a (33)
CZGG1.70 ± 0.69 (40)1.62 ± 0.49 c (37)2.00 ± 0.84 (32)2.04 ± 0.79 (25)1.75 ± 0.48 b (40)
GA1.79 ± 0.67 (92)1.93 ± 0.78 b (86)2.08 ± 0.62 (77)1.82 ± 0.61 (56)1.90 ± 0.42 ab (92)
AA1.73 ± 0.62 (55)2.31 ± 0.77 a (49)2.02 ± 0.75 (42)1.92 ± 0.69 (26)2.03 ± 0.46 a (55)
LZGG1.47 ± 0.50 b (115)1.64 ± 0.52 (56)1.33 ± 0.58 b (3)1.52 ± 0.44 b (115)
GA1.46 ± 0.50 b (134)1.75 ± 0.46 (81)2.33 ± 0.58 a (3)1.57 ± 0.42 b (134)
AA1.76 ± 0.62 a (41)1.83 ± 0.64 (24)2.00 ± 0.00 ab (4)1.79 ± 0.51 a (41)
NSGG1.79 ± 0.54 (19)
GA1.87 ± 0.51 (155)
AA1.83 ± 0.53 (217)
Note: numbers in parentheses are numbers of individuals that belong to the respective genotypes. The different superscript lowercase letters in the same column represent significant level at p < 0.05, and same letter or no letter represents no significant difference (p > 0.05).
Table 7. Association analysis between g.951T > C locus of BMP6 gene and litter size of four goat breeds.
BreedGenotypeLitter Size (N)
First ParitySecond ParityThird ParityFourth ParityAverage
CQTT1.33 ± 0.49 (12)1.60 ± 0.97 (10)1.44 ± 0.73 b (9)1.60 ± 0.55 (5)1.39 ± 0.39 b (12)
CT1.65 ± 0.59 (37)1.92 ± 0.55 (36)1.97 ± 0.71 ab (31)1.96 ± 0.59 (27)1.92 ± 0.30 a (37)
CC1.71 ± 0.67 (42)1.95 ± 0.65 (39)2.28 ± 0.72 a (39)2.06 ± 0.76 (32)1.98 ± 0.38 a (42)
CZTT1.77 ± 0.60 (13)1.82 ± 0.98 (11)1.78 ± 0.67 (9)1.29 ± 0.49 b (7)1.64 ± 0.47 b (13)
CT1.77 ± 0.72 (68)1.85 ± 0.76 (65)1.95 ± 0.68 (60)1.90 ± 0.59 a (40)1.87 ± 0.42 ab (68)
CC1.75 ± 0.63 (106)2.07 ± 0.73 (96)2.15 ± 0.72 (82)1.97 ± 0.71 a (60)1.96 ± 0.46 a (106)
LZTT1.21 ± 0.42 b (19)1.07 ± 0.27 b (14)2.00 ± 0.00 (1)1.20 ± 0.38 b (19)
CT1.46 ± 0.53 b (140)1.73 ± 0.55 a (81)1.83 ± 0.75 (6)1.57 ± 0.44 a (140)
CC1.60 ± 0.52 a (131)1.86 ± 0.39 a (66)2.00 ± 0.00 (3)1.65 ± 0.45 a (131)
NSTT1.90 ± 0.37 (48)
CT1.80 ± 0.54 (170)
CC1.87 ± 0.54 (173)
Note: numbers in parentheses are numbers of individuals that belong to the respective genotypes. The different superscript lowercase letters in the same column represent significant level at p < 0.05, and same letter or no letter represents no significant difference (p > 0.05).
Table 8. Association analysis between g.-112C > T locus of FSHR gene and litter size of four goat breeds.
BreedGenotypeLitter Size (N)
First ParitySecond ParityThird ParityFourth ParityAverage
CQCC1.67 ± 0.60 (46)1.86 ± 0.61 (42)1.76 ± 0.55 c (37)1.87 ± 0.50 b (31)1.78 ± 0.36 b (46)
CT1.59 ± 0.61 (34)1.84 ± 0.77 (32)2.10 ± 0.79 b (31)1.86 ± 0.71 b (22)1.86 ± 0.37 b (34)
TT1.64 ± 0.81 (11)2.18 ± 0.41 (11)3.00 ± 0.447 a (11)2.55 ± 0.82 a (11)2.35 ± 0.34 a (11)
CZCC1.65 ± 0.72 (78)1.87 ± 0.68 (71)1.97 ± 0.57 b (62)1.89 ± 0.53 (45)1.83 ± 0.51 b (78)
CT1.79 ± 0.59 (57)1.96 ± 0.78 (53)1.94 ± 1.68 b (46)2.00 ± 0.78 (31)1.91 ± 0.36 ab (57)
TT1.87 ± 0.63 (52)2.13 ± 0.84 (48)2.28 ± 0.85 a (43)1.81 ± 0.75 (31)2.02 ± 0.45 a (52)
LZCC1.48 ± 0.50 (93)1.68 ± 0.55 (53)1.75 ± 0.50 (4)1.55 ± 0.43 (93)
CT1.56 ± 0.52 (90)1.77 ± 0.48 (44)2.00 ± 0.00 (4)1.64 ± 0.45 (90)
TT1.48 ± 0.56 (107)1.73 ± 0.51 (64)2.00 ± 1.41 (2)1.56 ± 0.47 (107)
NSCC1.84 ± 0.54 (114)
CT1.83 ± 0.48 (129)
TT1.86 ± 0.54 (148)
Note: numbers in parentheses are numbers of individuals that belong to the respective genotypes. The different superscript lowercase letters in the same column represent significant level at p < 0.05, and same letter or no letter represents no significant difference (p > 0.05).
Table 9. Association analysis between g.3236C > A locus of FSHR gene and litter size of four goat breeds.
BreedGenotypeLitter Size (N)
First ParitySecond ParityThird ParityFourth ParityAverage
CQCC1.62 ± 0.65 (34)1.90 ± 0.80 (30)2.00 ± 0.82 (28)2.00 ± 0.67 (23)1.82 ± 0.45 (34)
CA1.68 ± 0.67 (37)1.94 ± 0.53 (36)2.11 ± 0.68 (35)1.96 ± 0.74 (28)1.93 ± 0.34 (37)
AA1.60 ± 0.50 (20)1.79 ± 0.63 (19)2.06 ± 0.85 (16)2.00 ± 0.58 (13)1.88 ± 0.40 (20)
CZCC1.51 ± 0.56 b (65)1.94 ± 0.85 (62)1.98 ± 0.71 (55)2.17 ± 0.92 a (35)1.85 ± 0.43 b (65)
CA1.69 ± 0.47 b (48)2.02 ± 0.79 (41)1.92 ± 0.67 (38)1.70 ± 0.47 b (30)1.83 ± 0.34 b (48)
AA2.01 ± 0.75 a (74)1.97 ± 0.66 (69)2.19 ± 0.71 (58)1.81 ± 0.46 b (42)2.00 ± 0.52 a (74)
LZCC1.40 ± 0.52 b (67)1.68 ± 0.53 (40)1.50 ± 0.57 (2)1.48 ± 0.47 b (67)
CA1.47 ± 0.52 ab (99)1.82 ± 0.54 (60)1.75 ± 0.50 (4)1.60 ± 0.42 ab (99)
AA1.58 ± 0.52 a (124)1.67 ± 0.47 (61)2.25 ± 0.50 (4)1.63 ± 0.46 a (124)
NSCC1.82 ± 0.59 (111)
CA1.83 ± 0.51 (105)
AA1.87 ± 0.48 (175)
Note: numbers in parentheses are numbers of individuals that belong to the respective genotypes. The different superscript lowercase letters in the same column represent significant level at p < 0.05, and same letter or no letter represents no significant difference (p > 0.05).
Table 10. Pyramiding effect of GnRHR (g.75G > A), FSHR (g.-112C > T) and BMP6 (g.951T > C) on litter size in CQ.
LociCombination GenotypeLitter Size (N)
First Parity (69)Second Parity (61)Third Parity (56)Fourth Parity (36)Average (69)
g.75G > A/g.-112C > T/g.951T > CGGCCTC1.43 ± 0.53 b (7)2.14 ± 0.38 ab (7)1.67 ± 0.52 bc (6)2.00 ± 0.71 (5)1.79 ± 0.16 bc (7)
GACCCC1.67 ± 0.50 (9)2.00 ± 0.82 (7)1.86 ± 0.38 bc (7)1.80 ± 0.45 b (5)1.77 ± 0.36 c (9)
GACCTC1.88 ± 0.35 (8)1.63 ± 0.74 bc (8)1.40 ± 0.55 c (5)2.00 ± 0.00 (5)1.82 ± 0.23 bc (8)
GACTTC1.40 ± 0.55 b (5)1.80 ± 0.45 (5)2.20 ± 0.45 ab (5)2.00 ± 0.71 (5)1.88 ± 0.11 bc (5)
AACCTC2.00 ± 0.89 (6)2.17 ± 0.41 ab (6)1.67 ± 0.52 bc (6)1.83 ± 0.41 b (6)2.07 ± 0.33 (6)
AACCCC2.00 ± 0.63 (6)2.00 ± 0.00 (6)2.33 ± 0.52 ab (6)1.80 ± 0.45 b (5)2.07 ± 0.27 (6)
AATTCC2.00 ± 1.00 (5)2.40 ± 0.55 a (5)2.80 ± 0.45 a (5)2.60 ± 0.89 a (5)2.42 ± 0.39 a (5)
AACTCC2.20 ± 0.84 a (6)1.40 ± 0.55 c (5)2.80 ± 1.30 a (5)2.13 ± 0.48 ab (6)
GGCTCC1.50 ± 0.55 (6)2.33 ± 0.52 a (6)1.67 ± 0.52 bc (6)1.92 ± 0.28 bc (6)
AACTTC1.33 ± 0.52 b (6)1.83 ± 0.75 (6)2.20 ± 0.45 ab (5)1.82 ± 0.43 bc (6)
GACTCC1.40 ± 0.55 b (5)1.75 ± 0.26 bc (5)
Note: numbers in parentheses are numbers of individuals that belong to the respective genotypes. The different superscript lowercase letters in the same column represent significant level at p < 0.05, and same letter or no letter represents no significant difference (p > 0.05). The number of combination genotypes less than 5 was not analyzed.
Table 11. Pyramiding effect of GnRHR (g.75G > A), FSHR (g.-112C > T, g.3236C > A) and BMP6 (g.951T > C) on litter size in CZ.
LociCombination GenotypeLitter Size (N)
First Parity (75)Second Parity (62)Third Parity (41)Fourth Parity (23)Average (75)
g.75G > A/g.-112C > T/g.3236C > A/g.951T > CGACTAACC2.11 ± 0.33 a (9)1.78 ± 0.44 (9)2.00 ± 0.54 (8)2.00 ± 0.00 a (5)2.01 ± 0.30 b (9)
GATTCACC1.67 ± 0.52 (6)1.83 ± 0.98 (6)2.33 ± 1.03 (6)1.33 ± 0.52 b (6)1.78 ± 0.31 b (6)
GACCAATC2.17 ± 1.17 ac (6)1.50 ± 0.55 (6)2.00 ± 0.00 (5)2.20 ± 0.45 a (5)1.88 ± 0.59 b (6)
GACCAACC1.50 ± 0.54 bc (8)2.00 ± 0.00 (7)2.14 ± 0.69 (7)1.57 ± 0.54 b (7)1.76 ± 0.47 b (8)
GATTAACC2.33 ± 0.82 a (6)2.17 ± 0.98 (6)2.20 ± 0.45 (5)2.08 ± 0.60 ab (6)
AACCCCTC1.40 ± 0.55 b (5)2.00 ± 0.71 (5)1.60 ± 0.55 (5)1.65 ± 0.27 b (5)
AACCCCCC1.29 ± 0.49 b (7)2.29 ± 0.95 (7)2.20 ± 0.45 (5)1.89 ± 0.48 b (7)
GACTCACC1.60 ± 0.55 (5)2.20 ± 0.45 (5)1.96 ± 0.09 b (5)
GACTAATC2.00 ± 0.71 (5)1.80 ± 0.84 (5)1.96 ± 0.25 b (5)
GACTCCCC1.86 ± 0.69 (7)2.17 ± 1.17 (6)2.06 ± 0.26 b (7)
GACCCCCC1.40 ± 0.55 bc (5)1.60 ± 0.42 b (5)
AACCAACC2.33 ± 1.03 a (6)2.56 ± 0.81 a (6)
Note: numbers in parentheses are numbers of individuals that belong to the respective genotypes. The different superscript lowercase letters in the same column represent significant level at p < 0.05, and same letter or no letter represents no significant difference (p > 0.05). The number of combination genotypes less than 5 was not analyzed.
Table 12. Pyramiding effect of GnRHR (g.75G > A), FSHR (g.3236C > A) and BMP6 (g.951T > C) on litter size in LZ.
LociCombination GenotypeLitter Size (N)
First Parity (274)Second Parity (142)Average (274)
g.75G > A/g.3236C > A/g.951T > CGGCCTC1.19 ± 0.40 b (16)1.56 ± 0.53 c (9)1.33 ± 0.39 b (16)
GGCCCC1.42 ± 0.51 bc (12)2.00 ± 0.00 ac (5)1.56 ± 0.45 bc (12)
GGCATC1.47 ± 0.51 bc (19)1.70 ± 0.67 (10)1.59 ± 0.42 bc (19)
GGCACC1.47 ± 0.51 bc (19)2.00 ± 0.00 a (10)1.61 ± 0.43 bc (19)
GGAATC1.59 ± 0.50 (22)1.40 ± 0.52 bc (10)1.50 ± 0.48 bc (22)
GGAACC1.74 ± 0.45 (19)1.63 ± 0.52 (8)1.66 ± 0.44(19)
GACCTC1.33 ± 0.49 b (15)1.90 ± 0.57 ac (10)1.50 ± 0.50 bc (15)
GACCCC1.67 ± 0.50 (9)1.80 ± 0.45 (5)1.61 ± 0.49 (9)
GACATC1.42 ± 0.51 bc (19)1.79 ± 0.43 (14)1.62 ± 0.33 bc (19)
GACACC1.45 ± 0.51 bc (20)1.90 ± 0.32 ac (10)1.55 ± 0.43 bc (20)
GAAATC1.48 ± 0.51 bc (33)1.72 ± 0.46 (18)1.62 ± 0.42 bc (33)
GAAACC1.50 ± 0.51 bc (28)1.93 ± 0.26 ac (15)1.63 ± 0.40 bc (28)
AACATC1.50 ± 0.76 (8)2.00 ± 1.00 ac (5)1.67 ± 0.54 (8)
AACACC1.78 ± 0.44 acd (9)1.88 ± 0.64 ac (8)1.80 ± 0.43 ac (9)
AACCCC1.86 ± 0.38 ac (7)1.60 ± 0.55 (5)1.79 ± 0.27 ac (7)
AAAACC2.00 ± 0.76 a (8)2.00 ± 0.76 a (8)
AAAATC1.67 ± 0.52 (6)1.78 ± 0.40 ac (6)
GAAATT1.60 ± 0.55 (5)1.50 ± 0.50 bc (5)
Note: numbers in parentheses are numbers of individuals that belong to the respective genotypes. The different superscript lowercase letters in the same column represent significant level at p < 0.05, and same letter or no letter represents no significant difference (p > 0.05). The number of combination genotypes less than 5 was not analyzed.
Disclaimer/Publisher’s Note: The statements, opinions and data contained in all publications are solely those of the individual author(s) and contributor(s) and not of MDPI and/or the editor(s). MDPI and/or the editor(s) disclaim responsibility for any injury to people or property resulting from any ideas, methods, instructions or products referred to in the content.

