Article

Effect of Substituting Soybean Meal in Oreochromis niloticus Diets with Pumpkin (Cucurbita maxima) Seed Cake on Water Quality, Growth, Antioxidant Capacity, Immunity, and Carcass Composition

by
Hossam A. M. Mounes
1,
Zeinab M. A. Abd-El Azeem
2,
Dena. A. Abd El-Bary
3,
Adham A. Al-Sagheer
4,*,
Yasmina M. Abd-Elhakim
5,
Bayan A. Hassan
6,
Sherif S. Sadek
7 and
Kareem. M. Ahmed
2
1
Limnology Department, Central Laboratory for Aquaculture Research, Agricultural Research Center, Abassa, Abu Hammad 44662, Egypt
2
Fish Production Branch, Department of Animal Production, Faculty of Agriculture, Ain Shams University, Cairo 11241, Egypt
3
Regional Center for Food and Feed, Agricultural Research Center, Giza 12619, Egypt
4
Department of Animal Production, Faculty of Agriculture, Zagazig University, Zagazig 44511, Egypt
5
Department of Forensic Medicine and Toxicology, Faculty of Veterinary Medicine, Zagazig University, Zagazig 44519, Egypt
6
Pharmacology Department, Faculty of Pharmacy, Future University, Cairo 11835, Egypt
7
Aquaculture Consultant Office, 9 Street No. 256, New-Maadi, Cairo 11435, Egypt
*
Author to whom correspondence should be addressed.
Animals 2024, 14(2), 195; https://doi.org/10.3390/ani14020195
Submission received: 24 November 2023 / Revised: 29 December 2023 / Accepted: 4 January 2024 / Published: 7 January 2024
(This article belongs to the Special Issue Sustainable Feed Ingredients in Freshwater Aquaculture)

Abstract

:

Simple Summary

Soybean meal is a widely utilized protein source in aquatic feeds; however, its application in fish diets may be restricted due to elevated prices; market fluctuations; and heightened human, poultry, and livestock consumption. Therefore, utilizing unused agro-industrial by-products as alternative protein sources can reduce dependence on soybean meal, promote economic viability in tilapia farming, and address sustainability issues in aquaculture. This research examined the effects of substituting soybean meal with pumpkin seed cake in Nile tilapia diets concerning growth, water quality, antioxidant capacity, immune status, and body composition. The findings indicate that replacing 40% of dietary soybean meal protein with pumpkin seed cake can lead to significant improvements in growth, antioxidant capacity, and immune status in Nile tilapia fish.

Abstract

A 10-week feeding experiment was performed to determine the impacts of partial substitution of soybean meal (SB) with pumpkin seed cake (PSC) in Oreochromis niloticus diets on water quality, growth rate, antioxidant capacity, immunity, and carcass composition. One hundred and fifty tilapia fish (average weight, 11.93 ± 0.17 g) were randomly allocated to five diets. The first diet (the basal diet) contained 420 g of SB per kg of feed. The remaining four diets, namely, D1, D2, D3, and D4, had SB partially replaced by PSC at 10%, 20%, 30%, and 40%, respectively. The results revealed that D4 and D1 significantly improved dissolved oxygen levels, while water temperature, pH, total ammonia, and nitrate levels were not significantly affected. Replacing SB with PSC significantly improved specific growth performance indicators and feed conversion compared to the control, with the D4 group showing the best values. Increasing PSC levels decreased serum glucose, aspartate aminotransferase, alanine aminotransferase, cholesterol, and triglyceride levels. In contrast, the D4 group had higher globulin, albumin, total protein, and lysozyme serum levels. Moreover, fish-fed PSC had significantly increased superoxide dismutase, glutathione peroxidase, and catalase activities and significantly decreased malondialdehyde levels. Increasing PSC substitution levels in fish diets increased the ash and crude lipid contents in the bodies of the fish, while crude protein and moisture decreased. In conclusion, replacing SB with PSC in fish diets significantly enhances growth performance, feed conversion, and fish health. Moreover, the findings suggest that PSC can be a promising alternative protein source for sustainable aquaculture practices.

1. Introduction

Aquaculture is an important industry that provides a significant source of protein for human consumption [1]. Nile tilapia (Oreochromis niloticus) is the world’s third-most commonly farmed fish species. It played a significant role, contributing approximately 5% to the total production of fish aquaculture and surpassing a cumulative output of 4.41 million tons in 2020 [2]. It is considered one of the world’s most extensively farmed fish species due to its rapid growth rate, adaptability to various environments, and high meat quality [3,4]. After China and Indonesia, Egypt is the third-largest producer of Nile tilapia globally [5]. However, the high cost of feed, especially protein sources such as soybean meal, is a major constraint on the sustainable development of tilapia farming [6]. Soybean meal (SM) is a beneficial source of protein in animal nutrition due to its superior amino acid profile and high crude protein content [7]. The increasing demand for SM and market price increases have prompted the aquaculture sector to search for environmentally friendly and cost-effective substitute feed ingredients [8,9,10]. Therefore, using unutilized agro-industrial by-products as alternative protein sources can reduce dependence on SM, ensure the economic viability of tilapia farming, and address sustainability challenges in aquaculture [6,11].
Pumpkin seed cake (PSC), produced when pumpkin seed oil is extracted, is rich in protein, fiber, and minerals [12]. Pumpkin seeds are pressed on a continuous screw press to produce PSC without affecting their nutrient contents [13]. Pumpkin seeds are known for various biological activities, including antioxidant, antimicrobial, anti-inflammatory, and antiparasitic effects [14]. In an earlier study, the nutritional composition of PSC was compared to that of SM [15]. The authors demonstrated that the gross energy, crude protein, and ether extract contents of PSC (59.8%, 12.46%, and 21.9 MJ/kg DM, respectively) were greater than those of SM (47.42%, 2.83%, and MJ/kg DM, respectively). Proteins isolated from PSC exhibited significantly higher concentrations of total sulfur amino acids than SM. Furthermore, PSC contains an abundant concentration of unsaturated fatty acids, including linoleic acid (50.9%), stearic acid (6.7%), palmitic acid (14.8%), and oleic acid (25.8%) [16,17]. Moreover, PSC has a low moisture content of about 7%, which makes it a suitable feed constituent for long-term storage and transport. In addition to being a source of protein, PSC is a prospective nutraceutical containing bioactive substances with beneficial health advantages, such as squalene, tocopherols, and phytosterols [12,16,18]. Utilizing by-products such as PSC in animal feeds can provide an economic benefit due to their reduced market price and provide feed producers with alternative feed ingredients. Nevertheless, limited studies have investigated the potential of PSC as a feed ingredient in practical fish feeds [17,19,20]. Furthermore, the results of these reports are inconsistent and require further investigation.
It has been hypothesized that replacing SB with PSC in tilapia diets would decrease SB usage without significantly impacting fish health or performance. The present study evaluated whether replacing SM with PSC would affect water quality, growth indicators, diet utilization, carcass composition, blood biochemical, immunity, or antioxidant status. Our research provides essential information on the prospective utilization of PSC as a sustainable protein alternative in tilapia feeds.

2. Materials and Methods

2.1. Diet Preparation

The PSC used in the present study consisted of 88.10% dry matter, 10.78% crude lipid, 55.20% crude protein, and 10.72% ash. PSC and the rest of the feed ingredients in this study were obtained from a local market in Sharkia Governorate, Egypt. Five iso-nitrogenous (crude protein, 315 g kg−1) and isolipidic (crude lipid, 65 g kg −1) diets were formulated. The basal diet consisted of 420 g of SB per kg of diet, while in the remaining four diets, PSC replaced SB at 10%, 20%, 30%, and 40% (D1, D2, D3, and D4, respectively). All ingredients were ground into a fine powder, passed through a 200 µm mesh, and mixed thoroughly with vegetable and fish oils and water. The mixture was then pelletized with a feed mill (California Pellet Mill, San Francisco, CA, USA), dried for around a day in an oven until the dry matter levels reached about 90%, packed in sealed bags, and kept in a refrigerator at −20 °C until needed. All trial diets were prepared to meet the nutrient needs of tilapia, according to the recommendations of NRC [21]. Table 1 displays the nutrient composition and formulation of the diets.

2.2. Fish and Rearing Conditions

Before the experiment’s initiation, fiberglass tanks were cleaned and filled with dechlorinated tap water from the storage tank. Healthy Nile sex-reversed tilapia fingerlings were acquired from a commercial farm in Sharkia Governorate, Egypt. Fish were acclimated for ten days prior to the start of the experiment, during which they were fed the control diet three times a day, at 9:00, 13:30, and 17:00, until they reached apparent satiety. After acclimation, 150 juvenile (average weight, 11.93 ± 0.17 g) fish were randomly allocated to five groups, and each group had three fiberglass aquaria (water volume: 72 L; 10 fish per aquarium). The experimental diets (control, D1, D2, D3, and D4) were fed to the fish for 70 days, with the same schedule and procedures as during the acclimatization phase. The study was conducted with a photoperiod of 12 h light/12 h darkness. Every two days, 50% of the tank’s water was siphoned to eliminate suspended and dissolved wastes in the tanks, and a 0.5 Hp air blower continuously aerated the experimental tanks. Throughout the experiment, fish were hand-fed thrice daily (9:00, 13:30, and 17:00) at a feeding rate of 3% body weight to apparent satiation. Feed intake was adjusted per the new body mass every two weeks throughout the trial.

2.3. Water Quality Parameters

Every two weeks, physicochemical parameters were evaluated. At a depth of 20 cm, water samples from each aquarium were collected. pH was measured on-site using a digital pH meter (Fisher Scientific, Waltham, MA, USA). Dissolved oxygen and water temperature were determined using an oxygen and temperature meter (Jenway, London, UK). The ammonia concentration in the water samples was estimated by a multi-parameter analyzer (HANNA Instruments, Smithfield, RI, USA). According to APHA [22], the nitrate concentration was measured with a spectrophotometer (model Milton Roy 21D) at wavelengths of 410 nm.

2.4. Growth, Feed Utilization, and Body Indices

On the 70th day, fish were harvested, counted, and weighed in each aquarium. Livers and viscera were removed (3 fish/aquarium; n = 9 fish/treatment) and weighed to compute the viscerosomatic index (VSI) and hepatosomatic index (HSI). Growth and body indices such as feed conversion ratio (FCR), body weight gain (BWG), specific growth rate (SGR), VSI, and HSI were calculated using the following standard formula:
BWG   ( g   fish 1 ) = f i n a l   w e t   w e i g h t i n i t i a l   w e t   w e i g h t f i s h   n u m b e r   p e r   a q u a r i u m
SGR   ( % / day ) = L n   o f   f i n a l   w e t   w e i g h t L n   o f   i n i t i a l   w e t   w e i g h t p e r i o d ( d a y ) × 100
FCR = t o t a l   f e e d   i n t a k e ( g ) t o t a l   B W G ( g )
VSI   ( % ) = w e t   w e i g h t   o f   v i s c e r a f i s h   w e t   w e i g h t × 100
HSI   ( % ) = w e t   w e i g h t   o f   h e p a t o p a n c r e a s f i s h   w e t   w e i g h t × 100

2.5. Chemical Composition of the Diets and the Whole Carcass of Tilapia

Following the 10-week feeding experiment, three fish from each aquarium were sampled and frozen at −20 °C for chemical composition analysis of the carcass. The crude lipid, ash, moisture, and crude protein contents of the fish carcasses and experimental diets were estimated using AOAC [23] procedures. The moisture content was determined after three hours of dehydrating at 105 °C and a constant weight in an electric oven (JSON-100, Gongju, Republic of Korea). Five hours of combustion at 550 °C in a muffle furnace (Type 47900, Thermo Scientific, Waltham, MA, USA) were used to evaluate the ash content. The total lipid content was measured using a Soxhlet apparatus (El-Gomhouria Co., Zagazig, Egypt) and an ether extraction. After sulfuric acid digestion, the Kjeldal method was utilized to determine the crude protein level (N × 6.25).

2.6. Serum Biochemical, Immunity, and Antioxidant Parameters

At the end of the feeding trial, the fish were fasted for 24 h. Then, three fish per aquarium were anesthetized with MS-222 (100 mg/L) for blood sample collection from the caudal veins using non-heparinized syringes. The samples were centrifuged at 5000× g for 15 min at 4 °C to separate the serum, which was then stored at −20 °C for further examinations. The enzymatic activity of glutathione peroxidase (GPx), catalase (CAT), and superoxide dismutase (SOD), as well as the malondialdehyde (MDA) content, were measured by commercial kits from BioSource Inc., San Diego, CA, USA (Catalog number MBS480417, MBS2540413, MBS9718960, and MBS2540409, respectively). Lysozyme (LZM) activity was determined in line with the procedures of Ghareghanipoora et al. [24]. Serum total lipids, glucose, total protein (TP), albumin (ALB), creatinine, and uric acid concentrations were assessed colorimetrically using commercial kits (Bio-Diagnostics, Cairo, Egypt) with the catalog numbers TL 20 10, GL 13 20, TP 20 20, AB 10 10, CR 12 50, and UA 21 20, respectively. Globulin content was computed by subtracting ALB levels from TP levels. Serum alanine (ALT) and aspartate aminotransferase (AST) activities were quantified using Bio-diagnostics (Cairo, Egypt) colorimetric kits (AL 10 31 (45) and AS 10 61 (45), respectively).

2.7. Statistical Analysis

The significance of growth, feed utilization, body indices, water quality, carcass composition, and blood contents was discovered via one-way ANOVA using SAS software (Version 9.00) [25]. Then, Tukey’s post hoc test was used. The optimal level of substitution using PSC was determined through the use of polynomial regression analysis, as explained by Yossa and Verdegem [26]. The third-order polynomial regression (cubic) provided a better fit to the observed patterns in our dataset compared to linear or quadratic models. Statistical significance was set at p < 0.05. In addition, correlations among growth performance indicators, the carcass composition, and serum biochemical parameters were examined by the Pearson coefficient of pairwise comparison between samples. They were recognized from the correlation matrix heatmap produced via GraphPad Prism version 8 (GraphPad Software, San Diego, CA, USA) [27].

3. Results

3.1. Water Quality

Figure 1A–E displays the estimated water quality parameters determined every second week throughout the experimental period. The values of temperature, pH, dissolved oxygen, ammonia, and nitrate were in the ranges of 28.67–29.13 °C, 8.29–8.42, 5.26–6.85 mg/L, 0.52–0.84 mg/L, and 0.08–0.16 mg/L, respectively, during the trial.

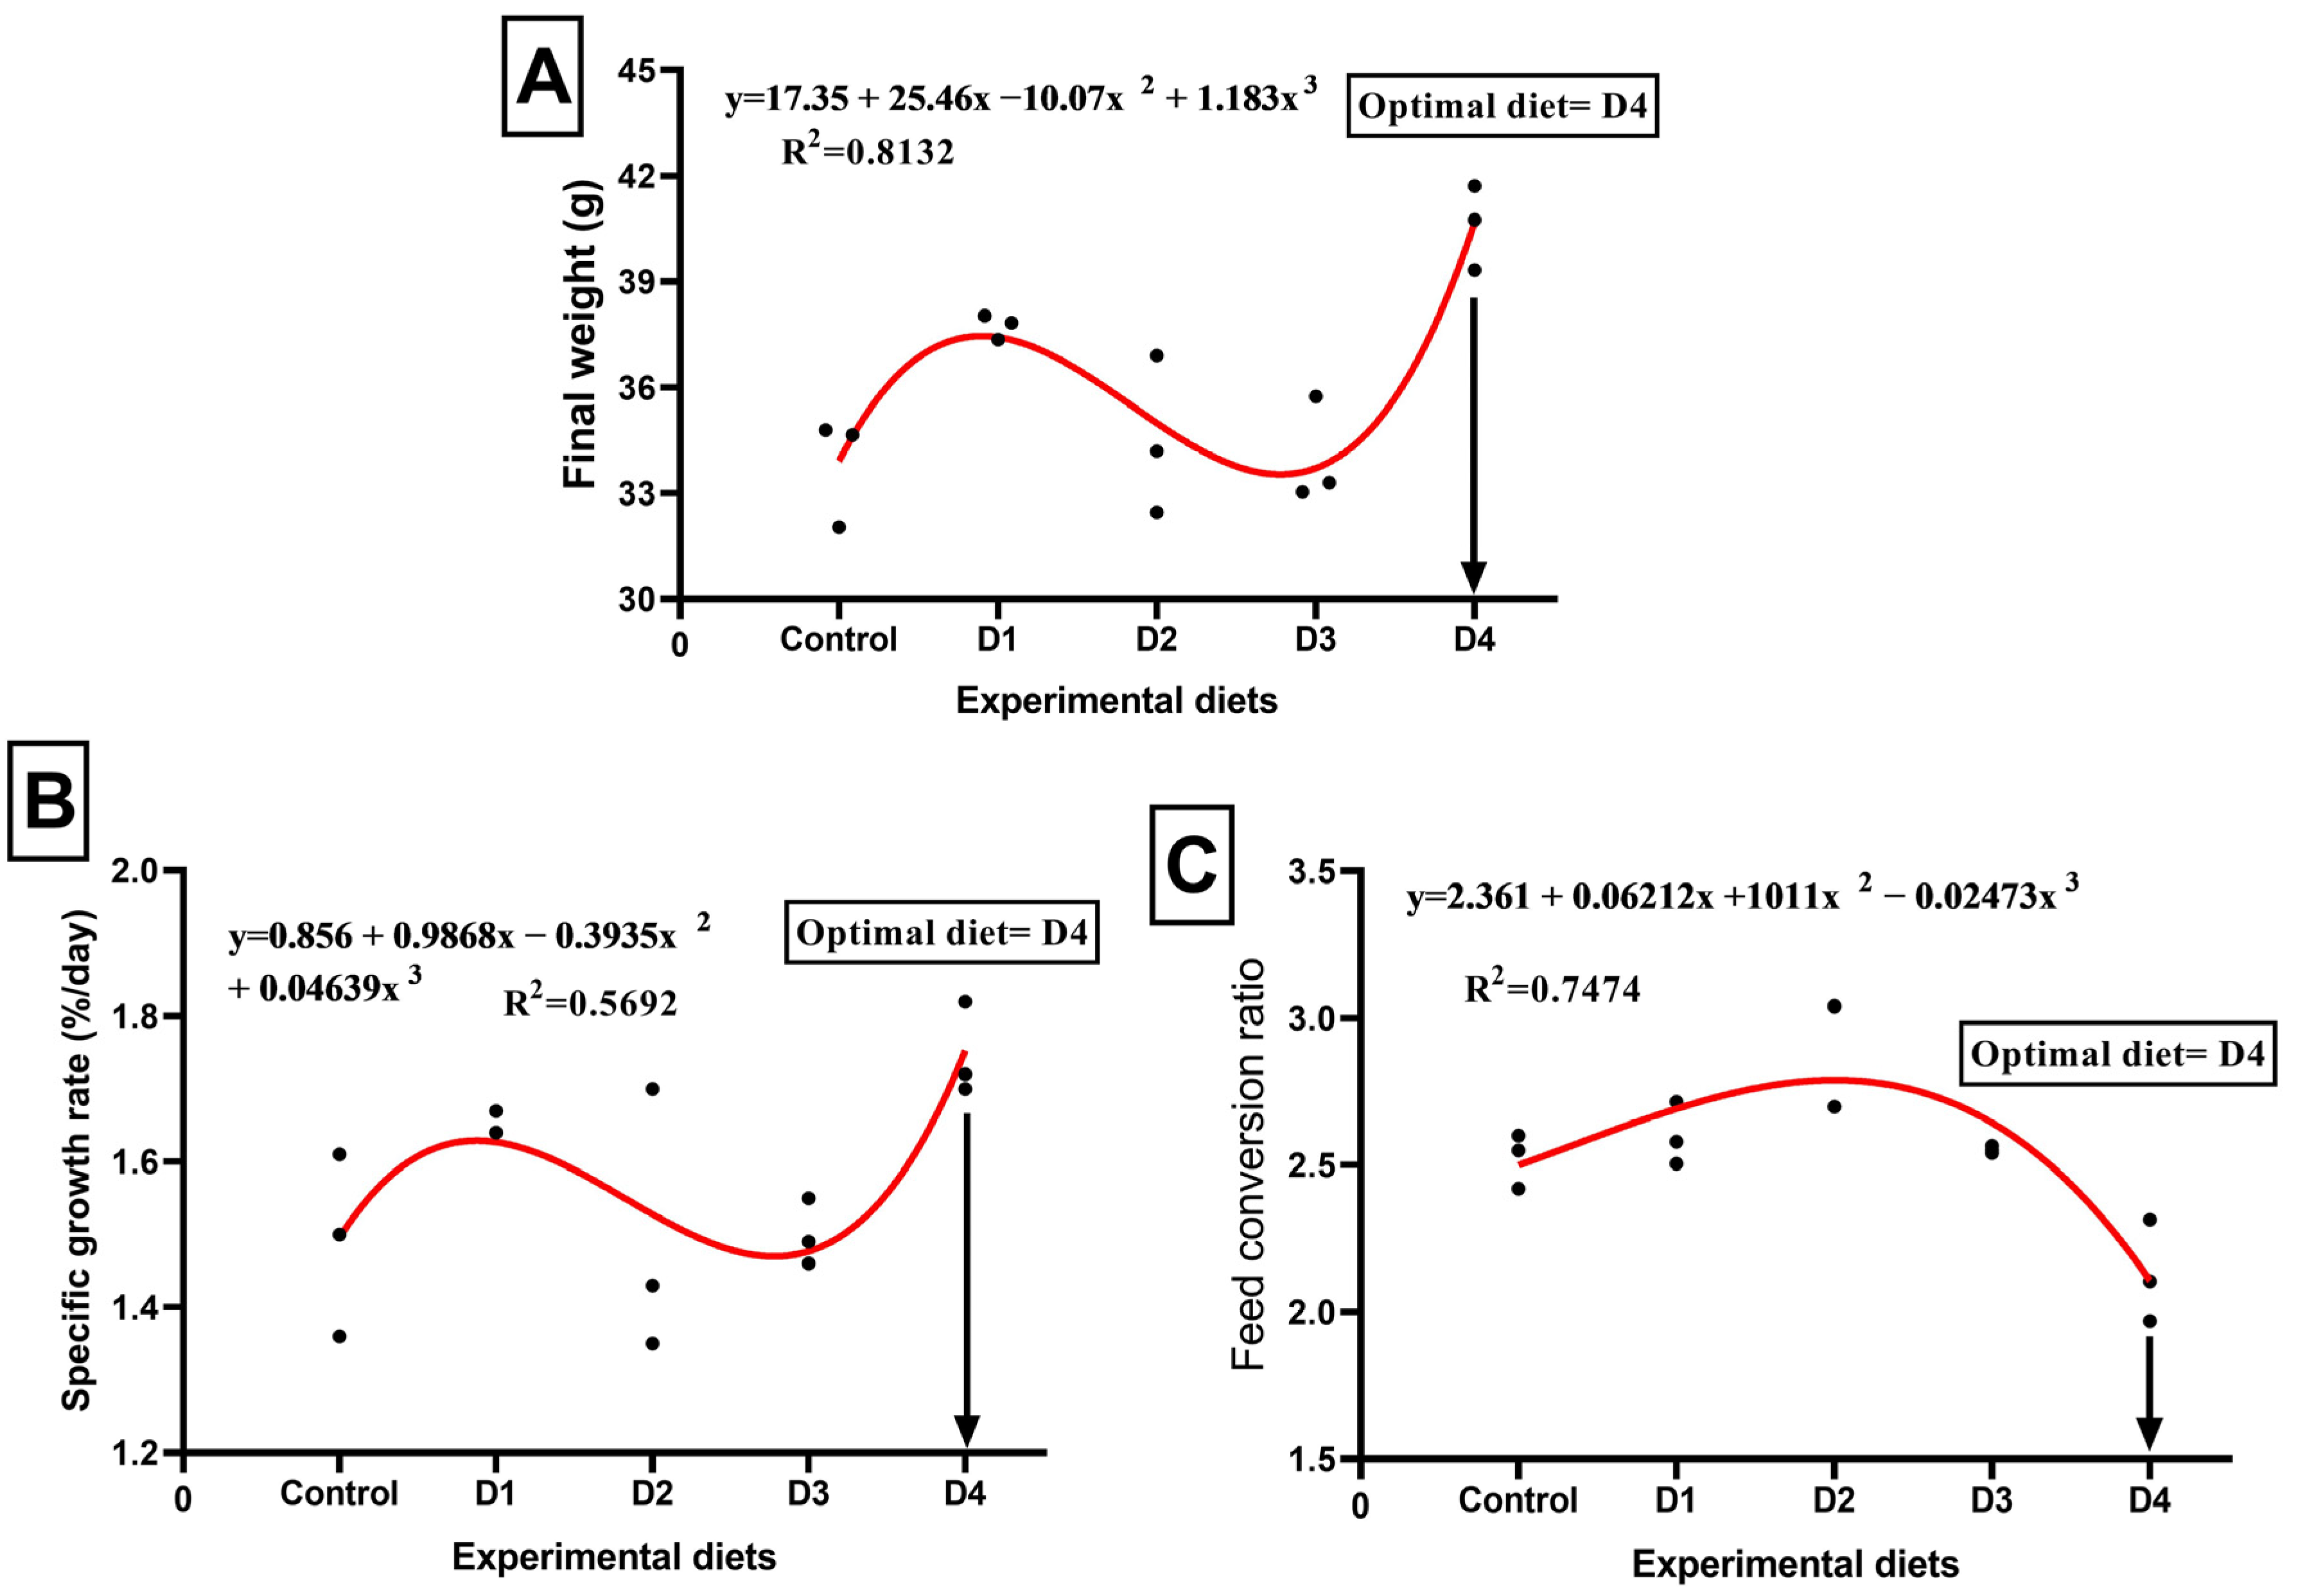
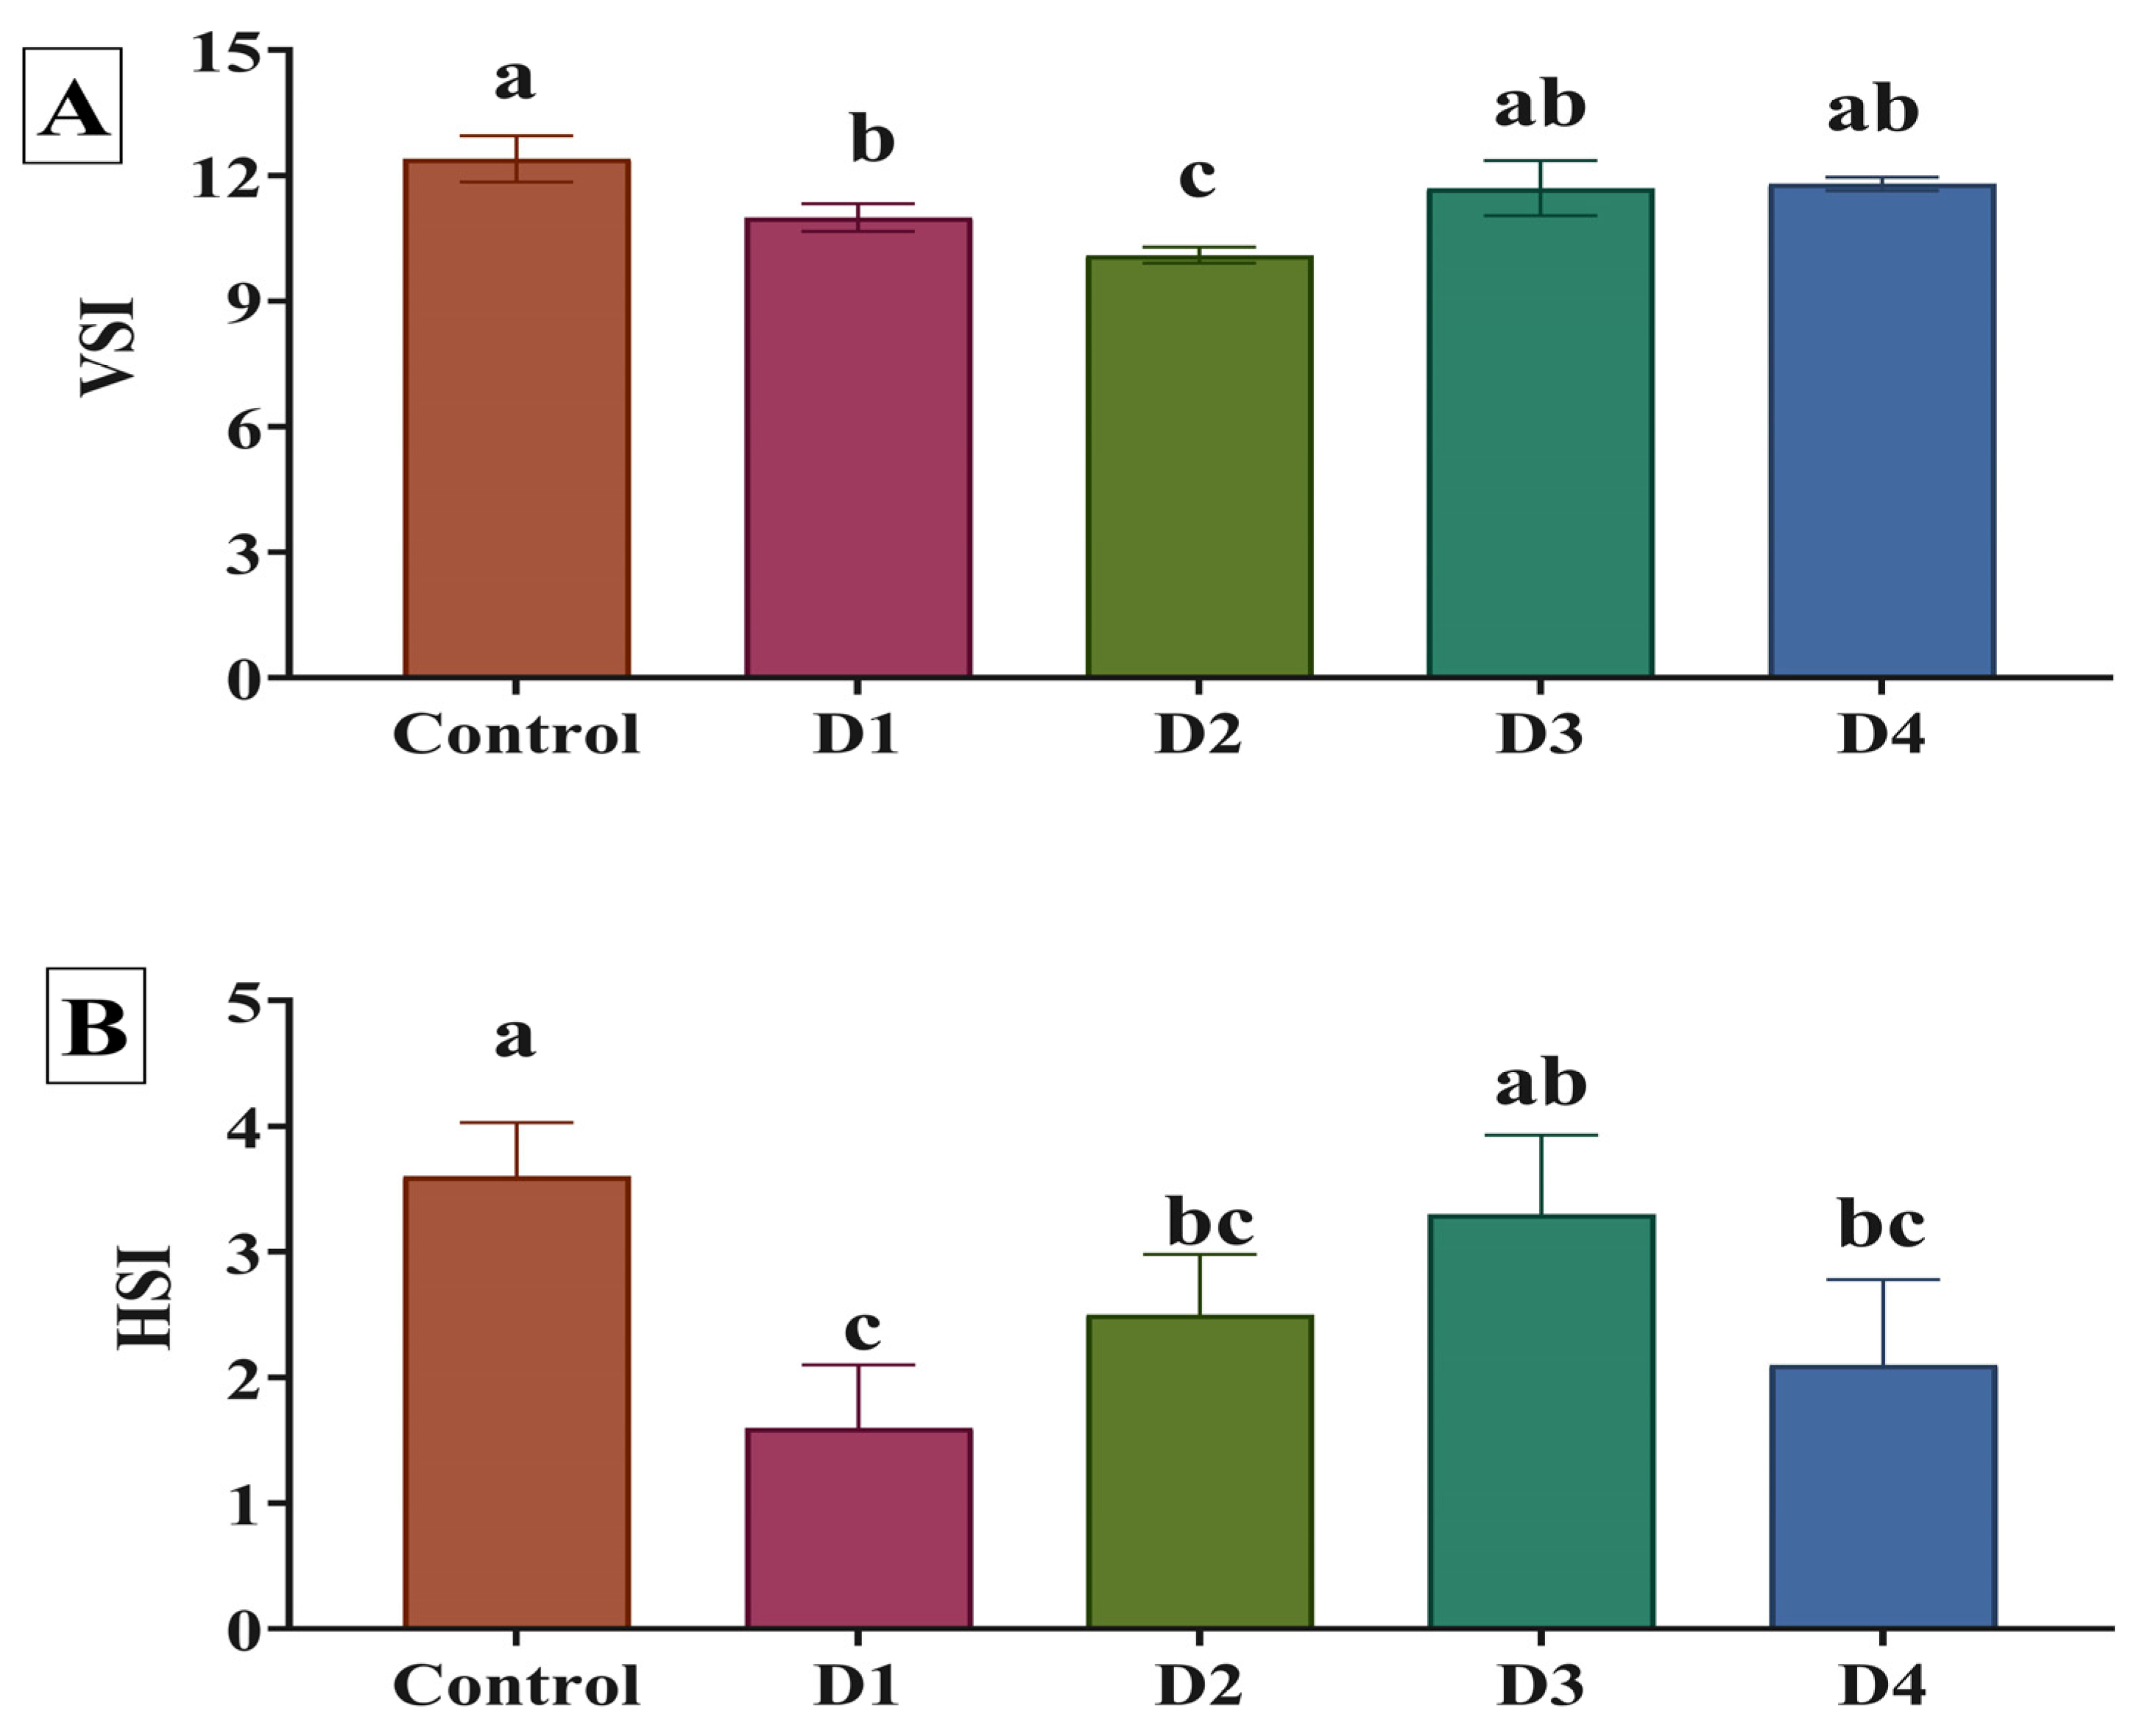
3.2. Growth Performance and Body Indices

Table 2 illustrates the growth indicators of O. niloticus fed the different experimental diets after 70 days of the experiment. The growth and feed efficiency parameters of Nile tilapia were enhanced by PSC-based diets compared to the control diet. The D4 group exhibited the greatest improvements in final weight, BWG, SGR, and FCR when PSC was substituted for SB. Feed intake was significantly (p < 0.05) increased in the fish fed on the D1 and D2 diets. The relationships between SGR, final weight, and FCR, as well as the different substitution levels using PSC, were best expressed by third-order polynomial regression (cubic) equations, where final weights were as follows: y = 17.35 + 25.46x − 10.07x2 + 1.183x3, R2 = 0.8132 (Figure 2A); SGR: y = 0.856 + 0.9868x −0.3935x2 + 0.04639x3, R2 = 0.5692 (Figure 2B); and FCR: y = 2.361 + 0.06212x + 1011x2 − 0.02473x3, R2 = 0.7474 (Figure 2C). Based on the polynomial regression analysis, the optimal substitution level using PSC for the maximum final weight and SGR and the best FCR were found in the fish fed on the D4 diet. As displayed in Figure 3, VSI and HSI showed significant differences in favor of PSC treatments compared to the control treatment. The lowest VSI value was detected in the D2 group, while the highest was found in the control treatment group. The highest HSI record was found in the control treatment, while the lowest was recorded in the D1 group.

3.3. Carcass Composition

Table 3 displays the whole-body composition of O. niloticus fed the experimental diets which substituted SB with PSC for 70 days. Increasing PSC substitution levels in fish diets increased the ash (except the D4 group) and crude lipid contents in the bodies of the fish. In contrast, the crude protein and moisture contents in the fish decreased as PSC substitution increased in their diets.

3.4. Blood Biochemical Biomarkers

The results concerning blood biochemical biomarkers, as affected by SB’s replacement with PSC, are presented in Table 4. Reduced total cholesterol and triglyceride concentrations were observed as a dose–response with increasing PSC levels in the diets, and the D4 group had the lowest values (p < 0.05). Following the same trend, the serum contents of ALT, AST, creatinine, and urea were significantly decreased with all dietary inclusion levels of PSC. Significantly (p < 0.05) lower glucose was detected in the D4-fed fish compared to the control group. Total protein and globulin levels in the blood of fish fed the D1 and D4 diets were significantly (p < 0.05) higher than those of fish fed other experimental diets. In contrast, albumin levels in the blood of fish fed the D1, D3, and D4 diets were significantly (p < 0.05) higher than those of fish fed the control diet (Table 4).

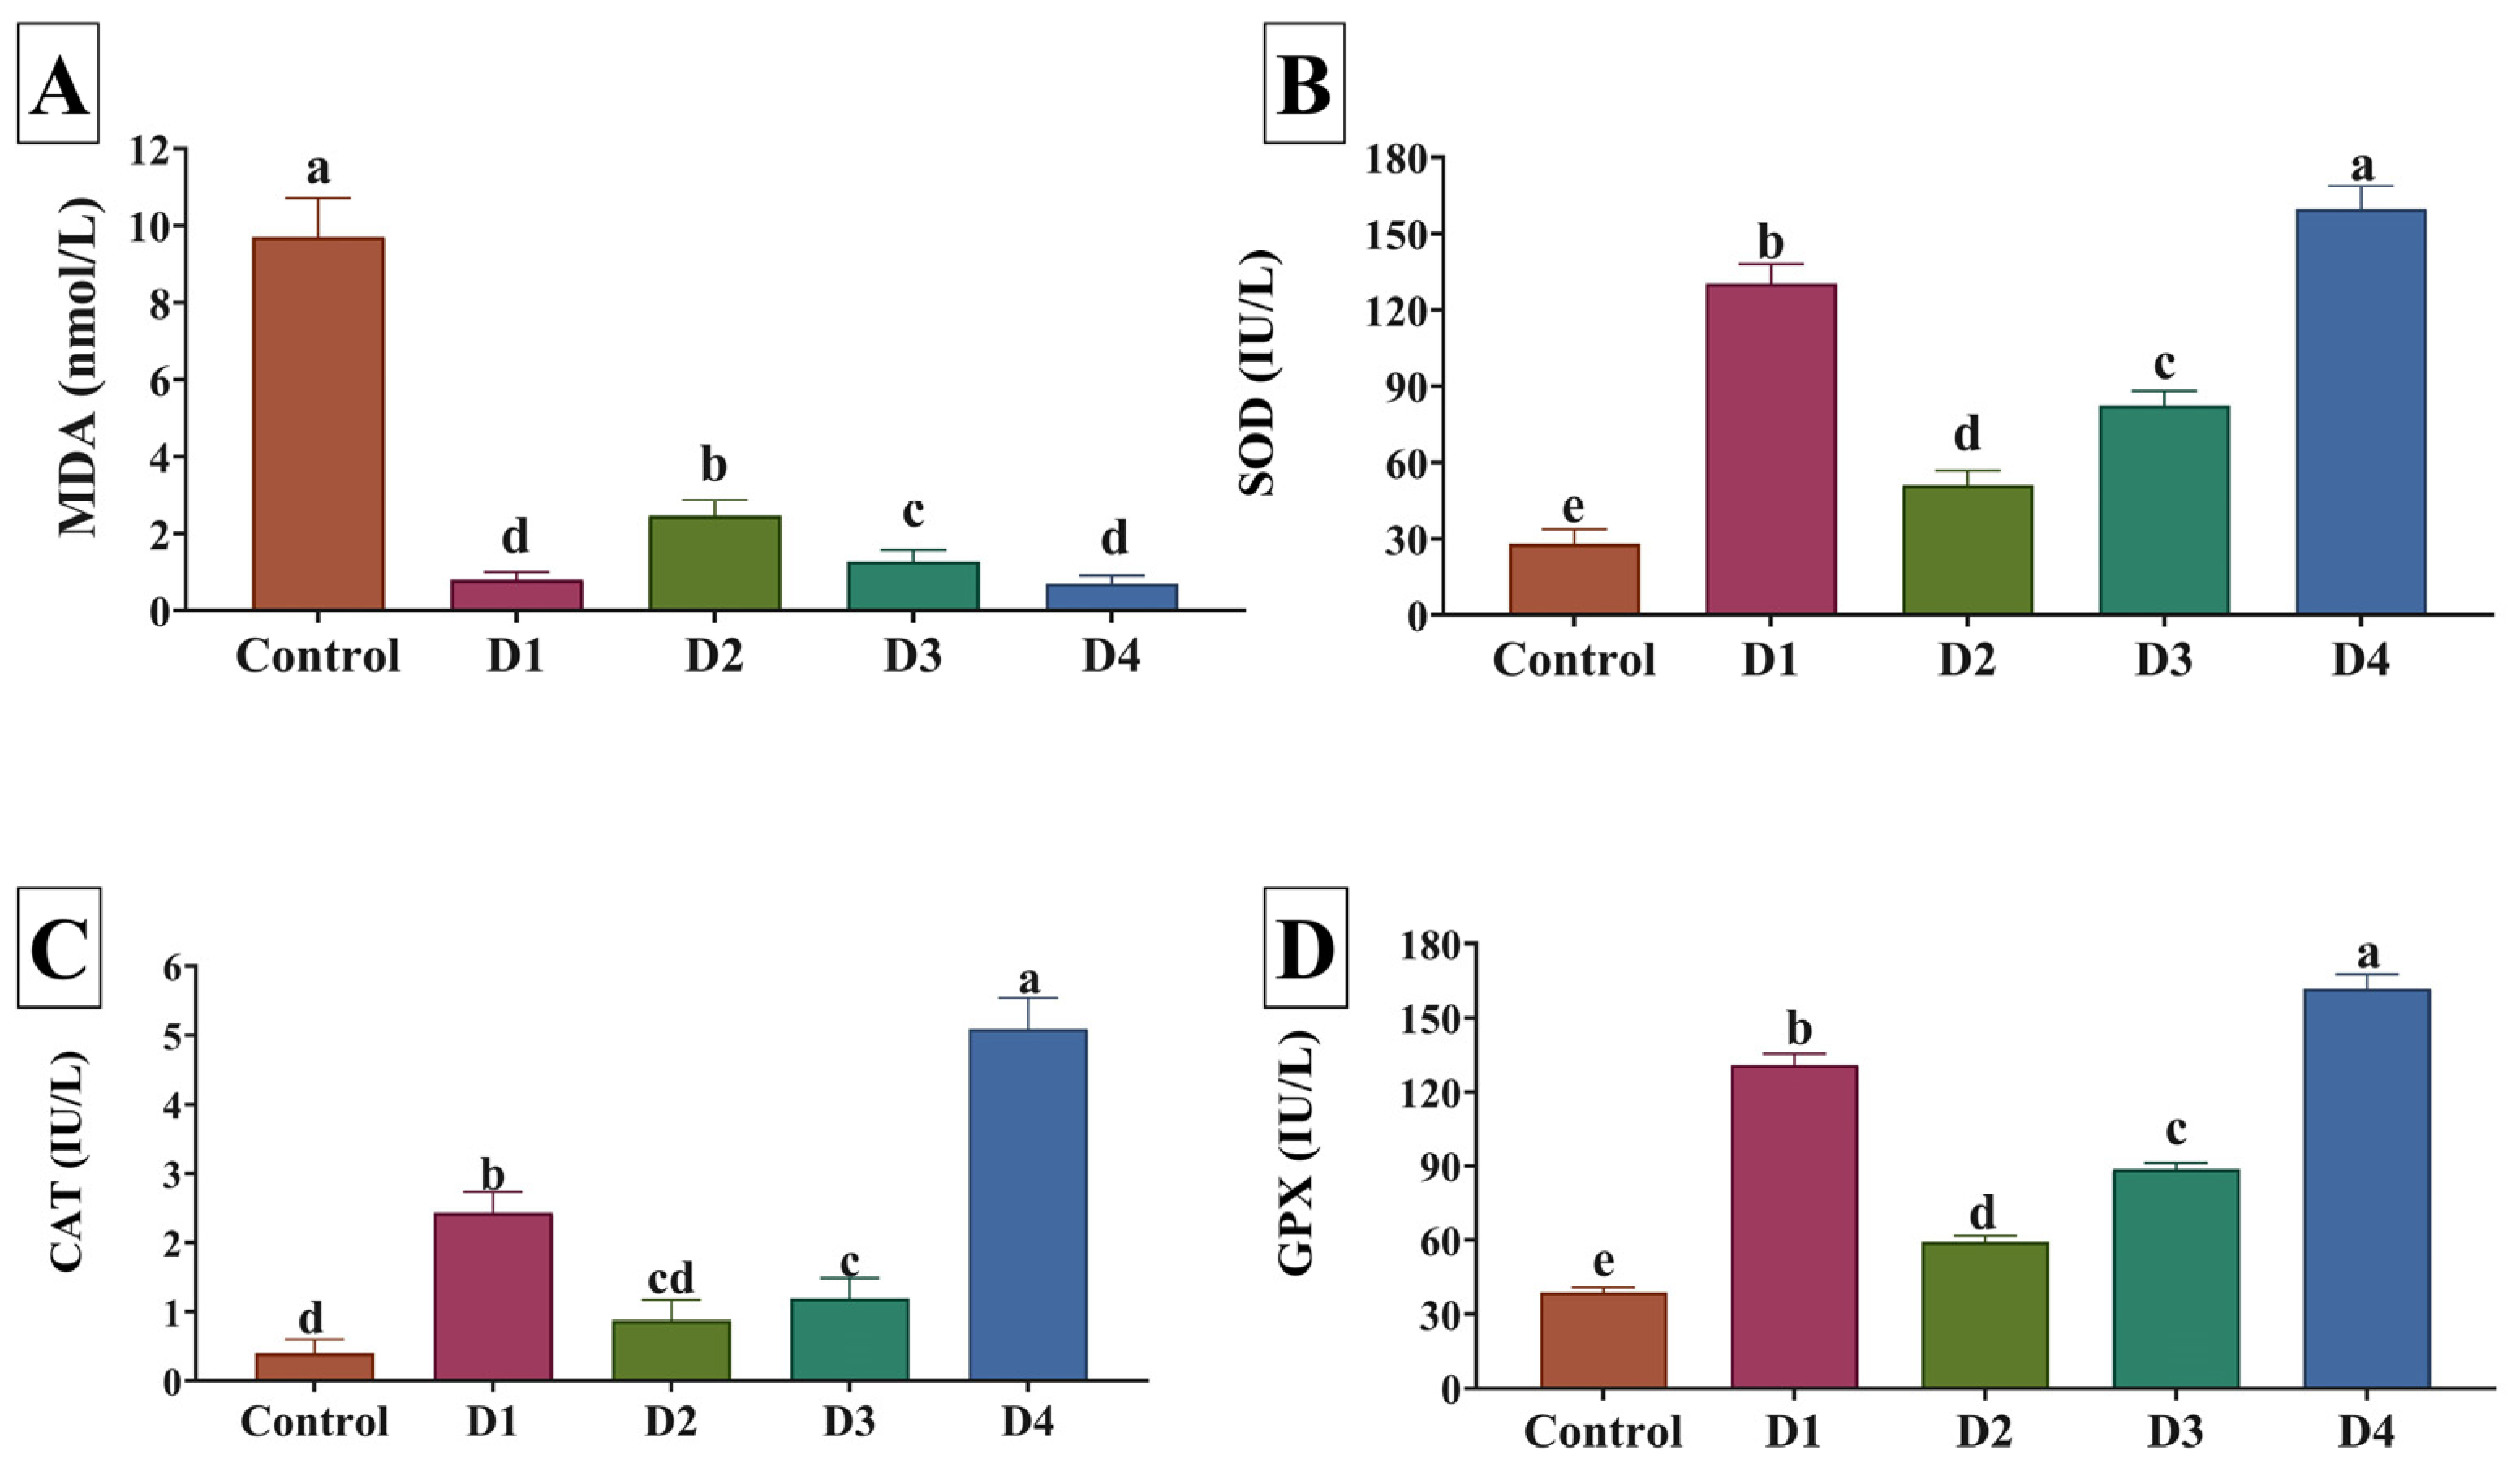
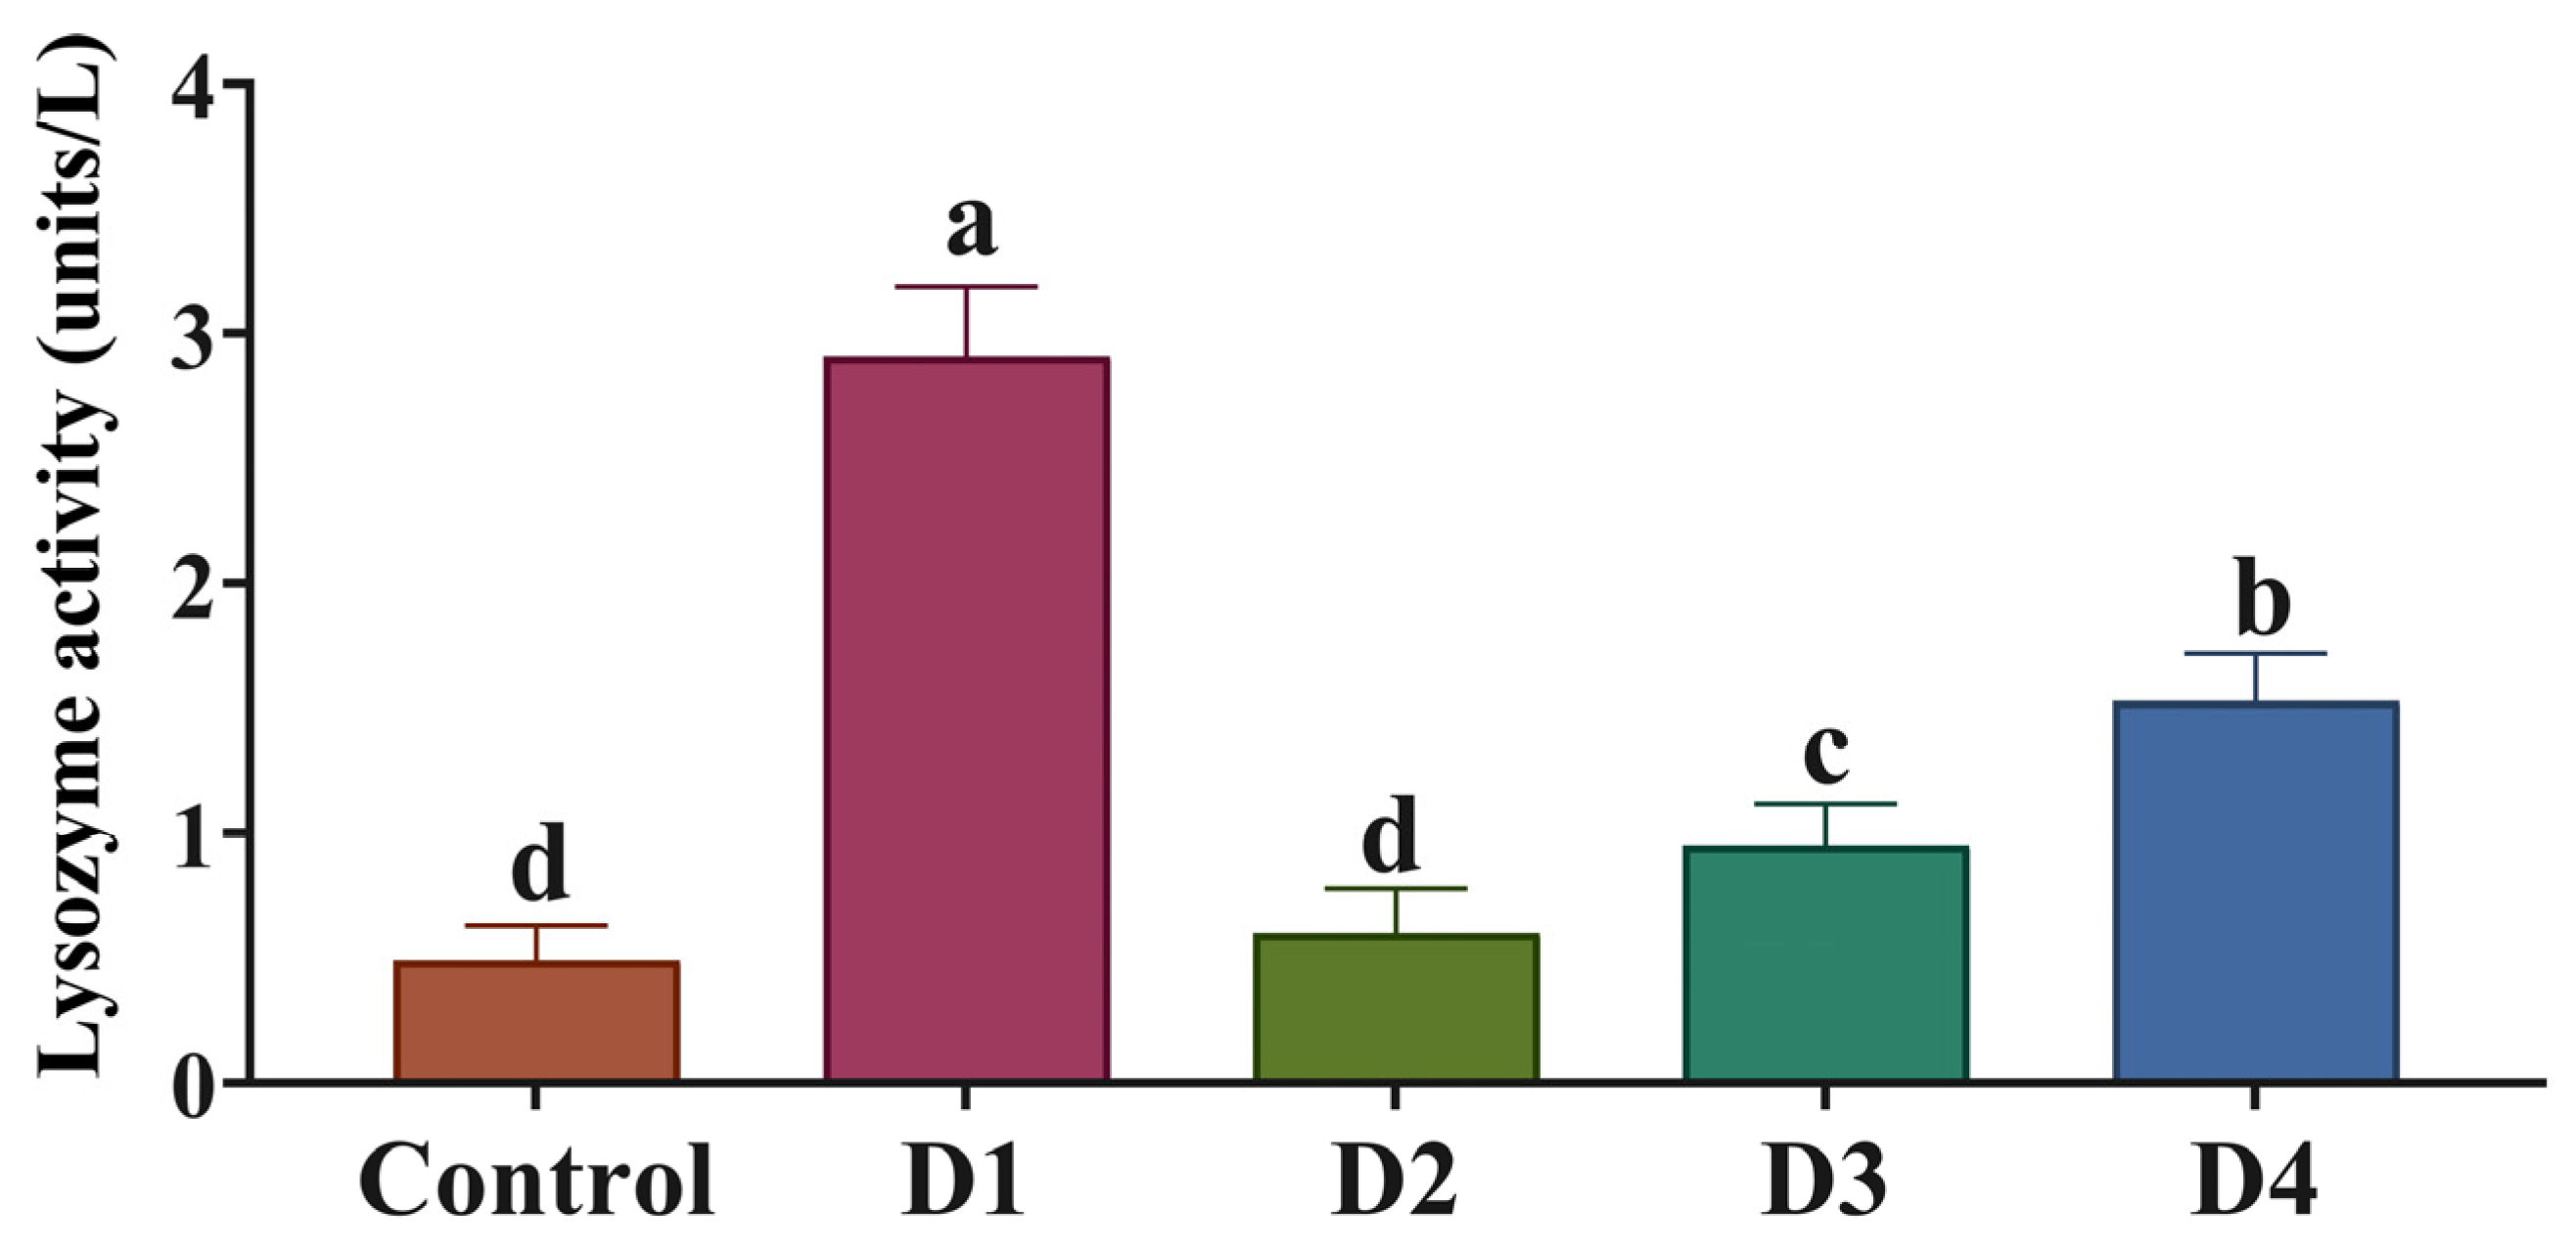
3.5. Antioxidant Activity and Immune Status

SOD, GPx, and CAT activities were markedly higher (p < 0.05) in all dietary incorporation levels of PSC relative to the control group (Figure 4). Notably, their highest values were detected in the D4 group. Conversely, reduced MDA levels were detected with all PSC substitution levels in diets, and the D1 and D4 groups had the lowest values (p < 0.05). Regarding lysozyme activity, fish fed PSC diets exhibited significantly (p < 0.05) higher activity than those fed the control diet (Figure 4). Fish fed the D1 diet had the most increased lysozyme activity in their serum compared with those fed the other diets (Figure 5).

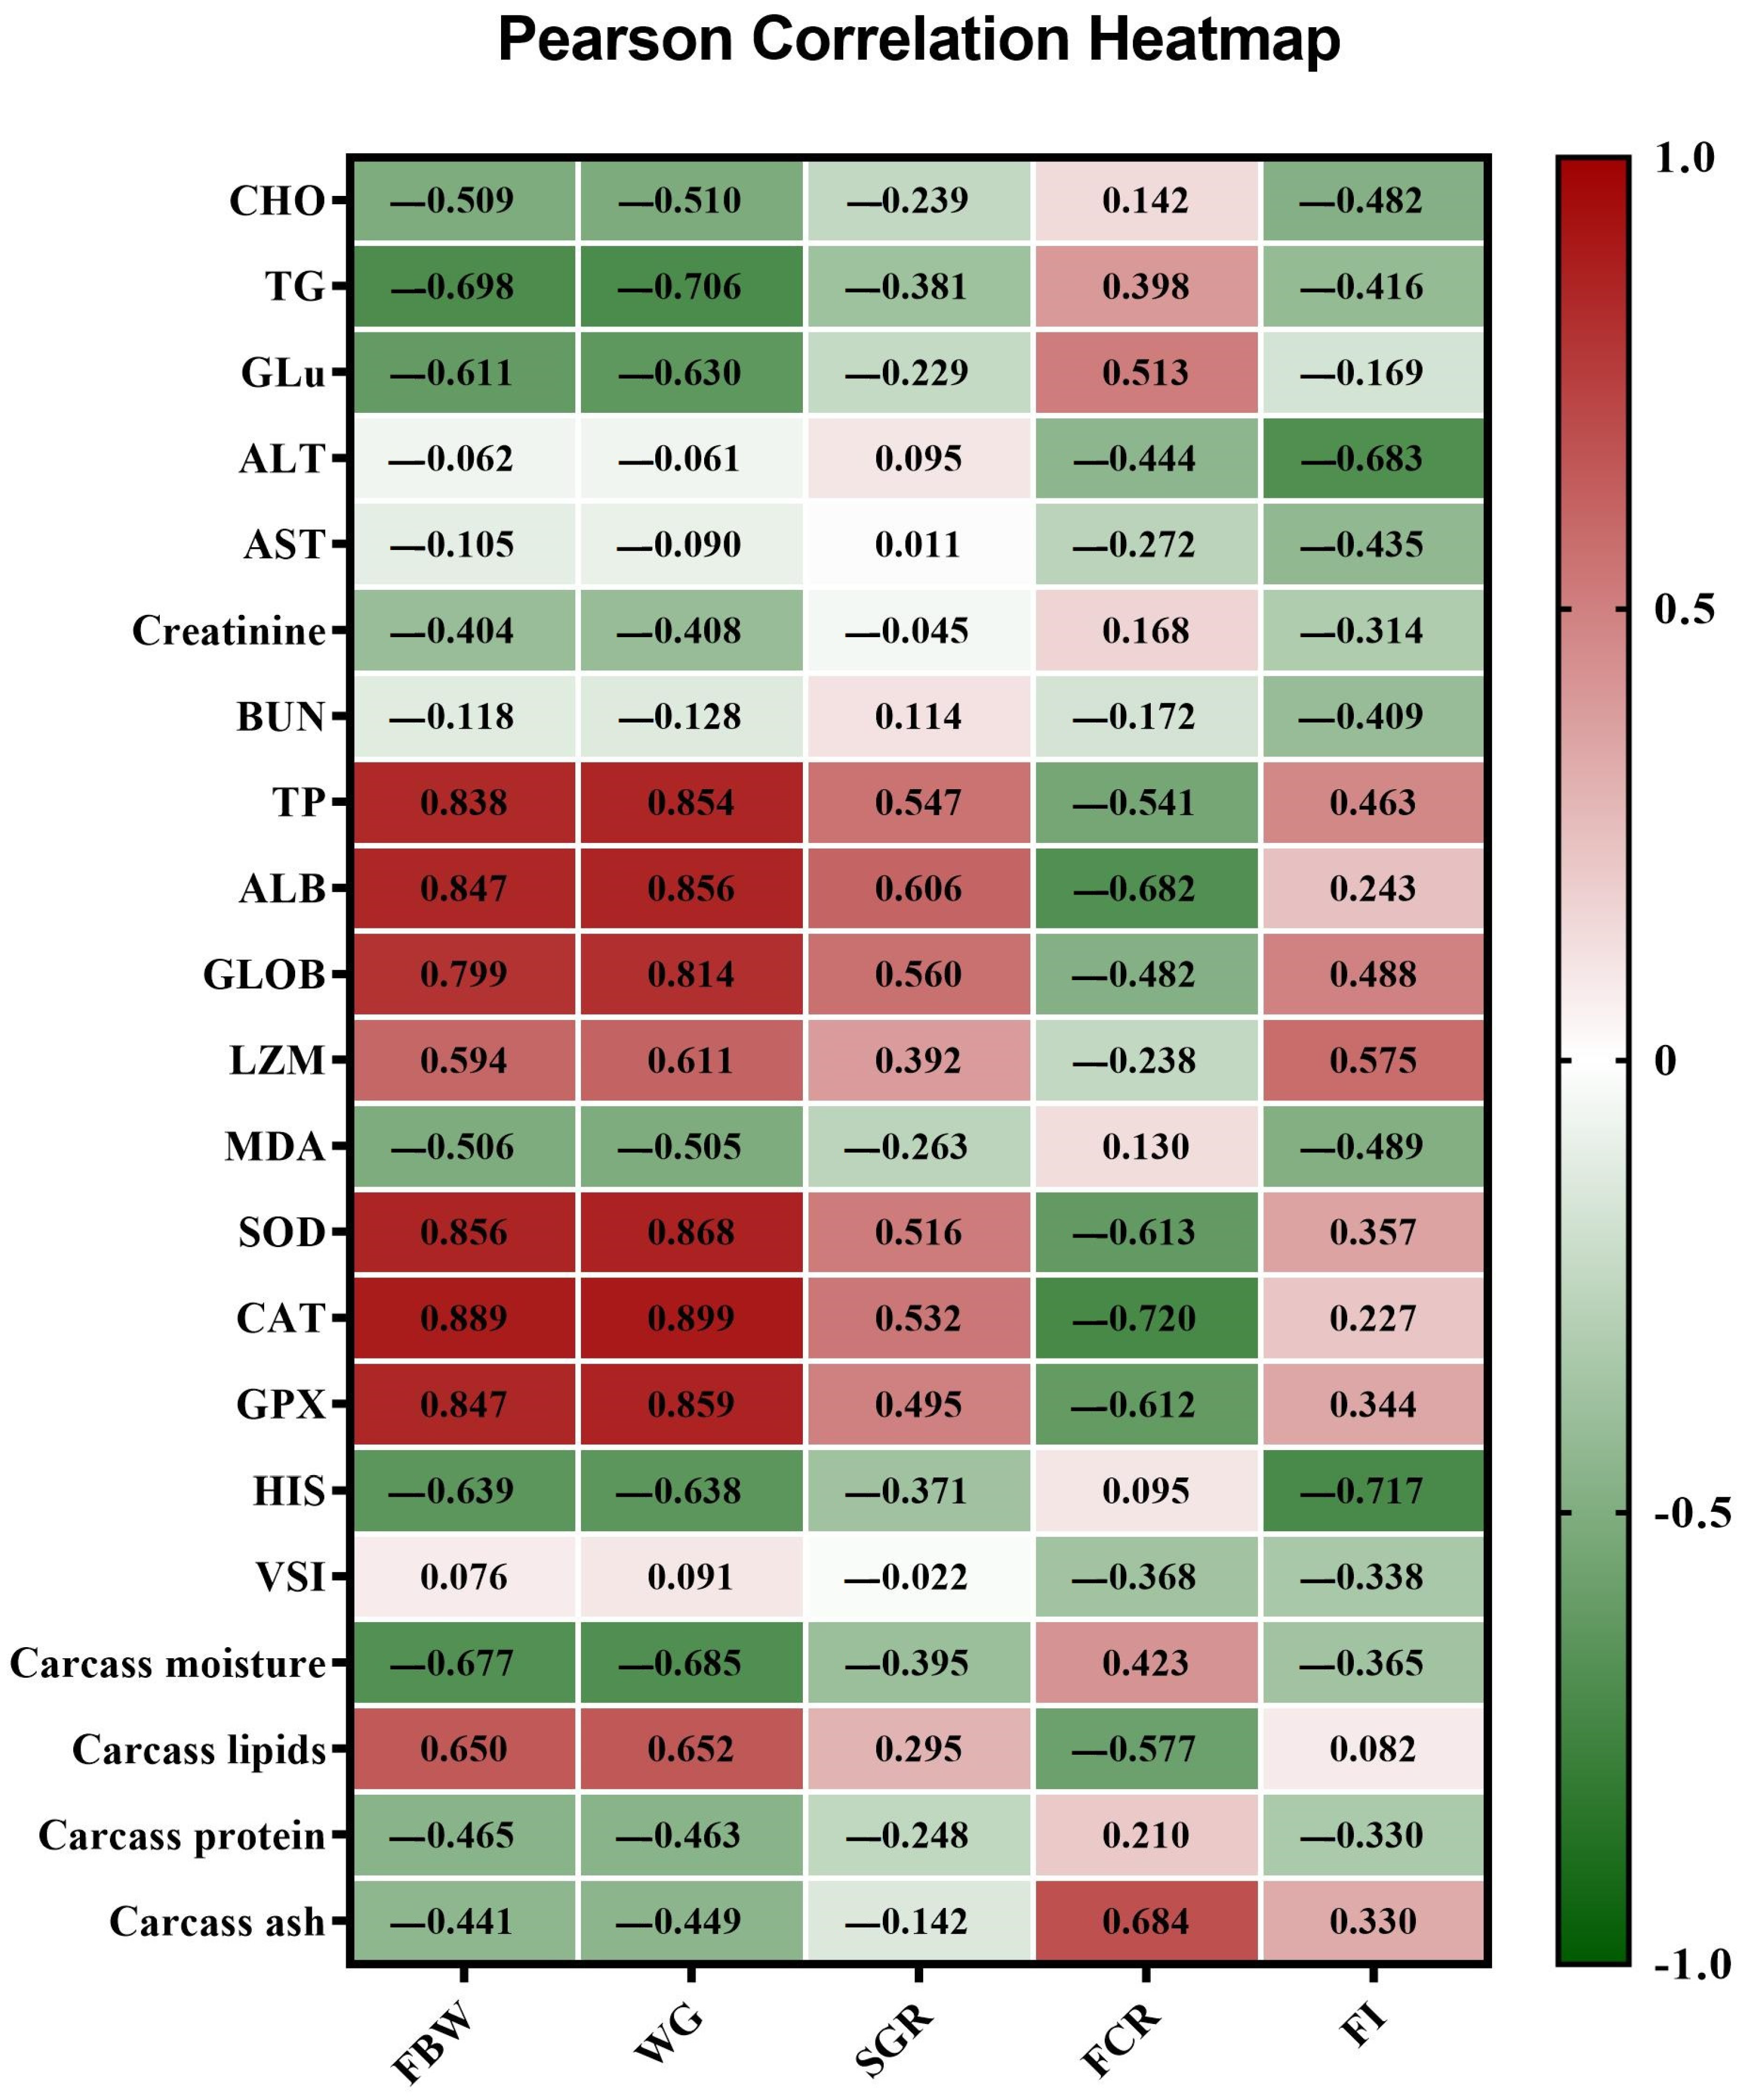
3.6. Pearson Correlation between the Estimated Parameters

As revealed in the correlation matrix heatmap in Figure 6, a significant (p < 0.01) positive correlation was detected between the growth performance indices, including FBW and WG, and the serum levels of antioxidant enzymes (SOD, CAT, and GPx), proteins (TP, ALB, and GLOB), and the lysozyme activity. On the contrary, FBW and WG were negatively correlated with TG, GLU, HSI, and carcass moisture content. Furthermore, FCR was negatively correlated with SOD, CAT, GPx, and ALB.

4. Discussion

Our findings showed that all water quality parameters, including water temperature, pH, total ammonia, dissolved oxygen, and nitrate, as estimated in all experimental groups, were within the recommended limits for warm-water fish [28,29].
Recent research has focused on the viability of incorporating agro-industrial and plant-based feed ingredients into fish feeds to gain financial advantages while enhancing the sustainability of aquaculture [30]. Several research investigations have found that replacing SB with non-traditional feed constituents had no detrimental impact on the growth of rainbow trout [31,32], grass carp [33,34], Nile tilapia [6], or common carp [35]. In the current experiment, fish fed the D4 diet showed better FW, WG, SGR, and FCR. Recently, Musthafa et al. [36] stated that the Mucuna pruriens seed meal substantially enhanced the immune status and growth of the freshwater fish O. niloticus. Furthermore, Bai et al. [37] found that a diet containing 30% cottonseed meal improved the growth indicators of the red-bellied Pacu. The enhanced growth observed in fish fed with PSC could be attributed to this alternative feed ingredient’s nutritional and bioactive properties. PSC is rich in protein, essential amino acids, and minerals [12], all of which are essential nutrients for the growth and development of fish. In addition, PSC contains bioactive compounds such as phytosterols and phenolic compounds [38] that have been shown to promote fish health and growth. Another important perspective is that the feed intake has significantly improved in most fish groups fed PSC-containing diets, which could be responsible for the recorded growth. Additionally, Greiling et al. [20] have demonstrated that increased intake of the PSC-containing diet by African catfish could be related to increased feed palatability.
VSI and HSI showed significant differences in favor of PSC inclusion compared to the control. Our findings contradicted those of Sezgin and Aydın [17], who concluded that PSC had no significant influence on HSI or VSI. However, our result could be explained by several studies, including those of Caili et al. [39], Nkosi et al. [40], Bardaa et al. [16], Musthafa et al. [41], and Salehi et al. [14], which suggest that the observed improvements in VSI and HSI in tilapia fed with diets containing PSC are likely due to a complex interplay of metabolic processes influenced by the nutritional composition of the feed. As a result, this could positively impact various metabolic processes, including those involved in growth.
Fish carcass composition can be influenced by changes in the composition of their diets [4]. In the present study, increasing PSC substitution levels in fish diets increased the ash and crude lipid contents, but reduced the crude protein and moisture contents. Likewise, substitution with other plant protein sources resulted in a comparable change in the carcass composition of Nile tilapia [4,6]. The increase in crude lipid content could be related to the increased feed intake, which has been shown to increase whole-body energy retention in the form of increased whole-body lipid deposition. In this regard, Greiling et al. [20] reported that the higher energy content of the PSC-containing diets could increase the weights of different sites of lipid deposition in fish carcasses. Meanwhile, the reduction in protein content could be related to the presence of some anti-nutritional factors or the deficiency of some amino acids, such as lysine [15].
Blood biochemical parameters are a conventional technique used regularly to evaluate the physiological, pathological, and immunological statuses of fish [42]. Herein, glucose, total cholesterol, and triglyceride concentrations were significantly reduced in O. niloticus fed with PSC diets, and the D4 group had the lowest values. The results of this study corroborate those of Caili et al. [39], who found that pumpkin seeds could efficiently reduce serum triglyceride levels and cholesterol. Similarly, Sezgin and Aydın [17] found that increasing the inclusion level of PSC in mirror carp (Cyprinus carpio) diets led to a decrease in both cholesterol and triglyceride levels, with a continued effect on cholesterol until reaching 100% inclusion. This notable reduction could be attributed to PSC’s phytosterol bioactive components, which might affect both the expression levels of genes related to cholesterol and lipid metabolism and the activity of hepatic enzymes [17,43]. Our observation on serum glucose levels was similar to the findings of Sezgin and Aydın [17], who noted a decrease in serum glucose levels in groups fed on diets containing 66% and 100% PSC. In addition, the serum contents of ALT, AST, creatinine, and urea were significantly decreased with all dietary inclusion levels of PSC. The antioxidant activity of PSC may be responsible for its hepatoprotective and nephroprotective effects [44]. Major functions of serum proteins include sustaining pH, osmotic pressure, and transporting metabolites. TP is crucial to the innate immune response and humoral immunity of fish [45]. In this study, the TP and globulin levels in the blood of fish fed the D1 and D4 diets were significantly higher than in those fed other experimental diets. In contrast, the ALB levels of fish fed the D1, D3, and D4 diets were significantly higher than those fed the control diet. Our dataset is in contrast with the findings of Sezgin and Aydın [17], who found that the serum TP, ALB, ALT, and AST levels underwent only numerical changes in those parameters’ values, with no statistically significant effect of PSC inclusion in the diets of mirror carp.
The antioxidant activity of enzymes, such as GPx, CAT, and SOD, is an essential biomarker for monitoring fish health and reactivity to external stimuli [30], and it can be used to assess fish antioxidant capability. Furthermore, Al-Sagheer et al. [46] stated that MDA, a marker of lipid peroxidation, can be utilized to assess the level of oxidative stress and antioxidant status. In this investigation, the activity of SOD, CAT, and GPx significantly increased while MDA decreased in fish fed formulated feeds with PSC. The addition of PSC, which contains active ingredients like proteins, minerals, phytosterols, triterpenes, carotenoids, lignans, polyunsaturated fatty acids, tocopherol, and phenolic and antioxidative compounds, may have triggered antioxidant defense and decreased MDA lipid oxidation in all treated groups [14,16,39,40]. Previous studies have found that PSC has potent antioxidative properties, as shown by its free radical scavenging activity and augmentation of antioxidase activity [47,48]. Furthermore, these effects could be attributed to the essential fatty acids found in pumpkin seeds, which play a critical role in maintaining cell membrane integrity and regulating gene expression, as well as the antioxidants found in pumpkin seeds, which could help to protect fish from oxidative stress by scavenging free radicals and reducing inflammation [20].
Lysozyme is a positively charged protein found in various bodily fluids, such as mucus, lymphoid tissue, and plasma, and is synthesized in multiple fish tissues [49]. It is essential to multiple defense mechanisms, including the immune response, opsonization, bacteriolysis, and antimicrobial activity [36]. Our dataset showed that lysozyme activity was boosted by incorporating PSC into feed compared to control groups. The findings of Musthafa et al. [41] on O. mossambicus fed diets including C. mixta seed meal corroborate these findings, since they showed an enhanced immune response to A. hydrophila and the Gram-negative bacterium. There is a strong link between oxidative stress and immune function in fish [50], and the liver plays an important role in synthesizing immune proteins [51]. The improved hepatic function and the antioxidant capacity of fish fed diets containing PSC in the current experiment could also have partly contributed to the recorded enhancement of the immune status. Notably, the positive relationship detected by the Pearson correlation analysis between growth indices and the antioxidant enzymes and lysozyme activity indicates that the enhancement of these parameters could be collectively responsible for the recorded enhanced growth performance and nutrient utilization of fish fed diets containing PSC.

5. Conclusions

Based on the study’s findings, partial SB substitution (particularly 40% replacement) with PSC in the diets of Nile tilapia significantly enhanced growth performance, feed conversion, water quality, antioxidant capacity, and immunity. This study concludes that PSC could be a promising, sustainable, and cost-effective alternative protein source for Nile tilapia diets. Additional research is required in order to investigate the long-term effects of PSC on fish health and the environment.

Author Contributions

Conceptualization, H.A.M.M., A.A.A.-S., K.M.A. and S.S.S.; methodology, H.A.M.M., S.S.S. and D.A.A.E.-B.; software, H.A.M.M. and A.A.A.-S.; formal analysis, H.A.M.M., Z.M.A.A.-E.A. and K.M.A.; investigation, Z.M.A.A.-E.A., D.A.A.E.-B., A.A.A.-S. and K.M.A.; resources, D.A.A.E.-B., K.M.A., Y.M.A.-E. and B.A.H.; data curation, H.A.M.M., Z.M.A.A.-E.A., D.A.A.E.-B. and K.M.A.; writing—original draft preparation, Z.M.A.A.-E.A. and D.A.A.E.-B.; writing—review and editing, H.A.M.M., A.A.A.-S., Y.M.A.-E. and B.A.H.; visualization, H.A.M.M., Z.M.A.A.-E.A., D.A.A.E.-B. and K.M.A.; supervision, H.A.M.M. All authors have read and agreed to the published version of the manuscript.

Funding

This research received no external funding.

Institutional Review Board Statement

The Animal Experiments Local Ethics Committee of the Faculty of Agriculture at Ain Shams University approved the animal study protocol with approval number 4-202301 (date of approval; 12 February 2023).

Informed Consent Statement

Not applicable.

Data Availability Statement

The datasets used along with this research are available from the corresponding author upon reasonable request.

Conflicts of Interest

Author Sherif S. Sadek is the owner of the Aquaculture Consultant Office, Cairo, Egypt. The remaining authors declare that the research was conducted in the absence of any commercial or financial relationships that could be construed as a potential conflict of interest.

References

  1. El-Houseiny, W.; Arisha, A.H.; Behairy, A.; Metwally, M.M.M.; Abdel-Warith, A.-W.A.; Younis, E.M.; Davies, S.J.; Hassan, B.A.; Abd-Elhakim, Y.M. The immunosuppressive, growth-hindering, hepatotoxic, and oxidative stress and immune related-gene expressions-altering effects of gibberellic acid in Oreochromis niloticus: A mitigation trial using alpha-lipoic acid. Pestic. Biochem. Physiol. 2024, 198, 105725. [Google Scholar] [CrossRef]
  2. FAO. The State of World Fisheries and Aquaculture 2022. Towards Blue Transformation; Food and Agriculture Organization of the United Nations: Rome, Italy, 2022. [Google Scholar]
  3. Ayyat, M.S.; Al-Sagheer, A.A.; Ayyat, A.M.; Abdelrhman, A.M.; Ahmed, N.H.; Naiel, M.A. Effects of a blend of herbal feed supplements on growth, associated blood indices and body chemical analysis in nile tilapia reared under high stocking density. Aquac. Res. 2022, 53, 5475–5485. [Google Scholar] [CrossRef]
  4. Ayyat, M.S.; Ayyat, A.M.N.; Abdel-Rahman, M.S.; Al-Sagheer, A.A. Appraisal of leaf protein concentrate derived from sugar beet and carrot as a novel fish meal substitute for juvenile Nile tilapia (Oreochromis niloticus). Anim. Feed Sci. Technol. 2024, 307, 115833. [Google Scholar] [CrossRef]
  5. El-Sayed, A.-F.M.; Fitzsimmons, K. From africa to the world—The journey of nile tilapia. Rev. Aquac. 2023, 15, 6–21. [Google Scholar] [CrossRef]
  6. Ayyat, M.S.; A. Abdel-Rahman, G.; Ayyat, A.M.N.; Abdel-Rahman, M.S.; Al-Sagheer, A.A. Evaluation of leaf protein concentrate from Beta vulgaris and Daucus carota as a substitute for soybean meal in Oreochromis niloticus fingerlings diets. Aquac. Res. 2021, 52, 3256–3269. [Google Scholar] [CrossRef]
  7. Gyan, W.R.; Ayiku, S.; Yang, Q. Effects of replacing fishmeal with soybean products in fish and crustaceans performance. J. Aquat. Res. Dev. 2019, 10, 573. [Google Scholar]
  8. Li, H.; Hu, Z.; Liu, S.; Sun, J.; Ji, H. Influence of dietary soybean meal replacement with yellow mealworm (Tenebrio molitor) on growth performance, antioxidant capacity, skin color, and flesh quality of mirror carp (Cyprinus carpio var. Specularis). Aquaculture 2022, 561, 738686. [Google Scholar] [CrossRef]
  9. Ayyat, M.S.; Ayyat, A.M.N.; Abd El-Latif, K.M.; Hessein, A.A.A.; Al-Sagheer, A.A. Inorganic mercury and dietary safe feed additives enriched diet impacts on growth, immunity, tissue bioaccumulation, and disease resistance in Nile tilapia (Oreochromis niloticus). Aquat. Toxicol. 2020, 224, 105494. [Google Scholar] [CrossRef]
  10. El-Houseiny, W.; Arisha, A.H.; Metwally, M.M.M.; Abdel-Warith, A.-W.A.; Younis, E.M.; Davies, S.J.; Hassan, B.A.; Abd-Elhakim, Y.M. Alpha-lipoic acid suppresses gibberellic acid nephrotoxicity in Nile tilapia (Oreochromis niloticus) via modulating oxidative stress, inflammation, cytokine production, and apoptosis. Pestic. Biochem. Physiol. 2023, 196, 105598. [Google Scholar] [CrossRef]
  11. Ajila, C.M.; Brar, S.K.; Verma, M.; Tyagi, R.D.; Godbout, S.; Valéro, J.R. Bio-processing of agro-byproducts to animal feed. Crit. Rev. Biotechnol. 2012, 32, 382–400. [Google Scholar] [CrossRef]
  12. Ezzat, S.M.; Adel, R.; Abdel-Sattar, E. Pumpkin bio-wastes as source of functional ingredients. In Mediterranean Fruits Bio-Wastes: Chemistry, Functionality and Technological Applications; Ramadan, M.F., Farag, M.A., Eds.; Springer International Publishing: Cham, Switzerland, 2022; pp. 667–696. [Google Scholar]
  13. Rabrenović, B.B.; Dimić, E.B.; Novaković, M.M.; Tešević, V.V.; Basić, Z.N. The most important bioactive components of cold pressed oil from different pumpkin (Cucurbita pepo L.) seeds. LWT-Food Sci. Technol. 2014, 55, 521–527. [Google Scholar] [CrossRef]
  14. Salehi, B.; Capanoglu, E.; Adrar, N.; Catalkaya, G.; Shaheen, S.; Jaffer, M.; Giri, L.; Suyal, R.; Jugran, A.K.; Calina, D.; et al. Cucurbits plants: A key emphasis to its pharmacological potential. Molecules 2019, 24, 1854. [Google Scholar] [CrossRef] [PubMed]
  15. Zdunczyk, Z.; Minakowski, D.; Frejnagel, S.; Flis, M. Comparative study of the chemical composition and nutritional value of pumpkin seed cake, soybean meal and casein. Food/Nahr. 1999, 43, 392–395. [Google Scholar] [CrossRef]
  16. Bardaa, S.; Ben Halima, N.; Aloui, F.; Ben Mansour, R.; Jabeur, H.; Bouaziz, M.; Sahnoun, Z. Oil from pumpkin (Cucurbita pepo l.) seeds: Evaluation of its functional properties on wound healing in rats. Lipids Health Dis. 2016, 15, 73. [Google Scholar] [CrossRef] [PubMed]
  17. Sezgin, A.; Aydın, B. Effect of replacing dietary soybean meal with pumpkin (Cucurbita pepo) seed cake on growth, feed utilization, haematological parameters and fatty acid composition of mirror carp (Cyprinus carpio). Aquac. Res. 2021, 52, 5870–5881. [Google Scholar] [CrossRef]
  18. Akin, G.; Arslan, F.N.; Elmasa, S.K.; Yilmaz, I. Cold-pressed pumpkin seed (Cucurbita pepo L.) oils from the central anatolia region of Turkey: Characterization of phytosterols, squalene, tocols, phenolic acids, carotenoids and fatty acid bioactive compounds. Grasas Aceites 2018, 69, e232. [Google Scholar] [CrossRef]
  19. Lovatto, N.D.M.; Goulart, F.R.; Loureiro, B.B.; Adorian, T.J.; de Freitas, S.T.; Pianesso, D.; Dalcin, M.O.; Athayde, M.L.; da Silva, L.P. Effects of phosphorylated protein concentrate of pumpkin seed meal on growth and digestive enzymes activity of silver catfish (Rhamdia quelen). Aquac. Nutr. 2017, 23, 201–209. [Google Scholar] [CrossRef]
  20. Greiling, A.M.; Schwarz, C.; Gierus, M.; Rodehutscord, M. Pumpkin seed cake as a fishmeal substitute in fish nutrition: Effects on growth performance, morphological traits and fillet colour of two freshwater salmonids and two catfish species. Arch. Anim. Nutr. 2018, 72, 239–259. [Google Scholar] [CrossRef]
  21. NRC. Nutrient Requirements of Fish and Shrimp; The National Academies Press: Washington, DC, USA, 2011. [Google Scholar]
  22. APHA. Standard Methods for the Examination of Water and Wastewater, 23rd ed.; American Public Health Association: Washington DC, USA, 2017. [Google Scholar]
  23. AOAC. Official Methods of Analysis of the Association of Analytical Chemists International, 18th ed.; Association of Official Analytical Chemists: Gaithersburg, MD, USA, 2005. [Google Scholar]
  24. Ghareghanipoora, M.; Akbary, P.; Akhlaghi, M.; Fereidouni, M. Non-specific immune responses and immune related genes expression of rainbow trout (Oncorhynchus mykiss, walbaum) fed Zataria multiflora boiss extract. Bull Environ. Pharmacol. Life Sci. 2014, 3, 140–146. [Google Scholar]
  25. SAS. Note: SAS Proprietary Software Version 9.00 (TS m0); Sas Institute Inc.: Cary, NC, USA, 2002. [Google Scholar]
  26. Yossa, R.; Verdegem, M. Misuse of multiple comparison tests and underuse of contrast procedures in aquaculture publications. Aquaculture 2015, 437, 344–350. [Google Scholar] [CrossRef]
  27. Prism, G. Prism 8 for Windows; GraphPad Software Inc.: San Diego, CA, USA, 2019. [Google Scholar]
  28. Boyd, C. Water Quality in Ponds for Aquaculture; Birmingham Publ. Co.: Birmingham, AL, USA, 1990; p. 482. [Google Scholar]
  29. Boyd, C.E.; Tucker, C.S. Ecology of aquaculture ponds. In Pond Aquaculture Water Quality Management; Springer: Berlin/Heidelberg, Germany, 1998; pp. 8–86. [Google Scholar]
  30. El-Houseiny, W.; Anter, R.G.A.; Arisha, A.H.; Mansour, A.T.; Safhi, F.A.; Alwutayd, K.M.; Elshopakey, G.E.; Abd El-Hakim, Y.M.; Mohamed, E.M.M. Growth retardation, oxidative stress, immunosuppression, and inflammatory disturbances induced by herbicide exposure of catfish, Clarias gariepinus, and the alleviation effect of dietary wormwood Artemisia cina. Fishes 2023, 8, 297. [Google Scholar] [CrossRef]
  31. Dernekbaşı, S.; Karayücel, İ.; Akyüz, A.P. Evaluation of sesame (Sesamum indicum) seed meal as a replacer for soybean meal in the diets of rainbow trout (Oncorhynchus mykiss walbaum, 1792). Ege J. Fish. Aquat. Sci. 2017, 34, 31–39. [Google Scholar]
  32. Ustaoglu Tiril, S.; Kerim, M. Evaluation of safflower meal as a protein source in diets of rainbow trout [Oncorhynchus mykiss, walbaum, 1792)]. J. Appl. Ichthyol. 2015, 31, 895–899. [Google Scholar] [CrossRef]
  33. Li, X.; Chen, S.; Sun, J.; Huang, X.; Tang, H.; He, Y.; Pan, Q.; Gan, L. Partial substitution of soybean meal with faba bean meal in grass carp (Ctenopharyngodon idella) diets, and the effects on muscle fatty acid composition, flesh quality, and expression of myogenic regulatory factors. J. World Aquac. Soc. 2020, 51, 1145–1160. [Google Scholar] [CrossRef]
  34. Lu, R.; Chen, Y.; Yu, W.; Lin, M.; Yang, G.; Qin, C.; Meng, X.; Zhang, Y.; Ji, H.; Nie, G. Defatted black soldier fly (Hermetia illucens) larvae meal can replace soybean meal in juvenile grass carp (Ctenopharyngodon idellus) diets. Aquac. Rep. 2020, 18, 100520. [Google Scholar] [CrossRef]
  35. Wang, T.; Xu, M.; Wang, J.; Wan, W.; Guan, D.; Han, H.; Wang, Z.; Sun, H. A combination of rapeseed, cottonseed and peanut meal as a substitute of soybean meal in diets of yellow river carp Cyprinus carpio var. Aquac. Nutr. 2020, 26, 1520–1532. [Google Scholar] [CrossRef]
  36. Musthafa, M.S.; Asgari, S.M.; Kurian, A.; Elumalai, P.; Ali, A.R.J.; Paray, B.A.; Al-Sadoon, M.K. Protective efficacy of Mucuna pruriens (L.) seed meal enriched diet on growth performance, innate immunity, and disease resistance in Oreochromis mossambicus against Aeromonas hydrophila. Fish Shellfish Immunol. 2018, 75, 374–380. [Google Scholar] [CrossRef]
  37. Bai, T.L.; Ch, J.; Reddy, D.K. Comparison of effects of cotton seed meal with fish meal on growth, feed conversion ratio and survival of redbellied pacu (Piaractus brachypomus) int. J. Sci. Environ. Technol. 2016, 5, 1092–1099. [Google Scholar]
  38. Dotto, J.M.; Chacha, J.S. The potential of pumpkin seeds as a functional food ingredient: A review. Sci. Afr. 2020, 10, e00575. [Google Scholar] [CrossRef]
  39. Caili, F.; Huan, S.; Quanhong, L. A review on pharmacological activities and utilization technologies of pumpkin. Plant Foods Hum. Nutr. 2006, 61, 70–77. [Google Scholar] [CrossRef]
  40. Nkosi, C.; Opoku, A.; Terblanche, S. In vitro antioxidative activity of pumpkin seed (Cucurbita pepo) protein isolate and its in vivo effect on alanine transaminase and aspartate transaminase in acetaminophen-induced liver injury in low protein fed rats. Phytother. Res. 2006, 20, 780–783. [Google Scholar] [CrossRef] [PubMed]
  41. Musthafa, M.S.; Jawahar Ali, A.R.; Arun Kumar, M.S.; Paray, B.A.; Al-Sadoon, M.K.; Balasundaram, C.; Harikrishnan, R. Effect of Cucurbita mixta (L.) seed meal enrichment diet on growth, immune response and disease resistance in Oreochromis mossambicus. Fish Shellfish Immunol. 2017, 68, 509–515. [Google Scholar] [CrossRef] [PubMed]
  42. El-Houseiny, W.; Algharib, S.A.; Mohamed, E.A.A.; Metwally, M.M.M.; Mahmoud, Y.K.; Alghamdi, Y.S.; Soliman, M.M.; Abd-Elhakim, Y.M.; El-Murr, A.E. Dietary parsley seed mitigates methomyl-induced impaired growth performance, hemato-immune suppression, oxidative stress, hepato-renal damage, and pseudomonas aeruginosa susceptibility in Oreochromis niloticus. Antioxidants 2022, 11, 1185. [Google Scholar] [CrossRef] [PubMed]
  43. Niroomand, M.; Akbarzadeh, A.; Ebrahimi, E.; Sobhani, S.A.; Sheikhahmadi, A. Effects of dietary black cumin seed meal on growth performance, blood biochemistry and fatty acid composition of pacific white shrimp Litopenaeus vannamei. Aquac. Nutr. 2020, 26, 1072–1082. [Google Scholar] [CrossRef]
  44. Latif, M.; Faheem, M.; Asmatullah; Hoseinifar, S.H.; Van Doan, H. Dietary black seed effects on growth performance, proximate composition, antioxidant and histo-biochemical parameters of a culturable fish, rohu (Labeo rohita). Animals 2020, 11, 48. [Google Scholar] [CrossRef]
  45. Esmaeili, M. Blood performance: A new formula for fish growth and health. Biology 2021, 10, 1236. [Google Scholar] [CrossRef] [PubMed]
  46. Al-Sagheer, A.A.; Mahmoud, H.K.; Reda, F.M.; Mahgoub, S.A.; Ayyat, M.S. Supplementation of diets for Oreochromis niloticus with essential oil extracts from lemongrass (Cymbopogon citratus) and geranium (Pelargonium graveolens) and effects on growth, intestinal microbiota, antioxidant and immune activities. Aquac. Nutr. 2018, 24, 1006–1014. [Google Scholar] [CrossRef]
  47. Li, Y.; Zhang, G.; Fang, X.; Zhao, C.; Wu, H.; Lan, Y.; Che, L.; Sun, Y.; Lv, J.; Zhang, Y. Effects of replacing soybean meal with pumpkin seed cake and dried distillers grains with solubles on milk performance and antioxidant functions in dairy cows. Animal 2021, 15, 100004. [Google Scholar] [CrossRef]
  48. Krimer-Malešević, V. Pumpkin seeds: Phenolic acids in pumpkin seed (Cucurbita pepo L.). In Nuts and Seeds in Health and Disease Prevention; Elsevier: Amsterdam, The Netherlands, 2020; pp. 533–542. [Google Scholar]
  49. Zhang, G.; Gong, S.; Yu, D.; Yuan, H. Propolis and herba epimedii extracts enhance the non-specific immune response and disease resistance of Chinese sucker, Myxocyprinus asiaticus. Fish Shellfish Immunol. 2009, 26, 467–472. [Google Scholar] [CrossRef]
  50. Biller, J.D.; Takahashi, L.S. Oxidative stress and fish immune system: Phagocytosis and leukocyte respiratory burst activity. An. Acad. Bras. Ciênc. 2018, 90, 3403–3414. [Google Scholar] [CrossRef]
  51. Reynaud, S.; Raveton, M.; Ravanel, P. Interactions between immune and biotransformation systems in fish: A review. Aquat. Toxicol. 2008, 87, 139–145. [Google Scholar] [CrossRef] [PubMed]
Figure 1. Average values of water quality parameters, determined every second week during the trial, including: (A) temperature, (B) pH, (C) dissolved oxygen, (D) total ammonia, and (E) nitrate. Control, D1, D2, D3, and D4 indicate that 0%, 10%, 20%, 30%, and 40% of soybean meal were replaced by pumpkin seed cake (PSC), respectively. Values are expressed as means ± standard error.
Animals 14 00195 g001
Figure 2. Relationship between final fish weight (A), specific growth rate (B), and feed conversion ratio (C) of Nile tilapia (Oreochromis niloticus) and different levels of pumpkin seed cake (PSC). Control, D1, D2, D3, and D4 indicate that 0%, 10%, 20%, 30%, and 40% of SM were replaced by PSC, respectively.
Animals 14 00195 g002
Figure 3. Viscerosomatic index (VSI; A) and hepatosomatic index (HSI; B) as affected by substituting soybean meal (SM) with pumpkin seed cake (PSC) in Nile tilapia diets. Control, D1, D2, D3, and D4 indicate that 0%, 10%, 20%, 30%, and 40% of SM were replaced by PSC, respectively. a–c Means in bars with different superscripts differ significantly. Different letters above the error bar indicate significant differences at p  <  0.05, as determined by one-way ANOVA followed by Tukey’s multiple comparisons test. Values are expressed as means ± standard deviation (3 fish/aquarium; n = 9 fish/treatment).
Animals 14 00195 g003
Figure 4. The serum levels of (A) malondialdehyde (MDA), (B) superoxide dismutase (SOD), (C) catalase (CAT), and (D) glutathione peroxidase (GPx) as affected by substituting soybean meal (SBM) with pumpkin seed cake (PSC) in Nile tilapia diets. Control, D1, D2, D3, and D4 indicate that 0%, 10%, 20%, 30%, and 40% of SM were replaced by PSC, respectively. Different letters above the error bar indicate significant differences at p  <  0.05, as determined by one-way ANOVA followed by Tukey’s multiple comparisons test. Values are expressed as means ± standard deviation (n = 9/treatment).
Animals 14 00195 g004
Figure 5. Lysozyme activity as affected by substituting soybean meal (SBM) with pumpkin seed cake (PSC) in Nile tilapia diets. Control, D1, D2, D3, and D4 indicate that 0%, 10%, 20%, 30%, and 40% of SM were replaced by PSC, respectively. Different letters above the error bar indicate significant differences at p  <  0.05, as determined by one-way ANOVA followed by Tukey’s multiple comparisons test. Values are expressed as means ± standard deviation (n = 9/treatment).
Animals 14 00195 g005
Figure 6. The correlation matrix heatmap shows the values of the Pearson correlation coefficient among growth performance indicators, carcass composition, and serum biochemical parameters. The positive values are in red, and the negative values are in green. The values range from −1 to 1, whereby 1 indicates a perfect negative linear relationship between variables, 1 indicates a perfect positive linear relationship between variables, and 0 indicates no relationship between studied variables. FBW: final body weight; WG: weight gain; SGR: specific growth rate; FCR: feed conversion ratio; and FI: feed intake; CHO: cholesterol; TG: triglycerides; GLU: glucose; ALT: alanine transaminase; AST: aspartate aminotransferase; BUN: blood urea nitrogen; TP: total protein; ALB: albumin; GLOB: globulin; LZM: lysozyme; MDA: malondialdehyde; SOD: superoxide dismutase; CAT: catalase; GPx: glutathione peroxidase, HIS: hepatosomatic index; and VSI: viscerosomatic index.
Animals 14 00195 g006
Table 1. Ingredients and proximate composition of the experimental diets (g kg−1) on a dry matter basis.
Experimental Diets 1
ControlD1D2D3D4
Ingredients
Soybean meal420378336294252
Pumpkin seed cake 2033.567100.4133.9
Yellow corn375375375375375
Fish meal100100100100100
Wheat bran7070707070
Cellulose011.222.433.744.9
Fish oil1010101010
Sunflower oil2017.314.611.99.2
Premix 355555
Proximate composition
Dry matter914.0915.0912.0921.0925.0
Crude protein (N × 6.25)315.0316.5314.5315.5314.5
Crude lipid65.565.765.465.165.9
Ash75.579.576.574.576.0
1 Control, D1, D2, D3, and D4 indicate that 0%, 10%, 20%, 30%, and 40% of soybean meal were replaced by pumpkin seed cake, respectively. 2 Pumpkin seed cake: 55.20% crude protein, 10.78% crude lipid, and 10.72% ash. 3 Provides the following per kg of diet: vitamin A 4000 IU, vitamin D3 600 IU, vitamin E 20 mg, vitamin K3 5 mg, vitamin B1 3.6 mg, vitamin B2 6 mg, vitamin B5 12 mg, vitamin B6 3.5 mg, vitamin B12 0.02 mg, vitamin B3 14.4 mg, biotin 0.07 mg, folic acid 0.9 mg, inositol 300 mg, vitamin C 50 mg, Mg 15 mg, Fe 30 mg, Zn 42 mg, Cu 4 mg, K 75 mg, Co 0.11 mg, Mn 1.6 mg, Se 0.04 mg, Mo 0.005 mg, and I 0.4 mg.
Table 2. Growth performance and nutrient utilization as affected by substituting soybean meal (SBM) with pumpkin seed cake (PSC) in Nile tilapia diets.
ItemsExperimental Diets 1SDM 2
ControlD1D2D3D4
Initial weight (g fish−1)11.86 NS11.8712.0811.9211.940.17
Final weight (g fish−1)33.83 c37.74 b34.51 c34.02 c40.60 a3.01
Body weight gain (g fish−1)21.97 c25.87 b22.43 c22.10 c28.66 a2.98
Specific growth rate (%)1.51 b1.65 ab1.51 b1.51 b1.75 a0.20
Feed intake (g fish−1)55.36 b67.26 a65.40 a56.41 b61.90 ab5.38
Feed conversion ratio (g feed/g gain)2.52 ab2.60 ab2.93 a2.55 ab2.16 b0.29
Survival rate (%)100 NS1001001001000.00
1 Control, D1, D2, D3, and D4 indicate that 0%, 10%, 20%, 30%, and 40% of SM were replaced by PSC, respectively. 2 SDM stands for the standard deviation of the mean. a–c Means in rows with different superscripts differ significantly (p < 0.05). NS = no significant differences between groups (p > 0.05).
Table 3. Carcass composition as affected by substituting soybean meal (SBM) with pumpkin seed cake (PSC) in Nile tilapia diets (% on a dry matter basis, except for moisture on a wet basis).
ItemsExperimental Diets 1SDM 2
ControlD1D2D3D4
Moisture76.9 a72.4 cd74.9 b73.0 c71.8 d1.9
Crude lipids14.4 d18.0 c16.8 c20.3 b23.7 a3.4
Crude protein64.8 a58.7 c60.0 b57.4 d57.5 d2.8
Ash20.0 b22.5 a22.5 a21.8 a18.3 c1.9
1 Control, D1, D2, D3, and D4 indicate that 0%, 10%, 20%, 30%, and 40% of SM were replaced by PSC, respectively. 2 SDM stands for the standard deviation of the mean. a–d Means in rows with different superscripts differ significantly (p < 0.05).
Table 4. Blood biochemical parameters, as affected by substituting soybean meal (SBM) with pumpkin seed cake (PSC) in Nile tilapia diets.
ItemsExperimental Diets 1SDM 2
ControlD1D2D3D4
Total cholesterol (mg/dL)178.0 a126.25 c139.25 b130.0 bc123.05 c6.39
Triglycerides (mg/dL)280.81 a188.25 d235.0 b208.92 c173.25 d6.37
Glucose (mg/dL)122.83 a112.05 ab122.25 a116.05 ab105.36 b7.48
ALT (U/L)73.12 a62.18 c65.48 c67.01 bc69.09 b3.24
AST (U/L)111.25 a87.5 b76.25 c78.5 c85.91 b3.78
Creatinine (mg/dL)0.60 a0.40 bc0.47 b0.41 bc0.33 c0.23
Urea (mg/dL)16.2 a10.15 b12.1 b11.75 bc12.0 b4.75
Total protein (g/dL)1.38 b3.29 a1.33 b1.54 b3.09 a0.31
Albumin (g/dL)0.80 c1.35 ab0.84 c1.08 b1.54 a0.28
Globulin (g/dL)0.58 b1.94 a0.49 b0.46 b1.55 a0.35
1 Control, D1, D2, D3, and D4 indicate that 0%, 10%, 20%, 30%, and 40% of SM were replaced by PSC, respectively. 2 SDM stands for the standard deviation of the mean. a–d Means in rows with different superscripts differ significantly (p < 0.05). Alanine aminotransferase (ALT), aspartate aminotransferase (AST).
Disclaimer/Publisher’s Note: The statements, opinions and data contained in all publications are solely those of the individual author(s) and contributor(s) and not of MDPI and/or the editor(s). MDPI and/or the editor(s) disclaim responsibility for any injury to people or property resulting from any ideas, methods, instructions or products referred to in the content.

