Article

Different Evolutionary Trends of Galloanseres: Mitogenomics Analysis

College of Life Sciences, Qufu Normal University, Jingxuan West Street No. 57, Qufu 273165, China
*
Author to whom correspondence should be addressed.
These authors contributed equally to this work.
Animals 2024, 14(10), 1437; https://doi.org/10.3390/ani14101437
Submission received: 4 April 2024 / Revised: 27 April 2024 / Accepted: 9 May 2024 / Published: 11 May 2024
(This article belongs to the Section Animal Genetics and Genomics)

Abstract

:

Simple Summary

Galloanseres are one of the most widely distributed groups of birds, which occupy different ecological niches and exhibit different evolutionary trends. Mitochondria are widely used in phylogenetic analysis and ecological research due to unique genetic mechanisms and significant physiological functions. Adapting to different environments requires meeting varying energy demands, which is closely related to mitochondria. In this study, we constructed two complete mitogenomes of Aythya baeri and Aythya marila. The phylogenetic and divergence time analysis based on the mitochondrial PCGs were conducted to elucidate the evolutionary process of species within Galloanseres. Additionally, the analysis of selective pressures between the two sister clades, Galliformes and Anseriformes, revealed that different evolutionary directions have shaped distinct evolutionary patterns of mitochondrial genes.

Abstract

The two existing clades of Galloanseres, orders Galliformes (landfowl) and Anseriformes (waterfowl), exhibit dramatically different evolutionary trends. Mitochondria serve as primary sites for energy production in organisms, and numerous studies have revealed their role in biological evolution and ecological adaptation. We assembled the complete mitogenome sequences of two species of the genus Aythya within Anseriformes: Aythya baeri and Aythya marila. A phylogenetic tree was constructed for 142 species within Galloanseres, and their divergence times were inferred. The divergence between Galliformes and Anseriformes occurred ~79.62 million years ago (Mya), followed by rapid evolution and diversification after the Middle Miocene (~13.82 Mya). The analysis of selective pressure indicated that the mitochondrial protein-coding genes (PCGs) of Galloanseres species have predominantly undergone purifying selection. The free-ratio model revealed that the evolutionary rates of COX1 and COX3 were lower than those of the other PCGs, whereas ND2 and ND6 had faster evolutionary rates. The CmC model also indicated that most PCGs in Anseriformes exhibited stronger selective constraints. Our study suggests that the distinct evolutionary trends and energy requirements of Galliformes and Anseriformes drive different evolutionary patterns in the mitogenome.

1. Introduction

The Galloanseres, an ancient clade among extant birds, which together with the Neoaves forms the clade Neognathae, clusters with Paleognathae to form the three major group of modern birds (Neornithes) [1]. This clade consists of the orders Anseriformes and Galliformes and includes 142 genera and 480 species of birds worldwide. Birds of Galloanseres are distributed worldwide and occupy important ecological niches in various ecosystems. They have demonstrated different evolutionary trends. Species within Anseriformes, which are predominantly aquatic, commonly inhabit wetlands, streams, and lakes [2]. They excel at swimming and possess the ability to undertake long-distance migration. Conversely, species within Galliformes are primarily terrestrial, mostly inhabiting terrestrial environments, such as forests and grasslands, with limited flying ability [3]. Birds in this clade are also closely related to humans, and many domestic poultry species have been domesticated from them [4,5].
Mitochondria are important functional organelles in eukaryotes that provide most of the adenosine triphosphate (ATP) required for cells by means of oxidative phosphorylation (OXPHOS) [6,7] and play a central role in apoptotic cell death by altering mitochondrial outer membrane permeabilization [8]. In addition, mitochondria are involved in processes, such as fatty acid oxidation, phospholipid synthesis, the generation and maintenance of reactive oxygen species, and signaling in innate immunity [9,10], coordinating various metabolic processes, which are achieved through establishing contacts with other organelles, shedding specialized vesicles, or producing and releasing of signaling metabolites [11]. Mitochondria can maintain their integrity and homeostasis through fusion and fission according to the requirements of the cell [12], thereby affecting the aforementioned processes. These are significant for organisms to adapt to various ecological niches [13,14,15,16]. Vertebrate mitochondria possess an independent genetic system consisting of 37 genes, which includes 2 ribosomal RNA (rRNA) genes, 13 protein-coding genes (PCGs), 22 transfer RNA (tRNA) genes, and 1 non-coding control region (D-loop). Mitochondrial genes are ideal materials for studying animal phylogeny because of their extreme conservation, maternal inheritance, and non-recombination during generation transmission [17,18]. For example, Lebedev et al. elucidated the interspecific relationships within the Allactaginae subfamily by constructing a phylogenetic tree using both nuclear and mitochondrial genes [19]. Additionally, because mitochondria can provide the power needed for biological functions, they may offer insights into how organisms adapt to different ecological niches. Some studies have shown that the mitochondrial genes of organisms living in different environments often have different evolutionary rates [20,21,22,23], which may be related to the survival pressure faced by organisms; that is, organisms require different energies to adapt to different environments. To date (April 2024), there have been no reports regarding the different evolutionary directions of species within Galloanseres based on mitogenomes. Considering the crucial role of mitochondria in the physiological activities and adaptation to different environments of organisms, we explored the phylogenetic relationships and adaptive evolution of Galloanseres, aiming to provide new insights into the evolutionary process and adaptive evolution of Galloanseres.
In the present study, we assembled and annotated two new mitogenomes of the genus Aythya (Aythya baeri and Aythya marila) based on high-quality nanopore sequencing data to provide new genetic resources for Aythya. To elucidate the evolutionary relationships within Galloanseres, we constructed a phylogenetic tree for 142 birds of Galloanseres based on their PCGs and inferred their divergence times. We also analyzed the selection pressure on the PCGs of species within Galloanseres to elucidate their roles in species adaptation to different ecological niches. Our study provides insights into the phylogenetic relationships among Galloanseres and their adaptations to different ecological niches.

2. Materials and Methods

2.1. Assembly and Annotation of the Mitogenome

We assembled two complete mitogenomes of Aythya using NOVOPlasty version 4.3.1 [24]. The raw data of genome sequencing used (A. baeri, SRR17568785; A. marila, SRR21672224; sequenced by our research group) were downloaded from the NCBI SRA database. The seed sequence used was the complete mitogenome of Anas platyrhynchos (NC_009684.1), and the K-mer and genome range were set to 33 and 12,000–20,000, respectively. We validated and revised the assembled sequences by comparing them with the seed sequence using BLAST and annotated the mitogenomes using MITOS2 [25] (http://mitos2.bioinf.uni-leipzig.de/index.py, accessed on 26 November 2022). The complete mitogenomes assembled were submitted to the NCBI GenBank database under accession numbers OP909754 (A. marila) and OP909755 (A. baeri). OGDRAW [26] of the MPI-MP CHLOROBOX website (https://chlorobox.mpimp-golm.mpg.de/geseq.html, accessed on 23 April 2024) was used to construct a gene map of these mitogenomes. The relative synonymous codon usage (RSCU) of mitochondrial PCGs was calculated using MEGA X [27]. The RSCU was plotted using the R software package version 4.1.3 (package, ggplot2). Nucleotide composition skew was calculated using the following formula: AT-skew = (A −  T)/(A + T) and GC-skew = (G − C)/(G + C).

2.2. Phylogenetic Analysis and Divergence Time Inference

In addition to the two mitogenomes of Aythya, we downloaded the published complete mitogenomes of all species within Galloanseres and the rock dove (Columba livia) from GenBank (July 2023). The reference or longest sequence of each species was used for phylogenetic analysis (Table S1). We used PhyloSuite version 1.2.3 [28] to extract the 13 PCGs (COX1, COX2, COX3, ND1, ND2, ND3, ND4, ND4L, ND5, ND6, ATP6, ATP8, and CYTB), MAFFT version 7.505 [29] to align them, and Gblocks version 0.91b [30] to extract conserved sites from the multiple sequence alignment results. The conserved sequences of all species were concatenated into a supermatrix to infer the phylogenetic relationships. Based on the Bayesian information criterion, ModelFinder version 2.2.0 [31] was used to identify the best model (GTR+F+I+G4) for MrBayes version 3.2.7a [32]. MrBayes was used to generate a phylogenetic tree with Markov chain Monte Carlo (MCMC) chains; the generation parameter was set to 2,000,000 and sampled every 1000 generations; and the burnin fraction was set to 25.0% for diagnostics. A rock dove was used as an outgroup.
The time of species divergence was inferred using the MCMCtree module in the PAML version 4.7 [33] and the first recorded time for the families Anatidae and Phasianidae (Anatidae, 40.4–46.2 million years ago [Mya]; Phasianidae, 41.3–47.8 Mya) on the mindat.org website (https://www.mindat.org, accessed on 6 June 2023), and the divergence times of Anseriformes and Galliformes (72.5–85.4 Mya) from TimeTree [34] were used as correction time.

2.3. Selection Pressure Analysis of Mitochondrial Genes

Synonymous and non-synonymous mutations of organism proteins occur under different selection pressures and are fixed at different rates [33]. Therefore, we used the ratio of non-synonymous mutations (dN) to synonymous mutations (dS) (ω = dN/dS) to reveal the intensity of natural selection on PCGs. The codeml module in PAML was used to analyze natural selection pressure. The free-ratio model (model = 1, NSsites = 0; null model, M0, model = 0, NSsites = 0) allows each branch to have an independent ω value, enabling the assessment of the natural selection pressure on each terminal branch. Some branches may lack synonymous or non-synonymous substitutions, which could lead to extreme ω estimates [35]; in such cases, we designated the ω value as “NA”. To assess the phylogenetic evolutionary rates of Anseriformes and Galliformes, we used Clade model C (CmC model, model = 3, NSsites = 2, ncatG = 3; null model, M2a_rel, model = 0, NSsites = 22), which could simultaneously detect selection pressures on multiple particular lineages.

3. Results

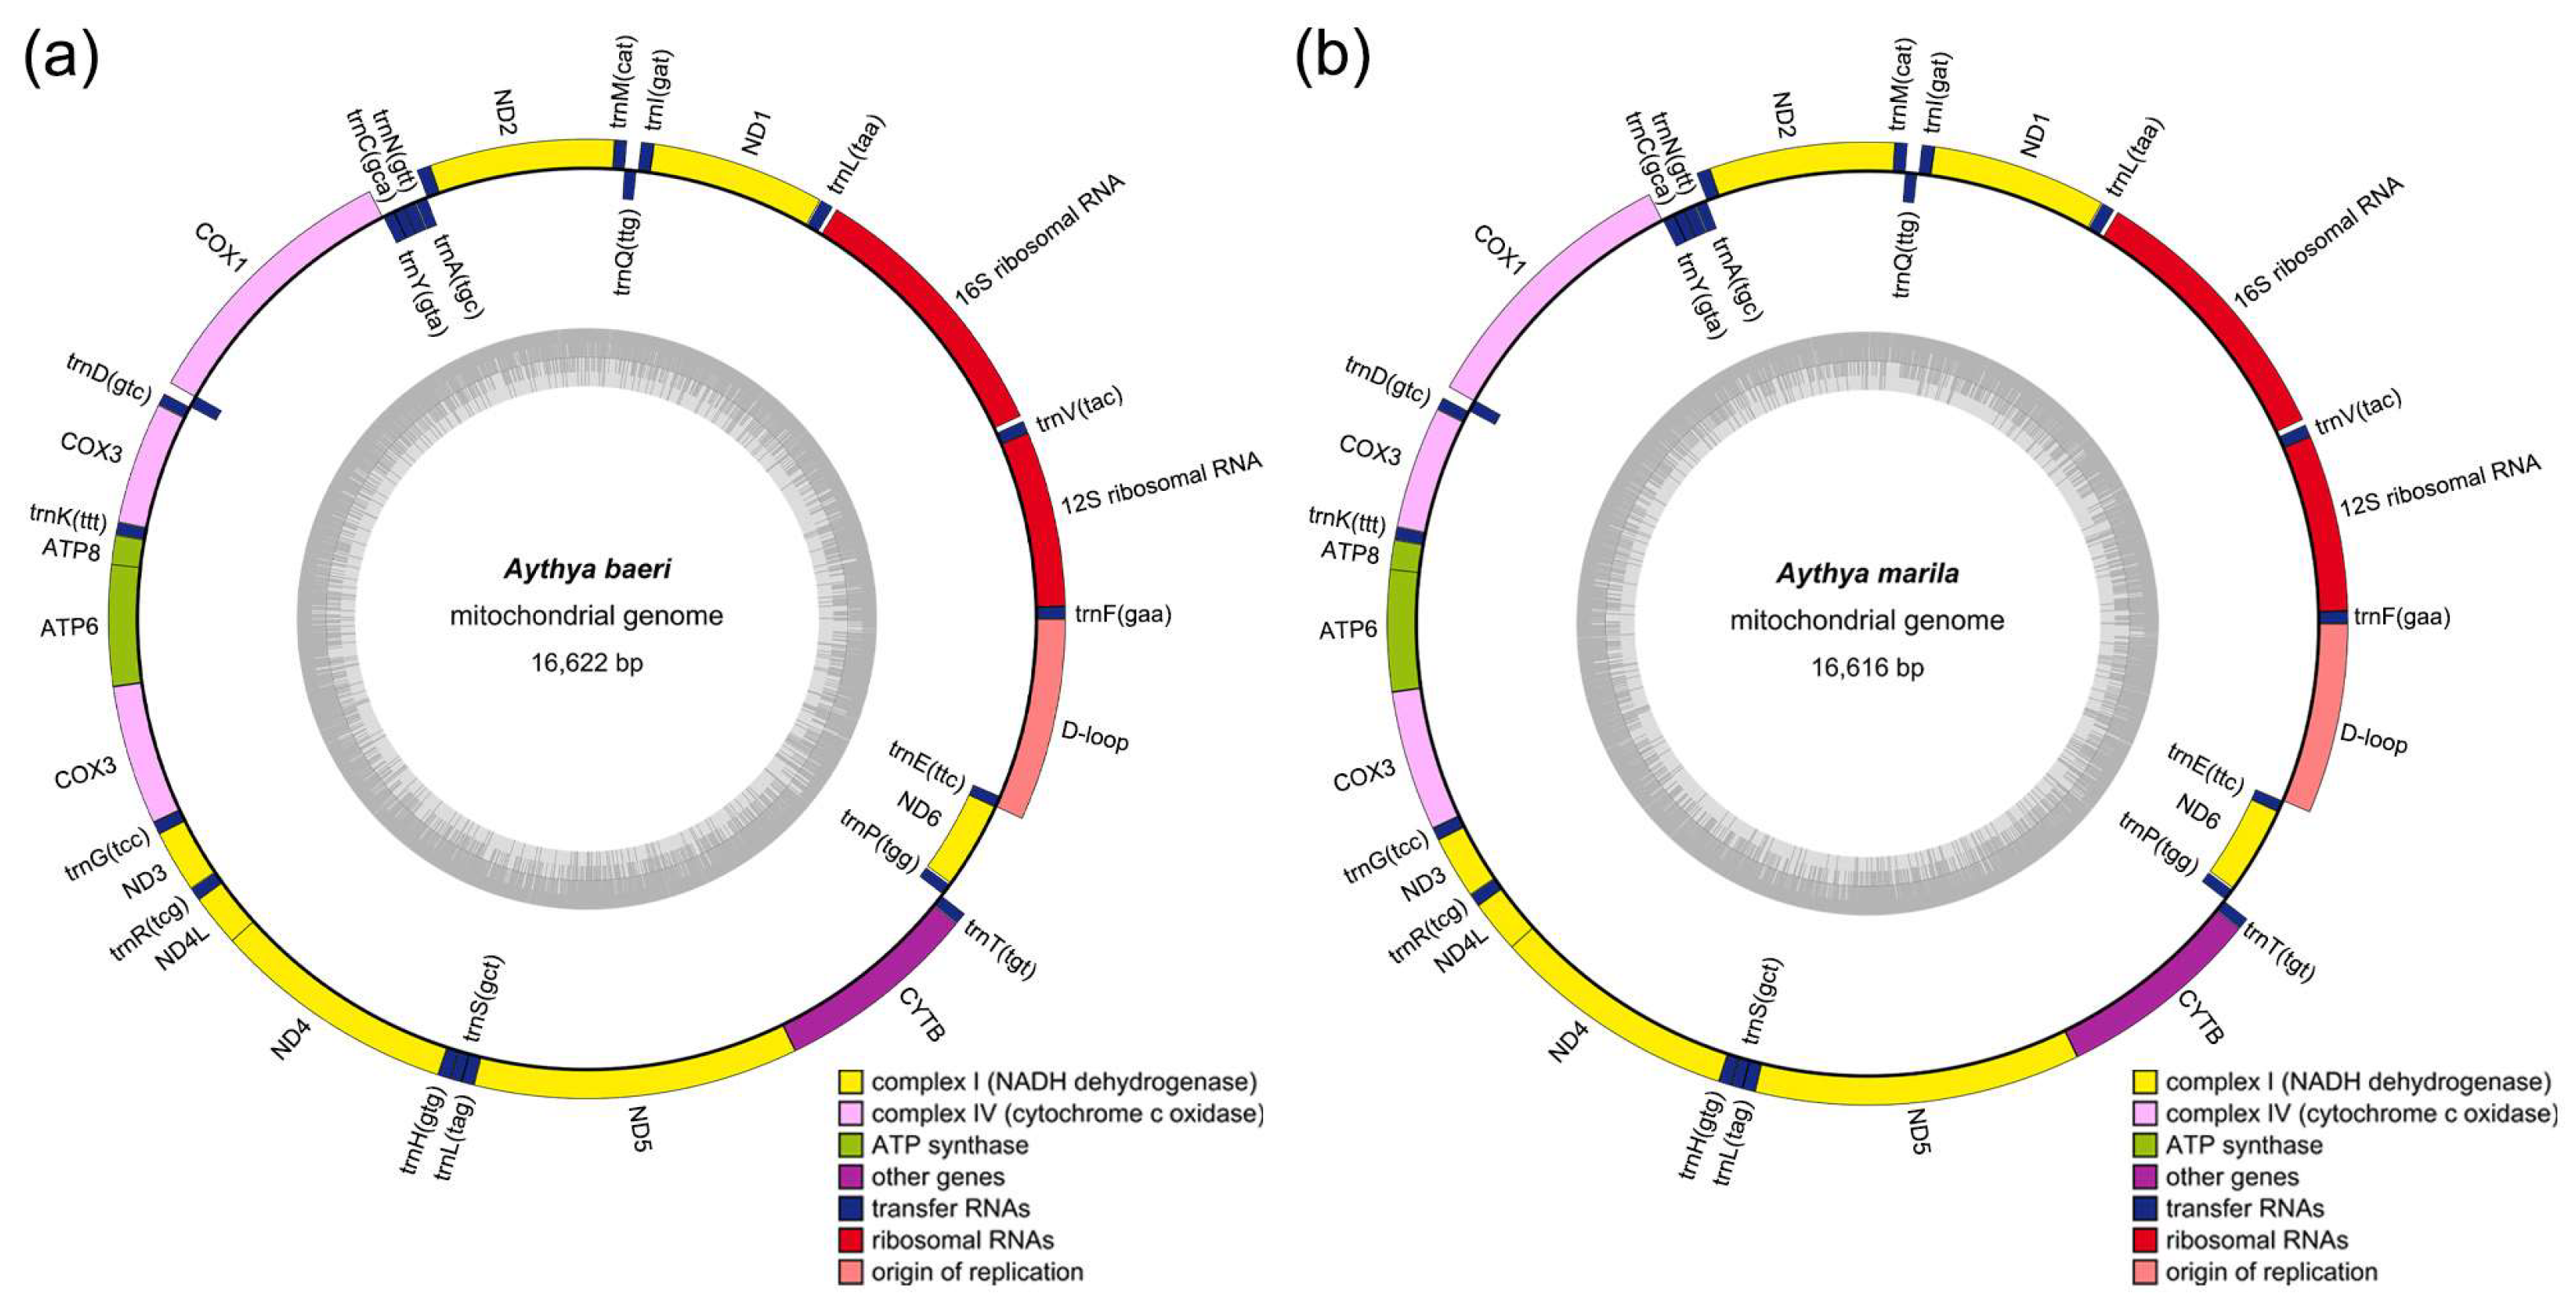
3.1. Mitogenome Structure and Annotation

We assembled the complete mitogenomes of A. baeri and A. marila, which were 16,622 and 16,616 bp in size, respectively. The GC contents of the complete mitogenomes of A. marila and A. baeri were 48.3% and 48.1%, respectively, which are similar to that of other species within Anatidae and slightly lower than that of AT bases (Table S1). The AT skew values of A. marila and A. baeri were 0.139 and 0.143, respectively, whereas the GC skew values were −0.359 and −0.362, indicating a higher content of the A bases than the T bases and a higher content of the C bases than the G bases. Both complete mitogenomes contained 37 genes, including 13 PCGs, 22 tRNA genes, 2 rRNA genes, and 1 non-coding region (Figure 1a,b). The ND6 gene and 8 tRNA genes (trnQ, trnA, trnN, trnC, trnY, trnS, trnP, ND6, and trnE) are located on the light chains, whereas the remaining 28 genes are located on the heavy strand (Table 1 and Table 2).
Across the mitogenome sequences, there were 34 bp in overlapping regions, and both species exhibited the largest overlap of 10 bp between ATP8 and ATP6 (Table 1 and Table 2). Both species shared the same start and stop codons in their PCGs (Table 1 and Table 2). Apart from the conventional start codon ATG, which was present in 10 PCGs, the non-standard codon GTG was found in COX1, COX2, and ND5. Four types of stop codons were identified: AGG, TAA, TAG, and T. Codon usage analysis revealed that these two species have strong preferences for eight codon families: Ala, Arg, Gly, Leu1, Pro, Ser2, Thr, and Val (Figure 2a,b).

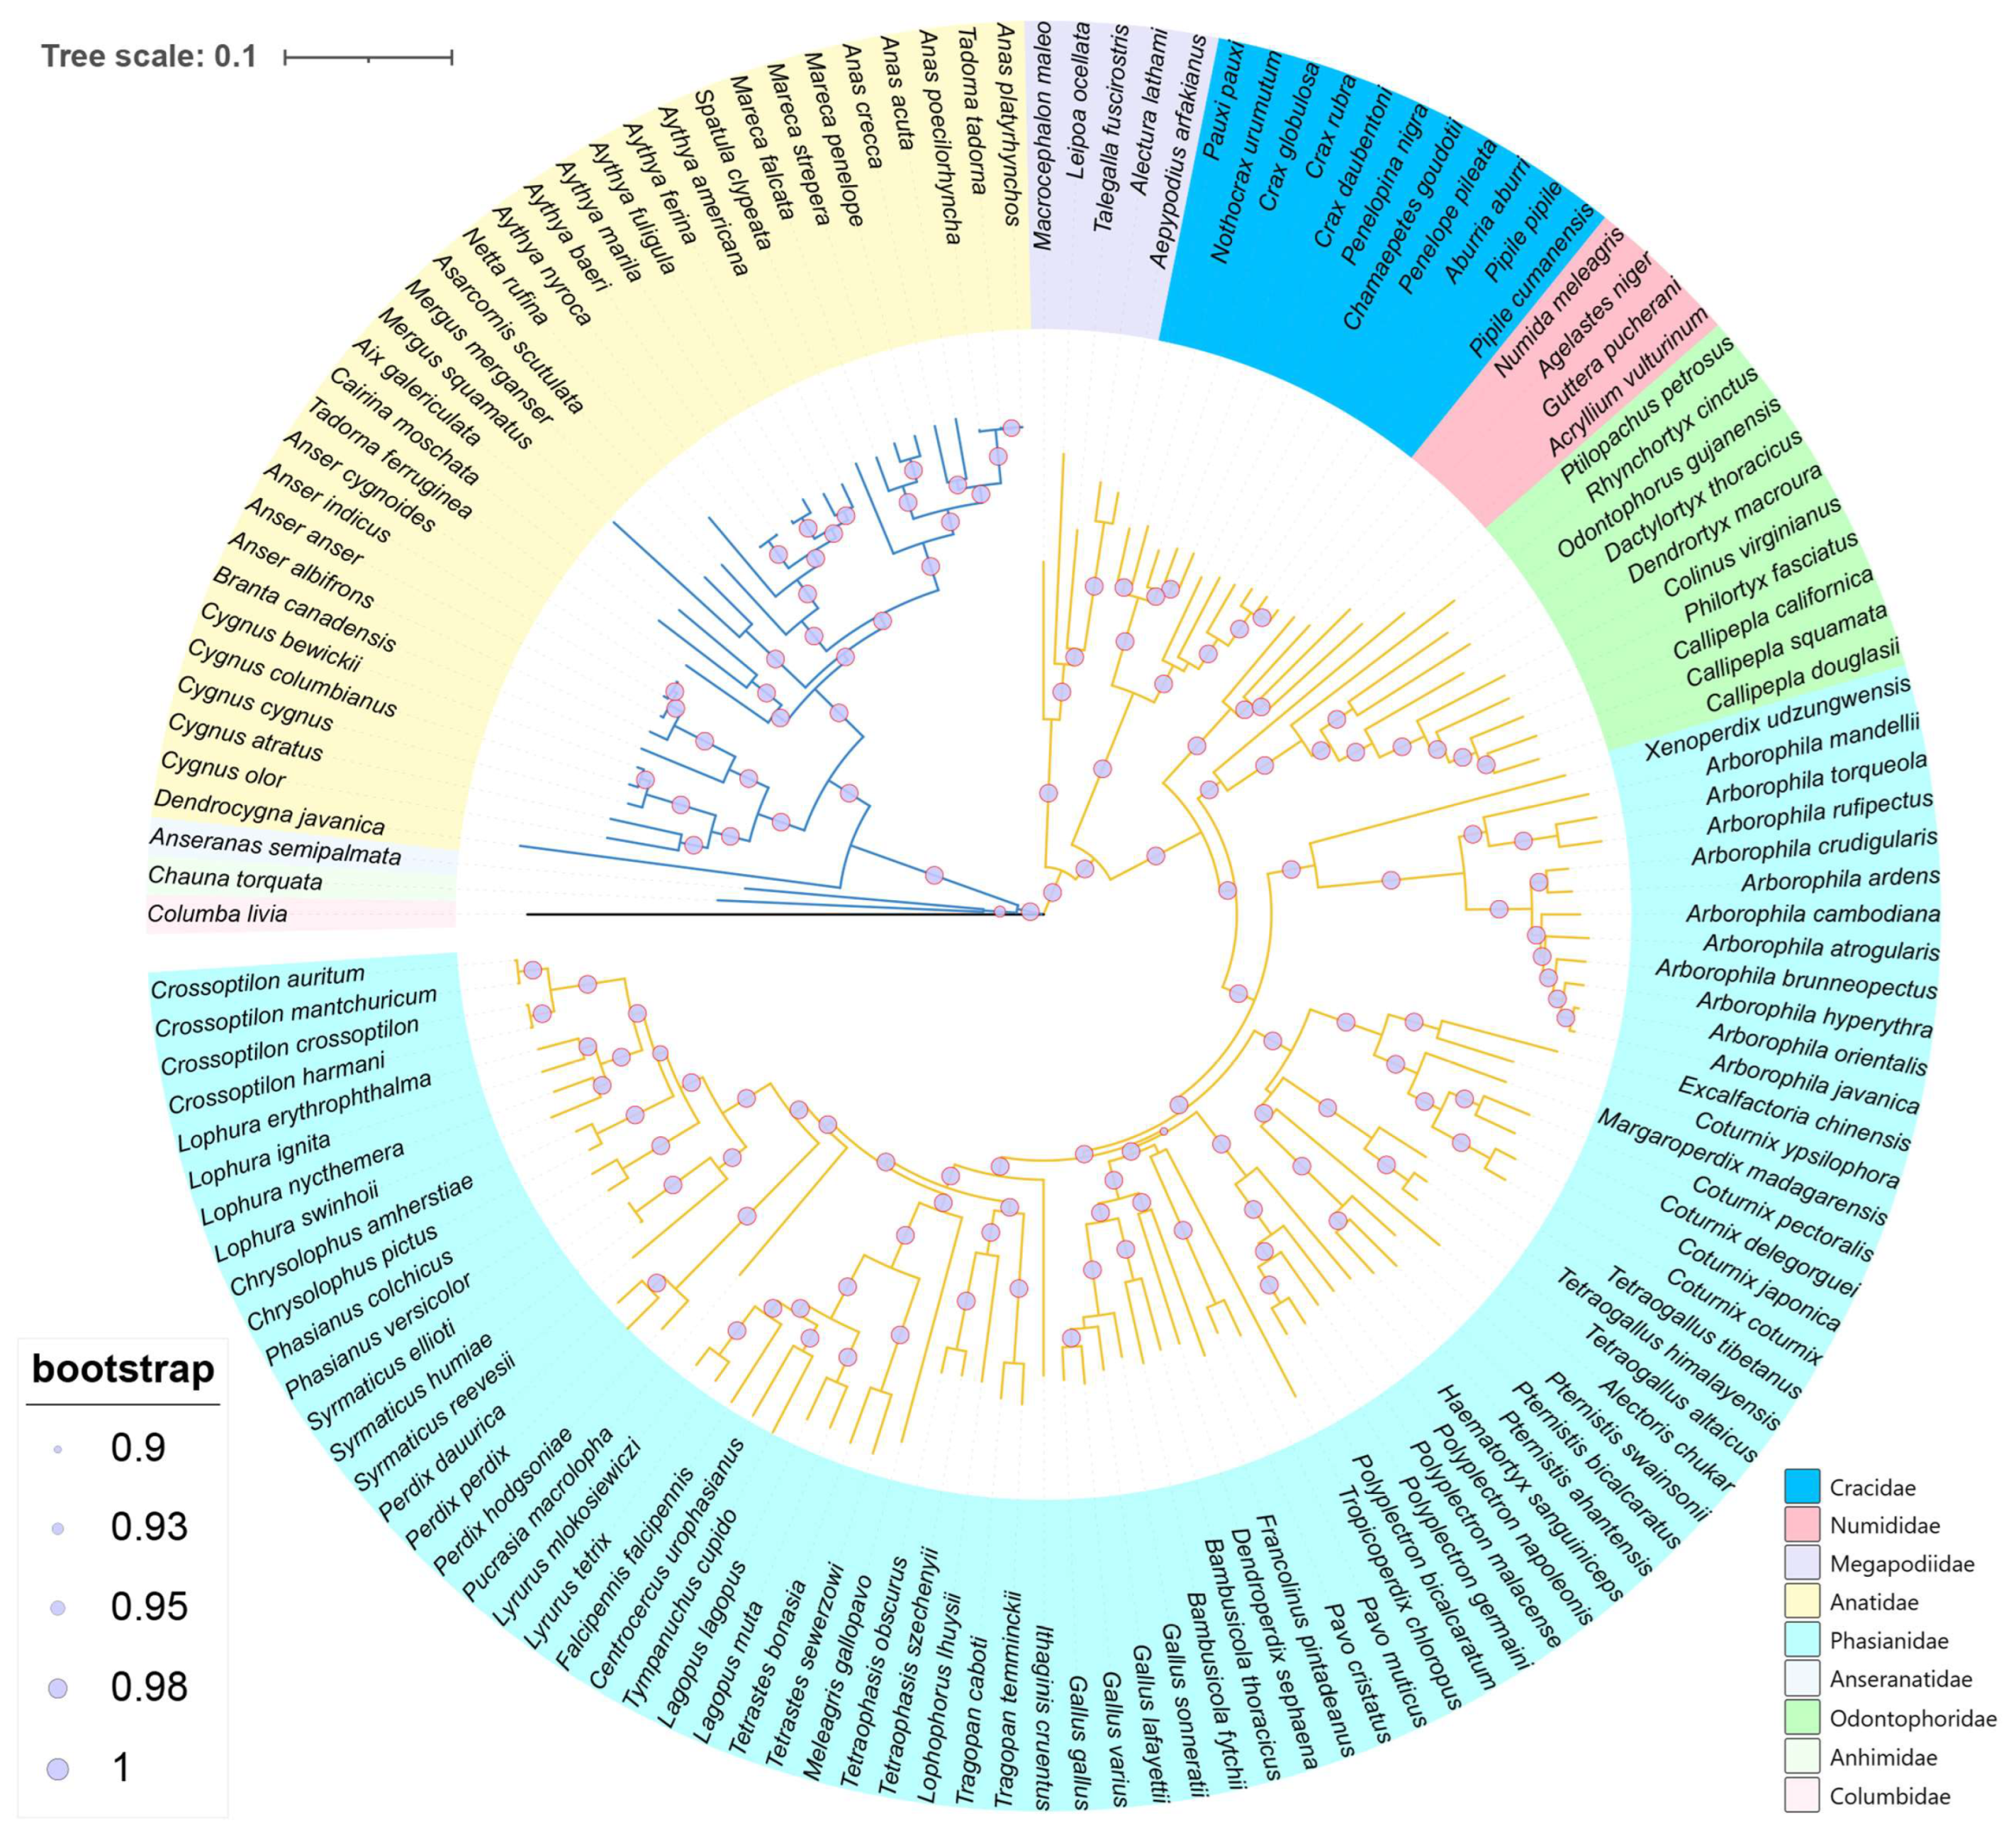
3.2. Phylogenetic and Divergence Time Analysis

We present a Bayesian inference phylogenetic tree with high bootstrap support values and Bayesian posterior probabilities for 142 species of Galloanseres (Figure 3). The minimum and average effective sample size (ESS) were 1297.82 and 1384.62, respectively, indicating that the Bayesian inference of phylogeny was reliable. The phylogenetic relationships showed that Galloanseres are a monophyletic group divided into two evolutionary clades: Anseriformes and Galliformes. Species of Anseriformes and Galliformes are clustered together. Within Anseriformes, the closest relationship is observed between the family Anhimidae and Anseranatidae, which then cluster together with Anatidae. A. baeri and A. marila are most closely related to Aythya nyroca and Aythya fuligula, respectively. Tadorna tadorna clusters together with Anas platyrhynchos rather than grouping with Tadoma ferruginea from the same genus (Tadorna) because this species should be identified as the Linwu duck (Anas platyrhynchos domestica) [36]. Within Galliformes, the family Phasianidae is most closely related to the family Odontophoridae, followed by the clade leading to the families Numididae, Cracidae, and Megapodiidae. Our results exhibited a topology similar to those of previous studies [37,38].
Based on fossil-calibrated species divergence times (Figure 4), Galliformes and Anseriformes diverged at approximately 79.62 Mya (95% CI: 73.45–85.23 Mya). The main clade of Anseriformes, family Anatidae, split around 74.54 Mya (95% CI: 68.89–80.06 Mya), whereas another clade split into Anseranatidae and Anhimidae around 67.07 Mya (95% CI: 61.19–73.02 Mya). The separation times of several major families within Galliformes are as follows: Megapodiidae around 71.33 Mya (95% CI: 66.18–76.62), Cracidae around 66.48 Mya (95% CI: 61.81–71.59), Numididae around 49.71 Mya (95% CI: 47.23–54.16), and the divergence of Phasianidae and Odontophoridae around 47.14 Mya (95% CI: 45.03–51.51). Simultaneously, it is noteworthy that Galloanseres continued to diversify rapidly after the Middle Miocene.

3.3. Selection Pressure Analysis

The results of the free-ratio model indicated that, with the exception of ATP8 and ND4L, all other genes were better explained by the free-ratio model than by the M0 model (p < 0.05) (Table S2). ATP8 and ND4L showed the same rate of evolution across all species, whereas the other genes exhibited different rates of evolution. Most species’ mitochondrial PCGs have undergone purifying selection (ω < 1), except for Arborophila orientalis, where a signal of positive selection was detected in ND4 (ω = 1.172) (Table S2). We used the root-to-tip ω to assess the selection pressure of different mitochondrial PCGs. Overall, larger ω values were observed in the Galloanseres species for ND2 and ND6, whereas smaller ω values were evident for COX1 and COX3 (Figure 5 and Table S3). These indicated that the ND2 and ND6 likely evolved more quickly, whereas the COX1 and COX3 were more conservative.
We used the CmC model to examine the evolutionary rates of the two clades, and the results indicated differences in the evolutionary rates between lineages occupying the two distinct ecological niches (Table 3). Likelihood ratio tests showed no significant (p > 0.05) differences in ATP8, COX2, ND4L, or ND6 between the two models, indicating that the evolutionary rates of the two clades were the same, which supports the outcome of the null model. Other genes showed that the M2a_rel model was superior to the CmC model. The ω values of all genes were <1, indicating that these genes were under purifying selection pressure in both Galliformes and Anseriformes. For the other genes, except for ATP6, the evolutionary rate was lower in Anseriformes than in Galliformes.

4. Discussion

The adaptive evolution of organisms is a complex process that involves multiple processes, such as genetics, transcription, metabolism, and physiological activities. Maternally inherited, possessing independent genetic and proteosynthetic apparatus, providing most of the energy required for life activities, and participating in a multitude of life processes, these making mitochondria ideal materials for studying phylogeny and adaptive evolution. In this study, we present a comparative analysis of the mitogenomes in Galloanseres to investigate their roles in the divergent evolutionary trajectories of the two sister clades and the evolutionary process of species within Galloanseres.
We assembled the complete mitogenomes of A. baeri and A. marila using NOVOPlasty, based on high-quality, high-throughput sequencing data. The mitogenomes of these two diving ducks exhibited typical circular structures with lengths of 16,622 and 16,616 bp, respectively, and contained 13 PCGs, 22 tRNA genes, 2 rRNA genes, and 1 non-coding region. The gene structures and lengths were similar to those of the mitogenomes of other species within Aythya reported in previous studies (Table 1, Table 2 and Table S1) [39,40,41,42,43]. Additionally, differences in nucleotide composition and codon usage were extremely similar, indicating a highly conserved mitogenome structure among species within Aythya. Although mitochondria are widely present in eukaryotic cells, they possess independent DNA and translation systems, with translation types similar to those of bacteria [44,45]. Two start codons were observed within these two mitogenomes: GTG and the standard codon ATG, which are also relatively common start codons in vertebrates [46,47,48,49]. There are multiple types of stop codons, including AGG, TAA, TAG, and an incomplete codon T. AGG serves as a codon for encoding arginine, but in mitochondria, owing to the absence of cognate tRNAs, this codon is reassigned to function as a stop codon [50] and terminates translation by interacting with mitochondrial release factor 1 [51,52]. The incomplete T stop codon could be completed by means of posttranscriptional polyadenylation [20].
Through phylogenetic analysis, we constructed a robust phylogenetic tree for Galloanseres, with each node being well supported (bootstrap > 0.9). This phylogenetic tree covered all families and more than half (75 genera) of the 142 genera in Galloanseres, providing a comprehensive explanation of the phylogenetic relationships within the subclass. According to the species divergence time estimation, the two clades of Galloanseres diverged around 79.62 Mya, and it was not until the past few million years that the major lineages of Galloanseres gradually formed. Since the Middle Miocene (~13.82 Mya), species of Galloanseres have undergone rapid evolution and diversification. This could be the result of climate change, causing the fragmentation and vicariance of biological communities [53]. The Miocene climatic optimum promoted population expansion, and the cooling episode during the Middle Miocene led to a wave of retraction and fragmentation of biological communities [54], increasing the opportunity for the formation of new isolated populations [55].
Mitochondrial OXPHOS is at the core of cellular energy metabolism, which is crucial for energy generation in eukaryotic organisms. The analysis of selective pressures on the 13 mitochondrial PCGs revealed the roles and contributions of these genes in adaptation to different ecological niches. Both the free-ratio model and CmC model analysis showed evidence of purifying selection acting on these genes (except for ND4 in A. orientalis), indicating that mutations in mitochondrial genes are mostly synonymous. Studies in other organisms have suggested that mitochondrial genes primarily undergo purifying selection [21,23,56,57]. Non-synonymous mutations involve the replacement of amino acid residues, leading to variants with uncertain significance [58], which can result in OXPHOS dysfunction and related diseases [59], whereas synonymous mutations can maintain the normal structure and function of proteins. Mitochondrial genes also exhibit different evolutionary patterns across species. Cytochrome c oxidase is a key rate-limiting enzyme in the electron transport chain that drives OXPHOS and serves as a regulatory center for oxidative phosphorylation [60]. In addition, this enzyme is subjected to feedback inhibition by ATP to prevent the formation of reactive oxygen species. Two genes encoding cytochrome c oxidase subunits (COX1 and COX3) show strong purifying selection, which may be related to their essential functions. NADH dehydrogenase (complex I) is the most complicated enzyme complex of the mitochondrial respiratory chain, encoded by seven mitochondrial genes [61]. ND2 and ND6 may have experienced more relaxed selective constraints, which allowed them to accumulate more mutations, but these may not affect the normal function of NADH dehydrogenase. In general, the mitochondrial genes of Galliformes have exhibited a faster rate of evolution. Our evaluation of the evolutionary rates of both the Galliformes and Anseriformes clades largely supported this result. Different evolutionary directions impose selective constraints on the mitogenome, leading to different rates of evolution. Birds of Anseriformes, which require swimming and long-distance flight, have stronger locomotor abilities than birds of Galliformes. Stronger purifying selection may help birds of Anseriformes maintain an efficient energy metabolism, whereas birds of Galliformes relax their energy requirements, allowing them to experience more relaxed selective pressures [62].

5. Conclusions

We assembled two new complete mitogenome sequences of species within Aythya based on high-quality sequencing data, estimated a robust phylogenetic relationship tree within the Galloanseres, and inferred divergence times among species based on fossil calibrations. We found that species within Galloanseres underwent rapid evolution and diversification after the Middle Miocene. The analysis of the selection pressure on mitochondrial PCGs indicated that purifying selection was the predominant trend in Galloanseres, which may be crucial for maintaining normal OXPHOS. The evolutionary rates of COX1 and COX3 were slower than those of other genes, likely because of their important functions in the electron transport chain. The evolutionary rate of mitochondrial PCGs in Anseriformes was generally lower than that in Galliformes, indicating that different evolutionary directions with varying energy demands influenced the mitochondrial evolution rate. In summary, our study provides new genetic resources for A. baeri and A. marila, revealing the phylogenetic relationships and evolutionary processes of species within Galloanseres, and providing molecular evidence for the evolution of Galloanseres.

Supplementary Materials

The following supporting information can be downloaded at: https://www.mdpi.com/article/10.3390/ani14101437/s1, Table S1: Information of all the mitochondrial genomes used; Table S2: Positive selection test of mitochondrial PCGs in different branches using the free-ratio model; Table S3: The root-to-tip ω of mitochondrial PCGs.

Author Contributions

Conceptualization, S.Z., X.W. and L.W.; data curation and formal analysis, S.Z. and X.W.; writing—original draft, S.Z.; writing—review and editing, S.Z.; supervision, X.G., T.L. and T.X.; project administration, L.S., Y.D., X.M. and Z.Z.; funding acquisition, H.Z., X.G., T.L. and T.X. All authors have read and agreed to the published version of the manuscript.

Funding

This research was supported by the National Natural Science Foundation of China (32200407 and 32270444), the Natural Science Foundation of Shandong Province (ZR2023ZD47), and the Postdoctoral Fellowship Program of CPSF (GZC20231394, GZC20231395, and GZC20231396).

Institutional Review Board Statement

Ethical review and approval were waived for this study, due to the fact that only non-invasive samples were collected and analyzed.

Informed Consent Statement

Not applicable.

Data Availability Statement

All the mitochondria genomes sequences used in this study were accessed through the GenBank database using the accession numbers in Table 1.

Acknowledgments

Thanks to the support of the National Natural Science Foundation of China, the Natural Science Foundation of Shandong Province, and the Postdoctoral Fellowship Program of CPSF.

Conflicts of Interest

The authors declare no competing interests.

References

  1. Jarvis, E.D.; Mirarab, S.; Aberer, A.J.; Li, B.; Houde, P.; Li, C.; Ho, S.Y.; Faircloth, B.C.; Nabholz, B.; Howard, J.T.; et al. Whole-genome analyses resolve early branches in the tree of life of modern birds. Science 2014, 346, 1320–1331. [Google Scholar] [CrossRef] [PubMed]
  2. De Mendoza, R.S.; Gomez, R.O. Ecomorphology of the tarsometatarsus of waterfowl (Anseriformes) based on geometric morphometrics and its application to fossils. Anat. Rec. 2022, 305, 3243–3253. [Google Scholar] [CrossRef] [PubMed]
  3. Hosner, P.A.; Tobias, J.A.; Braun, E.L.; Kimball, R.T. How do seemingly non-vagile clades accomplish trans-marine dispersal? Trait and dispersal evolution in the landfowl (Aves: Galliformes). Proc. Biol. Sci. 2017, 284. [Google Scholar] [CrossRef] [PubMed]
  4. Sarkar, I.; Rathore, S.S.; Singh, R.P. An interplay between compositional constraint and natural selection dictates the codon usage pattern among select Galliformes. Bio Syst. 2021, 204, 104390. [Google Scholar] [CrossRef] [PubMed]
  5. Cordero, G.A.; Werneburg, I. Domestication and the comparative embryology of birds. J. Exp. Zool. B Mol. Dev. Evol. 2022, 338, 447–459. [Google Scholar] [CrossRef] [PubMed]
  6. Vercellino, I.; Sazanov, L.A. The assembly, regulation and function of the mitochondrial respiratory chain. Nat. Rev. Mol. Cell Biol. 2022, 23, 141–161. [Google Scholar] [CrossRef] [PubMed]
  7. Sousa, J.S.; D’Imprima, E.; Vonck, J. Mitochondrial Respiratory Chain Complexes. Subcell. Biochem. 2018, 87, 167–227. [Google Scholar]
  8. Bock, F.J.; Tait, S.W.G. Mitochondria as multifaceted regulators of cell death. Nat. Rev. Mol. Cell Biol. 2020, 21, 85–100. [Google Scholar] [CrossRef]
  9. Ng, M.Y.W.; Wai, T.; Simonsen, A. Quality control of the mitochondrion. Dev. Cell 2021, 56, 881–905. [Google Scholar] [CrossRef]
  10. Shadel, G.S.; Horvath, T.L. Mitochondrial ROS signaling in organismal homeostasis. Cell 2015, 163, 560–569. [Google Scholar] [CrossRef]
  11. Collier, J.J.; Olahova, M.; McWilliams, T.G.; Taylor, R.W. Mitochondrial signalling and homeostasis: From cell biology to neurological disease. Trends Neurosci. 2023, 46, 137–152. [Google Scholar] [CrossRef] [PubMed]
  12. Adebayo, M.; Singh, S.; Singh, A.P.; Dasgupta, S. Mitochondrial fusion and fission: The fine-tune balance for cellular homeostasis. FASEB J. 2021, 35, e21620. [Google Scholar] [CrossRef] [PubMed]
  13. Mallet, R.T.; Burtscher, J.; Pialoux, V.; Pasha, Q.; Ahmad, Y.; Millet, G.P.; Burtscher, M. Molecular Mechanisms of High-Altitude Acclimatization. Int. J. Mol. Sci. 2023, 24, 1698. [Google Scholar] [CrossRef] [PubMed]
  14. Hood, W.R.; Austad, S.N.; Bize, P.; Jimenez, A.G.; Montooth, K.L.; Schulte, P.M.; Scott, G.R.; Sokolova, I.; Treberg, J.R.; Salin, K. The Mitochondrial Contribution to Animal Performance, Adaptation, and Life-History Variation. Integr. Comp. Biol. 2018, 58, 480–485. [Google Scholar] [CrossRef]
  15. O’Brien, K.M. Mitochondrial biogenesis in cold-bodied fishes. J. Exp. Biol. 2011, 214 Pt 2, 275–285. [Google Scholar] [CrossRef] [PubMed]
  16. Bennett, C.F.; Latorre-Muro, P.; Puigserver, P. Mechanisms of mitochondrial respiratory adaptation. Nat. Rev. Mol. Cell Biol. 2022, 23, 817–835. [Google Scholar] [CrossRef] [PubMed]
  17. Francoso, E.; Zuntini, A.R.; Ricardo, P.C.; Santos, P.K.F.; de Souza Araujo, N.; Silva, J.P.N.; Goncalves, L.T.; Brito, R.; Gloag, R.; Taylor, B.A.; et al. Rapid evolution, rearrangements and whole mitogenome duplication in the Australian stingless bees Tetragonula (Hymenoptera: Apidae): A steppingstone towards understanding mitochondrial function and evolution. Int. J. Biol. Macromol. 2023, 242 Pt 1, 124568. [Google Scholar] [CrossRef]
  18. Sasaki, T.; Sato, M. Degradation of paternal mitochondria via mitophagy. Biochim. Biophys. Acta Gen. Subj. 2021, 1865, 129886. [Google Scholar] [CrossRef]
  19. Lebedev, V.S.; Shenbrot, G.I.; Krystufek, B.; Mahmoudi, A.; Melnikova, M.N.; Solovyeva, E.N.; Lisenkova, A.A.; Undrakhbayar, E.; Rogovin, K.A.; Surov, A.V.; et al. Phylogenetic relations and range history of jerboas of the Allactaginae subfamily (Dipodidae, Rodentia). Sci. Rep. 2022, 12, 842. [Google Scholar] [CrossRef]
  20. Shang, Y.; Wang, X.; Liu, G.; Wu, X.; Wei, Q.; Sun, G.; Mei, X.; Dong, Y.; Sha, W.; Zhang, H. Adaptability and Evolution of Gobiidae: A Genetic Exploration. Animals 2022, 12, 1741. [Google Scholar] [CrossRef]
  21. Wang, X.; Zhou, S.; Wu, X.; Wei, Q.; Shang, Y.; Sun, G.; Mei, X.; Dong, Y.; Sha, W.; Zhang, H. High-altitude adaptation in vertebrates as revealed by mitochondrial genome analyses. Ecol. Evol. 2021, 11, 15077–15084. [Google Scholar] [CrossRef] [PubMed]
  22. Zhao, B.; Gao, S.; Zhao, M.; Lv, H.; Song, J.; Wang, H.; Zeng, Q.; Liu, J. Mitochondrial genomic analyses provide new insights into the “missing” atp8 and adaptive evolution of Mytilidae. BMC Genom. 2022, 23, 738. [Google Scholar] [CrossRef]
  23. Wang, X.; Shang, Y.; Wu, X.; Wei, Q.; Zhou, S.; Sun, G.; Mei, X.; Dong, Y.; Sha, W.; Zhang, H. Divergent evolution of mitogenomics in Cetartiodactyla niche adaptation. Org. Divers. Evol. 2023, 23, 243–259. [Google Scholar] [CrossRef]
  24. Dierckxsens, N.; Mardulyn, P.; Smits, G. NOVOPlasty: De novo assembly of organelle genomes from whole genome data. Nucleic Acids Res. 2017, 45, e18. [Google Scholar]
  25. Donath, A.; Juhling, F.; Al-Arab, M.; Bernhart, S.H.; Reinhardt, F.; Stadler, P.F.; Middendorf, M.; Bernt, M. Improved annotation of protein-coding genes boundaries in metazoan mitochondrial genomes. Nucleic Acids Res. 2019, 47, 10543–10552. [Google Scholar] [CrossRef]
  26. Greiner, S.; Lehwark, P.; Bock, R. OrganellarGenomeDRAW (OGDRAW) version 1.3.1: Expanded toolkit for the graphical visualization of organellar genomes. Nucleic Acids Res. 2019, 47, W59–W64. [Google Scholar] [CrossRef] [PubMed]
  27. Kumar, S.; Stecher, G.; Li, M.; Knyaz, C.; Tamura, K. MEGA X: Molecular Evolutionary Genetics Analysis across Computing Platforms. Mol. Biol. Evol. 2018, 35, 1547–1549. [Google Scholar] [CrossRef]
  28. Zhang, D.; Gao, F.; Jakovlic, I.; Zou, H.; Zhang, J.; Li, W.X.; Wang, G.T. PhyloSuite: An integrated and scalable desktop platform for streamlined molecular sequence data management and evolutionary phylogenetics studies. Mol. Ecol. Resour. 2020, 20, 348–355. [Google Scholar] [CrossRef] [PubMed]
  29. Katoh, K.; Standley, D.M. MAFFT multiple sequence alignment software version 7: Improvements in performance and usability. Mol. Biol. Evol. 2013, 30, 772–780. [Google Scholar] [CrossRef]
  30. Talavera, G.; Castresana, J. Improvement of phylogenies after removing divergent and ambiguously aligned blocks from protein sequence alignments. Syst. Biol. 2007, 56, 564–577. [Google Scholar] [CrossRef]
  31. Kalyaanamoorthy, S.; Minh, B.Q.; Wong, T.K.F.; von Haeseler, A.; Jermiin, L.S. ModelFinder: Fast model selection for accurate phylogenetic estimates. Nat. Methods 2017, 14, 587–589. [Google Scholar] [CrossRef] [PubMed]
  32. Ronquist, F.; Teslenko, M.; van der Mark, P.; Ayres, D.L.; Darling, A.; Hohna, S.; Larget, B.; Liu, L.; Suchard, M.A.; Huelsenbeck, J.P. MrBayes 3.2: Efficient Bayesian phylogenetic inference and model choice across a large model space. Syst. Biol. 2012, 61, 539–542. [Google Scholar] [CrossRef] [PubMed]
  33. Yang, Z. PAML 4: Phylogenetic analysis by maximum likelihood. Mol. Biol. Evol. 2007, 24, 1586–1591. [Google Scholar] [CrossRef]
  34. Kumar, S.; Suleski, M.; Craig, J.M.; Kasprowicz, A.E.; Sanderford, M.; Li, M.; Stecher, G.; Hedges, S.B. TimeTree 5: An Expanded Resource for Species Divergence Times. Mol. Biol. Evol. 2022, 39, msac174. [Google Scholar] [CrossRef] [PubMed]
  35. Álvarez-Carretero, S.; Kapli, P.; Yang, Z. Beginner’s Guide on the Use of PAML to Detect Positive Selection. Mol. Biol. Evol. 2023, 40, msad041. [Google Scholar] [CrossRef] [PubMed]
  36. Lin, Q.; Jiang, G.T.; Yun, L.; Li, G.J.; Dai, Q.Z.; Zhang, S.R.; Hou, D.X.; He, X. The complete mitochondrial genome of the Linwu duck. Mitochondrial DNA A DNA Mapp. Seq. Anal. 2016, 27, 992–993. [Google Scholar] [CrossRef] [PubMed]
  37. Sun, Z.; Pan, T.; Hu, C.; Sun, L.; Ding, H.; Wang, H.; Zhang, C.; Jin, H.; Chang, Q.; Kan, X.; et al. Rapid and recent diversification patterns in Anseriformes birds: Inferred from molecular phylogeny and diversification analyses. PLoS ONE 2017, 12, e0184529. [Google Scholar] [CrossRef] [PubMed]
  38. Kimball, R.T.; Hosner, P.A.; Braun, E.L. A phylogenomic supermatrix of Galliformes (Landfowl) reveals biased branch lengths. Mol. Phylogenet. Evol. 2021, 158, 107091. [Google Scholar] [CrossRef]
  39. Ding, L.; Zhang, C.; Chang, Q.; Yan, L.; Zhang, B. The complete mitochondrial genome of Aythya fuligula (Anatidae: Aythya). Mitochondrial DNA A DNA Mapp. Seq. Anal. 2016, 27, 1003–1004. [Google Scholar] [CrossRef]
  40. Zhou, W.; Zhang, C.; Chang, Q.; Yan, L.; Pan, T.; Zhang, B. The complete mitochondrial genome of Aythya ferina (Anatidae: Aythya). Mitochondrial DNA A DNA Mapp. Seq. Anal. 2016, 27, 968–969. [Google Scholar] [CrossRef]
  41. Zhai, H.; Li, Z.; Mi, S.; Meng, D.; Yu, H.; Teng, L.; Liu, Z. The complete mitochondrial genome of the Ferruginous Duck (Aythya nyroca) from Ningxia, China. Mitochondrial DNA B Resour. 2021, 6, 546–547. [Google Scholar] [CrossRef] [PubMed]
  42. Zhai, H.; Meng, D.; Li, Z.; Si, Y.; Yu, H.; Teng, L.; Liu, Z. Complete mitochondrial genome of the common Pochard (Aythya ferina) from Ningxia Hui autonomous region, China. Mitochondrial DNA B Resour. 2022, 7, 62–63. [Google Scholar] [CrossRef] [PubMed]
  43. Zhang, L.; Xia, T.; Gao, X.; Yang, X.; Sun, G.; Zhao, C.; Liu, G.; Zhang, H. Characterization and Phylogenetic Analysis of the Complete Mitochondrial Genome of Aythya marila. Genes 2023, 14, 1205. [Google Scholar] [CrossRef] [PubMed]
  44. Lind, C.; Sund, J.; Åqvist, J. Codon-reading specificities of mitochondrial release factors and translation termination at non-standard stop codons. Nat. Commun. 2013, 4, 2940. [Google Scholar] [CrossRef] [PubMed]
  45. Huot, J.L.; Enkler, L.; Megel, C.; Karim, L.; Laporte, D.; Becker, H.D.; Duchene, A.M.; Sissler, M.; Marechal-Drouard, L. Idiosyncrasies in decoding mitochondrial genomes. Biochimie 2014, 100, 95–106. [Google Scholar] [CrossRef] [PubMed]
  46. Ai, W.; Peng, X.; Huang, X.; Xiang, D.; Chen, X. Complete mitochodrial genome of Spinibarbus caldwelli (Cypriniformes, Cyprinidae). Mitochondrial DNA 2015, 26, 131–132. [Google Scholar] [CrossRef] [PubMed]
  47. Jiang, J.J.; Xia, E.H.; Gao, C.W.; Gao, L.Z. The complete mitochondrial genome of western painted turtle, Chrysemys picta bellii (Chrysemys, Emydidae). Mitochondrial DNA A DNA Mapp. Seq. Anal. 2016, 27, 787–788. [Google Scholar] [CrossRef] [PubMed]
  48. Wang, L.Y.; Chai, Y.L.; Ma, H.M. The complete sequence of the mitochondrial genome of Duroc pig (Sus Scrofa). Mitochondrial DNA A DNA Mapp. Seq. Anal. 2016, 27, 3–4. [Google Scholar] [CrossRef] [PubMed]
  49. Zhao, C.; Zhang, H.; Zhang, J.; Chen, L.; Sha, W.; Yang, X.; Liu, G. The complete mitochondrial genome sequence of the Tibetan wolf (Canis lupus laniger). Mitochondrial DNA A DNA Mapp. Seq. Anal. 2016, 27, 7–8. [Google Scholar] [CrossRef]
  50. Anderson, S.; Bankier, A.T.; Barrell, B.G.; de Bruijn, M.H.; Coulson, A.R.; Drouin, J.; Eperon, I.C.; Nierlich, D.P.; Roe, B.A.; Sanger, F.; et al. Sequence and organization of the human mitochondrial genome. Nature 1981, 290, 457–465. [Google Scholar] [CrossRef]
  51. Krüger, A.; Remes, C.; Shiriaev, D.I.; Liu, Y.; Spåhr, H.; Wibom, R.; Atanassov, I.; Nguyen, M.D.; Cooperman, B.S.; Rorbach, J. Human mitochondria require mtRF1 for translation termination at non-canonical stop codons. Nat. Commun. 2023, 14, 30. [Google Scholar] [CrossRef] [PubMed]
  52. Saurer, M.; Leibundgut, M.; Nadimpalli, H.P.; Scaiola, A.; Schönhut, T.; Lee, R.G.; Siira, S.J.; Rackham, O.; Dreos, R.; Lenarčič, T.; et al. Molecular basis of translation termination at noncanonical stop codons in human mitochondria. Science 2023, 380, 531–536. [Google Scholar] [CrossRef] [PubMed]
  53. Claramunt, S.; Cracraft, J. A new time tree reveals Earth history’s imprint on the evolution of modern birds. Sci. Adv. 2015, 1, e1501005. [Google Scholar] [CrossRef] [PubMed]
  54. Methner, K.; Campani, M.; Fiebig, J.; Loffler, N.; Kempf, O.; Mulch, A. Middle Miocene long-term continental temperature change in and out of pace with marine climate records. Sci. Rep. 2020, 10, 7989. [Google Scholar] [CrossRef] [PubMed]
  55. Vrba, E.S. Turnover-pulses, the Red Queen, and related topics. Am. J. Sci. 1993, 293, 418–452. [Google Scholar] [CrossRef]
  56. Wei, Q.; Wang, X.; Dong, Y.; Shang, Y.; Sun, G.; Wu, X.; Zhao, C.; Sha, W.; Yang, G.; Zhang, H. Analysis of the Complete Mitochondrial Genome of Pteronura brasiliensis and Lontra canadensis. Animals 2023, 13, 3165. [Google Scholar] [CrossRef] [PubMed]
  57. Wei, Q.; Zhang, H.; Wu, X.; Sha, W. The selective constraints of ecological specialization in mustelidae on mitochondrial genomes. Mammal Res. 2020, 65, 85–92. [Google Scholar] [CrossRef]
  58. Marsh, J.A.; Teichmann, S.A. Predicting pathogenic protein variants. Science 2023, 381, 1284–1285. [Google Scholar] [CrossRef] [PubMed]
  59. Yan, C.; Duanmu, X.; Zeng, L.; Liu, B.; Song, Z. Mitochondrial DNA: Distribution, Mutations, and Elimination. Cells 2019, 8, 379. [Google Scholar] [CrossRef]
  60. Kadenbach, B. Complex IV—The regulatory center of mitochondrial oxidative phosphorylation. Mitochondrion 2021, 58, 296–302. [Google Scholar] [CrossRef]
  61. Ohnishi, T.; Ohnishi, S.T.; Salerno, J.C. Five decades of research on mitochondrial NADH-quinone oxidoreductase (complex I). Biol. Chem. 2018, 399, 1249–1264. [Google Scholar] [CrossRef] [PubMed]
  62. Shen, Y.Y.; Shi, P.; Sun, Y.B.; Zhang, Y.P. Relaxation of selective constraints on avian mitochondrial DNA following the degeneration of flight ability. Genome Res. 2009, 19, 1760–1765. [Google Scholar] [CrossRef] [PubMed]
Figure 1. Mitogenome gene map of A. baeri (a) and A. marila (b). The genes outside the circle are transcribed clockwise, whereas the genes inside the circle are transcribed counterclockwise.
Animals 14 01437 g001
Figure 2. Relative synonymous codon usage (RSCU) of A. baeri (a) and A. marila (b). The X-axis shows the codon family types, and the Y-axis shows the proportion of each codon type to the respective codon family.
Animals 14 01437 g002
Figure 3. The Bayesian inference of phylogenetic trees for 143 species based on PCG matrix.
Animals 14 01437 g003
Figure 4. Divergence time estimation of 143 Species based on 13 mitochondrial PCGs. “Q.” is an abbreviation for Quaternary; “P.” is an abbreviation for Pliocene.
Animals 14 01437 g004
Figure 5. Box plot of 13 mitochondrial genes’ evolution rates (ω).
Animals 14 01437 g005
Table 1. Mitogenome characteristics of A. baeri.
GeneNucleotide PositionsSize (bp)StandIntergenic NucleotideStartStop
trnF1–7070+
12s rRNA70–1053984+−1
trnV1054–112471+0
16s rRNA1155–27041550+30
trnL2729–280274+24
ND12807–3784978+4ATGAGG
trnI3783–385472+−2
trnQ3863–3933718
trnM3933–400169+−1
ND24002–50401039+0ATGT
trnW5041–511676+0
trnA5120–5188693
trnN5191–5263732
trnC5264–5329660
trnY5329–539971−1
COX15401–69511551+1GTGAGG
trnS6943–701573−9
trnD7018–708669+2
COX27088–7774687+1GTGTAA
trnK7776–784368+1
ATP87845–8012168+1ATGTAA
ATP68003–8686684+−10ATGTAA
COX38686–9469784+−1ATGT
trnG9470–953869+0
ND39539–9890352+0ATGTAA
trnR9892–996271+1
ND4L9963–10,259297+0ATGTAA
ND410,253–11,6301378+−7ATGT
trnH11,631–11,69969+0
trnS11,700–11,76566+0
trnL11,765–11,83571+−1
ND511,836–13,6591824+0GTGTAA
CYTB13,659–14,8011143+−1ATGTAA
trnT14,804–14,87269+2
trnP14,883–14,9527010
ND614,963–15,48452210ATGTAG
trnE15,485–15,552680
Table 2. Mitogenome characteristics of A. marila.
GeneNucleotide PositionsSize (bp)StandIntergenic NucleotideStartStop
trnF1–7070+
12s rRNA70–1054985+−1
trnV1055–112571+0
16s rRNA1156–27051550+30
trnL2729–280274+23
ND12807–3784978+4ATGAGG
trnI3783–385472+−2
trnQ3863–3933718
trnM3933–400169+−1
ND24002–50401039+0ATGT
trnW5041–511676+0
trnA5120–5188693
trnN5191–5263732
trnC5264–5329660
trnY5329–539971−1
COX15401–69511551+1GTGAGG
trnS6943–701573−9
trnD7018–708669+2
COX27088–7774687+1GTGTAA
trnK7776–784368+1
ATP87845–8012168+1ATGTAA
ATP68003–8686684+−10ATGTAA
COX38686–9469784+−1ATGT
trnG9470–953869+0
ND39539–9890352+0ATGTAA
trnR9892–996170+1
ND4L9962–10,258297+0ATGTAA
ND410,252–11,6291378+−7ATGT
trnH11,630–11,69869+0
trnS11,699–11,76466+0
trnL11,764–11,83471+−1
ND511,835–13,6581824+0GTGTAA
CYTB13,658–14,8001143+−1ATGTAA
trnT14,803–14,87169+2
trnP14,882–14,9517010
ND614,962–15,48352210ATGTAG
trnE15,484–15,551680
Table 3. Positive selection test of mitochondrial PCGs in different clades using the CmC model.
GeneModel Compared|2ΔlnL|p-ValueM2a_relCmC
ωωANSωGAL
ATP6CmC vs. M2a_rel15.91973.492 × 10−4 **0.15650.16790.1582
ATP84.23180.12050.25750.17020.2763
COX113.77330.0010 **0.10730.10340.1099
COX21.52590.46630.11330.12900.1109
COX38.00600.0183 *0.06330.06130.0660
CYTB12.89370.0016 **0.08860.08320.0918
ND113.78170.0010 **0.16610.15570.1697
ND260.45827.438 × 10−14 **0.15370.10380.1696
ND312.53400.0019 **0.17200.12320.1907
ND426.80341.513 × 10−6 **0.13130.10740.1402
ND4L3.36080.18630.10030.12670.0936
ND516.72772.33 × 10−4 **0.13460.10750.1443
ND68.93460.0115 *0.12880.10040.1388
Note: *, significant level (* p < 0.05, ** p < 0.01). ANS: the clade of Anseriformes; GAL, the clade of Galliformes.
Disclaimer/Publisher’s Note: The statements, opinions and data contained in all publications are solely those of the individual author(s) and contributor(s) and not of MDPI and/or the editor(s). MDPI and/or the editor(s) disclaim responsibility for any injury to people or property resulting from any ideas, methods, instructions or products referred to in the content.

