Simple Summary
It is well known that the fat in egg yolk is mainly synthesized by the liver, which is an important organ for the synthesis of lipids in poultry, and then is transported through blood circulation. To investigate the effect of liver lipid metabolism on yolk fat deposition, we measured the quality of egg and yolk, yolk fatty acid composition, and liver lipids in two different chicken breeds. The results suggested that the higher fat content of indigenous chickens was regulated by the upregulated adipocytokine signaling pathway in the liver, which causes enrichment of diacylglycerol and ceramide.
Abstract
The mechanism which regulates differential fat deposition in egg yolk from the indigenous breeds and commercial laying hens is still unclear. In this research, Chinese indigenous Huainan Partridge chickens and Nongda III commercial laying hens were used for egg collection and liver sampling. The weight of eggs and yolk were recorded. Yolk fatty acids were determined by gas chromatography-mass spectrometry. Lipid metabolites in the liver were detected by liquid chromatography-mass spectrometry. Yolk weight, yolk ratio and yolk fat ratio exhibited higher in the Huainan Partridge chicken than that of the Nongda III. Compared to the Nongda III, the content of total saturated fatty acid was lower, while the unsaturated fatty acid was higher in the yolk of the Huainan Partridge chicken. Metabolites of phosphatidylinositol and phosphatidylserine from glycerolphospholipids, and metabolites of diacylglycerol from glycerolipids showed higher enrichment in the Huainan Partridge chicken than that of the Nongda III, which promoted the activation of the adipocytokine signaling pathway. However, metabolites of phosphatidic acid, phosphatidylcholine, phosphatidylethanolamine and lysophosphatidylcholine from glycerol phospholipids, and metabolites of triacylglycerol from glycerolipids showed lower enrichment in the Huainan Partridge chicken than that of the Nongda III. The high level of yolk fat deposition in the Huainan Partridge chicken is regulated by the activation of the adipocytokine signaling pathway which can promote the accumulation of diacylglycerol and ceramide in the liver.
1. Introduction
Under intensive selection, egg production has reached more than 300 in commercial egg-type hens within 72 weeks, and could reach 500 in commercial flocks with an extended laying cycle lasting to 100 weeks [1]. However, falling egg quality, including lower shell quality and yolk fat of commercial laying hens has caused the consideration of choosing other types of eggs. The acceptability of eggs is mainly affected by the characteristics which show their intrinsic quality including egg weight, yolk weight, protein content, fat content and the yolk fatty acid composition [2].
Egg quality is mainly dependent on the breed of chickens, feed types, and feed nutrient levels [3], of which breed is considered to be the most important factor affecting egg quality, especially the internal quality of egg yolk fatty acid composition and water content in egg white [4,5]. It is stated that the chicken breed could affect egg quality of the chemical composition of protein, fat (polyunsaturated and saturated), sugar, cholesterol, and α-tocopherol content [6,7]. As egg yolks are rich in nutrients, the inner quality of nutritional composition and content in egg yolk have become the most important factors for consumers to choose eggs.
The liver is the major organ which is responsible for the synthesis of yolk lipids and other yolk precursors of birds. It is stated that nearly 6 g triacylglycerols are transported to the oocyte from the liver of the laying hens [8,9]. The yolk precursors are mainly composed of very low-density lipoprotein (VLDL) and vitellogenin, which are transported via the vascular system to the oocytes, and enzymatically processed into yolk proteins and deposited in yolk platelets for use [10,11]. During egg laying of Muscovy ducks, the glutathione and ascorbic acid abundance were downregulated and choline abundance was upregulated in the liver to meet the needs of the yolk precursors’ synthesis [12]. During egg laying, phospholipids, triglycerides, apolipoprotein B, and apolipoprotein VLDL-II were all abundantly synthesized in the liver [13], which suggested that the differential chemical components and content from egg yolk might be responsible for the different synthetic ability of yolk precursor in the liver.
Therefore, this study aimed to investigate the compositional difference between egg yolk and liver metabolism from high-yield commercial egg-type hens of the Nongda III and the indigenous chicken breed of the Huainan Partridge chicken. The result of this experiment will provide new insight to explore the regulatory mechanism of yolk precursor formation and help guide the breeding of laying hens for optimal egg production.
2. Materials and Methods
2.1. Experimental Materials
Nongda III (commercial laying hens produce pink-colored eggs, CC group) and Huainan Partridge chickens (a Chinese indigenous breed, LC group) at their 40 weeks were selected based on their body weight (1550 ± 100 g) and raised under the same environmental conditions. Birds were housed in 33 × 35 cm laying cages individually with ad libitum access to water and feed under 8 D:16 Lx photoperiods. Nutrient levels during the feeding phase were in accordance with NRC standards. After one week of adaptation, eggs in one day from each breed were collected for quality and yolk fatty acid determination. The laying rate of the commercial Nongda III at 40 weeks of age was 90.6% and 61.2% in the Huainan Partridge chicken. Eight chickens were randomly selected from each group for slaughter and liver samples collection.
2.2. Determination of Egg Quality
After weighing the egg, the yolk weight was also recorded for the calculation of the yolk ratio. Yolk liquid was transferred into a centrifuge for fatty acid determination.
2.3. Yolk Fatty Acid Determination and Quantification
The composition and content of fatty acids were analyzed according to Walczak et al. [14], with appropriate modifications. About 1.0 g of yolk sac was weighed and placed into a centrifuge tube together with 0.66 mL internal standard of C11:0 (5 mg·L−1). The sample was added with 95% ethanol (0.66 mL) and pure water (1.33 mL) and then ground at 60 Hz for 2 min in a grinder (JX-48, Jinxing, Shanghai, China), and then transferred to a flask containing 33 mg of pyrogallol, 33 mg of zeolite, and 3.3 mL of hydrochloric acid (8.3 mol·L−1). After incubation at 75 °C for 40 min, the sample was mixed with 3 mL of 95% ethanol, 10 mL of ether and petroleum ether mixture (V:V = 1:1), and transferred to a separating funnel for standing for 5 min. The ether layer extract was collected into a flask and transferred to a rotary evaporator (RE-2002, Exceed, Shanghai, China) for evaporation till constant weight. The flask was added 1.6 mL of 2% NaOH-methanol solution and incubated in a water bath at 80 °C for 3 min, and then added 1.4 mL of 15% boron trifluoride methanol solution and incubated in a water bath at 80 °C for 3 min. The flask was cooled to room temperature and then mixed with 2 mL of n-heptane and 3 mL of saturated aqueous sodium chloride solution. After standing for 5 min, the upper layer of liquid was transferred to another tube and mixed with 0.6 g anhydrous sodium sulfate. Then, the supernatant was filtered through a 0.22 μm membrane and transferred into a GC injection vial for GC-MS analysis.
The separated fatty acid methyl ester (FAME) was applied to a DEGS capillary column (DB-WAX, 30 m × 0.25 mm × 0.25 mm, Agilent Technologies Inc., Santa Clara, CA, USA) and analyzed with a flame ionization detector by an Agilent 7980 N gas chromatography (Agilent Technologies, Santa Clara, USA). The initial temperature of the column oven was set at 60 °C for 2 min, followed by heating at 15 °C/min to 230 °C and held for 19 min. The injector and flame ionization detector was maintained at 240 °C, and the injection volume was 1 μL at a split ratio of 10:1. The carrier gas used was nitrogen at a flow rate of 0.8 mL/min.
Identification of FAME was performed by comparing the retention times to the FAME standards (CDAA-252795, Shanghai Anpu Experimental Technology Co., Ltd., Shanghai, China). The quantity of FAME was analyzed by using C11 as the internal standard according to the formula listed in Walczak et al. [14].
2.4. Identification of Differential Metabolites in the Liver
2.4.1. Liver Sample Preparation
A liver sample of 60 mg was accurately weighed and transferred into a 1.5 mL centrifuge tube containing 300 μL of methanol-water (V:V = 1:1, containing internal standards GCA-C13, CDCA-D4 and CA-D4) and two small pre-cooled steel balls. The mixed sample was ground for 2 min at 60 Hz in an automatic rapid grinding machine (Jingxin Industrial Development Co., Ltd., JXFSTPRP-24/32, Shanghai, China). The ground mixture was further added with 300 μL chloroform and ultrasonicated for 10 min under an ice bath and then stood for 20 min at −20 °C. After centrifugation at 13,000 rpm of 4 °C for 10 min, the lower chloroform layer was removed into a bottle. The upper layer was added with 300 μL of chloroform-ethanol (V:V = 2:1, containing 0.1 mM BHT), ultrasonicated, and centrifuged again to collect the lower layer into the original bottle. This collected solution was dried in a freeze-concentration centrifugal dryer (Huamei instrument, LNG-T98, Jiangsu, China) and then fully dissolved in 300 μL of isopropanol-methanol (V:V = 1:1). A mixed isotope internal standard of 20 μL was added as the internal standard. After being centrifuged at 13,000 rpm of 4 °C for 10 min, 150 μL of the supernatant was filtered through a 0.22 μm syringe and transferred into an injection vial for ultra-performance liquid chromatography-mass spectrometry (UPLC-MS) analysis.
2.4.2. UPLC-MS Analysis
The sample was eluted by a gradient elution program with mobile phase A of acetonitrile: water = (60:40, V:V), containing 0.1% FA and 10 mM NH4COOH, and mobile phase B of acetonitrile: isopropanol = (10:90, V:V), composed of 0.1% FA and 10 mM NH4COOH. Mobile phase B was 55% in the first 5 min, and 60% within 6–15 min, then increased to 70% for the next 13 min, 90% for 15 min, then 100% for 16 min. The sample was injected into an ACQUITY UPLC HSS T3 column (100 mm × 2.1 mm, 1.8 μm, Waters) and the injection volume was 5 μL with a flow rate of 0.35 mL/min and a column temperature of 55 °C.
Chromatographic conditions: ACQUITY UPLC HSS T3 column (100 mm × 2.1 mm, 1.8 μm, Waters Corporation, Milford, MA, USA); elution system consists of mobile phase A acetonitrile: water = (60:40, V:V), containing 0.1% FA and 10 mM NH4COOH, mobile phase B acetonitrile: isopropanol = (10:90, V:V), composed of 0.1% FA and 10 mM NH4COOH. The gradient elution program was as follows: 5 min, 55% B; 10 min, 60% B; 13 min, 70% B; 15 min, 90% B; 16 min, 100% B. The flow rate was 0.35 mL/min, the column temperature was 55 °C, and the injection volume was 5 μL. The mass spectrometry system was the Qtrap5500 mass spectrometry detection system (AB Sciex Company, Framingham, MA, USA) equipped with an electrospray (ESI) ion source and Analyst 1.7 workstation. The mass spectrometry analysis conditions were as follows: curtain gas of 40 psi; ion spray voltage of −4500/5500 V; source temperature at 400 °C; atomizing gas of 50 psi; and auxiliary heating gas of 55 psi. QC samples were injected with four samples analyzed during the whole analysis to provide a repeatable dataset.
2.4.3. Data Processing
The raw data from UPLC-MS analysis was processed by MRMPROBS, an open software for metabolomics data analysis released by Hiroshi Tsugawa’s team at the RIKEN Center for Sustainable Resource Science, for peak extraction, alignment, identification, and area calculation. The metabolites were quantitatively analyzed by the following formula: lipid content (ng/g) = A1/A2 × C × V/N, in which A1 is the peak area; A2 is the peak area of internal standard; C is the concentration of the internal standard (ng/mL); V is the constant volume (0.3 mL); and N is the weight of the sample (g).
2.5. Statistical Analysis
The differential metabolites were screened from the two groups by a combination of multivariate statistical analysis and univariate statistical analysis using the raw data being processed by peak extraction, calibration, integration, and normalization, and the Nongda III commercial laying hen was set as the control. The sample stability was analyzed by principal component analysis (PCA) using multivariate statistical analysis. Differential metabolites were screened by partial least squares analysis (PLS-DA), and orthogonal partial least squares analysis (OPLS-DA), which was validated by seven rounds of interactions and 200 response rankings test methods to examine the model quality and prevent model overfitting. Differential metabolites were subjected to KEGG pathway enrichment analysis. The egg quality comparison between the two groups was performed by Student’s T-test using SAS 9.3 software, and the data were expressed as mean ± standard error. The differential metabolites were analyzed by using GraphPad prism 8.0.
3. Results
3.1. Comparison of Egg and Yolk Weight between Commercial Laying Hens and Indigenous Chickens
The egg weight showed no significant difference between commercial laying hens and indigenous chicken breeds (Table 1). However, the yolk weight, yolk ratio, and yolk fat ratio of indigenous Huainan Partridge chickens were significantly higher that of the commercial laying hens (p < 0.05).

Table 1.
Comparison of yolk quality between indigenous chickens and commercial laying hens.
3.2. The Yolk Fatty Acid Composition of Commercial Laying Hens and Indigenous Chickens
These 11 fatty acids had been detected in the yolk of commercial laying hens and indigenous chickens (Table 2). Compared to the commercial laying hen, the contents of saturated fatty acids (SFA), including C8:0, C12:0, and C18:0, were higher, while the total SFA was lower in indigenous Huainan Partridge chickens. The contents of unsaturated fatty acids (UFA), including C18:1n9c, C18:2n6t, C20:4n6c and total UFA, were all higher in indigenous Huainan Partridge chickens as compared with the commercial laying hens.
Table 2.
The composition of yolk fatty acid in Huainan Partridge chicken and Nongda III.
3.3. Liver Differential Metabolite Analysis
3.3.1. Qualitative Analysis of Liver Metabolites
Liver tissue samples were analyzed by the UPLC-MS platform, and the obtained data were qualitatively analyzed by MRMPROBS software. A total of 693 metabolites were identified, of which 343 were in positive ion mode and 350 were in negative ion mode (Figure 1) as compared with the HMDB, lipid maps, and METLIN databases.
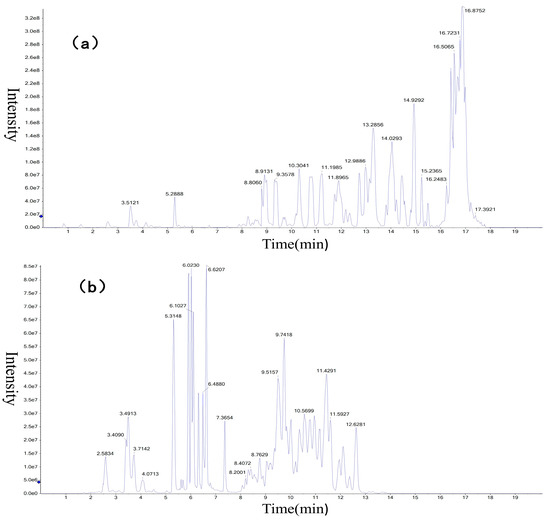
Figure 1.
Total ion chromatogram of liver metabolites in (a) ES(+) mode and (b) ES(−) mode. 8.0 e7 of the ordinate means 8 × 10⁷, the other numbers are the same.
3.3.2. Multivariate Analysis of Liver Metabolites
The system stability was analyzed by principal component analysis (PCA) and QC samples. The QC samples were closely clustered in the PCA model score plot, indicating that the instrument detection was stable and repeatable (Figure 2a).
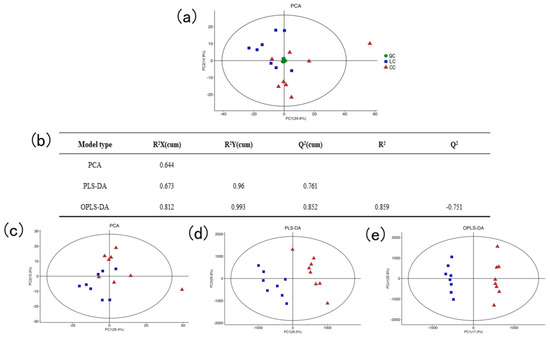
Figure 2.
Multivariate statistical analysis. (a) PCA score plot for the data from QC samples and all groups. (b) The parameter of the statistical model. (c) PCA score plot for the data in the LC group and CC group. (d) PLS-DA score plot for the data in the LC group and CC group. (e) OPLE-DA score plot for the data in the LC group and CC group.
The main parameter for determining the quality of the PCA model was R2X, and the R2X of PCA was 0.644, which was greater than 0.5, indicating the PCA model was reliable. Similarly, the value of R2X, R2Y, and Q2 of PLS-DA was close to 1, indicating the model could explain and predict the differences between the two samples. The value of Q2 of OPLS-DA was negative, suggesting that the model was not overfitting and had good predictability (Figure 2b). As shown in Figure 2c–e, the LC group and the CC group of the PCA, PLS-DA, and OPLS-DA models were completely separated, respectively, indicating there were large differences in liver metabolites between the two groups of samples. In addition, the metabolites were subjected to the VIP value of the OPLS model for the following analysis.
3.3.3. Analysis of Differential Metabolites
A total of 43 differential metabolites were screened by statistical analysis (Figure 3). The 43 differential metabolites had obvious hierarchical clustering between LC and CC groups (Figure 3a) according to the variable importance in the projection (VIP > 1). To obtain a clear overview of the changes in the differential metabolites, the 43 differential metabolites were further divided into 4 categories: glycerophospholipid metabolites, sphingolipid metabolites, fatty acids, and glyceride metabolites. Each category was divided into one or more types, including phosphatidic acid, phosphatidylcholine, phosphatidylethanolamine, phosphatidylinositol, phosphatidylserine, lysophosphatidylcholine, ceramide, dihydroceramide, sphingomyelin, diacylglycerol, triacylglycerol, and free fatty acid, which all exhibited a significant difference between the LC group and the CC group.
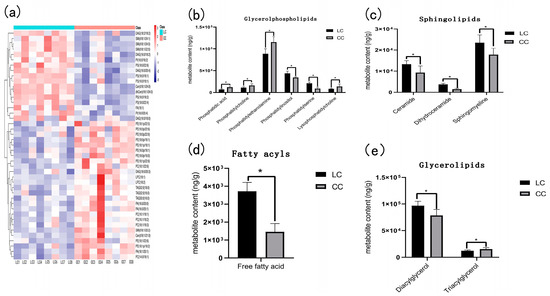
Figure 3.
Heatmap and statistical histogram of liver differential metabolites between Huainan Partridge chicken (LC) and Nongda III (CC). * represents the significant difference of p < 0.05. (a) Heatmap of liver differential metabolites between two groups. (b) The content of glycerol phospholipid metabolites in two groups. (c) Sphingolipids content of LC and CC groups. (d) Fatty acyls content of LC and CC groups. (e) The content of glycerolipids metabolites between two groups.
There were six metabolites categorized into glycerol phospholipid, in which phosphatidylinositol and phosphatidylserine were higher in the LC group, while phosphatidic acid, phosphatidylcholine, phosphatidylethanolamine, and lysophosphatidylcholine were lower in the LC group than those in the CC group (Figure 3b).
There were three metabolites: ceramides, dihydroceramide, and sphingomyelin, which belong to sphingolipid and all exhibited higher in the LC group as compared to the CC group (Figure 3c). Fatty acyls also exhibited higher enrichment in the LC group than in the CC group (Figure 3d).
In the glycerolipids, diacylglycerol had higher enrichment and triacylglycerol had lower enrichment in the LC group than in the CC group (Figure 3e).
3.3.4. Pathway Analysis of Differential Metabolites
Pathway enrichment analysis was performed by using the KEGG IDs of differential metabolites to obtain metabolic pathway enrichment (Figure 4). There were 16 KEGG pathways enriched. The main metabolites-enriched pathways were focused on lipid metabolisms, such as the adipokine signaling pathway, necroptosis, sphingolipid metabolism, glycerophospholipid, and linoleic acid metabolism. The second group of metabolites-enriched pathways was involved in signaling regulation pathways such as ErbB, MAPK, VEGF, and GnRH signaling pathways. The third group of metabolites-enriched pathways was related to others such as the apelin signaling pathway, adrenergic signaling, calcium signaling pathway, and c-type lectin receptor signaling pathway.
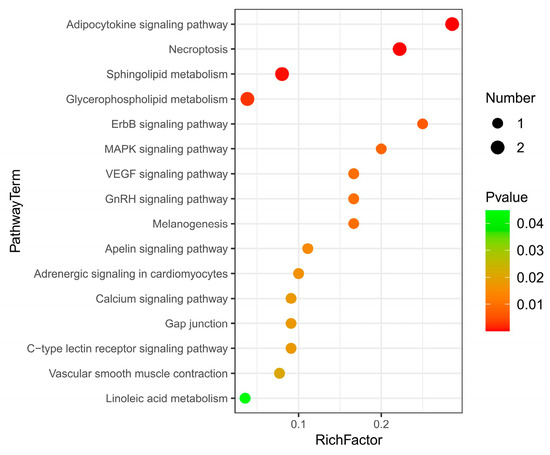
Figure 4.
KEGG pathway enrichment of liver differential metabolites between Huainan Partridge chicken (LC) and Nongda III (CC).
Except for phosphatidylcholine that enriched in glycerophospholipid metabolism and phosphatidylcholine that enriched in linoleic acid metabolism were significantly downregulated, other metabolites enriched in each pathway were all upregulated in the LC group (Table 3). Diacylglycerol (DAG) was enriched in 13 metabolic pathways, involving the adipocytokine signaling pathway, ErbB signaling pathway, MAPK signaling pathway, VEGF signaling pathway, etc. Ceramide (CER) was involved in 3 metabolic pathways, including the adipocytokine signaling pathway, necroptosis and sphingolipid metabolism. Sphingomyelin (SM) was involved in necroptosis and sphingolipid metabolism. Phosphatidylserine (PS) and phosphatidylcholine (PC) were involved in glycerophospholipid metabolism (Table 3).
Table 3.
Differential metabolites identified in liver from Huainan Partridge chicken and Nongda III.
4. Discussion
In layer breeding programs, egg production is an important selection indicator which has had noticeable progress in the genetic selection of commercial laying hens in recent decades. Compared with commercial laying hens, indigenous breeds have a relatively lower egg-laying rate [15]. The chicken breeds with lower egg-laying rate always have the higher levels of liver LDL-C and ovarian LDL-C [16], which might cause a larger amount of yolk precursor (mainly vitelline lipid) deposition in the yolk. As a result, indigenous chickens may have a higher yolk ratio and yolk fat content. Franco et al. found that the contents of fat, protein, and ash in eggs from Mos (a Spanish indigenous breed) were higher than that of Isa Brown [17]. Higher contents of fat and protein and lower content of water in egg yolk was also detected in the Chinese Hotan chicken compared with the Rhode Island Red [18]. Lordelo et al. [19] found that indigenous chickens had a higher proportion of egg yolk by comparing the egg quality of three kinds of indigenous breeds and commercial laying hens. In this research, higher yolk ratio and yolk fat of indigenous Huainan Partridge chickens were higher than that of commercial laying hens which performed a high egg-laying rate.
Yolk fatty acid composition could be largely affected by diet. It is demonstrated that egg yolk SFA and monounsaturated fatty acid (MUFA) concentration were determined by the dietary SFA, MUFA, and 18:2n-6 content [20]. While dietary supplementation with marigolds resulted in increased levels of C16:0 and C18:0 and decreased levels of C16:1 and C18:1 in the egg yolk [21]. However, egg quality, including yolk fatty acids, has been greatly changed after intensive selection of egg production and total egg weight. The content of total SFA, MUFA, and polyunsaturated fatty acids in egg yolk from indigenous chicken breeds was usually higher than those of commercial chickens [19]. Therefore, higher saturated fatty acids and lower unsaturated fatty acids were observed in the crossbred Nongda III commercial laying hens in this research.
Yolk lipids, synthesized by the liver, are mainly composed of triacylglycerol, phospholipid, and free cholesterol, in which triacylglycerol (65%) and phospholipid (32%) are the major components [22]. During laying, fat synthesis is particularly active in the liver of hens. Organisms have the highest and most diverse content of glycerophospholipids, and the various glycerophospholipids can transform mutually [23,24]. Among them, phosphatidylcholine (PC) and phosphatidylethanolamine (PE) could be synthesized through the classical CDP-DAG pathway, while PC, PE, and phosphatidylserine (PS) could be transformed into each other, and PC and PE could directly generate phosphatidic acid (PA) [25], which was the substrate for the formation of diglycerides and triglycerides and could contribute to the formation of lipid droplets [26,27]. A lower enrichment of PC and PE, and higher PS and PI in the liver of Chinese indigenous Huainan Partridge chickens suggested that PC and PE were mostly transformed to the PI and PS to meet more physiological and biochemical functions. In addition, the low enrichment of PC and PE in the liver of indigenous Huainan Partridge chickens and the high content of yolk fatty acids further indicated the transformation of glycerophospholipids metabolites in chickens during laying. Diacylglycerols (DAG) were widely involved in the signal transduction and functional regulation in cells and could form inositol phospholipids, which could cause the change of calcium ion concentration in intracellular, activate protein kinase C and modify many proteins and enzymes in the form of phosphorylation. The inositol phospholipids could be converted from phosphatidic acid under the action of phosphatidylinositol enzyme and promote VLDL assembly and transportation [28,29]. In this study, DAG was upregulated and enriched in multiple metabolic pathways in Huainan Partridge chickens suggesting that lipid synthesis is in high activity so as to cause a high yolk fat content.
It is suggested that indigenous chicken breeds maintain a higher ability of abdominal fat deposition at their late laying stage [30]. The adipocytokine metabolic pathway and the apelin signaling pathway are directly involved in the body’s fatty acid metabolism. Adipocytokines are a class of biologically active substances synthesized and secreted by adipose tissue to regulate body lipid metabolism [31]. Apelin, as an adipokine, was significantly upregulated in hyperinsulinemia and hyperglycemia mouse models [32]. The activated adipocytokine signaling pathway in the Huainan Partridge chicken indicated a stronger abdominal fat deposition and lower egg production performance. Sphingomyelin (SM) is a component of the cell membrane and participates in important life activities such as apoptosis, cell growth, and differentiation, etc. [33]. Under the catalytic reaction of sphingomyelinase, SM is hydrolyzed to ceramides [34], and the accumulated ceramides inhibit the activity of PKB and produce insulin resistance [35], which causes VLDL synthesis and excessive fat accumulation in the liver [36]. The upregulated sphingolipid metabolism would increase the production of ceramides in the Huainan Partridge chicken and might cause high lipid content in egg yolk.
Laying hens with a body weight of about 1.6 kg need 3 g/d fat from the diet, while the yolk fat content is about 6 g/egg [37]. Therefore, hens need to synthesize more fat to meet the requirement of yolk formation. Under the stimulation of estrogen [38], liver glucose is catalyzed to produce palmitate, which in turn produces long-chain fatty acids and unsaturated fatty acids. The fatty acids synthesized in the liver are subsequently combined with glycerol to form triglycerides and transported to each tissue [39]. A higher enrichment of free fatty acid in the Huainan Partridge chicken suggested its stronger lipid synthesis ability and caused higher yolk fat content.
5. Conclusions
Indigenous chickens have a high content of yolk fat which is regulated by the upregulated adipocytokine signaling pathway in the liver, which can promote the enrichment of diacylglycerol and ceramide.
Author Contributions
Data curation and writing—original draft, Q.J.; investigation, Q.J., P.C., Y.D. and Y.Z.; software and visualization, P.C. and Y.Z.; conceptualization, writing—review and editing, X.C. All authors have read and agreed to the published version of the manuscript.
Funding
This research was financially funded by the Key Technologies Research and Development Program of Anhui Province (202104f06020037).
Institutional Review Board Statement
All experimental procedures and sample collections were performed according to the regulations for the Administration of Affairs Concerning Experimental Animals of the State Council of the People’s Republic of China and the Institutional Animal Care and were approved by the Institutional Animal Care and Use Committee of the College of Animal Science and Technology, Anhui Agricultural University, Hefei, China. Approval number: SYDW-P20201225211.
Informed Consent Statement
Not applicable.
Data Availability Statement
The data presented in this study are available on request from the corresponding author.
Acknowledgments
We thank Zhang Xiaomin from the Hefei University of Technology, for helping us measure yolk fatty acid composition.
Conflicts of Interest
The authors confirm that there are no known conflicts of interest associated with this publication and there has been no significant financial support for this work that could have influenced its outcome.
References
- Bain, M.M.; Nys, Y.; Dunn, I.C. Increasing persistency in lay and stabilising egg quality in longer laying cycles. What are the challenges? Poult. Sci. 2016, 57, 330–338. [Google Scholar] [CrossRef]
- Berkhoff, J.; Alvarado-Gilis, C.; Keim, J.P.; Alcalde, J.A.; Vargas-Bello-Pérez, E.; Gandarillas, M. Consumer preferences and sensory characteristics of eggs from family farms. Poult. Sci. 2020, 99, 6239–6246. [Google Scholar] [CrossRef]
- Novak, C.; Scheideler, S.E. Long-term effects of feeding flaxseed-based diets. 1. Egg production parameters, components, and eggshell quality in two strains of laying hens. Poult. Sci. 2001, 80, 1480–1489. [Google Scholar] [CrossRef]
- Monira, K.N.; Salahuddin, M.; Miah, G. Effect of Breed and Holding Period on Egg Quality Characteristics of Chicken. Int. J. Poult. Sci. 2003, 2, 261–263. [Google Scholar]
- Abdul, R.; Salma, A.; Shamim, K.; Sohail, H.; Anjum Muhammad, A. A comparative study on quality, proximate composition and cholesterol content of eggs and meat in Fayoumi and commercial White Leghorn chickens. Cogent Food. Agric. 2016, 2, 273–280. [Google Scholar]
- Yu, R.; Chi, Y.; Ma, Y.; Chi, Y.; Wang, L. Differences in protein composition and functional properties of egg whites from four chicken varieties. Food. Biosci. 2022, 46, 101614. [Google Scholar] [CrossRef]
- González Ariza, A.; Arando Arbulu, A.; Navas González, F.J.; Delgado Bermejo, J.V.; Camacho Vallejo, M.E. Discriminant Canonical Analysis as a Validation Tool for Multivariety Native Breed Egg Commercial Quality Classification. Foods 2021, 10, 632. [Google Scholar] [CrossRef]
- Walzem, R.L.; Hansen, R.J.; Williams, D.L.; Hamilton, R.L. Estrogen induction of VLDLy assembly in egg-laying hens. J. Nutr. 1999, 129, 467S–472S. [Google Scholar] [CrossRef]
- Taghibiglou, C.; Carpentier, A.; Van Iderstine, S.C. Mechanisms of hepatic very low density lipoprotein overproduction in insulin resistance. J. Biol. Chem. 2000, 275, 8416–8425. [Google Scholar] [CrossRef]
- Lin, X.; Ma, Y.; Qian, T.; Yao, J.; Mi, Y.; Zhang, C. Basic fibroblast growth factor promotes prehierarchical follicle growth and yolk deposition in the chicken. Theriogenology 2019, 139, 90–97. [Google Scholar] [CrossRef]
- Zhang, J.; Geng, X.; Zhang, Y.; Zhao, X.; Zhang, P.; Sun, G. Interaction between Cecal Metabolites and Liver Lipid Metabolism Pathways During Induced Molting in Laying Hens. Front. Physiol. 2022, 13, 862721. [Google Scholar] [CrossRef]
- Zhu, W.; Liu, L.; Yang, W.; Wei, C.; Geng, Z.; Chen, X. Comparative Analysis of Metabolites in the Liver of Muscovy Ducks at Different Egg-Laying Stages Using Nontargeted Ultra-High-Performance Liquid Chromatography-Electrospray Mass Spectrometry-Based Metabolomics. J. Proteome Res. 2020, 19, 3846–3855. [Google Scholar] [CrossRef]
- Lu, L.; Chen, Y.; Wang, Z.; Li, X.; Chen, W.; Tao, Z. The goose genome sequence leads to insights into the evolution of waterfowl and susceptibility to fatty liver. Genome Biol. 2015, 16, 89. [Google Scholar] [CrossRef]
- Walczak, J.; Bocian, S.; Kowalkowski, T.; Trziszka, T.; Buszewski, B. Determination of Omega Fatty Acid Profiles in Egg Yolk by HILIC-LC-MS and GC-MS. Food Anal. Methods 2017, 10, 1264–1272. [Google Scholar] [CrossRef]
- Ma, Z.; Jiang, K.; Wang, D.; Wang, Z.; Gu, Z.; Li, G. Comparative analysis of hypothalamus transcriptome between laying hens with different egg-laying rates. Poult. Sci. 2021, 100, 101110. [Google Scholar] [CrossRef]
- Wu, H.; Li, H.; Hou, Y.; Huang, L.; Hu, J.; Lu, Y.; Liu, X. Differences in egg yolk precursor formation of Guangxi Ma chickens with dissimilar laying rate at the same or various ages. Theriogenology 2022, 184, 13–25. [Google Scholar] [CrossRef]
- Franco, D.; Rois, D.; Arias, A.; Justo, J.R.; Marti-Quijal, F.J.; Khubber, S. Effect of Breed and Diet Type on the Freshness and Quality of the Eggs: A Comparison between Mos (Indigenous Galician Breed) and Isa Brown Hens. Foods 2020, 9, 342. [Google Scholar] [CrossRef]
- Zhang, R.; Deng, J.; Li, X.; Shang, W.; Ning, Z. Research Note: Comparison of the texture, structure, and composition of eggs from local Chinese chickens and a highly selected line of egg-type chickens and analysis of the effects of lipids on texture. Poult. Sci. 2022, 101, 101934. [Google Scholar] [CrossRef]
- Lordelo, M.; Cid, J.; Cordovil, C.M.D.S.; Alves, S.P.; Bessa, R.J.B.; Carolino, I. A comparison between the quality of eggs from indigenous chicken breeds and that from commercial layers. Poult. Sci. 2020, 99, 1768–1776. [Google Scholar] [CrossRef]
- Poureslami, R.; Raes, K.; Huyghebaert, G.; Batal, A.B.; De Smet, S. Egg yolk fatty acid profile in relation to dietary fatty acid concentrations. J. Sci. Food. Agric. 2012, 92, 366–372. [Google Scholar] [CrossRef]
- Altuntaş, A.; Aydin, R. Fatty acid composition of egg yolk from chickens fed a diet including marigold (Tagetes erecta L.). J. Lipids 2014, 2014, 564851. [Google Scholar] [CrossRef]
- Sunwoo, H.H.; Gujral, N. Chemical Composition of Eggs and Egg Products. In Handbook of Food Chemistry; Cheung, P., Mehta, B., Eds.; Springer: Berlin/Heidelberg, Germany, 2015; pp. 331–362. [Google Scholar]
- Han, X. Lipidomics for studying metabolism. Nat. Rev. Endocrinol. 2016, 12, 668–679. [Google Scholar] [CrossRef]
- Liu, L.; Daniel, L.E.W.; Terry, J.R.; Bao, J.; Graham, J.K. Phospholipids in rice: Significance in grain quality and health benefits: A review. Food Chem. 2013, 139, 1–4. [Google Scholar] [CrossRef]
- Carman, G.M.; Han, G.S. Regulation of phospholipid synthesis in yeast. J. Lipid Res. 2009, 50, 69–73. [Google Scholar] [CrossRef]
- Asp, L.; Claesson, C.; Boren, J.; Olofsson, S.O. ADP-ribosylation factor 1 and its activation of phospholipase D are important for the assembly of very low density lipoproteins. J. Biol. Chem. 2000, 275, 26285–26292. [Google Scholar] [CrossRef]
- Athenstaedt, K.; Daum, G. Phosphatidic acid, a key intermediate in lipid metabolism. Eur. J. Biochem. 1999, 266, 1–16. [Google Scholar] [CrossRef]
- Williamson, J.R.; Cooper, R.H.; Joseph, S.K.; Thomas, A.P. Inositol trisphosphate and diacylglycerol as intracellular second messengers in liver. Am. J. Physiol. 1985, 248, 203–216. [Google Scholar] [CrossRef]
- Dunlop, M.E.; Larkins, R.G. Effects of phosphatidic acid on islet cell phosphoinositide hydrolysis, Ca2+, and adenylate cyclase. Diabetes 1989, 38, 1187–1192. [Google Scholar] [CrossRef]
- Na, W.; Yu, J.; Xu, Z.; Zhang, X.; Yang, L.; Cao, Z. Important candidate genes for abdominal fat content identified by linkage disequilibrium and fixation index information. Poult. Sci. 2019, 98, 581–589. [Google Scholar] [CrossRef]
- Lehr, S.; Hartwig, S.; Sell, H. Adipokines: A treasure trove for the discovery of biomarkers for metabolic disorders. Proteomics Clin. Appl. 2012, 6, 91–101. [Google Scholar] [CrossRef]
- Boucher, J.; Masri, B.; Daviaud, D. Apelin, a newly identified adipokine up-regulated by insulin and obesity. Endocrinology 2005, 146, 1764–1771. [Google Scholar] [CrossRef] [PubMed]
- Slotte, J.P. Biological functions of sphingomyelins. Prog. Lipid Res. 2013, 52, 424–437. [Google Scholar] [CrossRef] [PubMed]
- Simon, J.; Ouro, A.; Ala-Ibanibo, L.; Presa, N.; Delgado, T.C.; Martínez-Chantar, M.L. Sphingolipids in Non-Alcoholic Fatty Liver Disease and Hepatocellular Carcinoma: Ceramide Turnover. Int. J. Mol. Sci. 2019, 21, 40. [Google Scholar] [CrossRef] [PubMed]
- Guebre-Egziabher, F.; Alix, P.M.; Koppe, L. Ectopic lipid accumulation: A potential cause for metabolic disturbances and a contributor to the alteration of kidney function. Biochimie 2013, 95, 1971–1979. [Google Scholar] [CrossRef]
- Sokolowska, E.; Blachnio-Zabielska, A. The Role of Ceramides in Insulin Resistance. Front. Endocrinol. 2019, 10, 577. [Google Scholar] [CrossRef]
- Griminger, P. Lipid Metabolism. In Avian Physiology; Sturkie, P.D., Ed.; Springer: New York, NY, USA, 1986; pp. 345–358. [Google Scholar]
- Li, H.; Wang, T.; Xu, C.; Wang, D.; Ren, J.; Li, Y. Transcriptome profile of liver at different physiological stages reveals potential mode for lipid metabolism in laying hens. BMC Genom. 2015, 16, 763. [Google Scholar] [CrossRef] [PubMed]
- Jensen-Urstad, A.P.; Semenkovich, C.F. Fatty acid synthase and liver triglyceride metabolism: Housekeeper or messenger? Biochim. Biophys. Acta Mol. Cell Biol. Lipids 2012, 1821, 747–753. [Google Scholar] [CrossRef]


Disclaimer/Publisher’s Note: The statements, opinions and data contained in all publications are solely those of the individual author(s) and contributor(s) and not of MDPI and/or the editor(s). MDPI and/or the editor(s) disclaim responsibility for any injury to people or property resulting from any ideas, methods, instructions or products referred to in the content. |
© 2023 by the authors. Licensee MDPI, Basel, Switzerland. This article is an open access article distributed under the terms and conditions of the Creative Commons Attribution (CC BY) license (https://creativecommons.org/licenses/by/4.0/).